
Analysis of Cooling Characteristics of Permanent Magnet Synchronous Motor with Different Water Jacket Design Using Electromagnetic–Thermal Fluid Coupled Analysis and Design of Experiment

 ,
,
Abstract
:1. Introduction
2. Electrical Loss Calculations with Electromagnetic Finite Element Analysis
3. Electromagnetic–Thermal Fluid Coupled FE Model of PMSM
4. Analysis of Cooling Performance of Water Jacket with Design of Experiment (DOE)
4.1. Effect of the Number of Water Jacket Passes
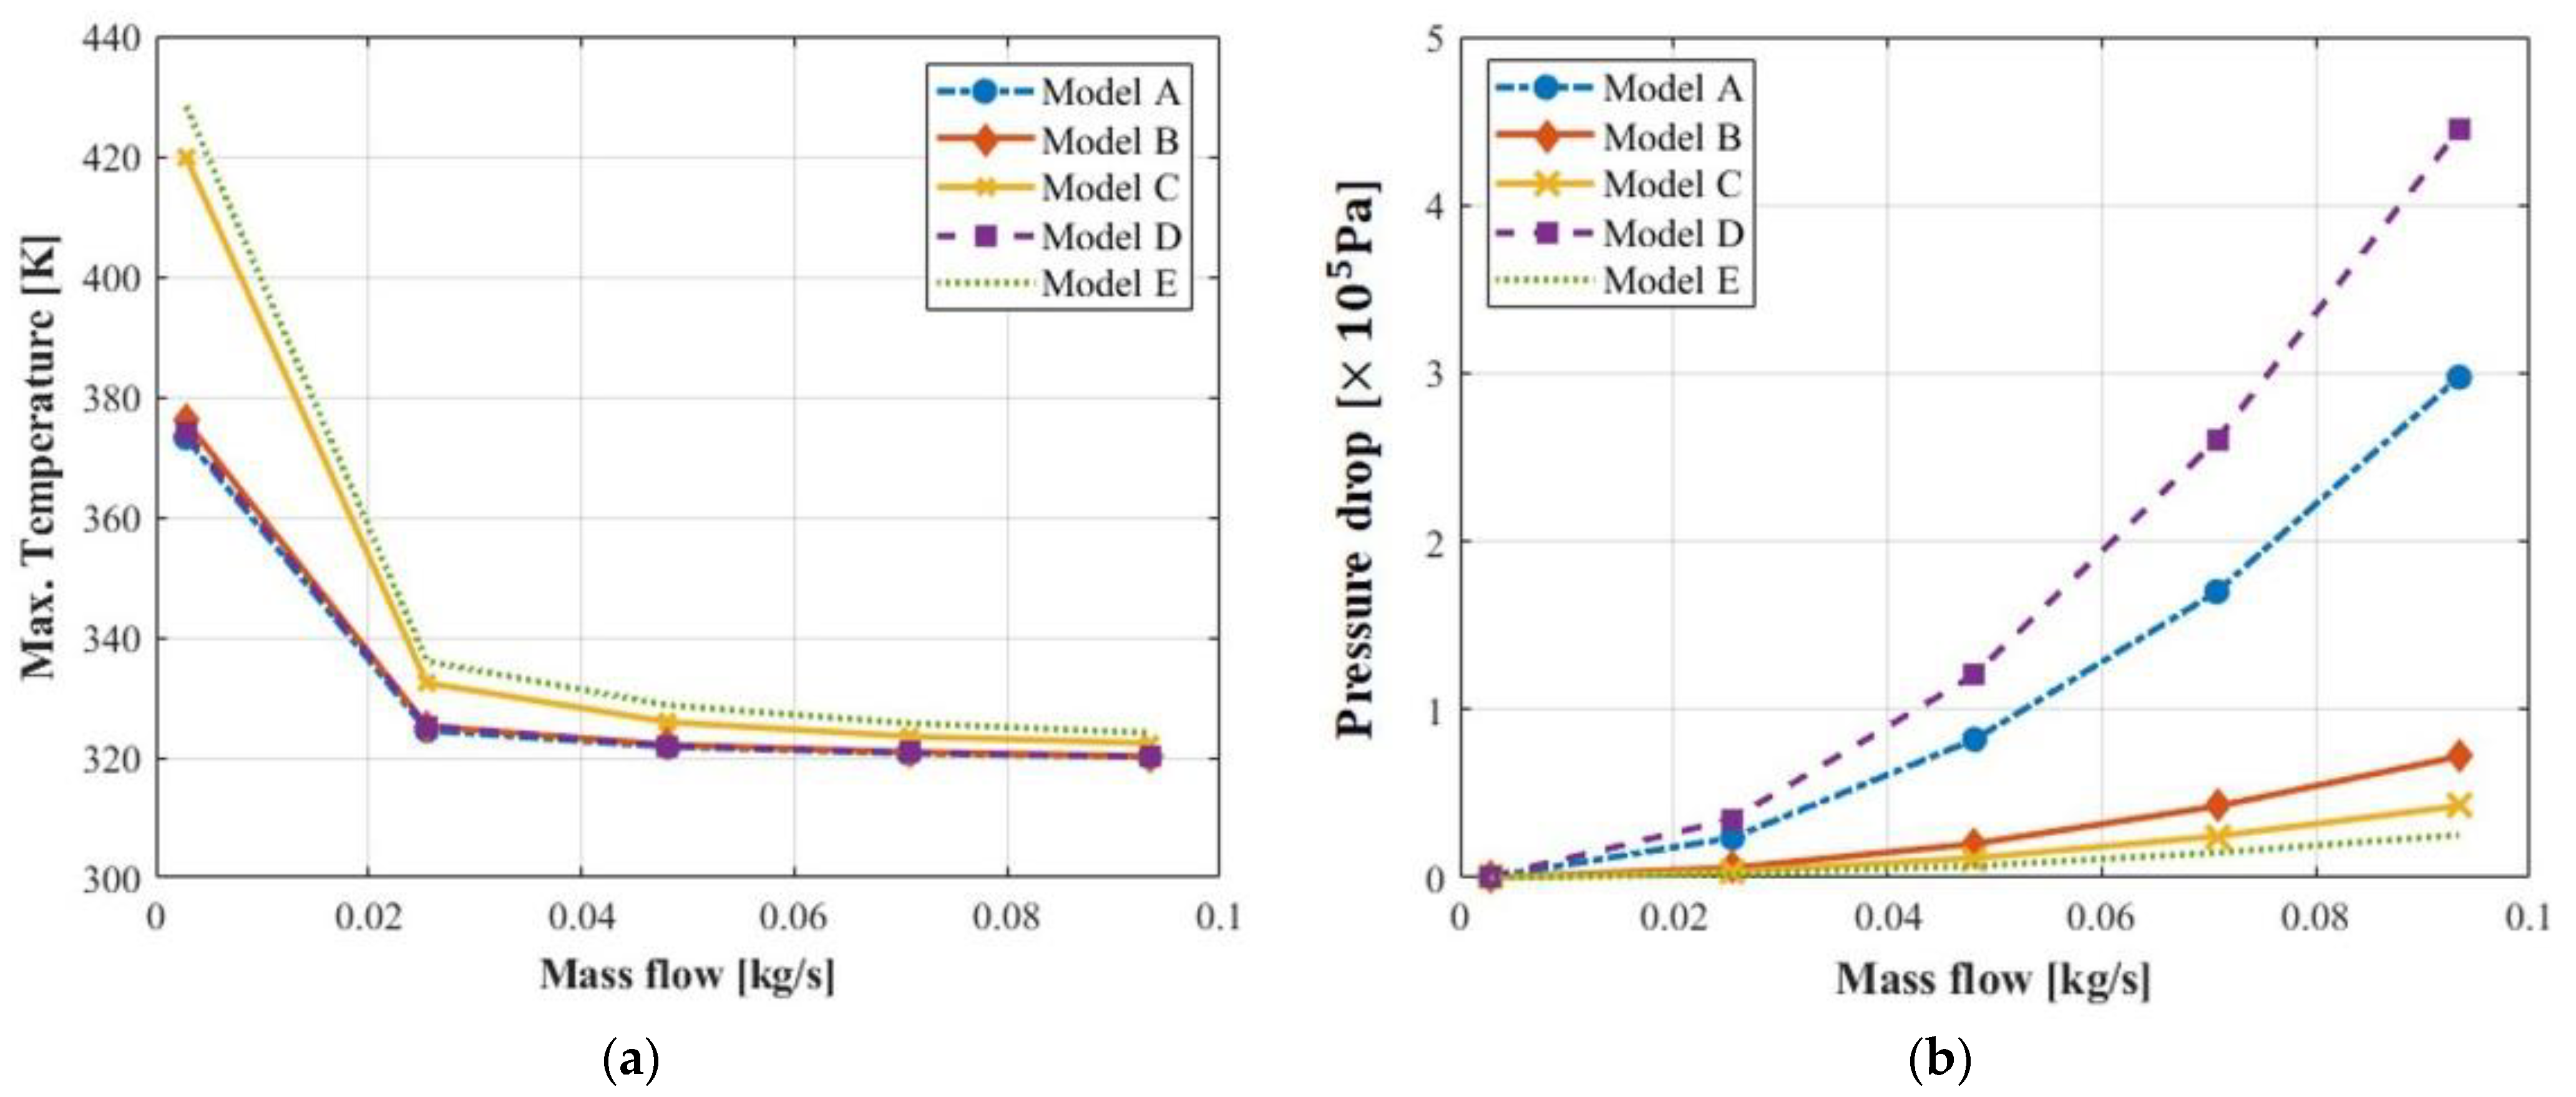
4.2. Effect of Mass Flow Rate on Cooling Performance
4.3. Effect of the Location and Number of Inlets/Outlets on Cooling Performance
4.4. ANOVA (Analysis of Variance) for Temperature Difference and Pressure Drop
5. Conclusions
Author Contributions
Funding
Data Availability Statement
Conflicts of Interest
Nomenclature
| Maximum magnetic flux density (T) | |
| Power supply frequency (Hz) | |
| Current density | |
| Electronic conductivity (S/m) | |
| Hysteresis constant | |
| Experimental constant | |
| Copper loss density | |
| Eddy-current loss density | |
| Hysteresis loss density | |
| Iron loss density | |
| Thickness of the conductor (m) | |
| Specific resistance of the winding |
References
- Borisavljevic, A.; Polinder, H.; Ferreira, J.A. On the Speed Limits of Permanent-Magnet Machines. IEEE Trans. Ind. Electron. 2010, 57, 220–227. [Google Scholar]
- Aldo, B.; Enrico, C.; Marco, C.; Silvio, V. Stator-Winding Thermal Models for Short-Time Thermal Transients Definition and Validation. IEEE Trans. Ind. Electron. 2016, 63, 2713–2721. [Google Scholar]
- Kim, K.C.; Kim, K.S.; Kim, H.J.; Lee, J. Demagnetization analysis of permanent magnets according to rotor types of interior permanent magnet synchronous motor. IEEE Trans. Magn. 2009, 45, 2799–2802. [Google Scholar]
- Jiang, W.; Jahns, T.M. Coupled Electromagnetic–Thermal Analysis of Electric Machines Including Transient Operation Based on Finite-Element Techniques. IEEE Trans. Ind. Appl. 2015, 51, 1880–1889. [Google Scholar] [CrossRef]
- Aldo, B.; Enrico, C.; Marco, C.; Mircea, P.; Dave, S.; Silvio, V. Equivalent thermal conductivity determination of winding insulation system by fast experimental approach. In Proceedings of the 2015 IEEE International Conference on Electric Machines and Drives (IEMDC), Coeur d’Alene, ID, USA, 10–13 May 2015. [Google Scholar]
- Li, W.; Cao, J.; Zhang, X. Electrothermal Analysis of Induction Motor with Compound Cage Rotor Used for PHEV. IEEE Trans. Ind. Electron. 2010, 57, 660–668. [Google Scholar]
- Mi, C.; Gordon, R.S.; Richard, B. Modeling of Iron Losses of Permanent-Magnet Synchronous Motors. IEEE Trans. Ind. Appl. 2003, 39, 734–742. [Google Scholar]
- Inamura, S.; Sakai, T.; Sawa, K. A Temperature Rise Analysis of Switched Reluctance Motor Due to the Core and Copper Loss by FEM. IEEE Trans. Magn. 2003, 39, 1554–1557. [Google Scholar] [CrossRef]
- Chen, W.; Ju, Y.; Yan, D.; Guo, L.; Geng, Q.; Shi, T. Design and optimization of dual-cycled cooling structure for fully-enclosed permanent magnet motor. Appl. Therm. Eng. 2019, 152, 338–349. [Google Scholar] [CrossRef]
- Marco, C.; Gloria, G.; Stefano, P.; Enrico, S. Thermal management of a Formula E electric motor Analysis and optimization. Appl. Therm. Eng. 2019, 157, 113733. [Google Scholar]
- Lim, S.H.; Min, S.J.; Hong, J.P. Optimal Rotor Design of IPM Motor for Improving Torque Performance Considering Thermal Demagnetization of Magnet. IEEE Trans. Magn. 2015, 51, 8202405. [Google Scholar] [CrossRef]
- Rajinder; Sreejeth, M.; Singh, M. Sensitivity Analysis of Induction Motor Performance Variables. In Proceedings of the 2016 IEEE 1st International Conference on Power Electronics, Intelligent Control and Energy Systems, Delhi, India, 4–6 June 2016. [Google Scholar] [CrossRef]
- Zhang, B.; Qu, R.; Fan, X.; Wang, J. Thermal and Mechanical Optimization of Water Jacket of Permanent Magnet Synchronous Machines for EV Application. In Proceedings of the 2015 IEEE International Electric Machines & Drives Conference, Coeur d’Alene, ID, USA, 10–13 May 2015. [Google Scholar]
- Ye, Z.N.; Luo, W.D.; Zhang, W.M.; Feng, Z.X. Simulative Analysis of Traction Motor Cooling System Based on CFD. In Proceedings of the 2011 International Conference on Electric Information and Control Engineering, Wuhan, China, 15–17 April 2011. [Google Scholar]
- Lee, K.H.; Cha, H.R.; Kim, Y.B. Development of an interior permanent motor through rotor cooling for electric vehicles. Appl. Therm. Eng. 2016, 95, 348–356. [Google Scholar] [CrossRef]
- Liang, P.; Chai, F.; Shen, K.; Liu, W. Thermal design and optimization of a water-cooling permanent magnet synchronous in-wheel motor. In Proceedings of the 2019 22nd International Conference on Electrical Machines and Systems, Nanchang, China, 20–22 June 2011. [Google Scholar] [CrossRef]
- Altair Flux 2018 User Guide. Available online: https://2022.help.altair.com (accessed on 31 May 2023).
- Shervin, S.S.; Richard, M.; John, W.; Denise, R.; Katherine, S. An Electric Motor Thermal Bus Cooling System for Vehicle Propulsion—Design and Test. SAE Int. J. Adv. Curr. Prac. Mobil. 2020, 2, 1–8. [Google Scholar]
- Montgomery, D.C. Design and Analysis of Experiments, 7th ed.; John Wiley & Sons, Inc.: Hoboken, NJ, USA, 2009. [Google Scholar]
- PIAnO 2019 Help. Available online: http://www.pidotech.com/reference/reference01.php?ptype=view&idx=388&page=1&code=reference01_silver (accessed on 29 April 2023).


| Specification | Quantity |
|---|---|
| Type of permanent magnet | Surface mount |
| Stator outer diameter | 120 mm |
| Number of poles | 4 |
| Number of slots | 24 |
| Max. current | 41 A |
| Rated voltage | 48 V |
| Rated speed | 2000 rpm |
| Rated power | 1500 W |
| Part (Material) | Residual Flux Density (T) | Permeability | Resistivity () | Thermal Conductivity () |
|---|---|---|---|---|
| Winding (copper) | 1 | 372.1 | ||
| Magnet (N35SH) | 1.2 | 1.05 | 8.9 | |
| Shaft (steel) | 30 | 72.1 | ||
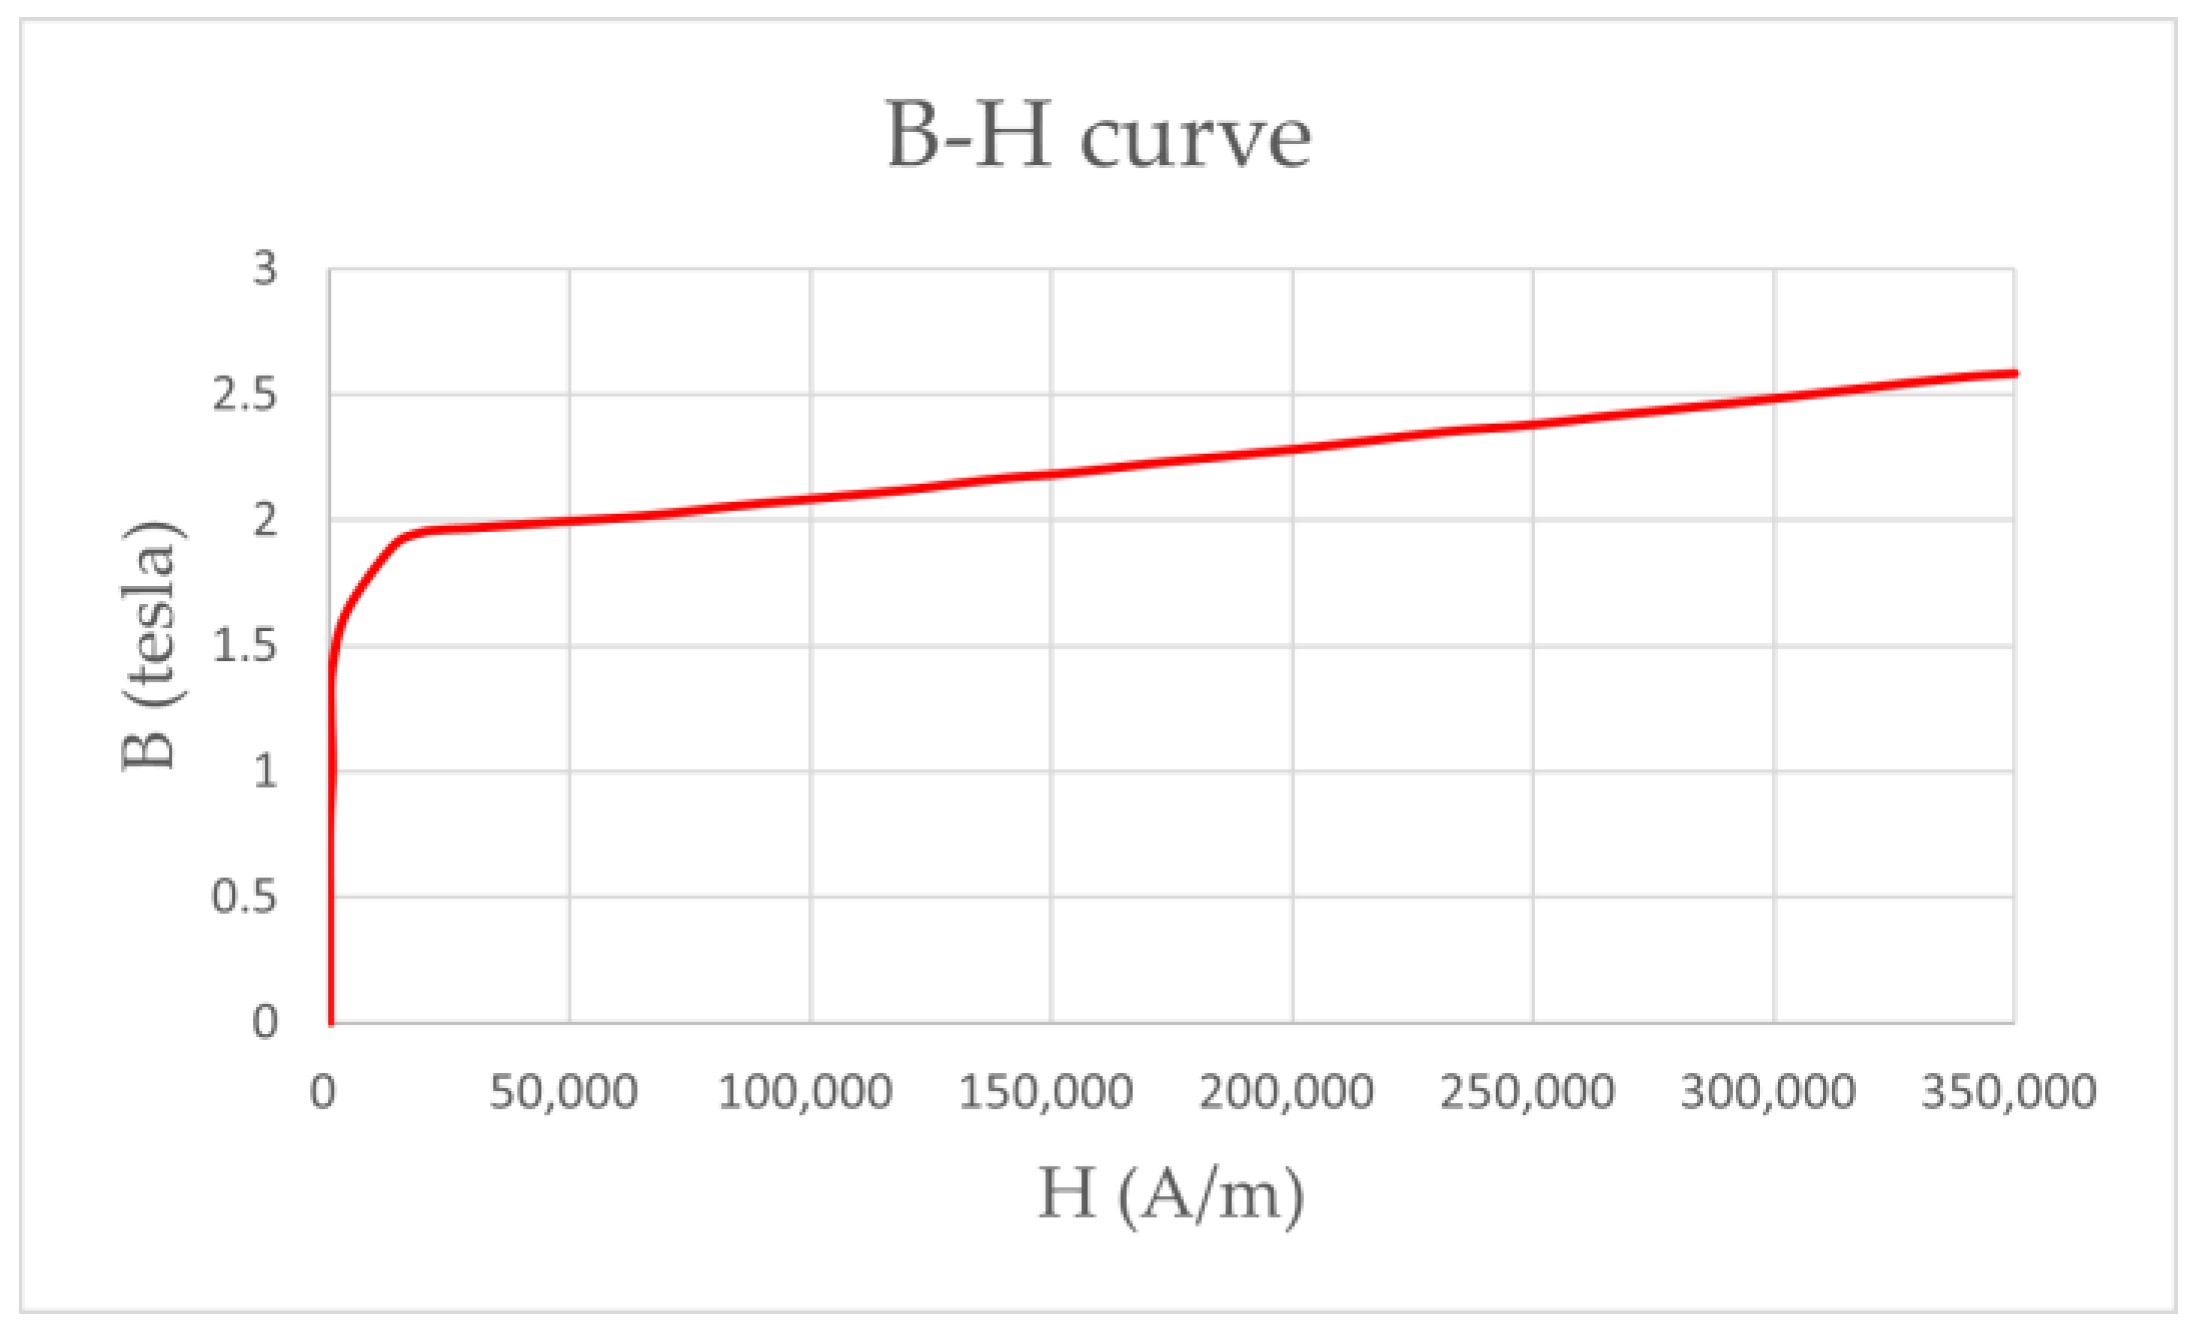
| Rotor core Stator core (silicon) | B–H curve (Figure 3) | 83.7 |
| Copper | 850 W |
| Hysteresis | 51.5 W |
| Eddy current | 6.26 W |
| Case | Number of Passes | Inlet/Outlet Design | Mass Flow (kg/s) |
|---|---|---|---|
| 1 | 6 | Model A | 0.00283 |
| 2 | 0.02547 | ||
| 3 | 0.04811 | ||
| 4 | 0.07075 | ||
| 5 | 0.09339 | ||
| 6 | Model B | 0.00283 | |
| 7 | 0.02547 | ||
| 8 | 0.04811 | ||
| 9 | 0.07075 | ||
| 10 | 0.09339 | ||
| 11 | Model C | 0.00283 | |
| 12 | 0.02547 | ||
| 13 | 0.04811 | ||
| 14 | 0.07075 | ||
| 15 | 0.09339 | ||
| 16 | Model D | 0.00283 | |
| 17 | 0.02547 | ||
| 18 | 0.04811 | ||
| 19 | 0.07075 | ||
| 20 | 0.09339 | ||
| 21 | Model E | 0.00283 | |
| 22 | 0.02547 | ||
| 23 | 0.04811 | ||
| 24 | 0.07075 | ||
| 25 | 0.09339 |
Disclaimer/Publisher’s Note: The statements, opinions and data contained in all publications are solely those of the individual author(s) and contributor(s) and not of MDPI and/or the editor(s). MDPI and/or the editor(s) disclaim responsibility for any injury to people or property resulting from any ideas, methods, instructions or products referred to in the content. |
© 2023 by the authors. Licensee MDPI, Basel, Switzerland. This article is an open access article distributed under the terms and conditions of the Creative Commons Attribution (CC BY) license (https://creativecommons.org/licenses/by/4.0/).
Share and Cite
Jeon, K.; Park, M.; Park, J.; Choi, H.; Lee, K.-D.; Lee, J.-J.; Kim, C.-W. Analysis of Cooling Characteristics of Permanent Magnet Synchronous Motor with Different Water Jacket Design Using Electromagnetic–Thermal Fluid Coupled Analysis and Design of Experiment. Machines 2023, 11, 903. https://doi.org/10.3390/machines11090903
Jeon K, Park M, Park J, Choi H, Lee K-D, Lee J-J, Kim C-W. Analysis of Cooling Characteristics of Permanent Magnet Synchronous Motor with Different Water Jacket Design Using Electromagnetic–Thermal Fluid Coupled Analysis and Design of Experiment. Machines. 2023; 11(9):903. https://doi.org/10.3390/machines11090903
Chicago/Turabian StyleJeon, Kyunghun, Myungwoo Park, Jongjin Park, Hongjun Choi, Ki-Deok Lee, Jeong-Jong Lee, and Chang-Wan Kim. 2023. "Analysis of Cooling Characteristics of Permanent Magnet Synchronous Motor with Different Water Jacket Design Using Electromagnetic–Thermal Fluid Coupled Analysis and Design of Experiment" Machines 11, no. 9: 903. https://doi.org/10.3390/machines11090903