1. Introduction
This study presents a machine allowing the creation of a point cloud using a laser scanner in continuous motion with respect to the observed target. Although the work has many potential applications, we developed a method for the reconstruction of the geometry under the bridge deck for the identification of local defects. In this field, 3D laser scanners are used to model the surface of civil structures [
1,
2,
3,
4], but the necessity of high density point cloud often leads to overlap static scans obtained with different scanner positions. When the structure to be monitored is a bridge, there are several limitations that preclude using multiple static scans [
5,
6]. Under the bridge deck is often not accessible and the inspection is performed by skilled operators using special trucks. Since many existing highway bridges were built in the 1960s [
5], and given that the surveys are extremely expensive [
7], the inspection automation is the focal point of several studies [
4,
5,
6,
7,
8,
9,
10,
11,
12].
1.1. Bridge Inspection Techniques
The general methods for the automatic survey of structures [
8] cannot be used under the bridge deck and fit-to-purpose methods are often used. Metallic bridges can be monitored using non-destructive techniques [
9], while concrete bridges are mainly monitored using visual analyses, given the difficulty of creating inspection systems capable of detecting defects of a few millimeters on constructions of hundreds of meters. One of the most promising techniques is the analysis of images as proposed by Yu et al. [
4], but great limitations derive from the difficulty in associating the exact position with each image and with the amount of work required to achieve 3D information using photogrammetry. In this field, Jiang et al. reviewed the close-range photogrammetry applications in bridge measurements [
13]; early applications used special cameras and targets to align the different images. Nowadays, computerized analytical tools allow reliable image alignment to be obtained with minimal effort. However, despite different works [
14,
15,
16] focused on the methods for managing the images, these methods provide geometrical information about the bridge that are less accurate than those obtained with laser scanners [
17]. Image methods were also used to measure the vertical bridge deflection [
12,
18], but these techniques can be used only to detect defects resulting in big changes of structural parameters.
1.2. Limitations of the Existing Techniques and Proposed Approach
Literature studies show that a laser scanner located on the ground can be used, together with image processing, for assessing the presence of cracks on concrete bridges [
2]. However, as evidenced by the studies, this solution is possible only if the scanning head is close enough to the deck in order to obtain a decent point cloud resolution. This practically precludes detecting cracks with commercial laser scanners if the height of the bridge is greater than 20–30 m. The only possible way of obtaining a point cloud with a high resolution is mounting a laser scanner on a moving cart. With this technique, the reconstruction of the point cloud is based on the knowledge of the scanner position and orientation: different from any other system commercially available, in this method the point cloud is created by knowing the instantaneous position of the laser and the instantaneous distance of each measured point on the surface from the scanning head. In other words, the point cloud is not created by overlapping static scans, but is rather created with proprietary algorithms that require the instantaneous position of the scanning head. Given the typical dimension of highway bridges, it is not possible to stop the truck and to perform several static scans. Consequently, both the truck and the scanning head are continuously moving: the mathematical formulation of the problem and the preliminary experimental results were presented in references [
5,
6,
7,
19]. Numerical analyses described in reference [
19] showed that the poor quality of the point cloud was mainly due to the non-linear terms in the rotation matrices used to identify the position of the cart with respect to the bridge (the linearization-induced errors on the point cloud accuracy were close to 20 mm). Results also showed that a small error in the identification of the scanning head tilt leads to large errors in the point cloud. In order to increase the accuracy in the reconstruction, we focused on the methods for the identification of the position of vehicles moving on bounded trajectories.
1.3. Identification of the Laser Position
In the literature, the objects’ egomotion has been measured with different approaches [
20,
21,
22,
23,
24,
25] and the technique that grew more rapidly is the Visual Odometry (VO) [
20], the process in which the motion of a vehicle (or subject) is detected starting from the images acquired by a single or multiple cameras. The estimation of a vehicle’s motion from images was pioneered by Moravec in the 1980s [
25] and the term VO was introduced in 2004 by Nister thanks to the similarity to wheel odometry, which incrementally estimates the motion of a vehicle by integrating a wheel rotation [
20,
24]. As outlined by Scaramuzza and Fraundorfer in their review on VO [
24], the technique is effective only if there is sufficient illumination in the environment and the static scene has enough features to allow the identification of the relative motion; the framerate must be large enough to allow the images to overlap. VO can provide relative position error ranging from 0.1 to 2%. This capability makes VO an interesting alternative to the conventionally used techniques (global positioning system, inertial measurement units, and laser odometry). The early VO studies were motivated by the NASA Mars exploration program to measure the rovers’ motion and, in general, this technique is the preferred choice in environments where the global positioning system is not available or does not provide for the required accuracy. Also, the other techniques used for the localization of objects had several limitations. GPS cannot be used because of the limited accuracy and because of the poor signal quality on the surface immediately below the bridge deck. Inertial Measurement Units were the baseline solution at the beginning of the project, but the long measurement duration induced relevant drift problems. Vision-based measurement systems, such as pattern matching techniques to track the position of the cart using fixed cameras or trinocular stereoscopic systems using markers were viable solutions, but the worsening accuracy of 3D reconstruction at the increasing distances evidenced in tests performed in controlled conditions [
26] was not acceptable for our application. Simultaneous Localization and Mapping (SLAM) techniques focusing on the cart position on the walkway were difficult to implement because the relative motion between the cart, the walkway, the truck frame, and the bridge implies that different parts of the images are moving in different directions.
In this work, we describe the system used to identify the relative position of the cart transporting the 3D laser scanner with respect to the origin of the by-bridge walkway. The cart position measurement system described in this paper uses laser distance meters and cameras to identify the relative position between the cart and the walkway. The measurement method is described in
Section 2. Experimental results are presented in
Section 3 and discussed in
Section 4. The conclusions of the paper are drawn in
Section 5.
2. Method
The position of the scanning head can be identified applying roto-translations, starting from the position of the truck:
where
R01 and
T01 are respectively the rotation matrix (3 × 3) and the translation vector (3 × 1) which describe the position of a reference system with respect to the previous one. The rotation matrix
R cannot be linearized for small angles and the rotations are as follows:
The system that measures the cart position with respect to the walkway is set up with:
a laser distance meter and two laser pointers located at the beginning of the by-bridge walkway;
a camera on the cart which observes the three spots on the projection plane;
two cameras on the cart observing sideward and downwards; and
an encoder for the closed-loop control of the cart motor.
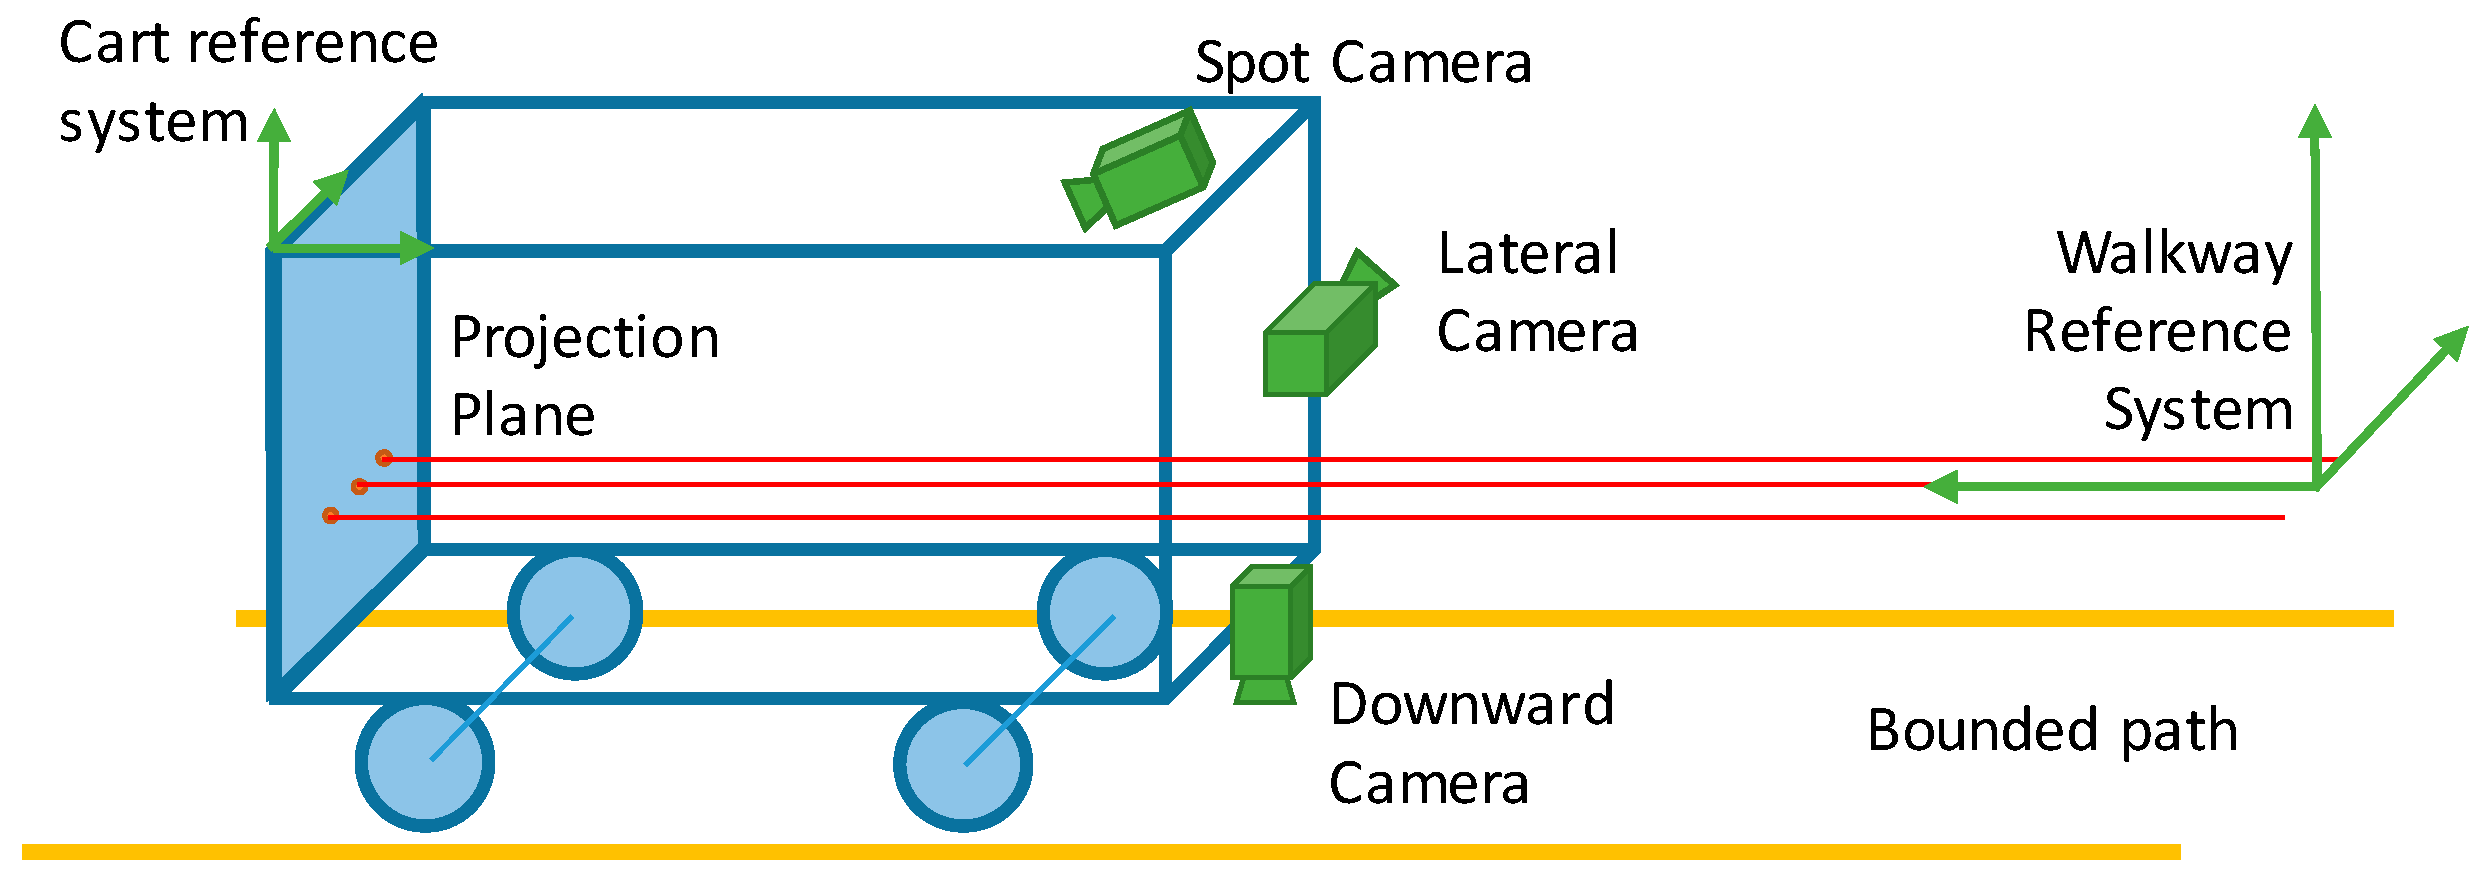
The scheme of the measurement chain is shown in
Figure 1; the three laser beams generate three spots on the projection plane; the central one is the laser distance meter, while the other two are used as optical rails. The three lasers are aligned with the cart motion direction, so that the displacement of the three points on the projection plane is limited. The downward and the lateral cameras observe respectively a metering tape fixed to the walkway and the walkway handrail.
With the proposed setup, the cart position is identified as follows:
the fore-and-aft motion is determined by the laser range finder located at the beginning of the walkway;
the lateral and vertical motion of the cart are measured by the spot camera, which identifies the translation from the position of the central spot;
the cart roll is measured by the spot camera, observing the rotation of the two external laser spots;
the cart pitch and yaw are measured respectively by the lateral and the vertical cameras, observing linear objects parallel to the cart motion.
In the actual method implementation, there is no data fusion between the information of the different measurement systems: the lateral camera, for instance, can also be used to identify the vertical cart displacement but, at this initial stage, we decided to keep the method as simple as possible. As in any vision system, the quality of the image is crucial for obtaining reliable measurements. In our case, the biggest problem is probably related to the large variation of lighting and viewing conditions of the scene, since the cameras may be exposed to direct sunlight at the beginning and at the end of the bridge, while below the bridge the lighting condition may be very poor.
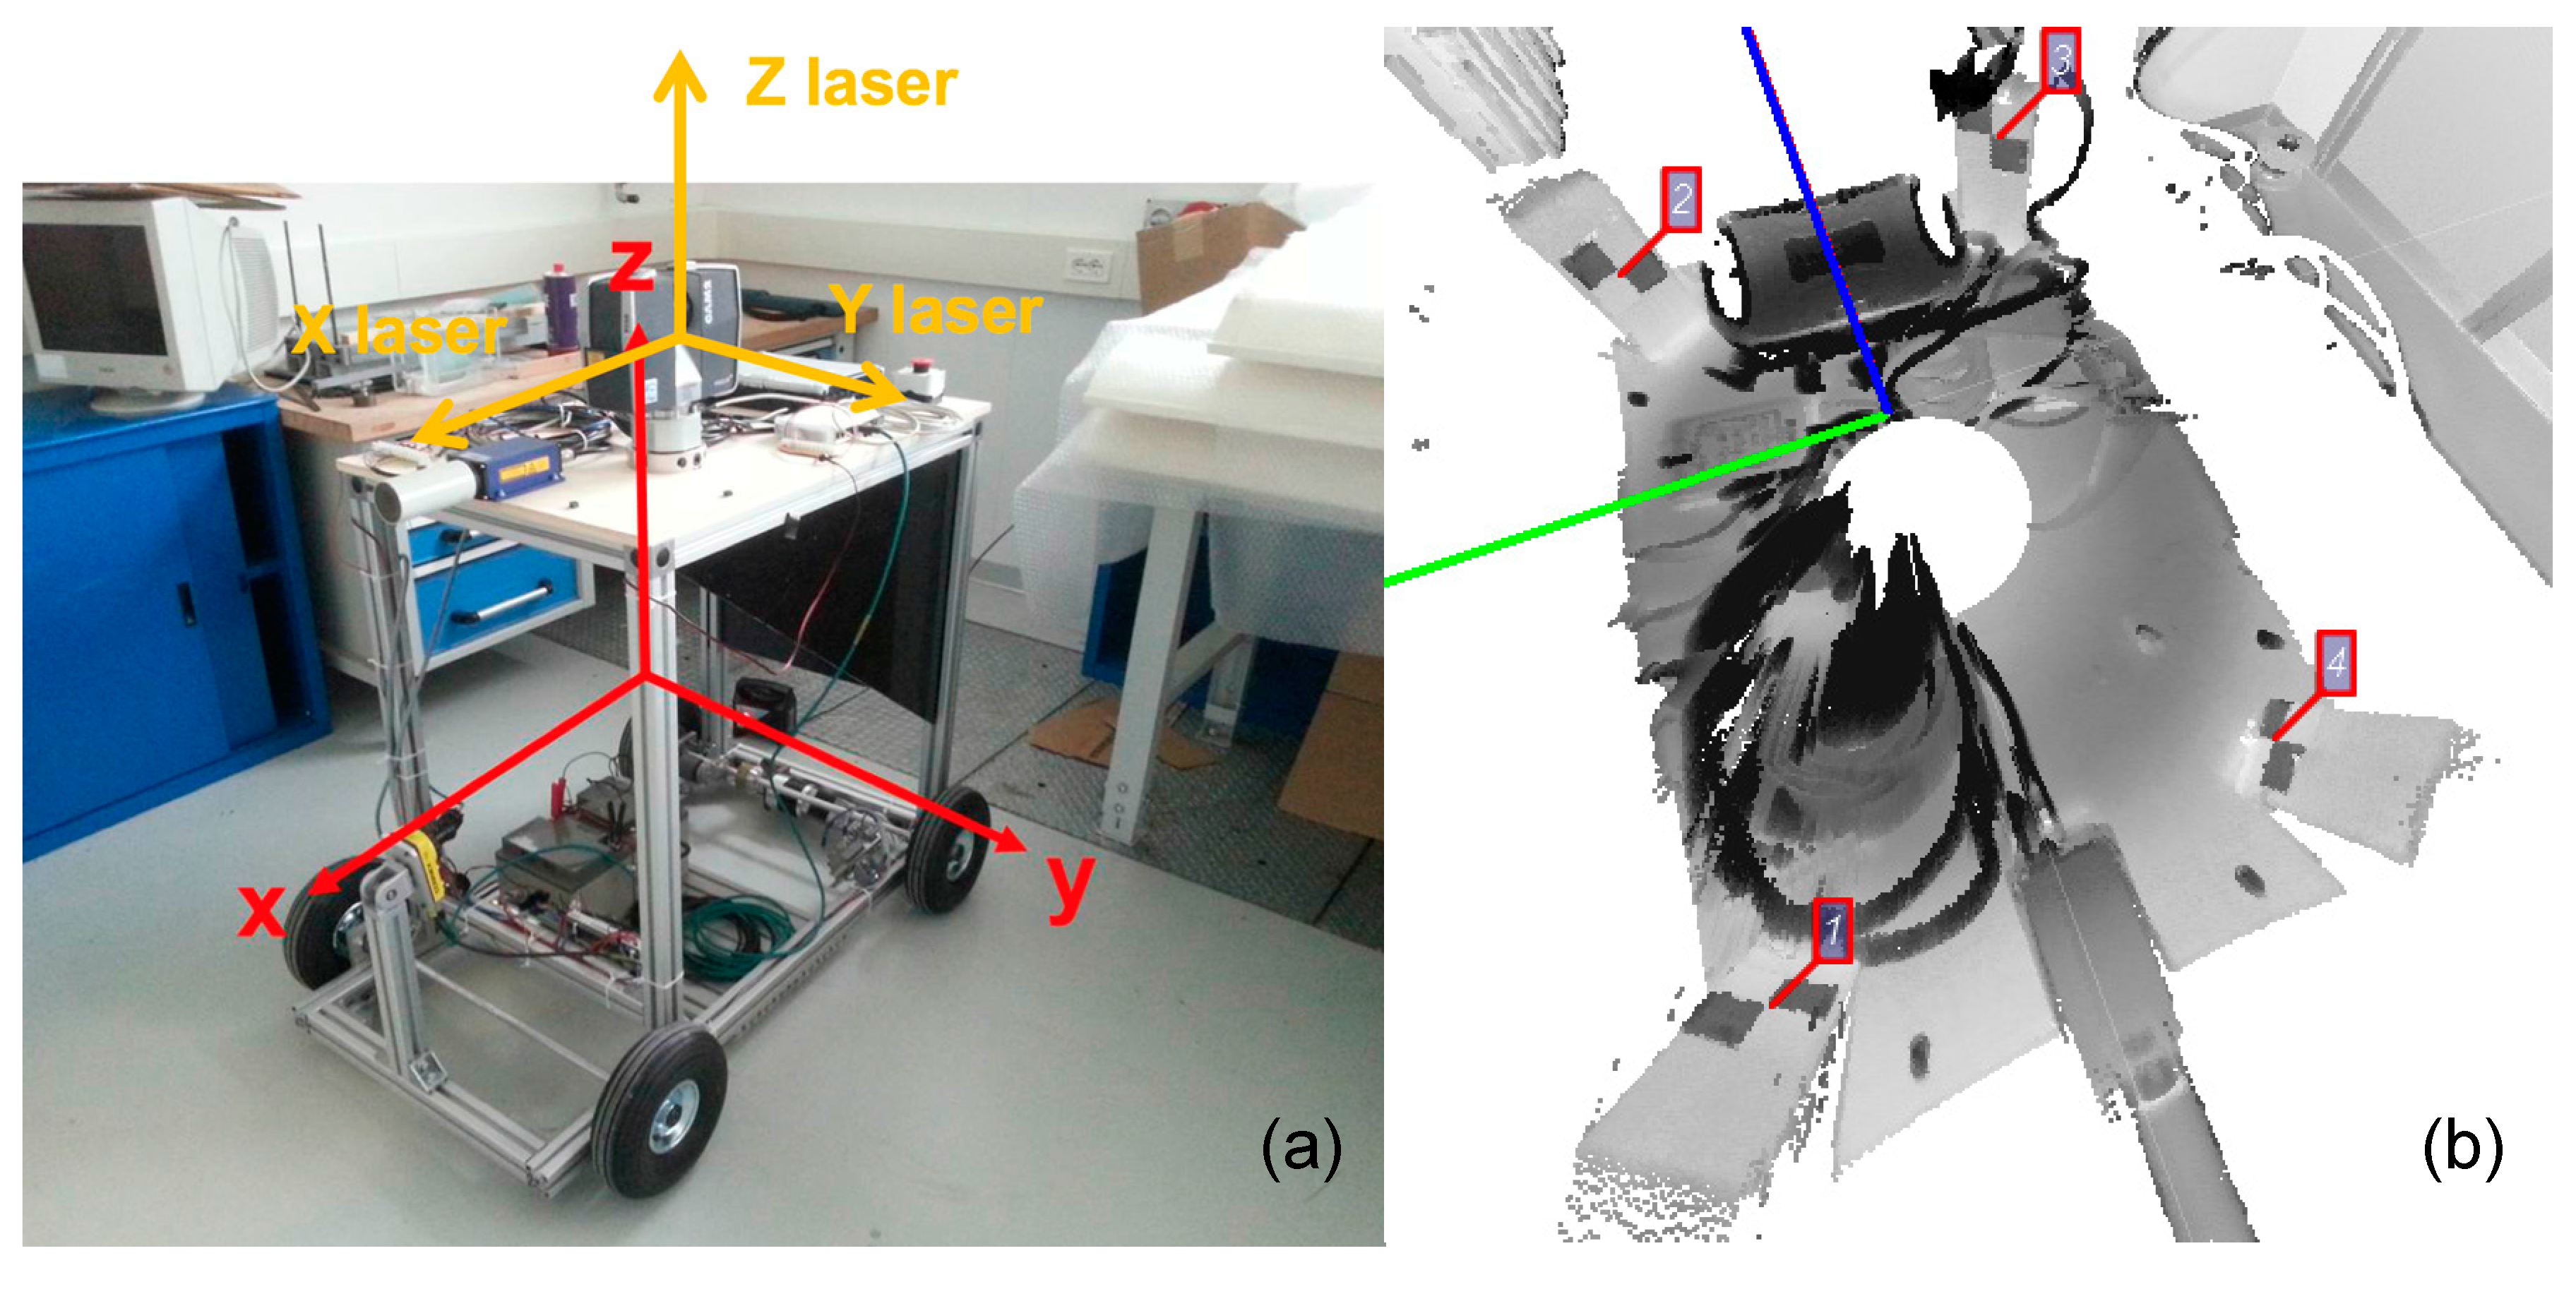
The phase-shift laser scanner is positioned above the cart. The laser scanner can work in spherical mode and helical mode. In the first mode, the laser scanner acquires the 3D coordinates of the visible points around the scanner head in a field of view of 310° (vertical) × 360° (horizontal). In the second mode, the horizontal axe is fixed, and the laser can acquire 310° vertical sections; the combination of the cart movement and the scanner vertical rotation guarantees a 3D acquisition. The density of the cloud depends on the speeds of the cart, of the track and of the rotation speed of the scanning head. To use the scanner in helical mode, given the cart trajectory, the relative position between the cart and laser scanner head must be determined; a boresight technique was used for this purpose. Four targets detectable from the laser scanner were positioned jointly liable with the cart. The following paragraphs describe the measurement subsystems and the actions taken to obtain reliable measurements.
2.1. Experimental Setup
The three cameras used for the identification of the cart roll, pitch and yaw are manufactured by IDS (uEye UI-5240CP-M-GC); the image resolution is 1280 × 1024 pixels and the maximum frame rate is 25 Hz. A LabVIEW-based software running on an embedded PC captures the images, that are analyzed offline in order to tune the algorithms in case of non-standard lighting conditions.
2.1.1. Laser Pointers and Camera
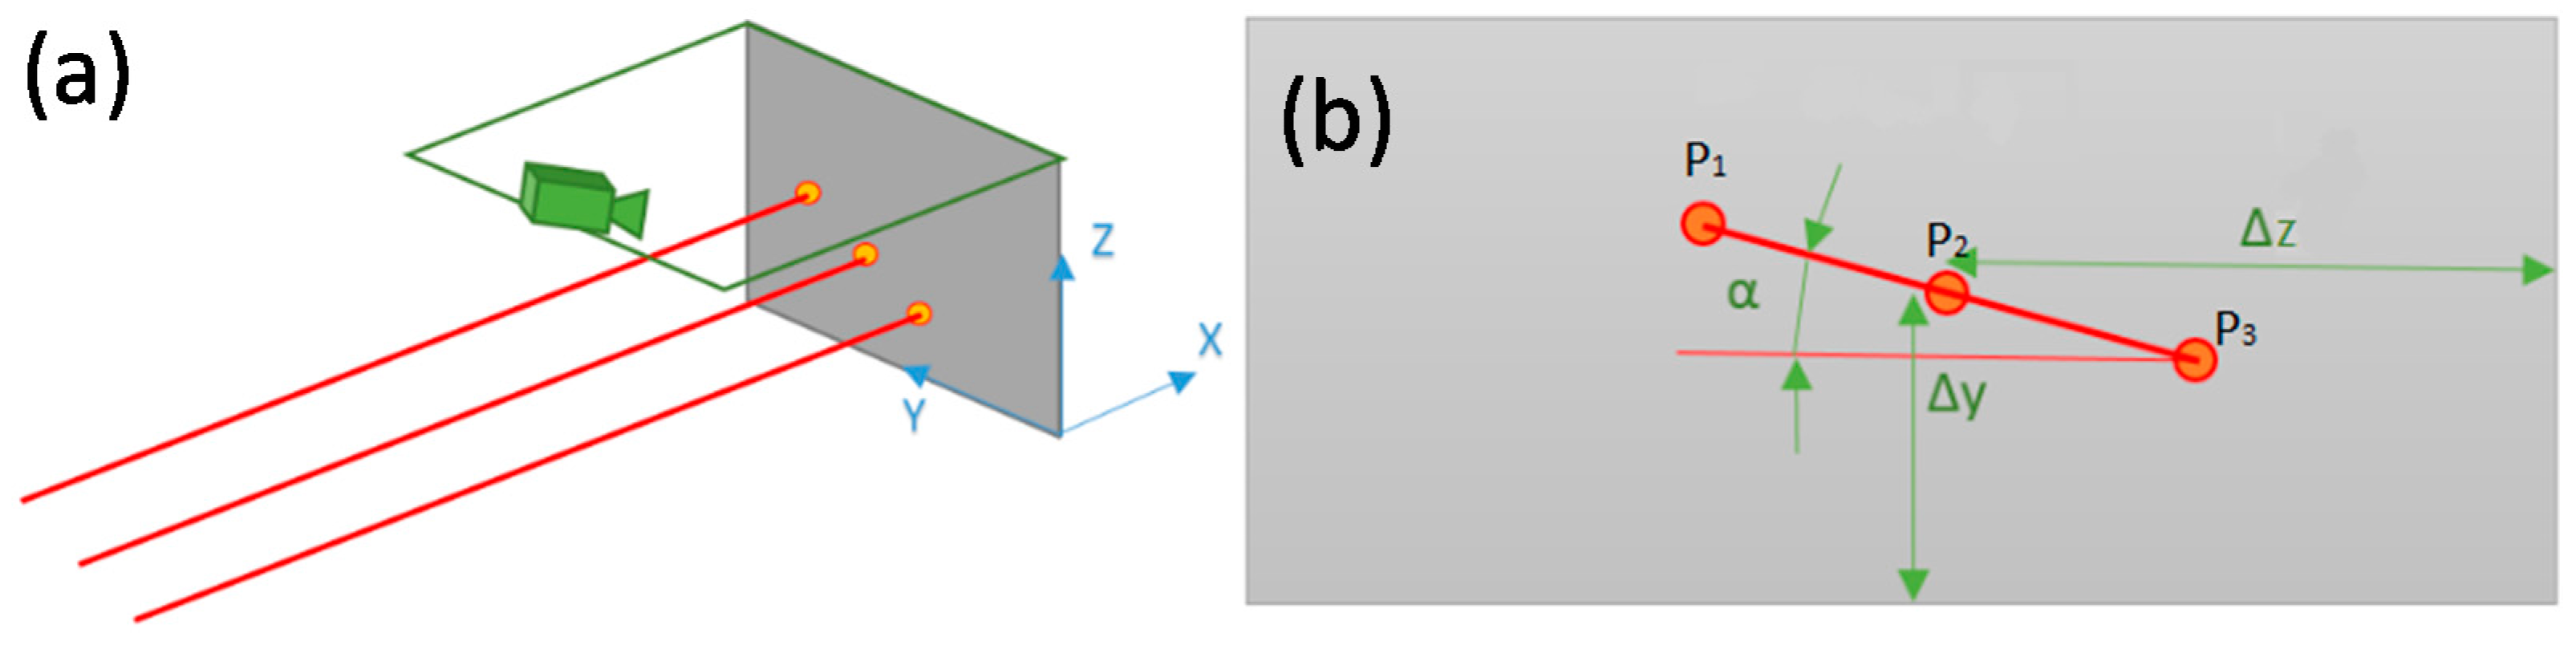
The cart position along the
X axis (direction of motion, almost perpendicular to the projection plane) is detected by the laser range finder (FAE LS121 FA, range 100 m, resolution 0.1 mm). The cart lateral and vertical motions (
Y and
Z axes in
Figure 2a), as well as the cart roll are measured by analyzing the image captured by the camera. The translations are measured by the position of the central spot and the two external spots are used to identify the cart roll. The scheme of the measurement setup is shown in
Figure 2.
Since the camera sensor is not parallel to the observation plane, the system was calibrated by observing a grid with known geometry (diameter 6 mm, grid pitch 25 mm), so that the result of the measurement is an array of spot coordinates in physical units. In order to obtain good images independently from the sunlight conditions, the camera deputed to observe the 3 spots has a bandpass filter from 635 to 646 nm, given that the three lasers have a wavelength of 639 nm (red color). The alignment between the three lasers strongly affects the measurement accuracy and consequently we developed a fit-to-purpose calibration procedure (described in
Section 2.2).
The coordinates of the three laser spots are identified using the blob detection algorithm, based on a classical image thresholding paired by a blob analysis. The threshold level was set to 30 (8-bit grayscale image) and the lookup region of interest (ROI) is rearranged dynamically, since between one acquisition and another the movement should not exceed 30 pixels. This value corresponds to a displacement lower than 15 mm in 40 ms; the value was obtained with experiments performed by fixing an accelerometer on the cart and analyzing the maximum velocity. This procedure allowed a reduction of the image processing time, which is in the order of a few milliseconds per frame.
2.1.2. Lateral and Vertical Camera
The vertical camera observed a roller meter below the cart; also in this case, the camera was equipped with an infrared lighting system and an infrared filter. The camera was calibrated acquiring a calibration grid, in order to measure the displacements and the rotations in physical coordinates. The position of the roller meter was coincident with the walkway axis (maximum error smaller than 2 mm); a scheme of the measurement method is shown in
Figure 3.
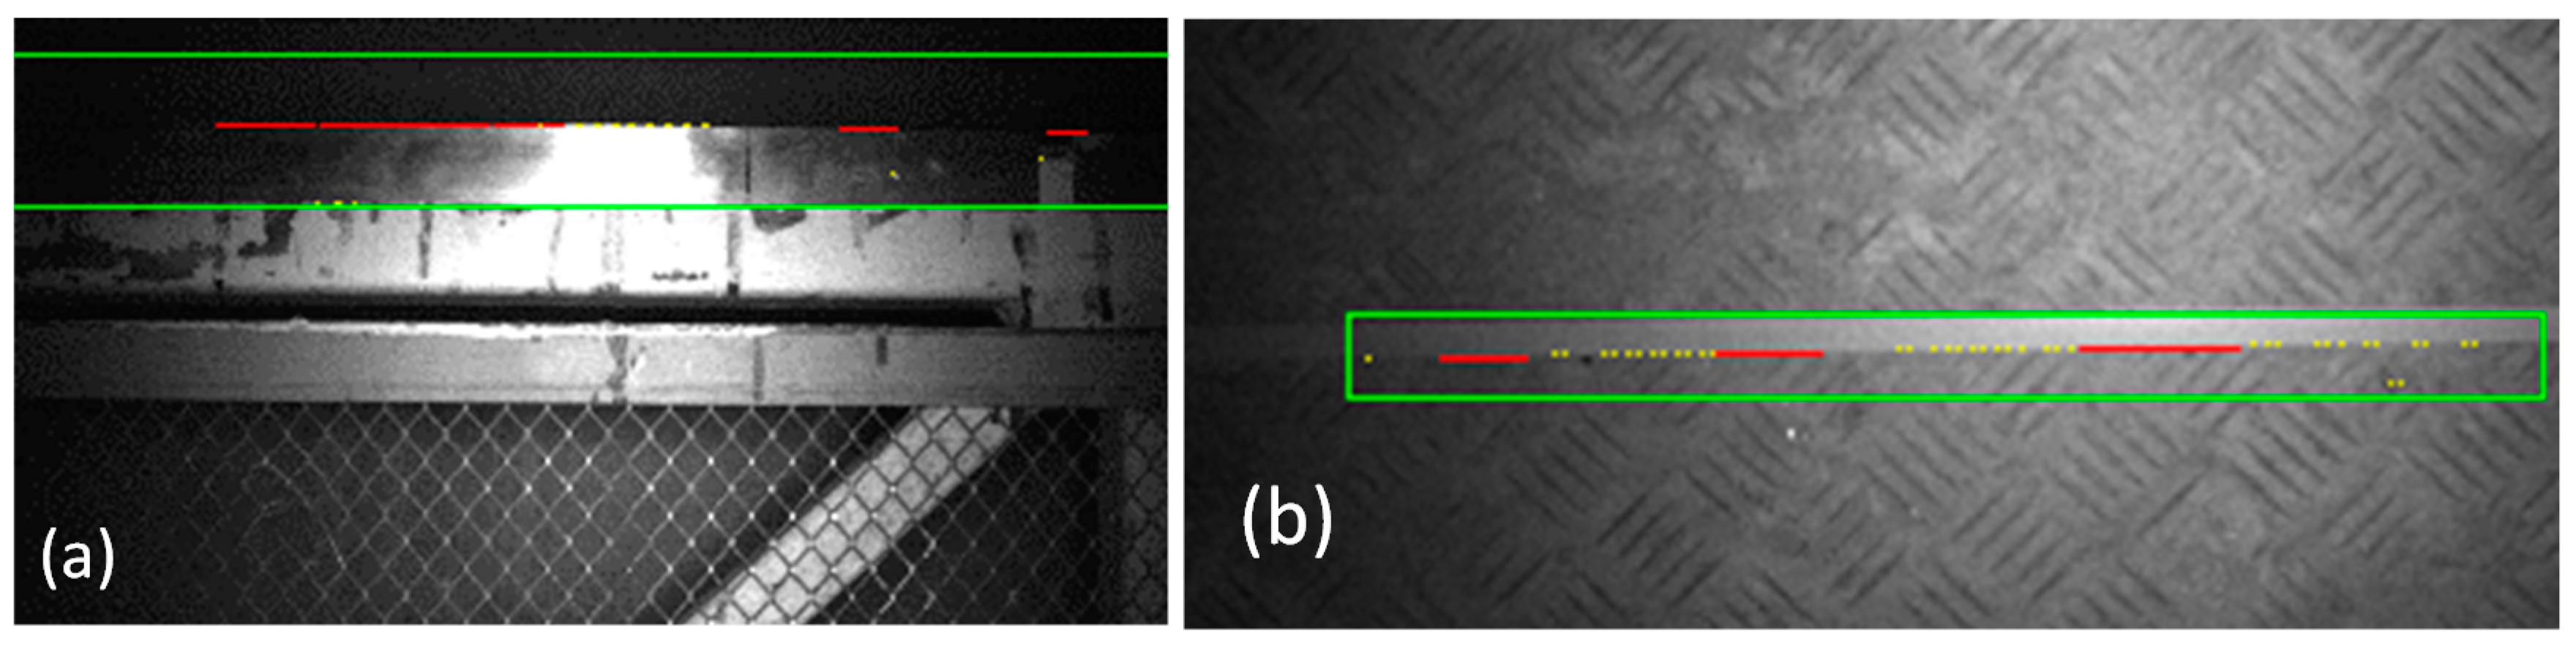
The yaw angle is measured by a custom edge detection algorithm: the grayscale levels image is divided into columns (5 pixels wide). Data of each column is processed using a moving average performed on a 15 × 5 pixels window. All the points in which the grey-scale level variation is larger than 10 are used for the edge detection; the cart yaw angle is measured by fitting the points in the least square sense. The slope is bounded between ±5° and the region of interest for the calculation of the threshold is limited to 20 rows above or below the one computed at the previous step; these values were chosen after the analysis of the maximum yaw in operative conditions. With this approach, the image processing time is approximately 15 ms.
A similar system has been used also for the measurement of the pitch angle. The reference line is the walkway handrail, and the edge used for the identification of the pitch is the one between the handrail and the background. Starting from the top of the image, the derivative of the intensity has been computed on the image averaged on a 5 × 5 window. Preliminary analyses showed that with the proposed experimental setup the edge is the best line fitting the points exceeding the level of 20 grayscale units/pixel. The angle is constrained between ±9°. The region of interest for the calculation of this line is limited to 80 pixels above or below the previously calculated line. The image processing time is approximately 30 ms. Examples of the images used for the identification of the cart pitch and yaw are shown in
Figure 4.
2.2. Laser Scanner Boresight
The laser scanner (Faro Cam2) boresight calibration consists in finding the roto-translation between the Laser reference system and the cart reference system, as seen in the left part of
Figure 5. The transformation is obtained by scanning a set of 4 non-aligned markers fixed on the cart with the laser scanner mounted on the cart and with another laser scanner that observes the cart with the markers.
An example of a 360° view acquired by the FARO laser scanner located on the cart is shown in
Figure 6.
2.3. System Calibration and Uncertainty Budget
The system calibration is necessary for both the transformation of the image coordinates into physical coordinates (camera calibration) and for the compensation of the bias errors due to the non-idealities of the measurement system (system calibration). The camera calibration was performed by acquiring the image of the calibration grid and compensated for the perspective and non-linear (optical) distortions of the cameras; the standard non-linear compensation algorithm of LabVIEW was used in all the analyses.
The system calibration procedure included the experimental evaluation of the measurement uncertainty and the compensation of the bias errors [
27,
28]. The latter were significant only in the “laser spot and cameras” subsystem, where the lasers’ misalignment results in a drift of the cart position and a linearly increasing roll angle. The calibration was performed by comparing the tilt measured by the laser spots and camera to that measured by a reference inclinometer (dual axis SEIKA SBG2U, full-scale ±10° and linearity deviation lower than 0.01°) at different distances (from 1 to 10 m). The error due to the laser misalignment was derived by plotting the difference between the angle measured by the inclinometer and that measured by the vision system as a function of the distance. The linear component of the trend (approximately 2° after 10 m in our prototype) was subtracted from the measurements performed in operative conditions; as later discussed, the error is large because of the large mechanical tolerances with which the three lasers were mounted. The three laser beams were therefore not parallel: given that the error is repeatable, it can be compensated and therefore does not limit the method accuracy.
The uncertainties of the different components of the measurement chain (defined as per ISO GUM [
27]) were evaluated as the standard deviation measured in repeatability conditions (given that all the systematic errors outlined in the calibration are compensated). Uncertainty of the laser distance meter was verified at distances of 2.5, 5, 10 and 15 m. Tests results evidenced a standard uncertainty of 0.3 mm.
Uncertainty of the displacements measured by the cameras was evaluated under repeatability conditions, i.e., by observing the spots and edges when the cart was not moving. Uncertainty of the displacement measurement performed by the laser spot and vision system was 0.1 mm, which corresponded to 1/5 of the pixel size (0.5 mm). The resulting uncertainty of the yaw angle is 0.04°.
The uncertainty of pitch and yaw angles was measured by imposing known rotations of ±5° to an aluminum profile and using the edge detection algorithms described in this paper. The standard uncertainty was 0.03°; this value is probably an underestimation of the value that can be obtained in operating conditions, since the background during the edge detection did not vary during the calibration tests. Furthermore, the algorithm starts from the assumption that the edge to be detected is an ideal line, and in the current method implementation, the lack of linearity of the edge results in a reduction of the method accuracy. The summary of the uncertainties reported in this section are summarized in
Table 1.
2.4. Experiments and Data Analysis
The system (cart + laser scanner) has been used for acquiring a known geometry of two environments, an indoor corridor and an external facade. In both the cases, the geometry of the two environments has been reconstructed by the Faro Cam2 laser scanner located on the moving cart (mobile acquisition) which was compared to the geometry measured by the same Faro laser scanner placed in a fixed position (tripod/static acquisition) along the corridor and at the center of the façade.
The error of the proposed method was quantified by creating a reference mesh (triangulated model) from the static scan, and calculating the distance between the reference triangle and the closer 3D point acquired in the mobile mode. Results are presented as images of the 3D scan and descriptive statistics of the error (root mean square, average, maximum). Although images do not provide a quantitative indication of quality, they are the result of the final application of the system (identification of the defects under the bridge deck) and consequently the point cloud rendering is a parameter of paramount importance.
3. Results
3.1. Indoor Tests
The first series of tests was performed by scanning indoor corridors of the Gexcel and Politecnico di Milano offices. In these conditions, the ground surface was extremely regular and the cart roll, pitch and yaw were negligible; the only pieces of information used were the distance from the laser distance meter and the translation in the YZ plane (
Figure 3a). The cart nominal speed was 1.2 m/s, a value 20% larger than the ideal speed identified by imposing a point density of 1600 points/dm
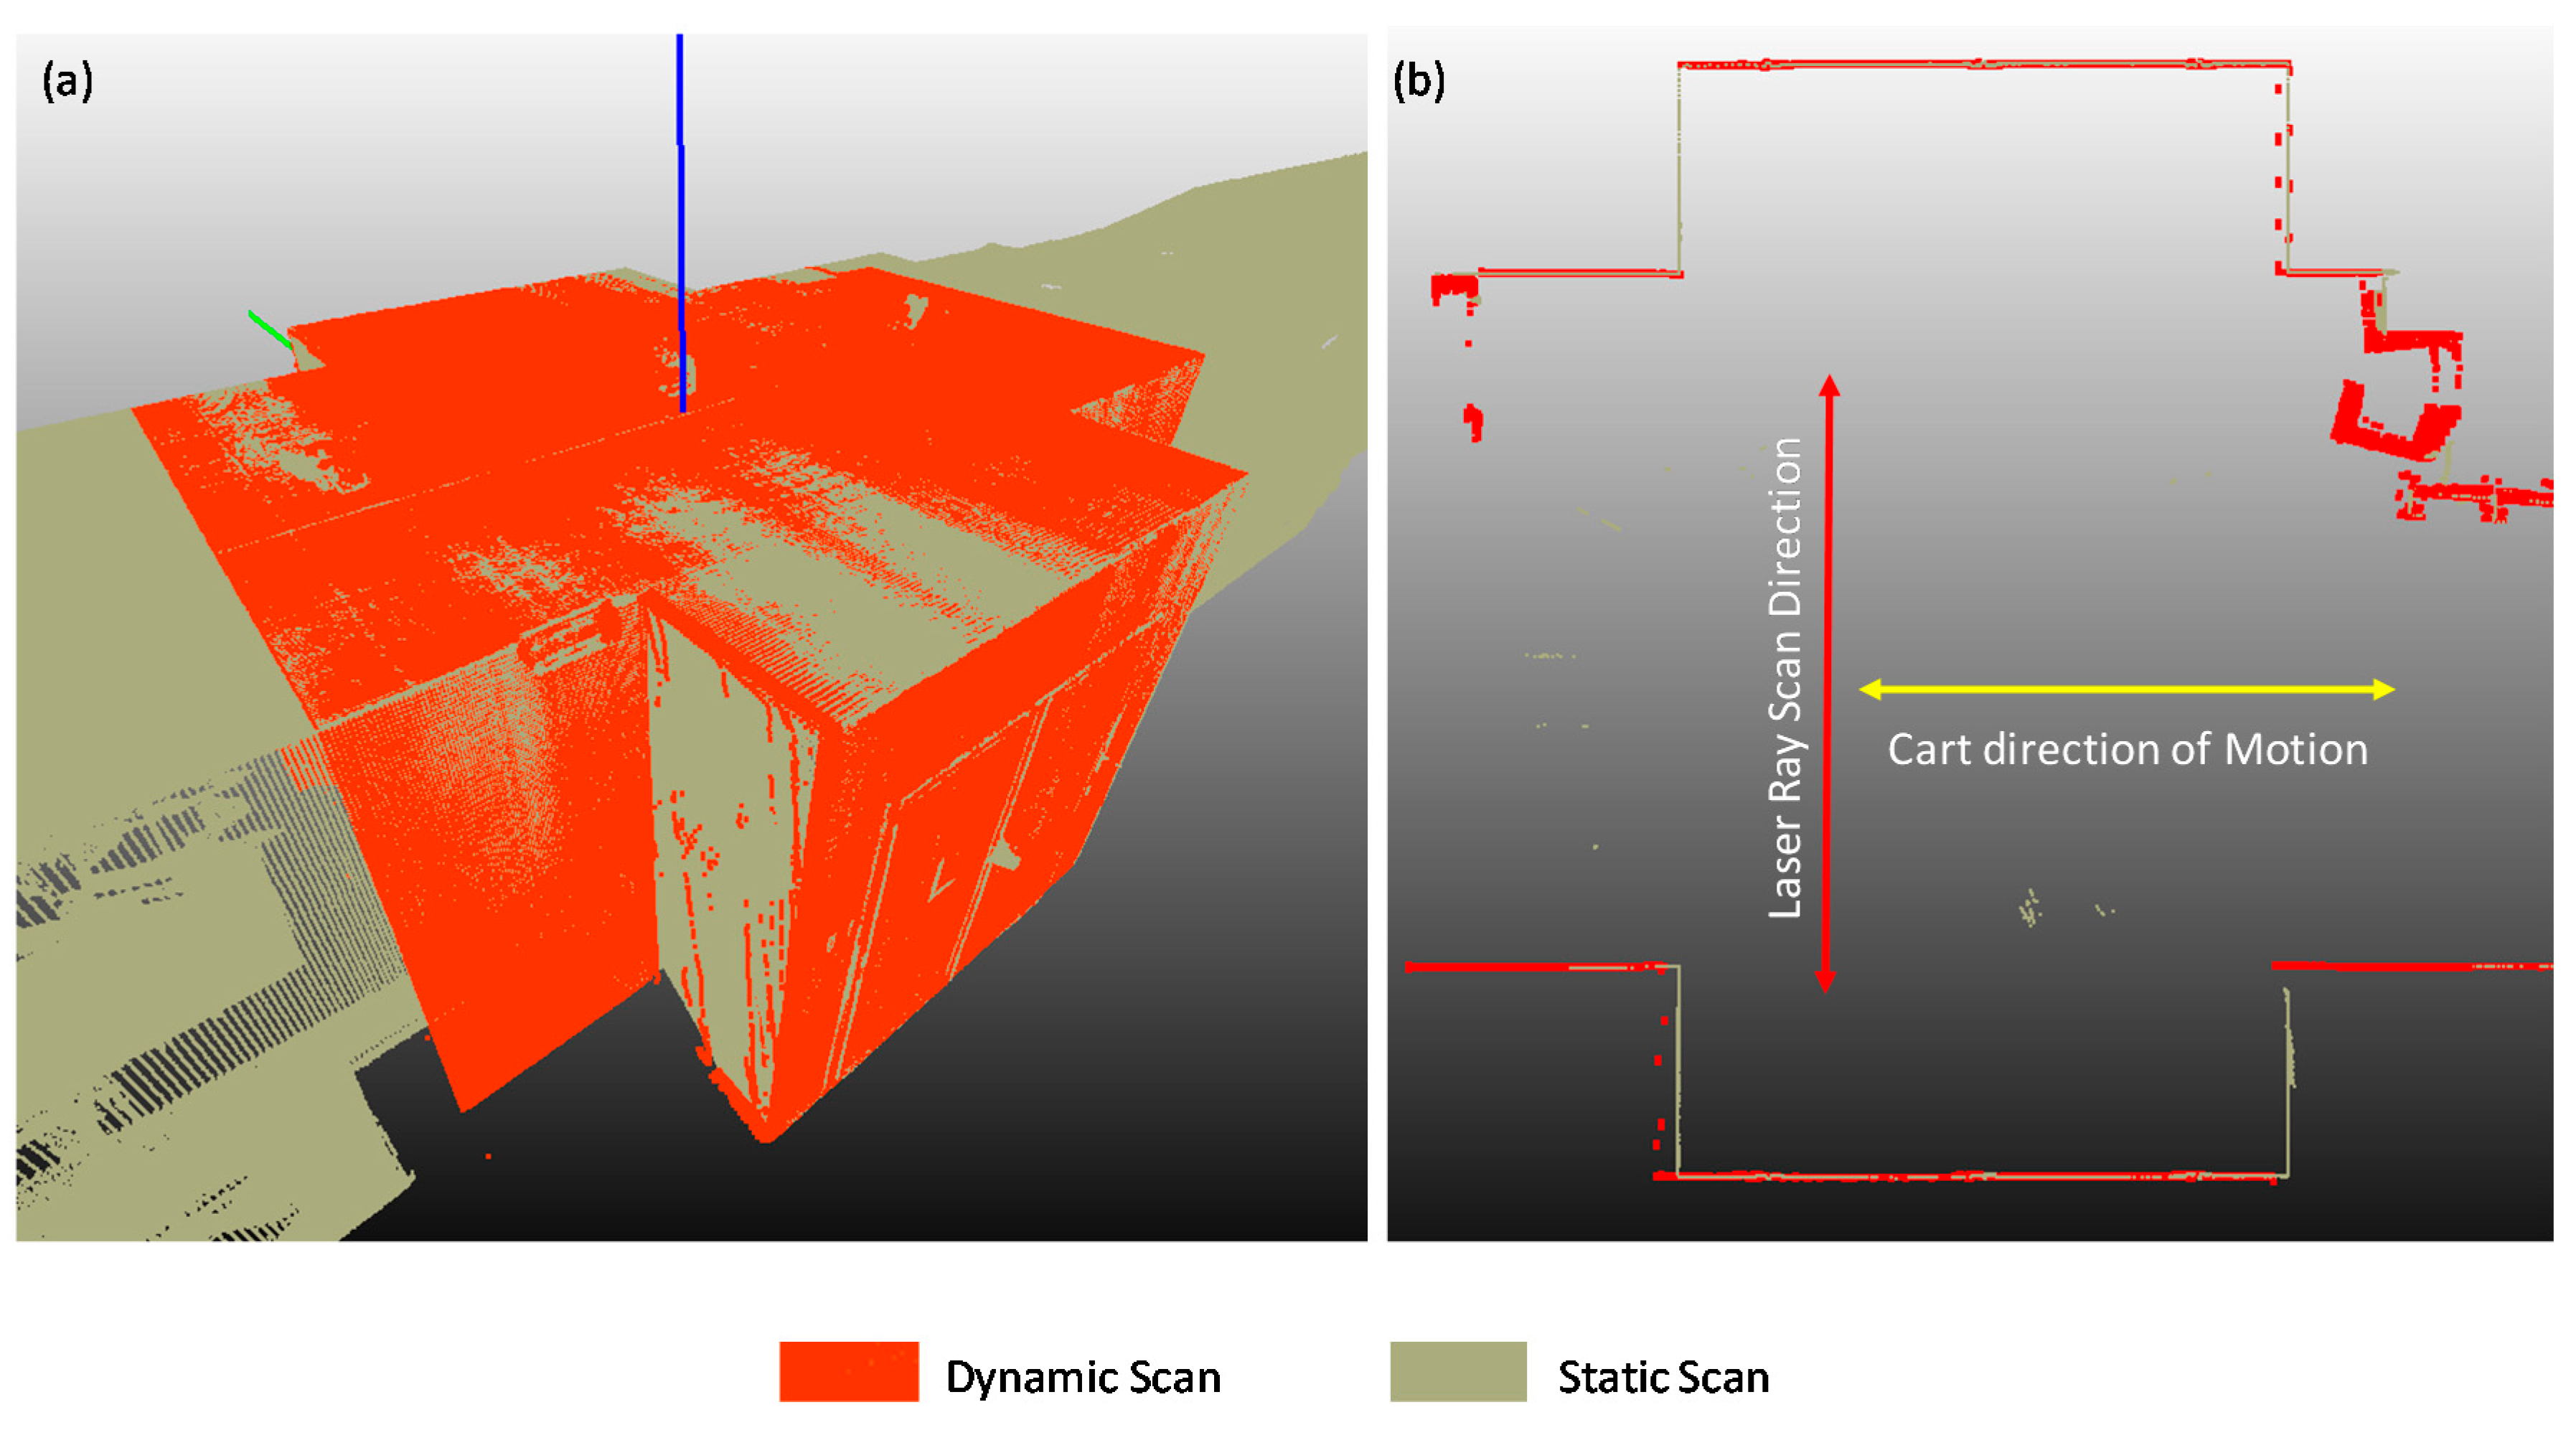
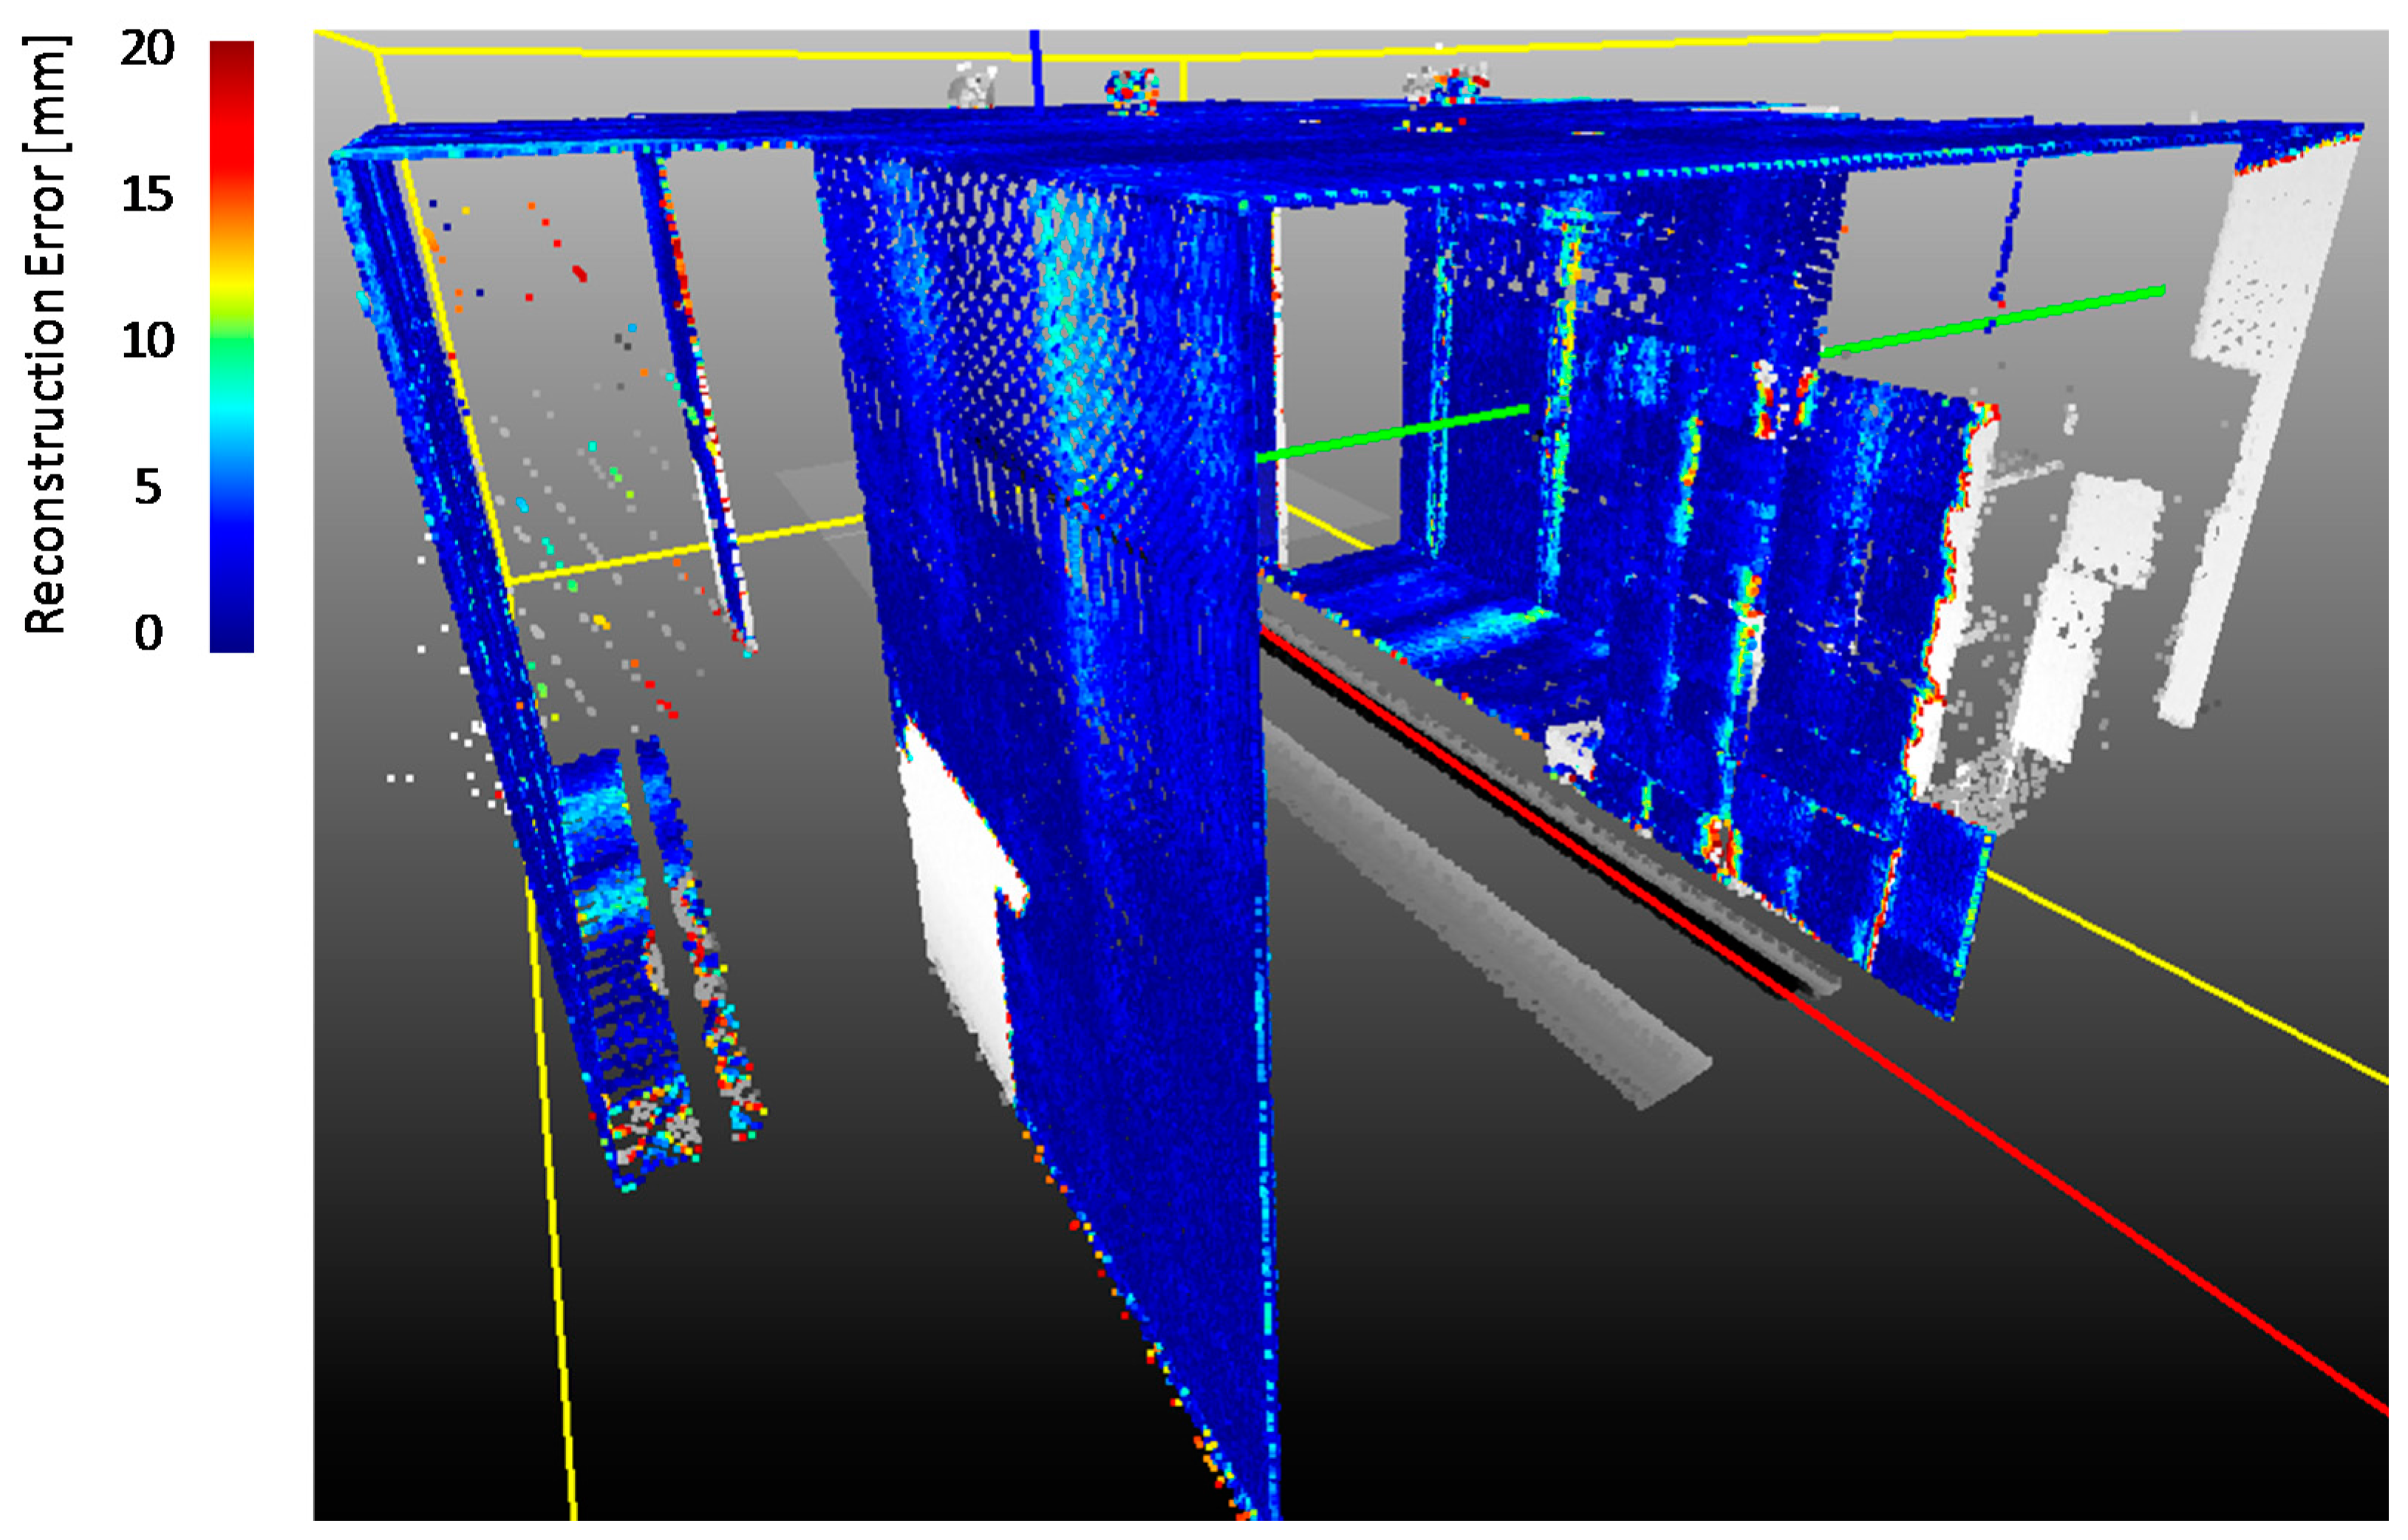
2 with the resolution set to ¼ (helical scans rate 95 Hz). The results of the inspection are shown in
Figure 7. The color indicates the difference between the results of a static scan and the results obtained with the proposed method in which the laser is moving.
Errors were generally small when the surface to be observed was parallel to the direction of motion of the cart: given the use of helical scan mode, the point density of the surface is a maximum when the cart is moving along a direction parallel to the surface. This aspect is clarified in
Figure 8b, where the point density on horizontal lines is much larger than that of the vertical lines.
Descriptive statistics summarizing the errors of the surface scans not perpendicular to the direction of motion are presented in
Table 2.
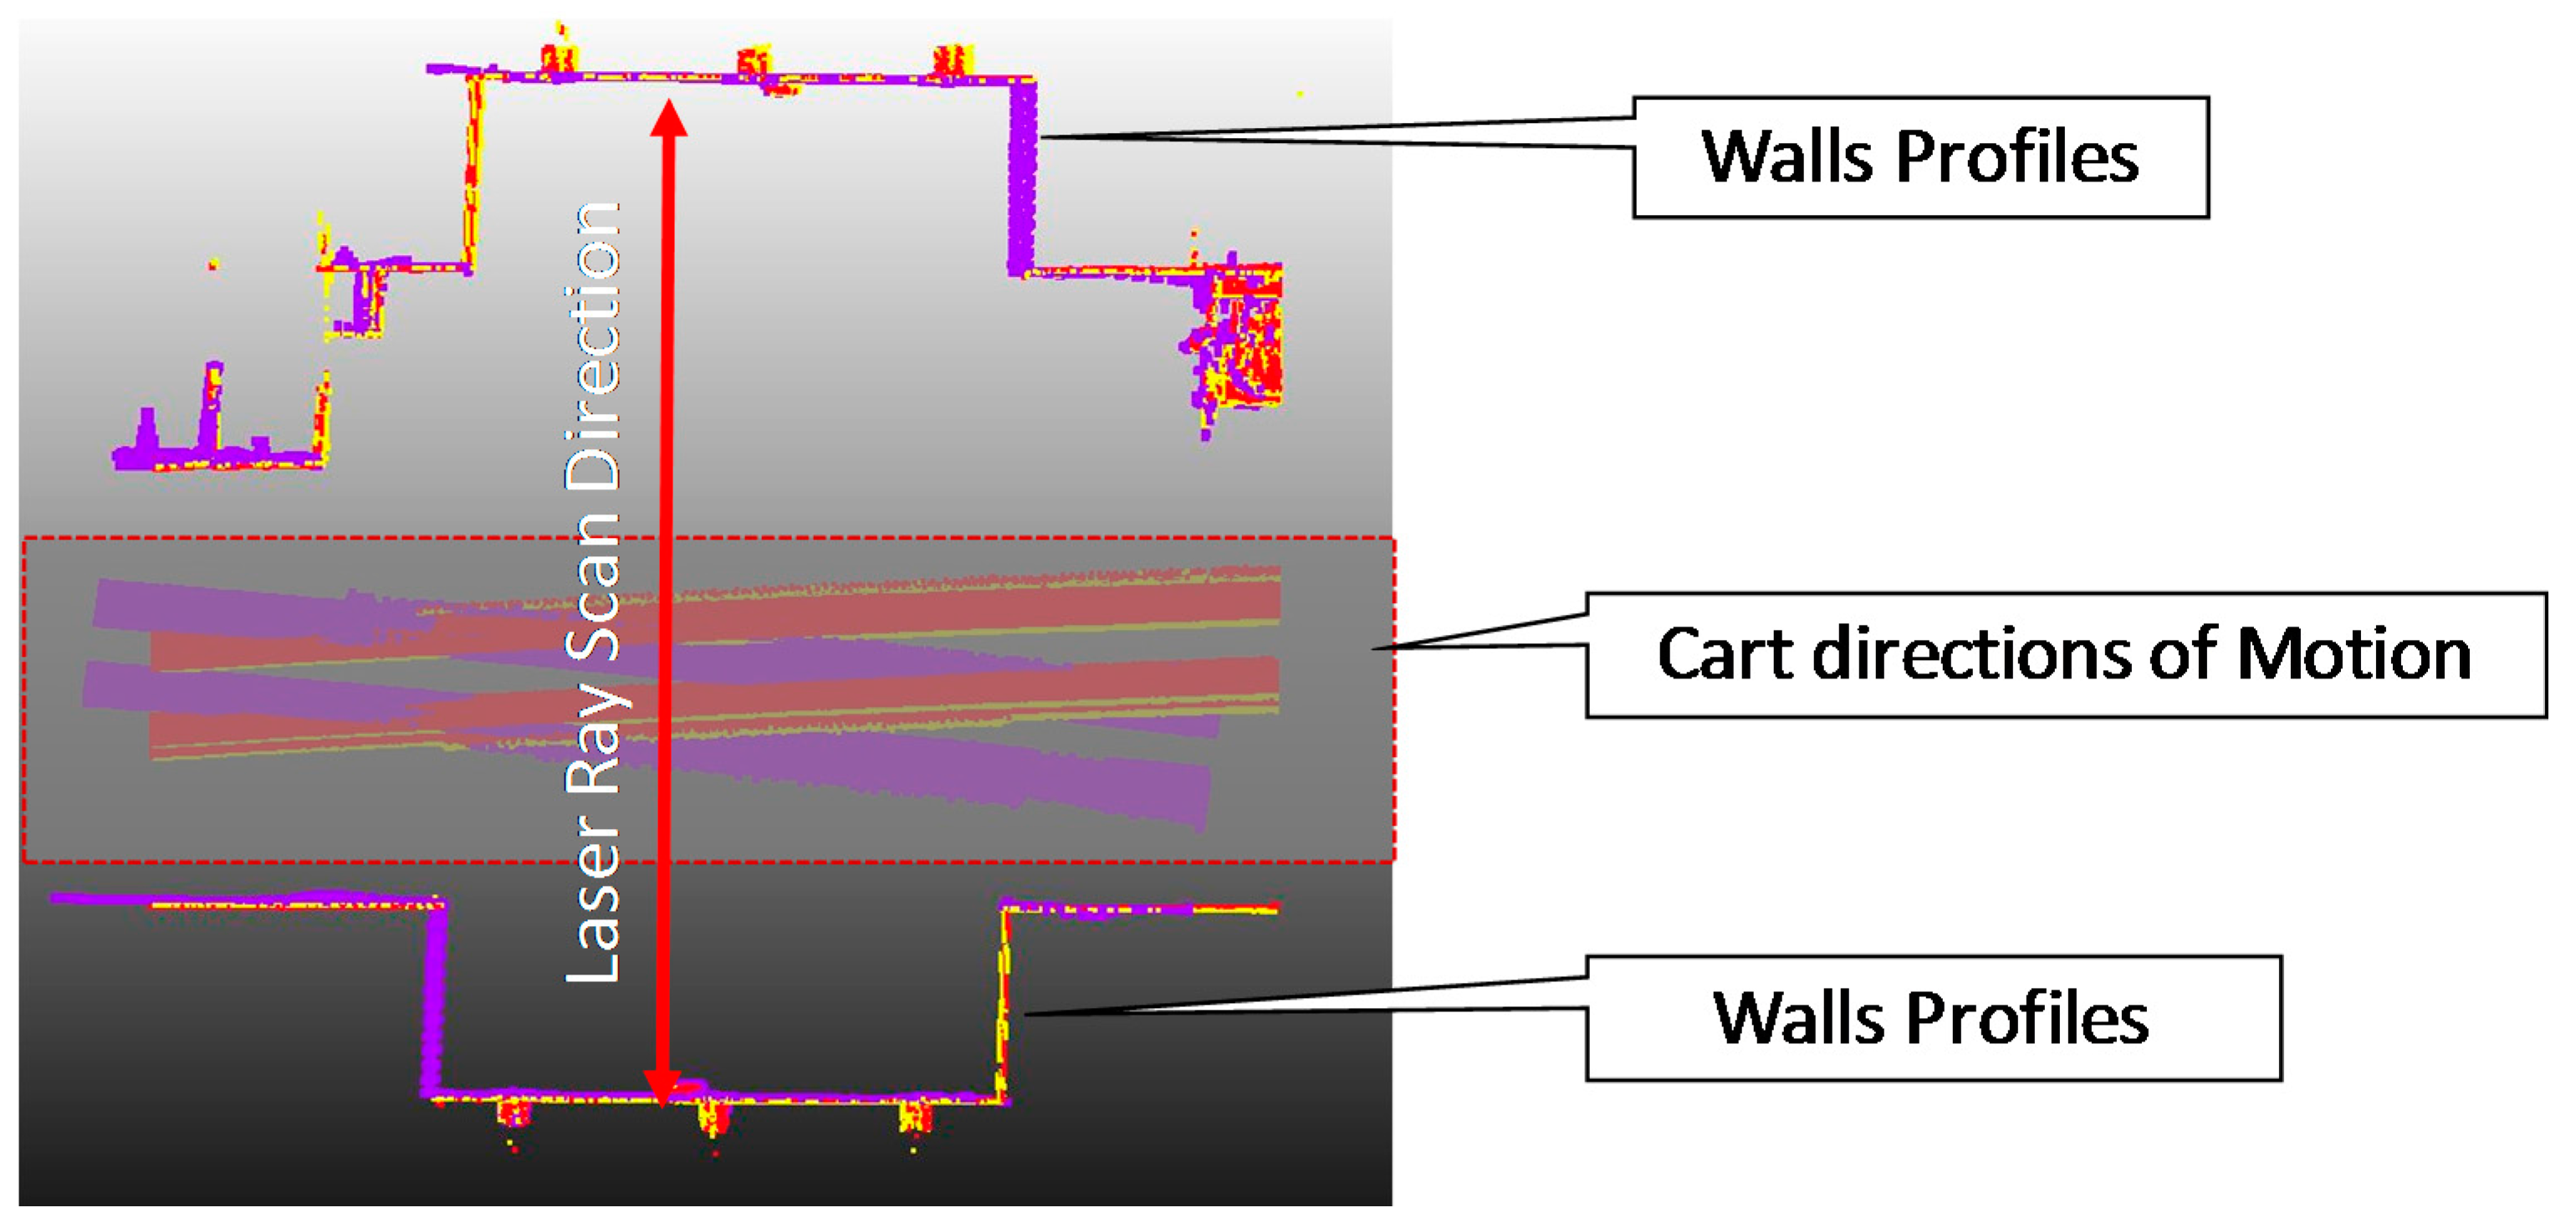
Tests were repeated with different directions of motion of the cart, that was moving with trajectories that were not parallel to the walls, as shown in
Figure 9. The figure shows the difference between three scans of the corridor obtained with the cart moving on different trajectories. The red and yellow scan lines show the point clouds obtained by moving from right to left, while the purple dots are obtained with the cart moving from left to right. Results show a good agreement between the results of different scans, with differences that are compatible with those indicated in
Table 2.
3.2. Outdoor Tests
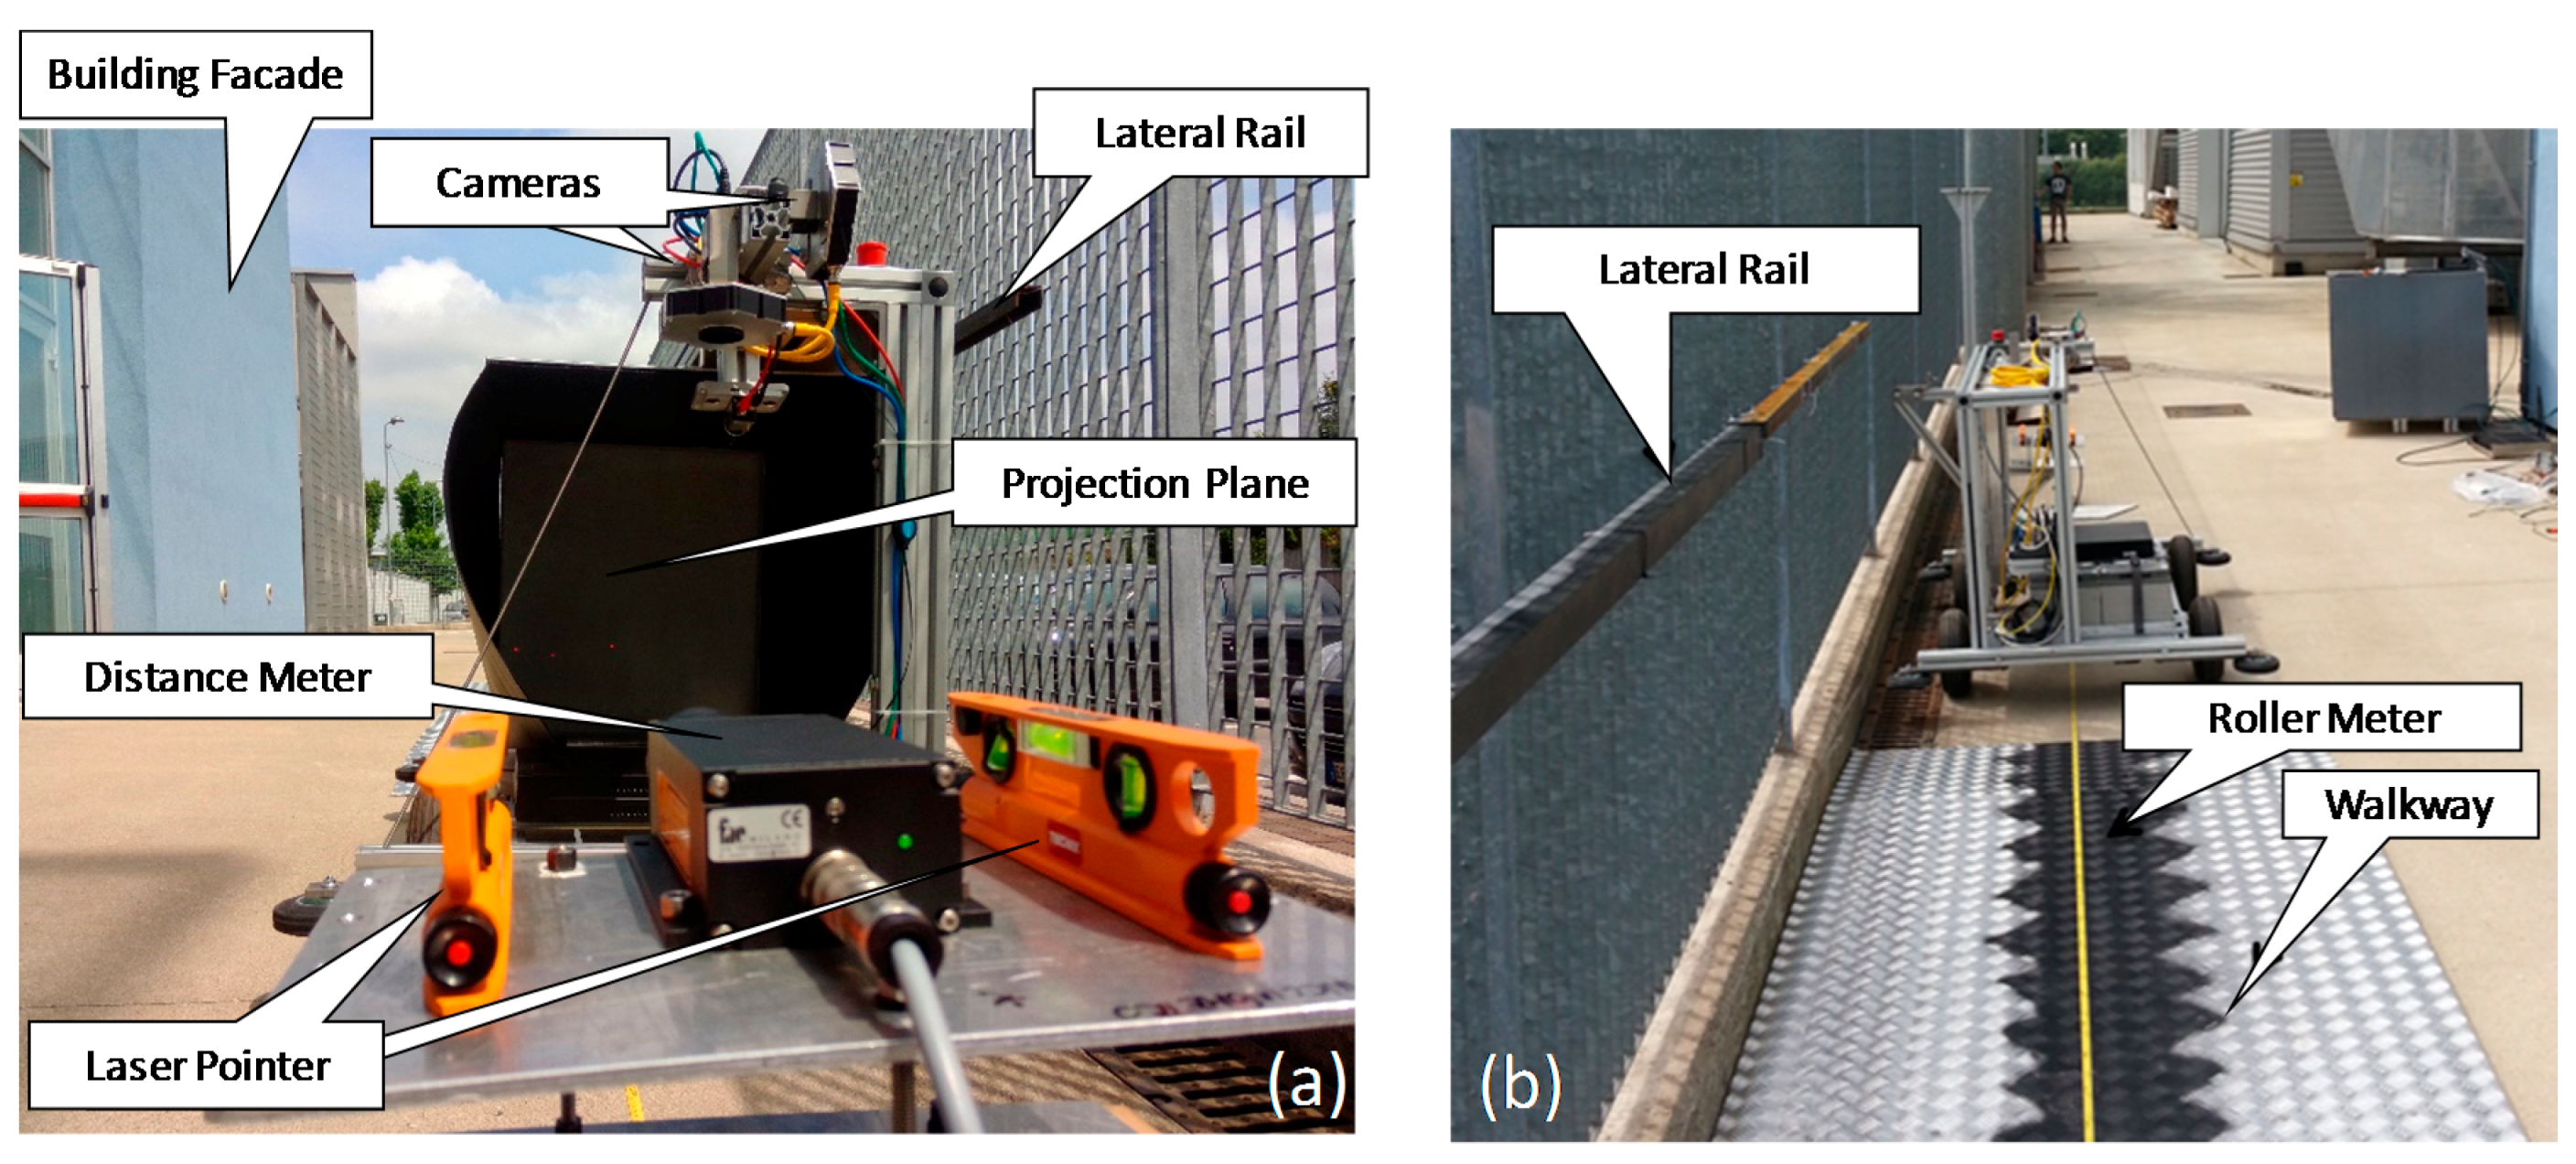
The second series of tests was performed outside in conditions that are more similar to those expected under the bridges; the setup for the method validation is shown in
Figure 10. The Faro Cam2 scanning head was mounted on the instrumented cart moving back and forth over a non-flat terrain simulating the by-bridge. A roller meter was fixed on the ground and two linear metal rods (lateral rails) were fixed on a fence. The cart moved for approximately 15 m and then returned to its original position. The cart nominal speed was 1.2 m/s as in the previous tests.
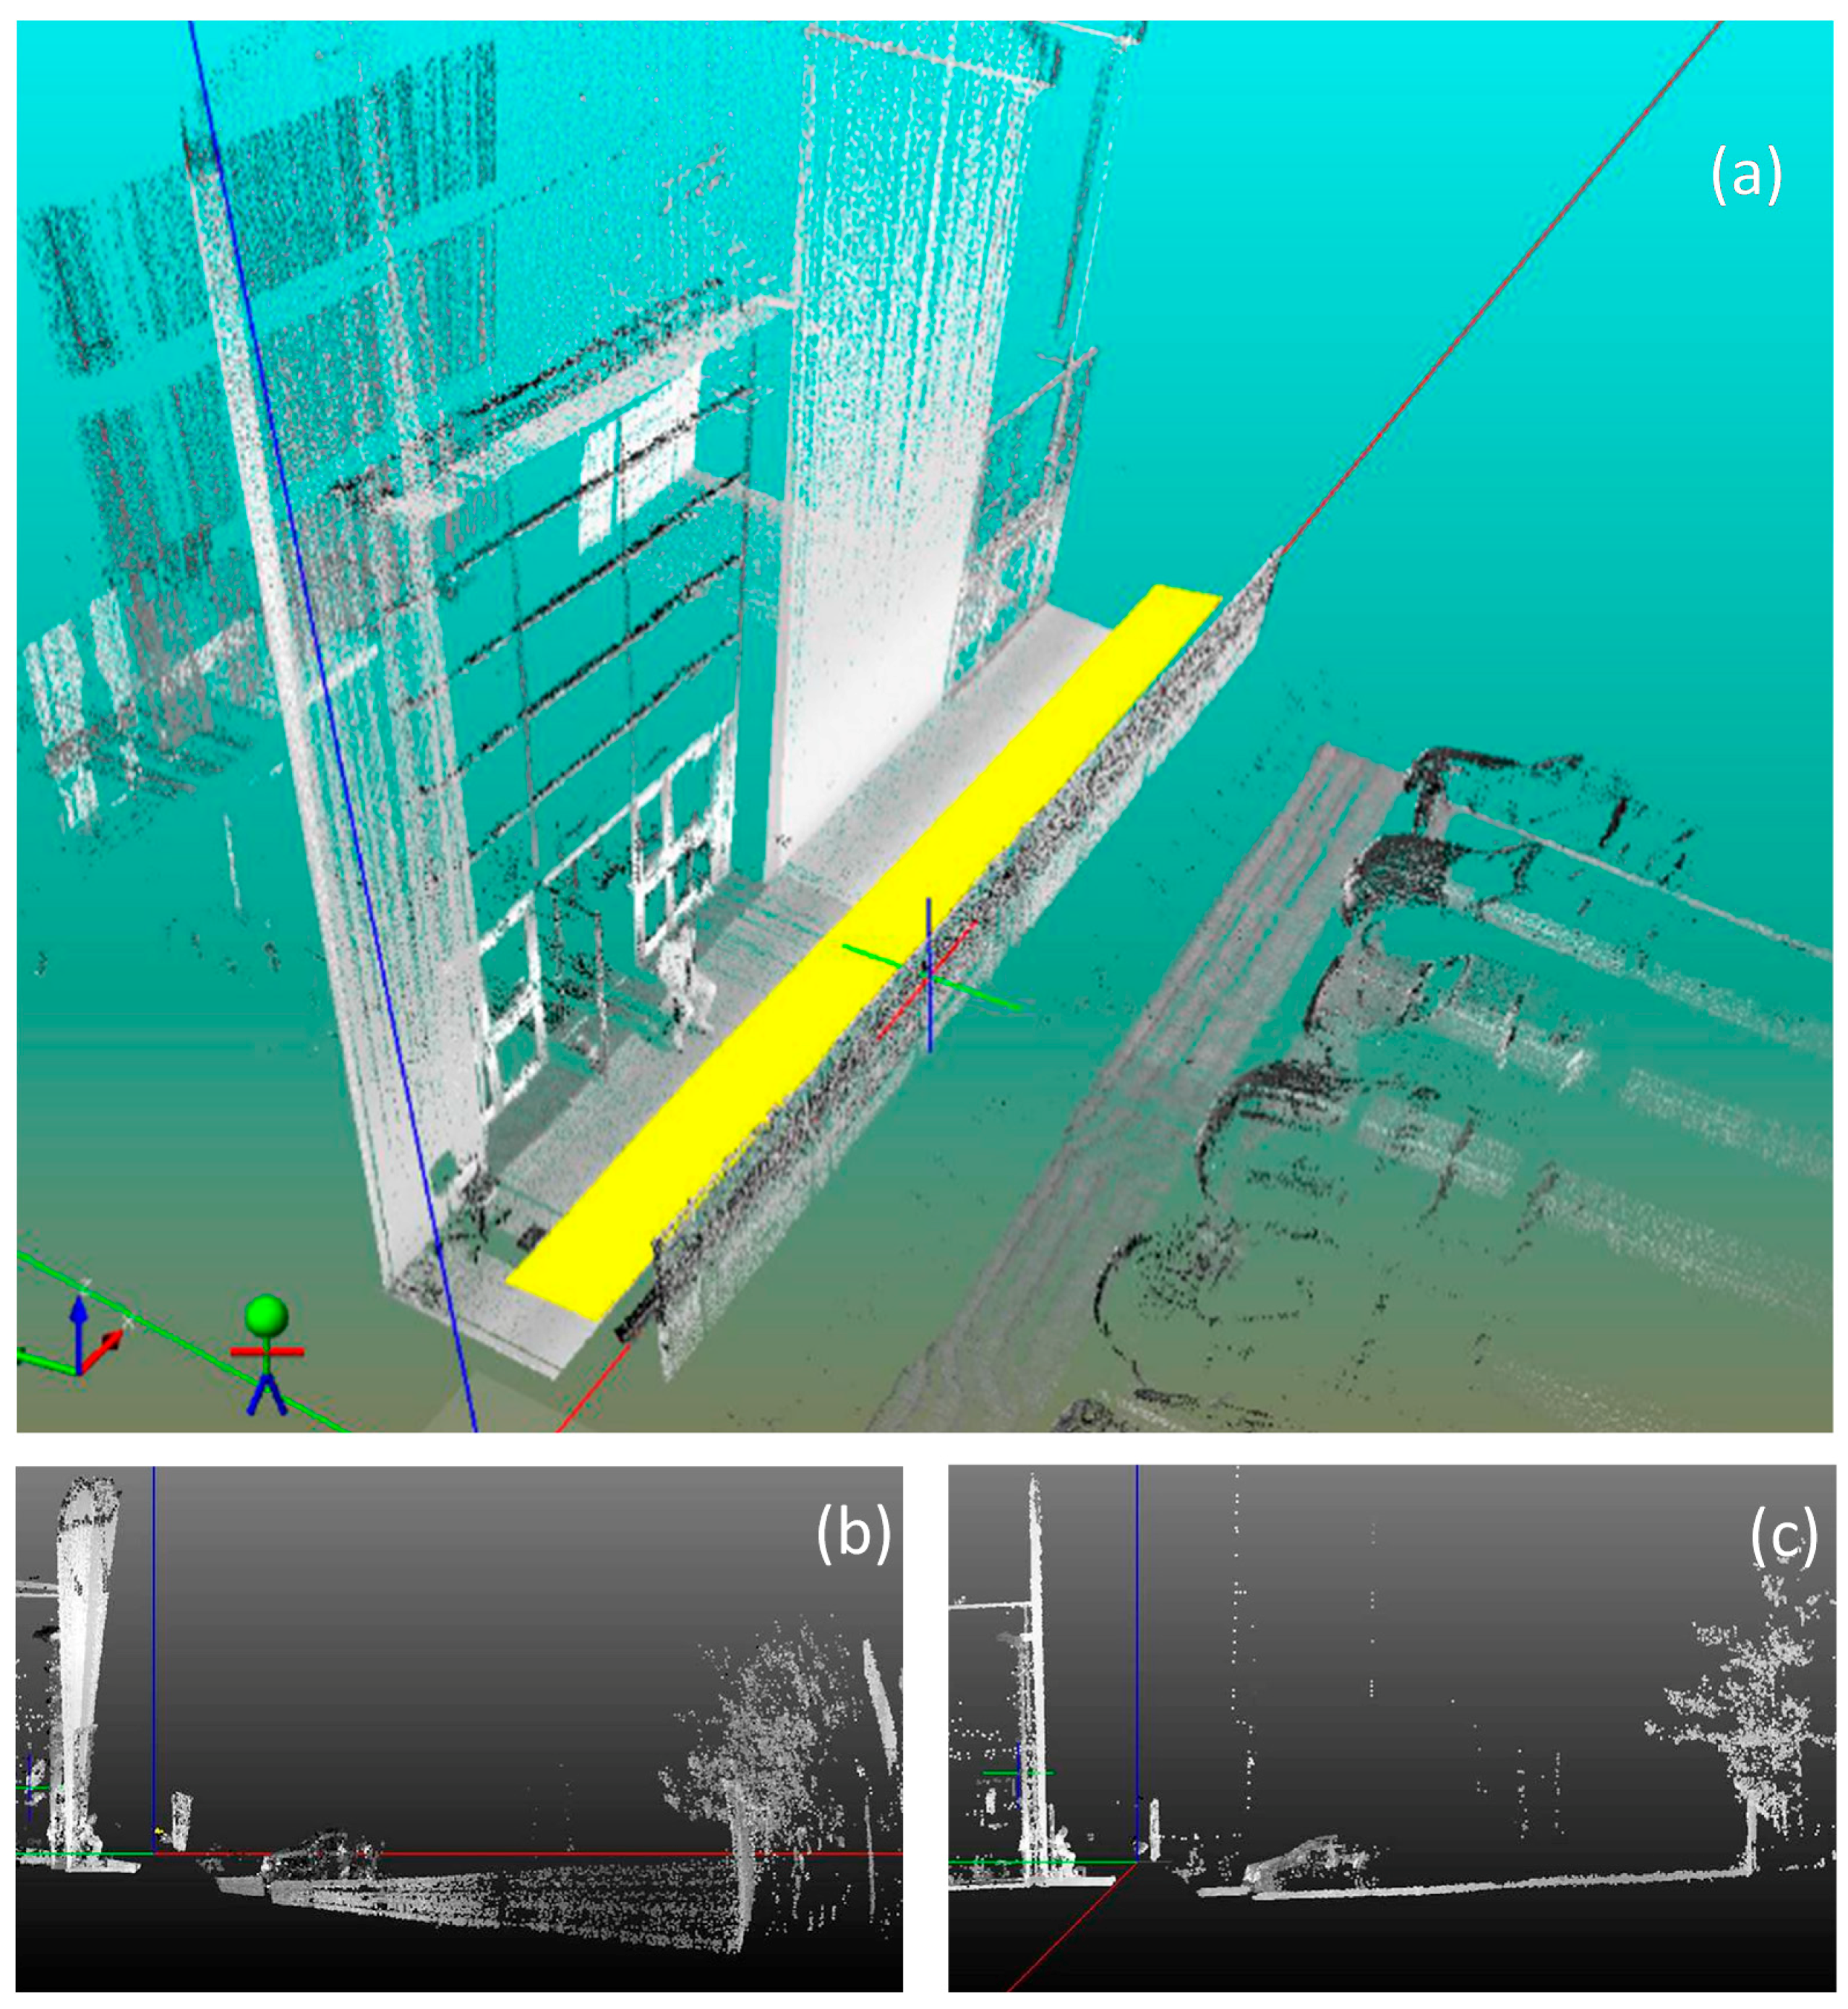
Results of the mobile acquisition scan are summarized in
Figure 11, that shows the cloud point obtained before the tilt compensation (part a and b) and after the compensation (part c) of all the systematic errors. One can notice that the progressive twist of the façade is recovered after the laser misalignment compensation.
Descriptive statistics summarizing the errors of the surface scans not perpendicular to the direction of motion are presented in
Table 3. The RMS value of the error (distance between static and dynamic scan) was lower than 6 mm. The error is larger on the higher part of the façade and was constant at different distances from the measurement origin (position of the laser pointers). The possible causes of the planarity error evidenced in this section are discussed, together with the method limitation, in
Section 4.
4. Discussion
Results showed that the RMS error in indoor and outdoor tests is compatible with that of the methods existing in the literature [
29]. The uncertainty is large in comparison with the uncertainty of the cart position, and numerical simulations [
19] showed that the error is mainly due to a combination of the tilt error of the cart and a large distance between the cart and the observed surface (3 to 10 m). The position error increases linearly with the distance between the scanning head and the measured surface. In real experimental conditions, the error is supposed to be smaller as the distance from the bridge surface is lower than 2 m. Conversely, the walkway oscillation may worsen the results obtained in these preliminary tests. In the real by-bridge usage, the accuracy can be increased by considering only the points placed at a limited distance from the scanning head, given that the simultaneous cart and truck motion allows an observation of the same point from different cart/truck positions.
The accuracy of the angles’ measurements can be increased by improving the image quality. The increase of image resolution is not possible without significantly increasing the instrumentation cost, since this choice would limit the camera frame rate and consequently the cart speed (that strongly affects the cart vibration [
5,
7]). The uncertainty of the edge detection algorithms can be reduced by increasing the contrast between the edges and the background; consequently, the tests in actual working conditions were performed by painting the walkway surface of a special opaque paint, as shown in the lower part of
Figure 10.
Given that the most limiting factor is the accuracy of the roll angle, the latter could be increased by adopting a procedure similar to the one used to measure the pitch and yaw angles, i.e., by replacing the two laser pointers with a laser line. In order to obtain a decent contrast with the projection plane, the laser aperture should be large enough to fill the entire projection plane at the smaller distance (approximately 1 m) and should have enough power to ensure a sufficient contrast at a distance of 20 m. A similar result can be obtained by replacing the two laser pointers with an array of pointers and adopting a least square procedure to identify the roll angle with a better accuracy. With our experimental setup, the parallelism of the three lasers was limited by the poor planarity of the optical bench, and the usage of three lasers instead of the external ones did not increase the measurement accuracy significantly.
Also, the position uncertainty can be reduced by adopting data fusion procedures [
30,
31,
32], given that the lateral and vertical displacements can be detected by the vertical and lateral cameras respectively, and the odometry can be performed by analyzing the images of the vertical camera (which observes the roller meter). The theoretical uncertainty reduction in the case of an average of two measures with similar uncertainty is
[
33,
34]; however, the accuracy increase in the final application (reconstruction of the underbridge geometry) would be limited, given that the angles can be measured only by one camera at a time.
Many limitations of the proposed measurement system for the identification of the bridge geometry derive from the odd surface on which the cart is moving, and the easiest solution would be to ensure a smoother motion of the cart. For obvious safety reasons, it is impossible to modify the structure of the walkway, which is telescopic and can be folded on the truck during the transport phase. Since the by-bridge is used for ordinary road maintenance, the non-slip aluminum on the floor is often in poor condition, and the telescopic structure of the walkway prevents the use of linear guides (rails) that would ensure a limited roll, pitch and yaw of the cart.
The results presented in this paper showed that the mechanical design of the entire structure can be optimized by ensuring the parallelism between the laser pointers and by modifying the design of the cart, introducing passive or active suspension systems in order to limit the vibration of the 3D scanning head. These improvements are deserving of forthcoming studies, given that the accuracy of 6 mm on a 15 by 10 m surface was judged sufficient for the identification of macroscopic structural damages.
Preliminary tests performed under a bridge with the inspection truck and a moving Faro CAM2 scanner evidenced the validity of the proposed method.
5. Conclusions
This paper described an original technique for the identification of the motion of a moving cart on bounded trajectories. The laser scanner is meant to be mounted on a truck for underbridge inspection to avoid the visual inspection currently performed by operators. The RMS error in the reconstruction of a corridor and of a building façade (15 by 10 m) were respectively 4 and 6 mm; the values are promising for the final application of the system, given that it was obtained with the cart moving at a speed 20% higher than the speed at which the cart will travel during the underbridge inspection.
The analysis of the uncertainty budget showed that the dominant factor that is limiting the accuracy of the point cloud is the accuracy in the identification of the cart roll. The latter can be increased by improving the quality of the optical layout of the laser pointers or by replacing the laser pointers with a laser line. In our tests, the lasers were manually aligned and the lack of parallelism was numerically compensated; nevertheless, the adoption of a high quality optical bench with finely adjustable laser alignment would increase the roll angle measurement accuracy. The error in the pitch and yaw angle was less critical, being dependent on measurements of the cameras observing the walkway features.
The main limitations of the proposed method are relative to the complexity of the experimental setup, that requires the installation of cameras and laser pointers on the metallic frame of the special truck. Also, the procedure required for locating the cart in the walkway, as described in this paper, is rather long, but in the current state-of-the-art there are no systems allowing the identification of the underbridge geometry independently from the bridge height and from the presence of water. Future works will be focused on the identification of the system in real usage conditions and on the optimization of the mechanical design of the system to increase the accuracy of the roll motion.

 ,
, 


