Article

Implementing and Visualizing ISO 22400 Key Performance Indicators for Monitoring Discrete Manufacturing Systems †

by
Borja Ramis Ferrer
*,
Usman Muhammad
,
Wael M. Mohammed
and
José L. Martínez Lastra
Factory and Automation Systems and Technologies Laboratory, Department of Automation and Hydraulic Engineering, Tampere University of Technology, 33720 Tampere, Finland
*
Author to whom correspondence should be addressed.
This manuscript is extension version of the conference paper: Muhammad, U.; Ferrer, B.R.; Mohammed, W.M.; Lastra, J.L.M. An approach for implementing key performance indicators of a discrete manufacturing simulator based on the ISO 22400 standard. In Proceedings of the 2018 IEEE Industrial Cyber-Physical Systems (ICPS), St. Petersburg, Russia, 15–18 May 2018; pp. 629–636.
Machines 2018, 6(3), 39; https://doi.org/10.3390/machines6030039
Submission received: 23 July 2018 / Revised: 22 August 2018 / Accepted: 23 August 2018 / Published: 1 September 2018

Abstract

:
The employment of tools and techniques for monitoring and supervising the performance of industrial systems has become essential for enterprises that seek to be more competitive in today’s market. The main reason is the need for validating tasks that are executed by systems, such as industrial machines, which are involved in production processes. The early detection of malfunctions and/or improvable system values permits the anticipation to critical issues that may delay or even disallow productivity. Advances on Information and Communication Technologies (ICT)-based technologies allows the collection of data on system runtime. In fact, the data is not only collected but formatted and integrated in computer nodes. Then, the formatted data can be further processed and analyzed. This article focuses on the utilization of standard Key Performance Indicators (KPIs), which are a set of parameters that permit the evaluation of the performance of systems. More precisely, the presented research work demonstrates the implementation and visualization of a set of KPIs defined in the ISO 22400 standard-Automation systems and integration, for manufacturing operations management. The approach is validated within a discrete manufacturing web-based interface that is currently used for monitoring and controlling an assembly line at runtime. The selected ISO 22400 KPIs are described within an ontology, which the description is done according to the data models included in the KPI Markup Language (KPIML), which is an XML implementation developed by the Manufacturing Enterprise Solutions Association (MESA) international organization.

1. Introduction

In the last decades, interest of enterprises in novel tools and techniques for monitoring, supervising and measuring the performance of systems in the industrial domain has been incremented dramatically. It is assumed then an effective control over any source of loss in productivity enhances the competitiveness in the global market, allowing the anticipation to and mitigation of machinery malfunctions. In this scope, the industry is shifting from conventional strategies, such as mass production to other ones e.g., lean manufacturing. Additionally, companies tend to shift from reactive to predictive manufacturing in different areas e.g., maintenance [1], production planning and scheduling [2,3]. This requires to reach high production efficiency and quality standards, as well as other qualitative attributes, such as reconfigurability and flexibility [4].
The performance of industrial organizations is not only measured at factory shop-floor level, i.e., where the physical operations are executed by machines. In fact, it will depend on the size and needs of companies the organizational level to be measured and monitored. More precisely, following the so-called automation pyramid levels defined in the ISA-95 by the International Society of Automation (https://www.isa.org/isa95/), enterprises may focus on different levels including (from top to bottom of the pyramid): Business Planning & Logistics, Manufacturing Operations Management and control levels which, in turn, includes Batch, Continuous and Discrete control operations [5]. Actually, in the case of Small and Medium-sized Enterprises (SME) the focus of performance measuring might be very specific and intensive, even in particular parts of each level in order to maximize their competitivity [6]. This is due to their lack of resources and/or visibility in the global market [7]. Particularly, meanwhile the top levels will be concerned about financial status, marketing, accounting and resource planning; the focus of bottom levels is on scheduling, allocation of resources, maintenance operations, quality operations, inventory management and data collection [8]. In the latter levels, it is critical that the selected monitoring tools and techniques permit checking specific parameters on system runtime without disrupting the processes being executed.
Contemporary industrial enterprises are more complex than before in the context of particular needs on logistics, automation, control and, as well, the difficulty of engineers to handle system heterogeneity, among other issues. However, the employment of Information and Communication Technologies (ICT)-based technologies to support aforementioned needs permits the collection of vast amounts of data from both Cyber and Physical Systems (CPS) that may be processed for measuring the performance of systems. This may be applied to any level of the ISA-95 automation pyramid because enterprises have increased the interconnectivity of their resources. This is aligned with the concept of Industry 4.0 [9], or fourth industrial revolution, which is one of the current trends in the domain of industrial automation [10,11]. In this scope, the data collected and exchanged throughout distributed systems can be processed at runtime and permitting the calculation of Key Performance Indicators (KPIs), which permit the evaluation of system performance [12].
Commonly, enterprises define sets of KPIs that support the understanding of how processes are executed at different levels of the organization. There are different methodologies that may be implemented for defining KPIs. For example, Ref. [8] presents an 8-step iterative closed-loop model for defining and measuring KPIs in an industrial environment. However, KPIs might vary when KPIs are defined by different organizations. Basically, KPIs can be both customized (defined and used by concrete companies) or standardized (defined by specific international organizations and used for multiple companies). The utilization of customized KPIs can be conflictive when migrating such metrics to diverse environments, due to the employment of different terminology for defining the same concepts. Thus, the employment of standardized KPIs is recommended.
The ISO 22400 standard presents terminologies, concepts and 34 KPIs for the Manufacturing Operations Management (MOM) level. These KPIs are standardized and, hence, are intended to be used in different manufacturing system [13]. However, the implementation of such KPIs in the real-world manufacturing industry is challenging. Therefore, the Manufacturing Enterprise Solutions Association (MESA) international organization developed the KPI Markup Language (KPIML), which presents the data model given for the ISO 22400 standard KPIs in an XML (eXtensible Markup Language)-based format [14].
Recently, an approach for implementing key performance indicators based on the ISO 22400 standard has been presented in [15]. However, the authors did not demonstrate how the defined and implemented standard KPIs can be visualized. Thus, the main objective and contribution of this article is to extend the aforementioned research work by demonstrating the visualization of selected ISO 22400 KPIs. This is demonstrated throughout a set of graphs that are displayed in the user interface of the developed approach. As in previous work, the approach is implemented and deployed in a web-based interface that permits the control of a discrete manufacturing system. But, now, the performance of such system can be monitored with visual and descriptive graphs, as the principal advance performed in this research work. Further, the provided user interface does not only permit the selection of desired KPIs but the customization of new ones. In the background, the information of both the discrete system and the KPIs are described within an ontology which can be accessed on runtime by the visualization interface.
The rest of the paper is structured as follows: Section 2 presents the literature review and industrial practices in the scope of this research work. Section 3 describes the main components of the approach. Afterwards, Section 4 presents the use case for validating the implementation of the approach and the implementation of described components. Then, the main contribution of this research work is presented in Section 5, as it demonstrates the KPI visualization. Finally, Section 6 concludes the paper and presents further work.

2. State of the Art

2.1. Existing KPI Based Solutions

During many decades, the measurement of performance in industry grasped the attention of managers and researchers. Thus, there are several frameworks and systems in such scope. For example, L.M. Glavan in [16] discusses the Process Performance Measurement Systems (PPMS), which divides performance measurement systems into two different levels. Firstly, the individual performance measures level is focused on measuring the performance separately in relation to time, cost, and flexibility. On the other hand, the performance measurement system level, as an entity, consists of a set of performance indicators that contribute towards the effectiveness and efficiency of an industry as a whole.
In addition, efforts have been conducted to design a general framework that helps in identifying a set of key performance indicators for the industrial environment. In [8], Rakar et al. designed an 8-step closed-loop iterative model which is based on the finding of Bennett [17] for deriving KPIs for the process industry. This iterative closed-loop model helps for continuously monitoring the performance of the industry, with the help of the selected indicators it drops or adds new performance indicators at the end of each cycle, depending on their importance and usability. Furthermore, the authors in [8], managed to identify five categories of KPIs with the help of the aforementioned closed-loop model. These indicators are (i) Safety and environment, (ii) Efficiency, (iii) Quality, (iv) Production plan tracking, and (v) Issues related to employees. The major focus of the research in this field remains in the process of identifying and deriving KPIs for the industry instead of their implementation in the real-world industry. Nevertheless, Zhang et al. in [12], implemented the five KPIs proposed in [8] in an industrial automation environment to improve the management of different factory assets. The implementation is based on Service-Oriented Architecture (SOA) deployed within Web Service (WS) technology. Besides, Complex Event Processing (CEP) was used to extract useful information from the events which are received from the factory shop-floor. The implementation architecture in [12] relies on a Model-View-Controller (MVC) design pattern. In this context, the Model manages the incoming application data, while the View serves as a platform for the users to visualize different graphics. Then, the controller informs the Model about when new updates need to be applied in the View.

2.2. Existing KPI Based Solutions

KPIs vary from one industry to another. Therefore, the development of a generic set of KPIs that supports different kinds of manufacturing industries is challenging. The ISO 22400 standards, “Automation systems and integration—Key performance indicators (KPIs) for manufacturing operations management”, identify and define a total of 34 KPIs [18]. These KPIs are calculated at MOM level of the industry and require some parameters from the lower levels e.g., control systems level, where sensors provide feedback of the manufacturing system. After calculation, these KPIs are sent to business planning and logistics level for further utilization and decision-making.
The ISO 22400 standards consist of two parts:
  • ISO 22400-1: Overview, concepts and terminology
  • ISO 22400-2: Definitions and descriptions
The ISO-22400-1, is consisted on the overview and basic concepts of the KPIs framework in the industry. Moreover, the first part defines the specific terminology that is used in designing a KPI. On the other hand, the ISO-22400-2 compiles a list of 34 KPIs which can be used in manufacturing industry with specific definitions, scopes, formulas and a complete description for each KPI. Table 1 illustrates all the fields that are provided in the description of any KPI in the ISO 22400 standards. Besides the ISO 22400 standards, the Overall Equipment Effectiveness (OEE), the Overall Throughput Effectiveness (OTE) and the Sustainable OTE present other commonly used KPIs for measuring the efficiency of machines and systems, as described in [19,20].
The Key Performance Indicators Markup Language (KPIML), developed by MESA, is a language that enables the usage and exchange of KPIs between different levels of manufacturing industries. As the KPIML data models presented for the KPIs in the ISO 22400 standards are implemented in the form of XML schemas, they are described as an XML implementation of the ISO 22400 standards. In terms of structure, the KPIML schemas are designed on the basis of two standards: the ISO 22400-1 and the “ANSI/ISA-95.00.05-2006 Enterprise-Control System Integration Part 5: Business to Manufacturing Transactions” [14]. An example of KPI XML based on KPIML and the ISO 22400-2 description is given in Figure 1 for Quality Ratio KPI.

2.3. Web Services and Hypermedia

Due to the advances in the ICT domain, the implemented web-based applications became more robust and mature. In general, web-based applications require communication between different parties. This is achieved within servers which provide web services and clients which can request such services. In the context of web services, several standards and protocols have been constructed in order to manage and unify the exchange of information [21]. This may be implemented within a service-oriented architecture (SOA). SOA is a paradigm that permits the exchange of information between different parties throughout the implementation of three elements: service broker, service provider and service consumer. In this context, several protocols have been designed e.g., HTTP (Hypertext Transfer Protocol), MQTT (Message Queuing Telemetry Transport) and OPC-UA (Open platform Communication-Unified Architecture), among others [22,23]. In addition, some implementations are built using these protocols. For instance, SOAP (Simple Object Access Protocol) or WebSocket protocols. Besides, although it is not a standard, the RESTful is an architectural style for web services that can be considered as an implementation example HTTP web services. More precisely, RESTful web services represent a stateless request-response communication approach. Further, although it is not mandatory, RESTful web services frequently employ the concept of Create, Read, Update and Delete (CRUD) by using different HTTP request methods which are mapped to GET, POST, PUT and DELETE [24]. In regard of usage in industrial cases, RESTful web services have been included in many approaches as discussed in [25,26,27,28,29].
As happens in many domains, the industrial domain benefits from the WS technology advances. For instance, the European Commission proposed and executed several research collaboration projects that aimed enriching the employment of the ICT in manufacturing systems under different programs such as the Factory of Future (FoF) (http://ec.europa.eu/research/industrial_technologies/factories-of-the-future_en.html). In this context, the eScop (http://www.tut.fi/escop/) project presented an approach that implements a RESTful interface for exchanging information in factories via WS-enabled controllers [30]. Meanwhile, several manufacturers of industrial devices markets WS capabilities as significant and remarkable features for their products. This can be appreciated e.g., in the EtherCAT-enabled devices by Beckhoff [31], OPC-UA-enabled devices by Siemens [32], Omron [33] and ABB [34], and MQTT by Schneider Electric [35].
Besides web services, the implementation of web-based applications includes interfaces and hypermedia protocols. In this context, several standards, APIs (Application Programming Interface) and programming languages have been developed and refined in order to provide an interactive interface of web-based applications. For instance, HTML (Hypertext Markup Language), CSS (Cascading Style Sheets), SVG (Scalable Vector Graphics) and JavaScript. Moreover, organizations create higher-level frameworks that provide APIs which are built on the top of the mentioned standards e.g., BootStarp3 and AngularJS [36]. Additionally, such technologies are intensively employed by Manufacturing Execution Systems (MES) and Execution Resource Planning (ERP) systems provided by e.g., AEGIS [37], 42Q [38], INCLUDIS [39] and iBASE [40], among others. This easies the installation process and increases the flexibility and usability because users only require a web browser in order to access to any system functionality and/or service.

2.4. Knowledge Based Systems

Currently, there is a trend on adopting of ICT and web-based solutions in different domains. In fact, it is noticeable that the design and deployment of knowledge-based solutions for industrial applications is also increasing [41]. In this context, the information to be processed by cyber engines, involved in the decision-making of machine processes, is encapsulated in semantic containers, or repositories. For instance, a Knowledge Base (KB) can be employed as a centric engineering artifact that contains descriptions of the system to be controlled and/or monitored and the surrounding environment [42].
Knowledge repositories can be implemented within different formalisms, such as semantic frames, rules or ontologies, among others [43]. Recently, the design and implementation of ontologies has been intensified for industrial applications [44]. There are many options for designing and implementing ontologies [45], such as the Ontology Web Language (OWL) [46], which is a based on the RDF (https://www.w3.org/RDF/). In any case, the syntax and semantics of ontological models are the key characteristics that make them understandable by both humans and machines. In addition, they are accessible at system runtime.
The ontologies that are written using OWL syntax can be queried through RDF-based queries. These forms allow users to interact with knowledge repositories. RDF queries can be of different types, depending on the purpose of the user. For example, knowledge descriptions can be retrieved within ASK, SELECT or CONSTRUCT SPARQL queries [47] or even updated by executing INSERT, DELETE or MODIFY queries which are specified in a specific SPARQL extension i.e., SPARQL Update [48].
Furthermore, the explicit statements included in ontologies can lead to implicit knowledge within the use of reasoning engines, or reasoners. These entities evaluate and validate the links between semantic resources in order to infer new relationships, not envisioned at the design phase and/or veritable during runtime. To support reasoners to knowledge inference, semantic rules, e.g., Semantic Web Rule Language (SWRL) rules may be added on top of the ontological statements [49]. Some examples of applying reasoning in industrial context may be found in [50,51].

3. Approach

This section describes the main components that are required for implementing the approach and illustrates their interrelationships as not all components will interface with each other. Therefore, this section is used for describing some of the requirements for the implementation, which is presented in Section 4.

3.1. Main Components of the Approach

The approach consists of five main components that exchange information in order to provide the KPI visualization to the user. An architectural view diagram of the approach is presented in Figure 2, Principally, the diagram depicts the components and their interconnections. The five components are: The Knowledge based System Service, the Manufacturing Plant, the Orchestration Engine, the KPI Implementation and the User Interface, which is the component that provides the users with the visualization of selected KPIs. The implementation of the latter component was the task left as further work in [15], i.e., the principal contribution of this article. Besides the implementation of each component, the results shown in Section 5 illustrate the different graphs that are included in the user interface, which provides the visualization of KPIs.

3.1.1. Knowledge Based System Service

The Knowledge based System Service (KBSS) is a web server that hosts the KB, which is implemented within an ontology model. The main objective of the KBSS is to provide an interface for the KPI Implementation module to interact with the ontology for either requesting or updating semantic knowledge. The ontology model contains information about both the manufacturing plant and the KPIs. This approach considers the implementation of the ontology within RDF or OWL, as they are compatible. However, the latter might be better due to its level of descriptiveness, and the development of the web server using the Jena Fuseki (https://jena.apache.org/documentation/fuseki2/) server, which permits both the retrieval and update of RDF based models throughout a REST interface.
The ontology contains information about the manufacturing plant and the KPIs. To illustrate a possible model for describing manufacturing systems and the KPIs to be used for monitoring their performance, Figure 3 presents an UML class diagram that shows the main classes of the ontology designed for this research work. As it can be seen in such diagram, the model is composed by three main classes: KPI, KPI Variable and Equipment which, in turn, has several subclasses that describe different types of industrial equipment.
The KPI class describes the set of KPIs that are used for monitoring the performance of discrete processes, while the KPI Variable includes all the variables that are needed for each KPI equation. On the other hand, the Equipment class and its corresponding subclasses describe the components of the manufacturing system that perform physical operations. As this model has been used for describing a specific assembly line which is presented in following section, the subclasses Robot, Conveyor, Operational_Conveyor and Bypass_Conveyor match the equipment of such industrial system. Nevertheless, for a different scenario, this part of the model can be changed accordingly. This is one of the clear advantages of using ontologies as they can be easily reused and adapted to the system to be described. Still, the three main classes i.e., Equipment, KPI and KPI Variable both hierarchical and relational structure could remain as previously described without affecting the visualization of KPIs.

3.1.2. Manufacturing Plant

The Manufacturing Plant revolves around the computation of KPIs for the specific system. In fact, even though the component is named as Manufacturing Plant, this approach would be consistent with a smaller system that the user wants to monitor. In other words, the Manufacturing Plant component represents the industrial equipment to be monitored which may or may not compose a large system.
Manufacturing plants use raw materials or components and convert them into useful finished goods with help of certain resources by performing a sequence of operations and tasks on them. This approach targets retrofitted manufacturing plants that are capable to notify about occurrences during processes, such as the ones with WS enabled technology [53]. If the plant is capable of reporting about executed operations, it will serve as the source of events and data, in runtime, that will be utilized for the calculation of KPIs and the population of the KB.
In particular and as a test bed, this research work used a multi-robot assembly line that simulates the assembly of different mobile phones variants throughout drawing operations. This is further explained in the following Section.

3.1.3. Orchestration Engine

The main objective of the Orchestration Engine is to execute production orders of the manufacturing plant. First, either a plant user or a production planner will specify production orders according to the requirements from customers. These orders will contain specific characteristics of the products to be manufactured. Thus, the attributes of the orders will be specific for each system and the corresponding output. For example, as described in the following section, this research work considers orders the drawing of mobile phones parts, the production order will be formed by attributes such as quantity, recipe and color of the parts to be drawn.
The Orchestrator Engine executes production orders of the manufacturing plant as per requirements and specification by orchestrating the process flow. The design of the Orchestration Engine can vary with the communication protocols and interfaces of manufacturing system components [54]. In this research work, the Orchestrator Engine subscribes to all the events of the production line, which was retrofitted with WS technology [53], and thereafter it executes all the needed tasks to be performed on each product.

3.1.4. KPI Implementation

The KPI Implementation components contains the formulas for the KPIs defined in the ISO 22400-2. It implements these formulas using the incoming data from the knowledge-based system. In addition, this component receives notifications of events from the Manufacturing Plant in runtime and it extracts useful information (i.e., values that are needed for KPI calculations) from the production line. Then, the extracted data is sent to the KBSS for updating the KB. Once the model is populated, the KPI formulas are applied. This means that whenever the data is updated and all required values are received, the corresponding formulas will be applied. Finally, the updated KPI values are sent to the user interface for visualization.

3.1.5. User Interface

The main objective of the User Interface is the KPI visualization for system users. This is of great importance not only for production planners but also for the top-level management users. This component receives data from the KPI Implementation component in system runtime and, then, displays the data in form of different visual graphs such as pie charts, column charts and bar graphs. In addition, the User Interface permits users to customize the KPI visualization according to its requirements. The implementation and resulting graphs of this component are presented in further sections.

4. Implementation

As described in previous section, this approach could be applied in different types of manufacturing plants and/or industrial systems. In this context, the objective of this section is to present the implementation of the components in a specific use case. First, the selected testbed is presented. Afterwards, the section shows how to implement selected KPIs for both calculation and visualization.

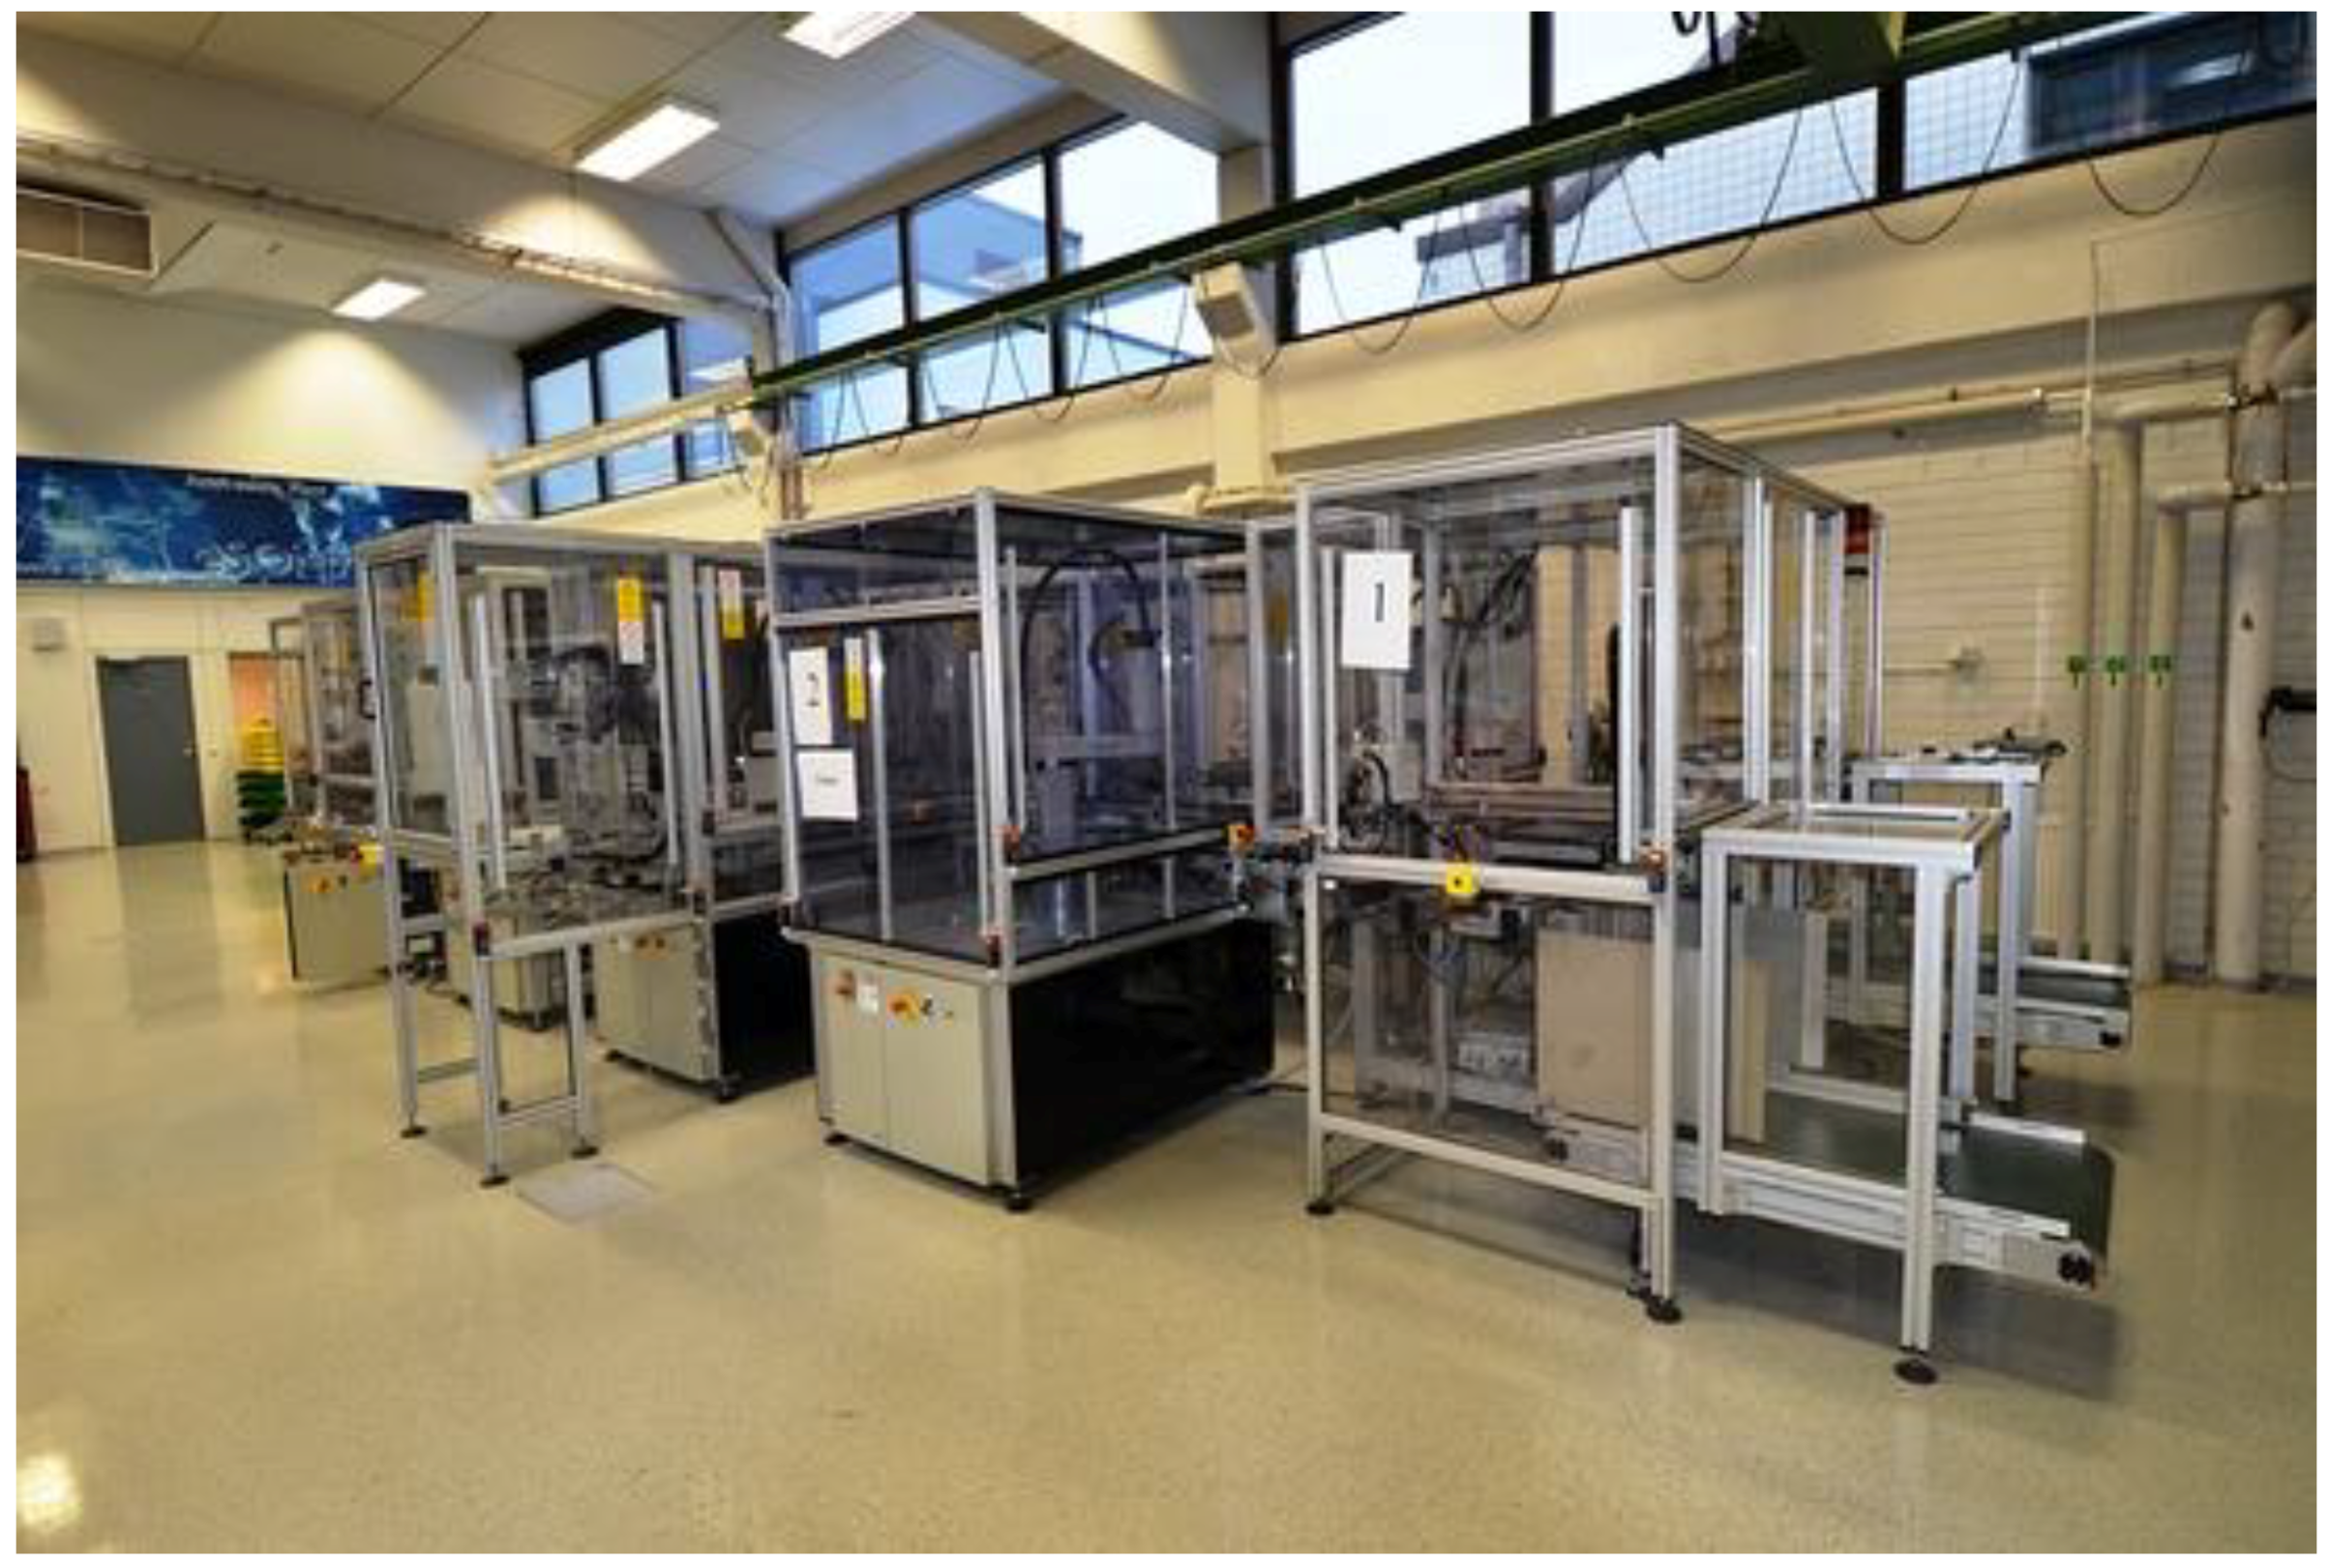
4.1. FASTory Simulator as Use Case

The selected testbed for demonstrating the visualization of KPIs is a multi-robot assembly line known as the FASTory line, which is used for teaching and research purposes. This system is located at the Factory Automation Systems and Technologies Laboratory (FAST-Lab.), which belongs to the Tampere University of Technology, located in Tampere, Finland. The FASTory line was used for assembling mobile phone parts. Later, the end effector of robots was modified in order to perform drawing operations for painting different variants of mobile phones composed by three different parts: frame, screen and keyboard. Due to the colors, different parts, and different models of parts, the FASTory line can produce a total of 729 different product variations. The FASTory line is shown in Figure 4.
The FASTory line consists of 12 workstations out of which 10 (i.e., WS2, WS3, WS4, WS5, WS6, WS7, WS8, WS9, WS10, WS11 and WS12) are identical workstations composed by a SCARA robot that holds pen, used for drawing parts of mobile phone, and conveyor segments, used for transporting pallets through the different manufacturing working cells. While Workstation 1 (WS1) incorporates a robot with a vacuum gripper for loading/storing papers to/from pallets, the Workstation 7 (WS7) consists of (1) a table for manual operation in order to load or unload empty pallets and (2) a screen where the operator can monitor the ongoing processes in the line.
Each workstation with the function of drawing have two set of conveyors. First, the main conveyor that routes the pallet to the working position of cells for robots to perform drawing operations. Second, for balancing the load of the line, a bypass conveyor is used for routing pallets to the next work station without passing through the working position of cells.
For sensing purposes, there are two types of sensors on each workstation. First, a presence sensor is used to detect the presence of the pallet. Second, RFID readers are placed at the entrance of each workstation for recognition of pallets that can be retained within a stopper at each zone of the work cell. The FASTory line utilizes S1000 controllers (i.e., WS-enabled remote terminal units) installed at each workstation. These devices send RESTful post requests for notifying about any triggered events. The notifications of events are exposed as web services and, more precisely, current configuration permits both SOAP and REST interfaces.
Furthermore, to avoid the potential risks, mechanical and electrical problems related to the assembly line and, in turn, in order to reduce the setup time and running costs, a simulation of the real production line was developed. This was implemented as a web-based interface, named as the FASTory Simulator, that mimics the FASTory line operation [21].
The FASTory simulator was developed as a part of the eScop project (http://escop-project.eu/). The simulator is a web server that provides interaction via RESTful services and a user interface for visualization. In fact, due to the utilization of same technologies, this web interface may be connected to the real line and monitor, in runtime, the execution of operations. Figure 5 shows the FASTory Simulator. As this interface behaves similarly to the real line, this is the specific system that has been used as the testbed for demonstrating the KPI implementation and visualization.

4.2. Components Implementation, Interaction and KPI Formulas Calculation

This research work approach is demonstrated within a specific implementation for monitoring the performance of the FASTory line. One of the principal reasons of selecting the FASTory Simulator as the Manufacturing Plant component, shown in Figure 2, is its capability of mimicking the behavior of the assembly line [21]. The system KB, hosted by the KBSS, is implemented as an OWL ontology. The implemented components for this proof of concept, which can be mapped to the five components presented in Figure 2, are shown in Figure 6.
The KPI Implementation component has three major tasks to perform. Firstly, it listens to the incoming event notifications from the simulator interface. The communication between them is based on RESTful services. More precisely, the simulator interface sends a HTTP POST request whenever there is any change in the state of the simulator. These notifications include events related to the execution of robot drawing and conveyor transfer pallet operations. As previously described, WS7 is a manual workstation where a human operator loads and unloads pallet on it. Then, human operator working at WS7 sends Pallet Loaded or Pallet Unloaded notifications whenever any of these operations is performed throughout the web-based interface. On the other hand, as WS1 is dedicated for paper loading and unloading it sends notifications whenever papers are loaded/unloaded to/from the pallet. Furthermore, all other workstations send robot start or stop drawing, conveyor start or stop transferring and pen changed notifications depending on the operation that is performed by each workstation. An example of one event notification is given below in Figure 7.
As shown in the JSON-formatted event notification, while the MSG element contain the type of operation, the WS includes the number of the workstation performing such operation. Afterwards, the PalletID and ServiceID are identifiers for the pallet at which the task is performed and of the service respectively. Lastly, the Recipe element shows the recipe variation that is executed for the corresponding product.
Once the KPI Implementation component receives the event notification, it calculates the values using the variables of the KPIs formulas. More precisely, some required variables are: Actual Production Time (APT), Actual Unit Busy Time (AUBT), Produced Quantity (PQ), Good Quantity (GQ) and Scrap Quantity (SQ). In fact, the ISO 22400-2 standard [18] describes how these variables are calculated:
  • APT: Actual time in which the workstation adds some value to the final order. It is calculated as the time difference between the notification of RobotStartDrawing and RobotStopDrawing events.
  • AUBT: Actual time when a workstation is busy. It includes the time when the robot is drawing and the time when the conveyor is transferring the pallet to the drawing zone.
  • PQ: The quantity of produced products until that moment in time.
  • GQ: The good quantity is considered as the quantity that meets certain quality criteria. In this implementation, the quality criterion is kept at 80 percent.
  • SQ: The scrap quantity is considered as the quantity that falls below the quality criteria. Any product below the 80 percent quality criteria is considered as scrap quantity.
Besides the variables that are calculated form the production line, some other variables are planned by the production manager at the start of the production order execution. These variables are: Planned Busy Time (PBT), Planned Operation Time (POT) and Planned Order Execution Time (POET).
Moreover, the values of the described ISO 22400-2 KPI variables are updated in the RDF Store, i.e., the OWL model. The RDF store is populated via HTTP POST requests that contain the data of KPI variables. In addition, the KPI variables are linked to an individual timestamp, which allows filtering the query execution results e.g., by time order. After each update, the KPI Implementation component retrieves the new data from the RDF store throughout queries that are encapsulated via a HTTP GET requests. To illustrate this, Figure 8 and Figure 9 are specific examples of forms for retrieving and updating data, respectively. These queries are written according to the SPARQL and SPARQL Update specifications. Particularly, both queries are executed for one KPI variable from the implemented RDF store.
Once the data from the RDF store is updated, the KPI Implementation component executes the formulas of corresponding KPIs. For the selected testbed, five KPIs were selected due to its monitoring relevance. They are defined and calculated following the formulas provided by the ISO 22400-2 standards. The selected KPIs and their corresponding formulas are:
  • Allocation Efficiency: The ratio between the actual time that a work unit is busy and the planned busy time, which is estimated at the start of production shift.
    A l l o c a t i o n   E f f i c i e n c y = A c t u a l   U n i t   B u s y   T i m e   P l a n n e d   B u s y   T i m e
  • Utilization efficiency: It is calculated as the ratio between the productive time that a work unit is working and the actual time that a work unit is busy.
    U t i l i z a t i o n   E f f i c i e n c y = A c t u a l   P r o d u c t i o n   T i m e   A c t u a l   U n i t   B u s y   T i m e
  • Availability: It shows the fraction of time that a work unit is adding value with respect to the initially planned busy time for such work unit.
    A v a i l a b i l i t y = A c t u a l   P r o d u c t i o n   T i m e   P l a n n e d   B u s y   T i m e
  • Quality Ratio: It is calculated as the ratio between the good quantity that meets the quality criteria and the total produced quantity.
    Q u a l i t y   R a t i o = G o o d   Q u a n t i t y   P r o d u c e d   Q u a n t i t y
  • Scrap Ratio: It is the inverse of quality ratio i.e., computed as the ratio between scrap quantity that did not fulfil the quality criteria and the total produced quantity.
    S c r a p   R a t i o = S c r a p   Q u a n t i t y   P r o d u c e d   Q u a n t i t y
After computing the value of each KPI, the data is sent to the User Interface via Socket.io interface. Then, the User Interface will process such information and create a useful and friendly visualization for the end user. The complete flow of messages exchanged between the implemented components is presented within a UML sequence diagram in Figure 10.
The UML diagram presents the process of creating the KPI visualization to end users. This process starts with the event notifications, which are triggered at the Manufacturing Plant (i.e., FASTory Simulator) and ends with the updated KPI data that is finally sent to the User Interface in order to display the graphs. In fact, the very first action for the process to start should be the placement of a production order to be received by the Orchestrator Engine that, in turn, would subscribe to corresponding event notifications. On the other hand, the update and retrieval of KPI data will be done each time when a new notification is received. Thus, the KPI Implementation component will repeat the process of updating and querying the model. This will lead to the execution of the KPI formulas and sending the updated data to the User Interface. Such behavior ensures that the system performance is monitored at runtime.

5. Results

This section presents the results obtained after implementing the proposed approach in the testbed. The results are focused in the previously described KPIs, due to its relevance for the selected testbed.

5.1. KPI Variables and KPI Results for a Specific Production Order

As mentioned in previous section, five KPIs of the ISO 22400-2 standards are implemented. After running a sample production order of 200 mobile phones, the values for the KPI variables are the ones shown in Table 2.
The values obtained for the KPI variables shown in Table 2 were used in the KPI formulas that are presented in previous section. Following Table 3 shows the results for the KPIs were obtained for the example production order on the testbed.
Once the results for each KPI have been presented, the visualization of each one can be shown. As stated before, the approach permits the customization of graphs for the user to visualize the KPIs as desired. This section focuses on showing the graphs that are displayed in the interface. To show several graph types, the selected KPIs are depicted below within different graphs.

5.2. Visualizing the KPIs

The first KPI shown in Table 3 is the Availability with a value of 66.6%. The pie chart shown in Figure 11 depicts such KPI of a particular FASTory line resource i.e., the Robot 1. For the corresponding KPI variable, the total production time used in the Availability Formula (3) only includes the productive time used in manufacturing excluding all other times associated with the work unit such as the time for transferring pallets from one workstation to another.
The second KPI shown in Table 3 is the Allocation Efficiency of 82.3%. The pie chart shown in Figure 12 illustrates such KPI for the same resource i.e., the Robot 1. In fact, it is visible that the percentage of the Availability KPI for Robot 1 is less than the Allocation Efficiency. Such increase in percentage is because of the fact that Allocation Efficiency does not only include the actual production time, but also the time taken by a work unit in transferring and queuing operations. Moreover, the general trend for the Allocation Efficiency is that the higher its values, the better it is for production.
Availability along with Allocation Efficiency are very important in terms of production planning and scheduling because they offer a significant view about the amount of productive time in the total busy time.
The third KPI shown in Table 3 is the Utilization Efficiency of 80.9%. The pie chart shown in Figure 13 illustrates such KPI, also for Robot 1. Then, this demonstrates that the 80.9% of actual production of products of the Actual unit busy time is spent in WS1 (because is the workstation that includes Robot 1) while the remaining 19.1% is spent in transferring and queuing operations.
As described at the beginning of this section, the tested production order consists of 200 mobile phones. From the ordered 200 products, 68 are scrapped and the other 132 meet the quality criteria of 80%. As shown in Table 3, quantitatively, this results into a 66% of Quality Ratio and 34% of Scrap Ratio. This may be seen in the bar graph of Figure 14, which indicates the Quality Ratio of the production order that is under execution in runtime.
Each bar in Figure 14 shows the Quality Ratio in runtime. With the production of a new product, its quality ratio is checked with the standard criteria and then the updated quality ratio is calculated with the formula given in (4). This updated value is then translated into a bar chart in runtime, hence, giving an overall view of the quality of production orders. In comparison to previously shown pie charts, bar graphs are another variety of graphs that the user can select for visualizing KPIs. The last one to be shown in this article is a line chart.
The fifth KPI shown in Table 3 is the Scrap Ratio of 34.0%. The line chart shown in Figure 15 provides the visualization of the production order Scrap Ratio on system runtime. The Scrap Ratio for the sample production order is 34.0% at the end of the order. All those products that did not fulfill the quality criteria increment the scrap quantity. Moreover, the Scrap Ratio KPI is important as it facilitates the recognition of defective resources in the production line. This may be noticeable if the graphs show very unusual behavior over a specific period of time. Besides, the Scrap Ratio KPI helps in identifying the quantity of products which may need a rework.

5.3. Discussion of Results

The KPIs implemented in this research work permit the monitoring of the performance and actual status of the FASTory line, as an example, in runtime. The Availability KPI shown in Figure 11 illustrates the ratio between the productive time and the planned busy time for Robot 1. Productive time is considered as the time when the resources add some value to the end product. The Availability depicts the amount of capacity of a work unit that is used for the production order in relation to the available capacity. The Allocation Efficiency KPI shown in Figure 12 presents the total busy time of the workstation during the execution of a specific production order. In addition, it includes all the queuing and transport time of the workstation besides the productive time. The allocation efficiency indicates how strongly the planned capacity of the work unit is utilized and how much planned capacity of a specific resource can still be used. The production managers tend to increase the Availability and Allocation Efficiency as much as possible in order to efficiently utilize the production capacity.
On the other hand, Figure 13 shows Utilization Efficiency KPI illustrates the ratio between the amount of time the workstation is productive and the total amount of busy time of the workstation that includes the queuing and transportation time of each workstation. This indicator identifies the productivity of work units. Because only the production time affects an added value which will be paid by the market, the goal should be to get a high indicator value. Higher values of Utilization Efficiency are appreciated across the production units as it indicates the productivity of work units.
Further, Figure 14 and Figure 15 describe the Quality Ratio and Scrap Ratio of the whole production line at different time intervals, respectively. Every time a new product is produced, the KPI shows the value of the Quality and Scrap Ratio in runtime. The final produced products are categorized as good quantity and scrap quantity, depending on whether they meet the initially assigned quality criteria. The goal in every production line is to get a higher value of Quality Ratio indicator and lower value of Scrap Ratio indicator.
These KPIs will enable the users of the presented implementation, such as production managers to analyze each resource in the production line. The implemented KPIs do not only help in monitoring production performance, but also provide a better management of different production level activities such as production scheduling, allocation of resources and distribution of production load across different resources. In addition, the detection of specific equipment malfunction may be another benefit of the presented implementation e.g., throughout the understanding of the results of Scrap Ratio KPI for specific workstations.

6. Conclusions

Previously, an approach for implementing key performance indicators based on the ISO 22400 standard was presented in [15]. However, the authors left as further work the implementation of KPI visualization. This research work extends the aforementioned research work by demonstrating the visualization of selected ISO 22400 KPIs. Therefore, this article provides an approach that can be implemented for providing users with a tool for visualization of KPIs, which are updated in system runtime by the consumption of manufacturing plant event notifications and the retrieval and update of knowledge from and to an ontology, respectively.
The selected KPIs for demonstrating the success of the approach are defined in the ISO 22400-1 & 2 standards [13,18] and are tested on an industrial system i.e., the FASTory line. This research work serves as a paving step towards implementing and visualizing the ISO 22400 standard KPIs in production industry for monitoring and decision-making. The approach is presented in a generic manner with the objective that the main components may be implemented to be used in different industrial scenarios.
Further, this research work will be extended by the implementation of both ISO 22400 KPIs and other unexplored yet standards by following the described approach in order to permit users the visualization of the system performance. In addition, the authors plan to investigate how the explicit statements included in the ontology may benefit the inference of implicit knowledge that could allow obtaining new information to be displayed in current graphs. Finally, the current solution will be implemented to be deployable as an application to be used in both research and educational activities.

Author Contributions

Conceptualization, J.L.M.L. and B.R.F.; Methodology, B.R.F. and W.M.M.; Software, U.M. and W.M.M.; Validation, U.M. and W.M.M.; Investigation, U.M., B.R.F. and W.M.M.; Resources, J.L.M.L., B.R.F. and W.M.M.; Writing—Original Draft Preparation, U.M. and B.R.F.; Writing—Review & Editing, B.R.F. and W.M.M.; Supervision, B.R.F., W.M.M. and J.L.M.L.; Project Administration, B.R.F., W.M.M. and J.L.M.L.; Funding Acquisition, J.L.M.L.

Funding

The research leading to these results has received funding from the European Union’s Horizon 2020 research and innovation program under grant agreement no. 636909, correspondent to the project shortly entitled C2NET, Cloud Collaborative Manufacturing Networks.

Conflicts of Interest

The authors declare no conflict of interest.

References

  1. Kosicka, E.; Kozłowski, E.; Mazurkiewicz, D. Intelligent Systems of Forecasting the Failure of Machinery Park and Supporting Fulfilment of Orders of Spare Parts. In Proceedings of the Intelligent Systems in Production Engineering and Maintenance (ISPEM 2017), Wrocław, Poland, 28–29 September 2017; pp. 54–63. [Google Scholar]
  2. Gola, A. Genetic-Based Approach to Production Planning with Minimization Cost of Manufacturing. Actual Probl. Econ. 2014, 153, 205–212. [Google Scholar]
  3. Sobaszek, Ł.; Gola, A.; Świć, A. Predictive Scheduling as a Part of Intelligent Job Scheduling System. In Proceedings of the Intelligent Systems in Production Engineering and Maintenance (ISPEM 2017), Wrocław, Poland, 28–29 September 2017; pp. 358–367. [Google Scholar]
  4. Gama, K.T.; Cavenaghi, V. Measuring performance and Lean Production: A review of literature and a proposal for a performance measurement system. In Proceedings of the 20th Annual Conference of Production and Operation Management Society (POMS), Orlando, FL, USA, 1–4 May 2009. [Google Scholar]
  5. International Society of Automation (ISA). ISA-95.00.03-2005 Enterprise-Control System Integration Part 3: Activity Models of Manufacturing Operations Management; ISA: Research Triangle Park, NC, USA, 2005. [Google Scholar]
  6. Ankrah, E.; Mensah, C.C.Y. Measuring Performance in Small and Medium Scale Enterprises in the Manufacturing Industry in Ghana. Int. J. 2015, 2, 34–43. [Google Scholar]
  7. Mohammed, W.M.; Ferrer, B.R.; Jose, L.; Lastra, M. Configuring and visualizing the data resources in a cloud-based data collection framework. In Proceedings of the 2017 International Conference on IEEE Engineering, Technology and Innovation (ICE/ITMC), Madeira, Portugal, 25–28 June 2017; pp. 1201–1208. [Google Scholar]
  8. Rakar, A.; Zorzut, S.; Jovan, V. Assessment of Production Performance by Means of KPI. In Control 2004; University of Bath: Bath, UK, 2004. [Google Scholar]
  9. Mabkhot, M.M.; Al-Ahmari, A.M.; Salah, B.; Alkhalefah, H. Requirements of the Smart Factory System: A Survey and Perspective. Machines 2018, 6, 23. [Google Scholar] [CrossRef]
  10. Mohammed, W.M.; Ferrer, B.R.; Martinez, J.L.; Sanchis, R.; Andres, B.; Agostinho, C. A multi-agent approach for processing industrial enterprise data. In Proceedings of the IEEE International Conference on Engineering, Technology and Innovation, Stuttgart, Germany, 17–20 June 2018; pp. 1209–1215. [Google Scholar]
  11. García, C.A.; Castellanos, E.X.; García, M.V. UML-Based Cyber-Physical Production Systems on Low-Cost Devices under IEC-61499. Machines 2018, 6, 22. [Google Scholar] [CrossRef]
  12. Zhang, B.; Postelnicu, C.; Lastra, J.L.M. Key Performance Indicators for energy efficient asset management in a factory automation testbed. In Proceedings of the IEEE 10th International Conference on Industrial Informatics, Beijing, China, 25–27 July 2012; pp. 391–396. [Google Scholar]
  13. International Standard ISO 22400-1. Automation Systems and Integration—Key Performance Indicators (KPIs) for Manufacturing Operations Management—Part 1: Overview, Concepts and Terminology; International Standard Organization (ISO): Geneva, The Switzerland, 2014. [Google Scholar]
  14. MESA International. Key Performance Indicator Markup Language; Version 1; MESA International: Chandler, AZ, USA, 2015. [Google Scholar]
  15. Muhammad, U.; Ferrer, B.R.; Mohammed, W.M.; Lastra, J.L.M. An approach for implementing key performance indicators of a discrete manufacturing simulator based on the ISO 22400 standard. In Proceedings of the 2018 IEEE Industrial Cyber-Physical Systems (ICPS), St. Petersburg, Russia, 15–18 May 2018; pp. 629–636. [Google Scholar]
  16. Glavan, L.M. Understanding Process Performance Measurement Systems. Bus. Syst. Res. 2011, 2, 25–38. [Google Scholar] [CrossRef]
  17. Bennett, M.; James, P.; Klinkers, L. Sustainable Measures—Evaluation and Reporting of Environmental and Social Performance. Int. J. Sustain. High. Educ. 2000, 1, 885–913. [Google Scholar] [CrossRef]
  18. International Standard ISO 22400–2. Automation Systems and Integration—Key Performance Indicators (KPIs) for Manufacturing Operations Management—Part 2: Definitions and Descriptions; International Standard Organization (ISO): Geneva, The Switzerland, 2014. [Google Scholar]
  19. Arkadiusz, G.; Aleksander, N. Application of OEE Coefficient for Manufacturing Lines Reliability Improvement. In Proceedings of the 2017 International Conference on Management Science and Management Innovation (MSMI 2017), Suzhou, China, 23–25 June 2017. [Google Scholar]
  20. Durán, O.; Capaldo, A.; Acevedo, P.A.D. Sustainable Overall Throughputability Effectiveness (S.O.T.E.) as a Metric for Production Systems. Sustainability 2018, 10, 362. [Google Scholar] [CrossRef]
  21. Mohammed, W.M.; Lobov, A.; Ferrer, B.R.; Iarovyi, S.; Lastra, J.L.M. A web-based simulator for a discrete manufacturing system. In Proceedings of the 42nd Annual Conference of the IEEE Industrial Electronics Society (IECON 2016), Florence, Italy, 23–26 October 2016; pp. 6583–6589. [Google Scholar]
  22. Martin, C.; Freund, M.; Braune, A.; Ebert, R.E.; Pleßow, M.; Severin, S.; Stern, O. Integrated design of Human-Machine Interfaces for production plants. In Proceedings of the 2015 IEEE 20th Conference on Emerging Technologies Factory Automation (ETFA), Luxembourg, 8–11 September 2015; pp. 1–6. [Google Scholar]
  23. Derhamy, H.; Rönnholm, J.; Delsing, J.; Eliasson, J.; van Deventer, J. Protocol interoperability of OPC UA in service oriented architectures. In Proceedings of the 2017 IEEE 15th International Conference on Industrial Informatics (INDIN), Emden, Germany, 24–26 July 2017; pp. 44–50. [Google Scholar]
  24. Yun, Z.; Junjie, L.; Ji, C.; Hua, W. A framework research of power distribution equipment condition monitoring cloud platform based on RESTful web service. In Proceedings of the 2017 IEEE Conference on Energy Internet and Energy System Integration (EI2), Beijing, China, 26–28 November 2017; pp. 1–6. [Google Scholar]
  25. Nugroho, L.E.; Azis, A.; Mustika, I.W.; Selo. Development of RESTful API to support the oil palm plantation monitoring system. In Proceedings of the 2017 7th International Annual Engineering Seminar (InAES), Yogyakarta, Indonesia, 1–2 August 2017; pp. 1–5. [Google Scholar]
  26. Martino, B.D.; Esposito, A.; Maisto, S.A.; Nacchia, S. A semantic IoT framework to support RESTful devices’ API interoperability. In Proceedings of the 2017 IEEE 14th International Conference on Networking, Sensing and Control (ICNSC), Calabria, Italy, 16–18 May 2017; pp. 78–83. [Google Scholar]
  27. Ferrer, B.R.; Mohammed, W.M.; Chen, E.; Lastra, J.L.M. Connecting web-based IoT devices to a cloud-based manufacturing platform. In Proceedings of the 43rd Annual Conference of the IEEE Industrial Electronics Society (IECON 2017), Beijing, China, 29 October–1 November 2017; pp. 8628–8633. [Google Scholar]
  28. Iarovyi, S.; Mohammed, W.M.; Lobov, A.; Ferrer, B.R.; Lastra, J.L.M. Cyber–Physical Systems for Open-Knowledge-Driven Manufacturing Execution Systems. Proc. IEEE 2016, 104, 1142–1154. [Google Scholar] [CrossRef]
  29. Mohammed, W.M.; Ferrer, B.R.; Iarovyi, S.; Negri, S.; Fumagalli, N.; Lobov, A.; Lastra, J.L.M. Generic platform for manufacturing execution system functions in knowledge-driven manufacturing systems. Int. J. Comput. Integr. Manuf. 2018, 31, 262–274. [Google Scholar] [CrossRef]
  30. Balda, P.; Štětina, M. eScop Project Physical Layer Development—An INCAS Mini-pilot Case Study. In Open Knowledge-Driven Manufacturing & Logistics, The Escop Approach; Strzelczak, S., Balda, P., Garetti, M., Lobov, A., Eds.; Warsaw University of Technology Publishing House: Warsaw, Poland, 2015; pp. 369–382. [Google Scholar]
  31. BECKHOFF. New Automation Technology. Available online: https://www.beckhoff.com/ethercat/ (accessed on 21 July 2018).
  32. OPC Ua Speeds Up the Digitalization. Available online: https://www.siemens.com/global/en/home/products/automation/industrial-communication/opc-ua.html (accessed on 21 July 2018).
  33. NJ5 Controller with OPC UA: Open Communication FROM Machine to IT System. Available online: https://industrial.omron.eu/en/solutions/product-solutions/nj5-controller-with-opc-ua (accessed on 21 July 2018).
  34. Leading Automation and Information Technology Suppliers Drive OPC UA TSN for Unified IIoT Communication to the Controller Level. Available online: http://www.abb.com/cawp/seitp202/288ccf9454f992b9c1258074002d93ec.aspx (accessed on 21 July 2018).
  35. Boville, J.; Lane, T.; Electric, S. How the Industrial Internet of Things Will Help System Integrators Deliver on the Promise of the Connected Enterprise; Schneider Electric, 2017. Available online: https:// download.schneider-electric.com/files?p_enDocType=White+Paper&p_File_Name=998-19924813_GMA-US_letter.pdf&p_Doc_Ref=998-19924813 (accessed on 24 August 2018).
  36. Ferrer, B.R.; Mohammed, W.M.; Lobov, A.; Galera, A.M.; Lastra, J.L.M. Including human tasks as semantic resources in manufacturing ontology models. In Proceedings of the 43rd Annual Conference of the IEEE Industrial Electronics Society (IECON 2017), Beijing, China, 29 October–1 November 2017; pp. 3466–3473. [Google Scholar]
  37. Best Manufacturing Execution System (MES Software) | Aegis Software. Available online: https://www.aiscorp.com/en/ (accessed on 21 July 2018).
  38. 42Q | Cloud-Based MFG Execution System (MES) Modules—MES+ Module. 42Q. Available online: https://www.42-q.com/products/mes/ (accessed on 24 August 2018).
  39. Smart Factory with Web-Based MES by INCLUDIS. Available online: https://www.includis.com/en/landingpage-2/ (accessed on 21 July 2018).
  40. Manufacturing Execution System | What Is MES. iBASEt. Available online: https://www.ibaset.com (accessed on 24 August 2018).
  41. Ferrer, B.R.; Mohammed, W.M.; Lastra, J.L.M. A solution for processing supply chain events within ontology-based descriptions. In Proceedings of the 42nd Annual Conference of the IEEE Industrial Electronics Society (IECON 2016), Florence, Italy, 23–26 October 2016; pp. 4877–4883. [Google Scholar]
  42. Ramis, B.; Gonzalez, L.; Iarovyi, S.; Lobov, A.; Lastra, J.L.M.; Vyatkin, V.; Dai, W. Knowledge-based web service integration for industrial automation. In Proceedings of the 2014 12th IEEE International Conference on Industrial Informatics (INDIN), Porto Alegre, Brazil, 27–30 July 2014; pp. 733–739. [Google Scholar]
  43. Brachman, R.J.; Levesque, H.J.; Pagnucco, M. Knowledge Representation and Reasoning; Morgan Kaufmann: Burlington, MA, USA, 2004. [Google Scholar]
  44. Gruber, T.R. Toward principles for the design of ontologies used for knowledge sharing. Int. J. Hum. Comput. Stud. 1993, 43, 907–928. [Google Scholar] [CrossRef]
  45. Kalibatiene, D.; Vasilecas, O. Survey on Ontology Languages. In Perspectives in Business Informatics Research; Springer: Berlin/Heidelberg, Germany, 2011; pp. 124–141. [Google Scholar]
  46. OWL Web Ontology Language Reference. Available online: https://www.w3.org/TR/owl-ref/ (accessed on 21 July 2018).
  47. SPARQL Query Language for RDF. Available online: https://www.w3.org/TR/rdf-sparql-query/ (accessed on 1 June 2017).
  48. SPARQL 1.1 Update. Available online: https://www.w3.org/TR/sparql11-update/ (accessed on 1 April 2017).
  49. SWRL: A Semantic Web Rule Language Combining OWL and RuleML. Available online: https://www.w3.org/Submission/SWRL/ (accessed on 1 November 2017).
  50. Ferrer, B.R.; Iarovyi, S.; Lobov, A.; Lastra, J.L.M. Towards processing and reasoning streams of events in knowledge-driven manufacturing execution systems. In Proceedings of the 2015 IEEE 13th International Conference on Industrial Informatics (INDIN), Cambridge, UK, 22–24 July 2015; pp. 1075–1080. [Google Scholar]
  51. Samirmi, F.D.; Tang, W.; Wu, H. Power transformer condition monitoring and fault diagnosis with multi-agent system based on ontology reasoning. In Proceedings of the 2013 IEEE PES Asia-Pacific Power and Energy Engineering Conference (APPEEC), Kowloon, China, 8–11 December 2013; pp. 1–6. [Google Scholar]
  52. Usman, M. An Implementation of KPI-ML to a Multi-Robot Line Simulator. Master’s Thesis, Tampere University of Technology, Tampere, Finland, 2017. [Google Scholar]
  53. Moctezuma, L.E.G.; Jokinen, J.; Postelnicu, C.; Lastra, J.L.M. Retrofitting a factory automation system to address market needs and societal changes. In Proceedings of the IEEE 10th International Conference on Industrial Informatics, Beijing, China, 25–27 July 2012; pp. 413–418. [Google Scholar]
  54. Mohammed, W.M. Encapsulation of MES Functionalities as RESTful Web Services for Knowledge-Driven Manufacturing Systems. Master’s Thesis, Tampere University of Technology, Tampere, Finland, 2017. [Google Scholar]
Figure 1. XML Implementation of the KPI description in ISO 22400-2 [14,18].
Machines 06 00039 g001
Figure 2. The five main components of the approach.
Machines 06 00039 g002
Figure 3. UML class diagram of the ontology, modified from [52].
Machines 06 00039 g003
Figure 4. The FASTory line.
Machines 06 00039 g004
Figure 5. The FASTory Simulator (http://escop.rd.tut.fi:3000/).
Machines 06 00039 g005
Figure 6. Interaction of components, modified from [52].
Machines 06 00039 g006
Figure 7. Event notification received form the FASTory Simulator.
Machines 06 00039 g007
Figure 8. An example of SPARQL Update query for inserting KPI data.
Machines 06 00039 g008
Figure 9. An example of SPARQL query for selecting specific data from the RDF store.
Machines 06 00039 g009
Figure 10. UML sequence diagram of components interaction for KPI visualization.
Machines 06 00039 g010
Figure 11. Availability KPI of Robot 1.
Machines 06 00039 g011
Figure 12. Allocation Efficiency KPI of Robot 1.
Machines 06 00039 g012
Figure 13. Utilization Efficiency KPI of Robot 1.
Machines 06 00039 g013
Figure 14. Quality Ratio KPI of the order produced.
Machines 06 00039 g014
Figure 15. Scrap Ratio KPI of the order produced.
Machines 06 00039 g015
Table 1. Structure of KPI description [18].
KPI Description
Content
NameName of the KPI
IDA user defined unique identification of the KPI in the user environment
DescriptionA brief description of the KPI
ScopeIdentification of the element that the KPI is relevant for, which can be a work unit, work center or production order, product or personnel
FormulaThe mathematical formula of the KPI specified in terms of elements
Unit of measureThe basic unit or dimension in which the KPI is expressed
RangeSpecifies the upper and lower logical limits of the KPI
TrendIs the information about the improvement direction, higher is better or lower is better
Context
TimingA KPI can be calculated either in
  • real-time: after each new data acquisition event
  • on demand: after a specific data selection request
  • periodically: done at a certain interval, e.g., once per day
AudienceAudience is the user group typically using this KPI. The user groups used in this part of ISO 22400 are
  • Operators: personnel responsible for the direct operation of the equipment
  • Supervisors: personnel responsible for directing the activities of the operators
  • Management: personnel responsible for the overall execution of production
Production methodologySpecifies the production methodology that the KPI is generally applicable for
  • Discrete
  • Batch
  • Continuous
Effect model diagramThe effect model diagram is a graphical representation of the dependencies of the KPI elements that can be used to drill down and understand the source of the element values
NOTE This is a quick analysis which supports rapid efficiency improvement by corrective actions, and thus reduces errors
Notes
  • Can contain additional information related to the KPI. Typical examples are
  • Constraints
  • Usage
  • Other information
Table 2. KPIs Variables after executing an example production order.
KPI VariablesResults
Actual Unit Busy Time49.38 min
Actual Production Time39.96 min
Planned Busy Time60.00 min
Scrap Quantity68
Good Quantity132
Produced Quantity200
Table 3. KPIs results obtained after executing an example production order.
KPIsResults
Availability66.6%
Allocation Efficiency82.3%
Utilization Efficiency80.9%
Quality Ratio66.0%
Scrap Ratio34.0%

