Article

Experimental and Numerical Analysis of the Dynamical Behavior of a Small Horizontal-Axis Wind Turbine under Unsteady Conditions: Part I

by
Francesco Castellani
*,†,
Davide Astolfi
,
Matteo Becchetti
and
Francesco Berno
Department of Engineering, University of Perugia, Via G. Duranti 93, 06125 Perugia, Italy
*
Author to whom correspondence should be addressed.
These authors contributed equally to this work.
Machines 2018, 6(4), 52; https://doi.org/10.3390/machines6040052
Submission received: 25 September 2018 / Revised: 24 October 2018 / Accepted: 25 October 2018 / Published: 30 October 2018

Abstract

:
An efficient and reliable exploitation of small horizontal-axis wind turbines (HAWT) is a complex task: these kinds of devices actually modulate strongly variable loads with rotational speeds of the order of hundreds of revolutions per minute. The complex flow conditions to which small HAWTs are subjected in urban environments (sudden wind direction changes, considerable turbulence intensity, gusts) make it very difficult for the wind turbine control system to optimally balance the power and the load. For these reasons, it is important to comprehend and characterize the behavior of small HAWTs under unsteady conditions. On these grounds, this work is devoted to the formulation and realization of controlled unsteady test conditions for small HAWTs in the wind tunnel. The selected test case is a HAWT having 3 kW of maximum power and 2 m of rotor diameter: in this work, this device is subjected to oscillating wind time series, with a custom period. The experimental analysis allows therefore to characterize how unsteadiness is amplified moving from the primary resource (the wind) through the rotor revolutions per minute to final output (the power), in terms of delay and amplitude magnification. This work also includes a numerical characterization of the problem, by means of aeroelastic simulations performed with the FAST software. The comparison between experiments and numerical model supports the fact that the fast transitions are mainly governed by the aerodynamic and mechanical parameters: therefore, the aeroelastic modeling of a small HAWT can be useful in the developing phase to select appropriately the design and the control system set up.

1. Introduction

Small HAWT technology is still nowadays affected by a considerable range of criticality [1], basically dictated by the fact that it is mostly targeted for domestic use:
  • the size of the devices should be small enough for the domestic exploitation, possibly in urban environments;
  • the components and the materials should be cheap enough that the market price is affordable to very small-scale investors [2];
  • the control system [3] should be simple and smart enough (hence, for example, commonly small HAWTs have fixed blade pitch) that users without technical expertise can manage the device;
  • in the design and prototype testing phase, an in-depth vibration control study [4,5,6] should be performed, in order for the device to meet the expectations for the use in urban environments in terms of low noise intensity and reliable safety;
  • the efficiency of the HAWT should be good enough that the public opinion matures a positive attitude towards this kind of technology, counteracting the prejudice according to which it intrinsically performs poorly [7,8].
In order to meet the above requirements, small HAWTs commonly result in being mechanical devices modulating highly variable loads with a small size and a considerable rotational speed: actually, to obtain acceptable values of the ratio between the extracted power and the power carried by the wind (summarized in the power factor C P = P 1 2 ρ A v 3 , where P is the extracted power, ρ is the air density, A is the blade swept area and v is the undisturbed wind speed facing the rotor), a small HAWT needs to have rotational speed of the order of several hundreds of revolutions per minute. Furthermore, the urban environment [9] poses several challenges because of the features of the complex wind flow (sudden wind direction changes [10], gusts and wind veer induced by obstacles like nearby buildings [11], turbulence [12,13]) and the full conversion of the resource is almost impossible because the wind turbine is not able to optimally follow the wind fluctuations exactly balancing the power production and the electrical load. This fact is supported, for example, in [14], where the capability of a turbine to effectively adapt its rotational speed in order to satisfy a prescribed control strategy is investigated in light of two parameters: the required rotor acceleration and the available rotor acceleration. A new bound for a reliable estimation of the amount of energy a wind turbine will generate in a specific site is proposed, based on the characteristic time scales of the wind turbine and of the wind resource on site. This suggests that the a priori estimates of small HAWT efficiency (based on numerical simulations and-or steady wind tunnel tests) might not be representative of the actual performances in real environment and it is therefore useful to improve the test protocols (in the design and prototyping phases) taking into account as much as possible the dynamical behavior of the device. Similar arguments had been proposed also in [15], where the dynamic power reduction of wind turbines is investigated numerically and experimentally, assuming that a steady-state optimal torque control strategy is used. Remarkably, there is a vast amount of literature about the study of the control of MW-scale wind turbines, but there are very few studies about the dynamics of small HAWTs: if this on one hand is comprehensible if one is interested in the scale of produced energy, it is not comprehensible by a scientific point of view because, as supported with the above arguments, the technology, the size, the flow conditions to which small HAWTs are subjected pose very intriguing scientific challenges to the researchers community. An interesting study is [16]: the aerodynamic performances of two small HAWTs are studied using Computational Fluid Dynamics (CFD) simulations under extreme operating gust and extreme wind direction changes. Some of the conclusions from that work include: compared to wind speed changes, aerodynamic forces adapt more slowly to wind direction changes and, although increasing yaw angle decreases the power available in the wind, at high wind speeds, the shaft torque produced by the rotor may increase with increasing yaw angle. A very interesting manuscript, inspiring for the purposes of this work, is [17]: a dynamic model of a 5 kW small HAWT has been developed using the FAST software (Fatigue, Aerodynamics, Structures, and Turbulence) (v8, National Wind Technology Center, Golden, CO, USA) and its predictions have been compared against measurements from field testing in highly turbulent position on campus at The University of Newcastle, (New South Wales, Australia). The results show good agreement between steady-state simulations and the nameplate data. The weak point of the modeling chain seems to be that it underpredicts the effect of high turbine yaw on the rotor torque, leading to a difference between predicted and measured shaft speed and power production. This can be interpreted, as discussed also in [18], in light of the limitations of the numerical model in simulating the tail fin and rotor interactions.
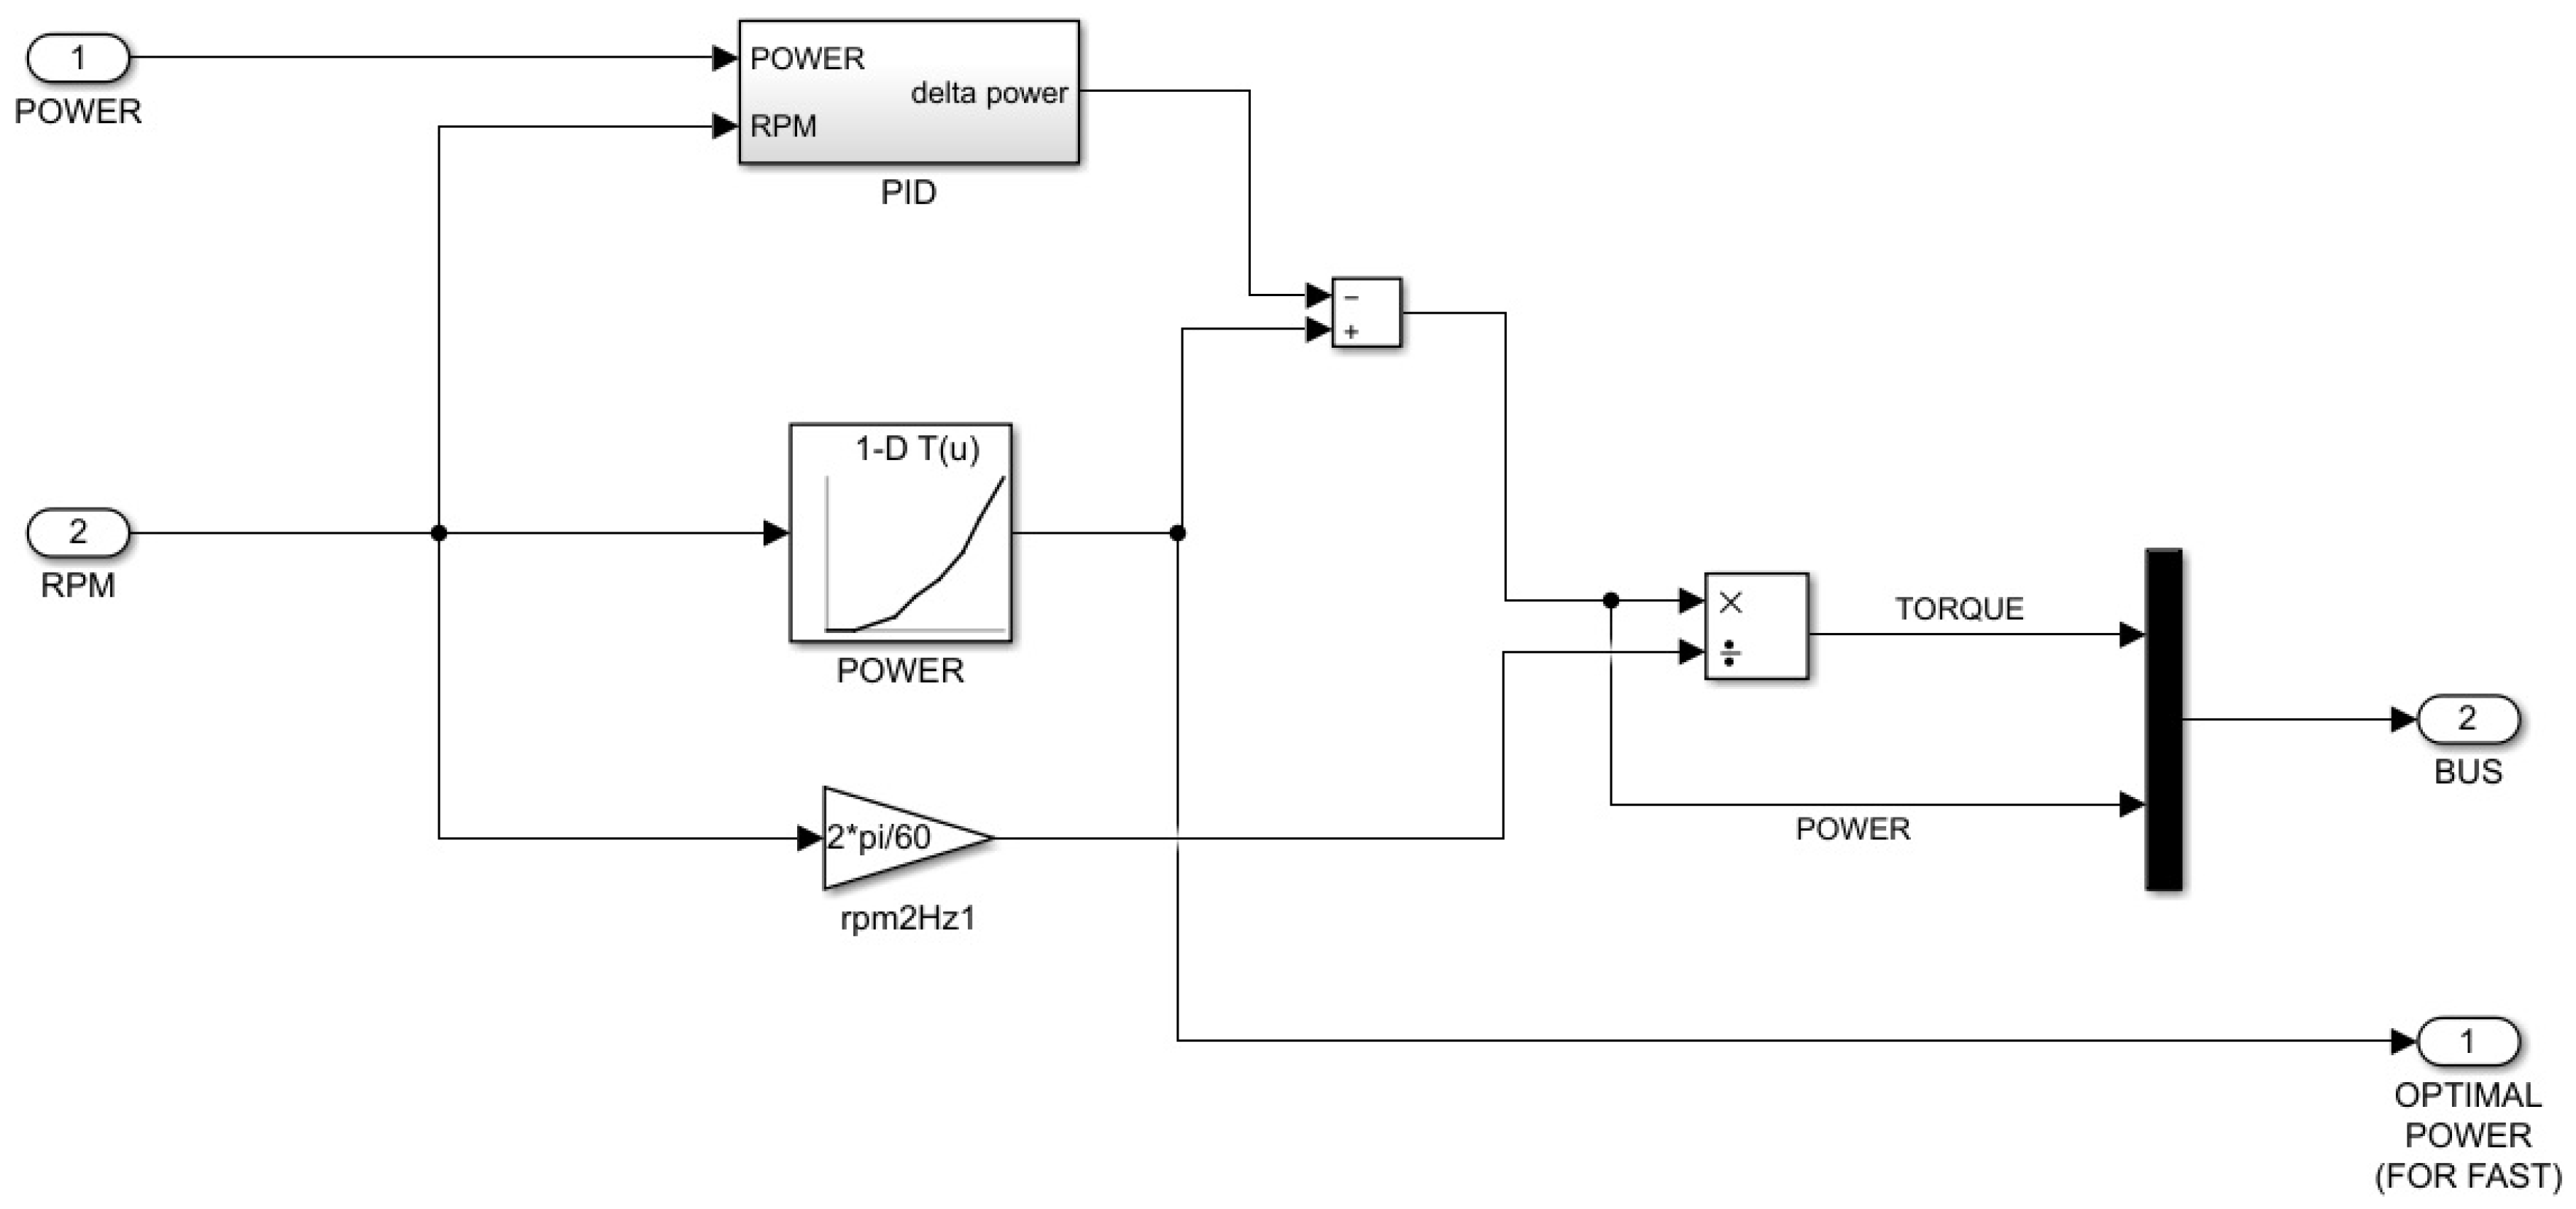
This work poses objectives similar to [
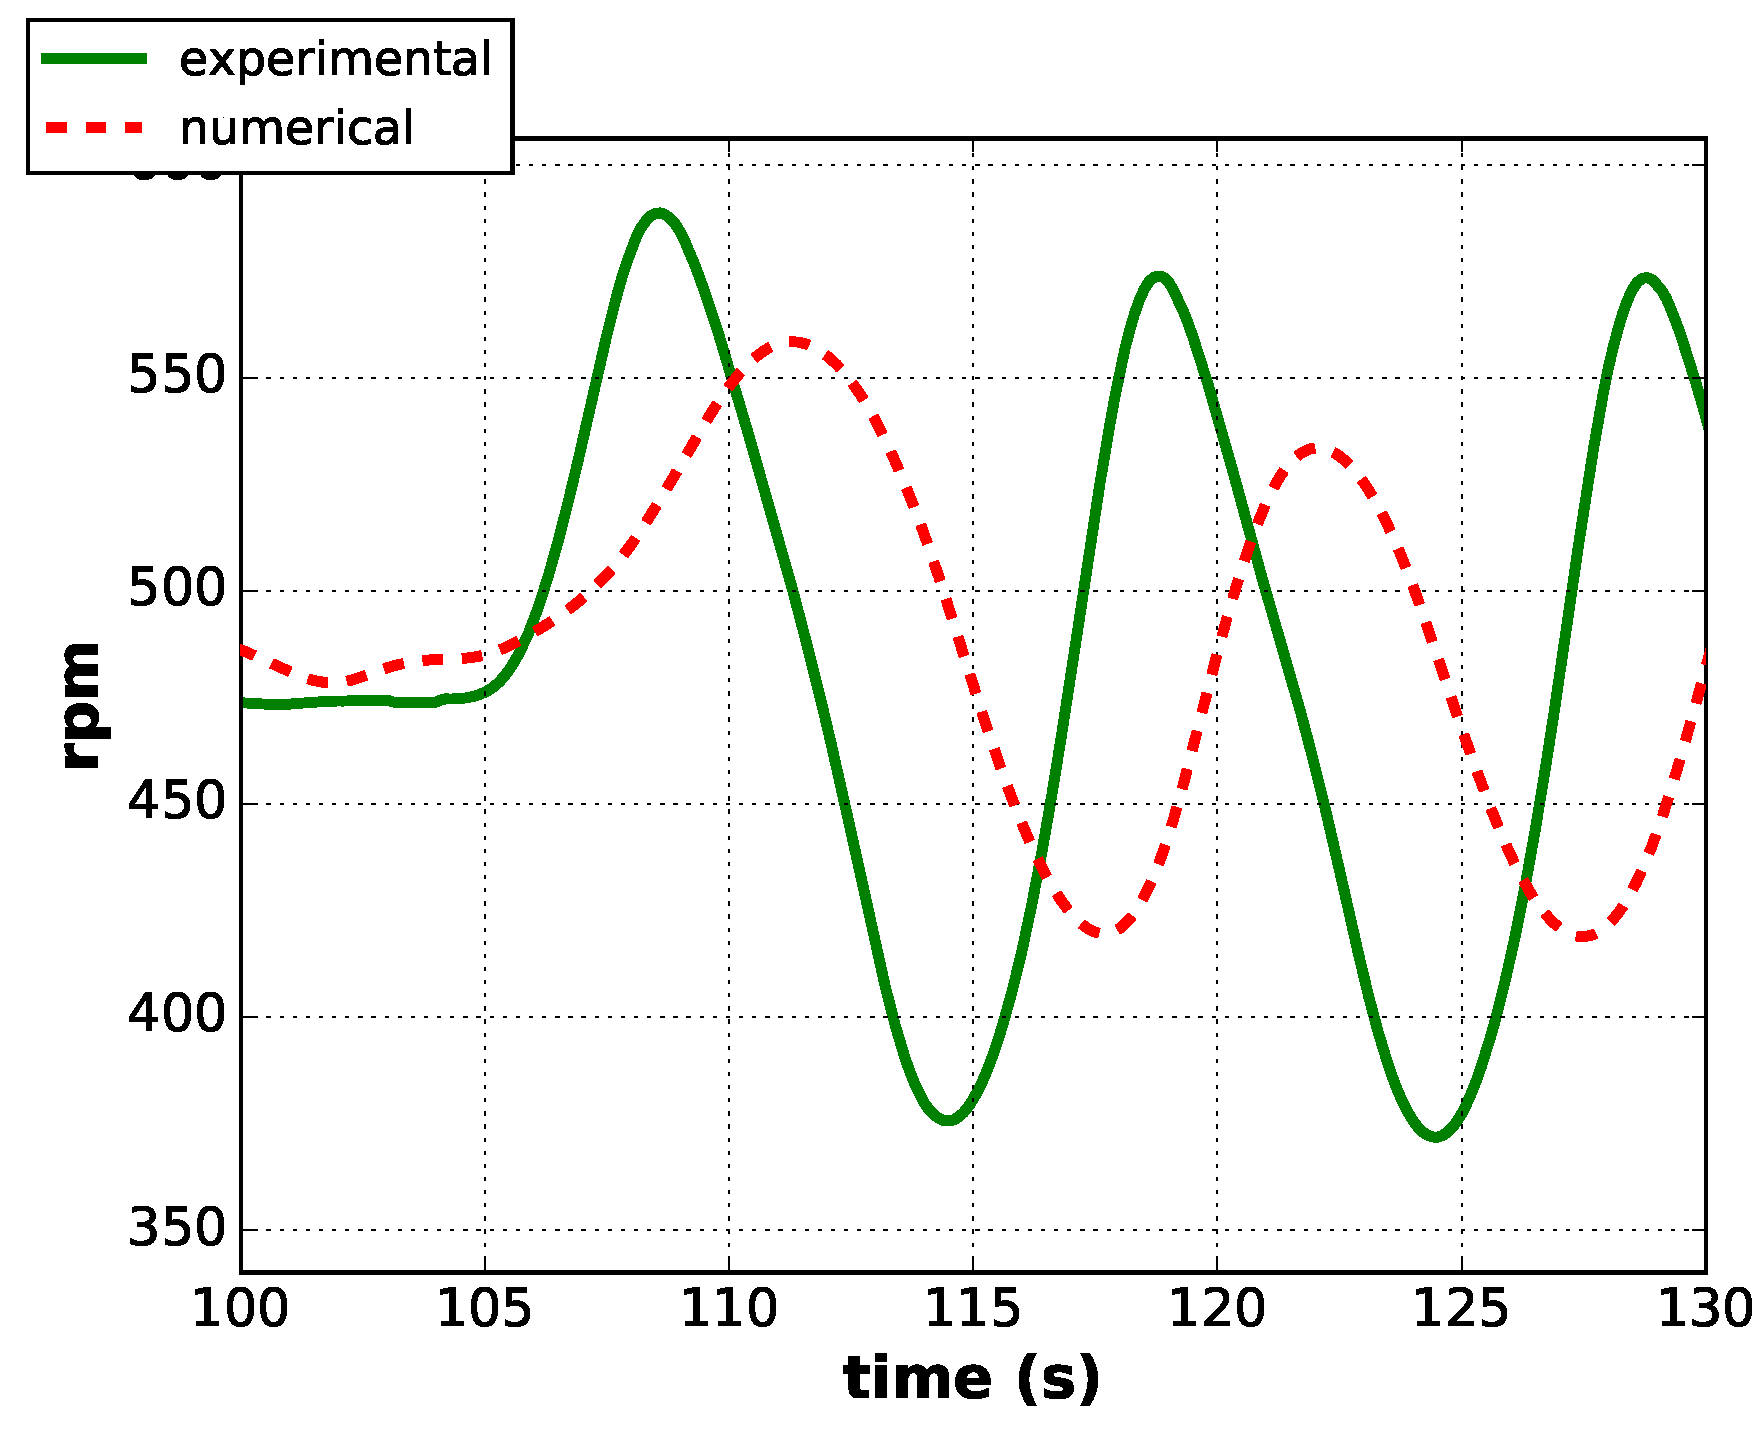
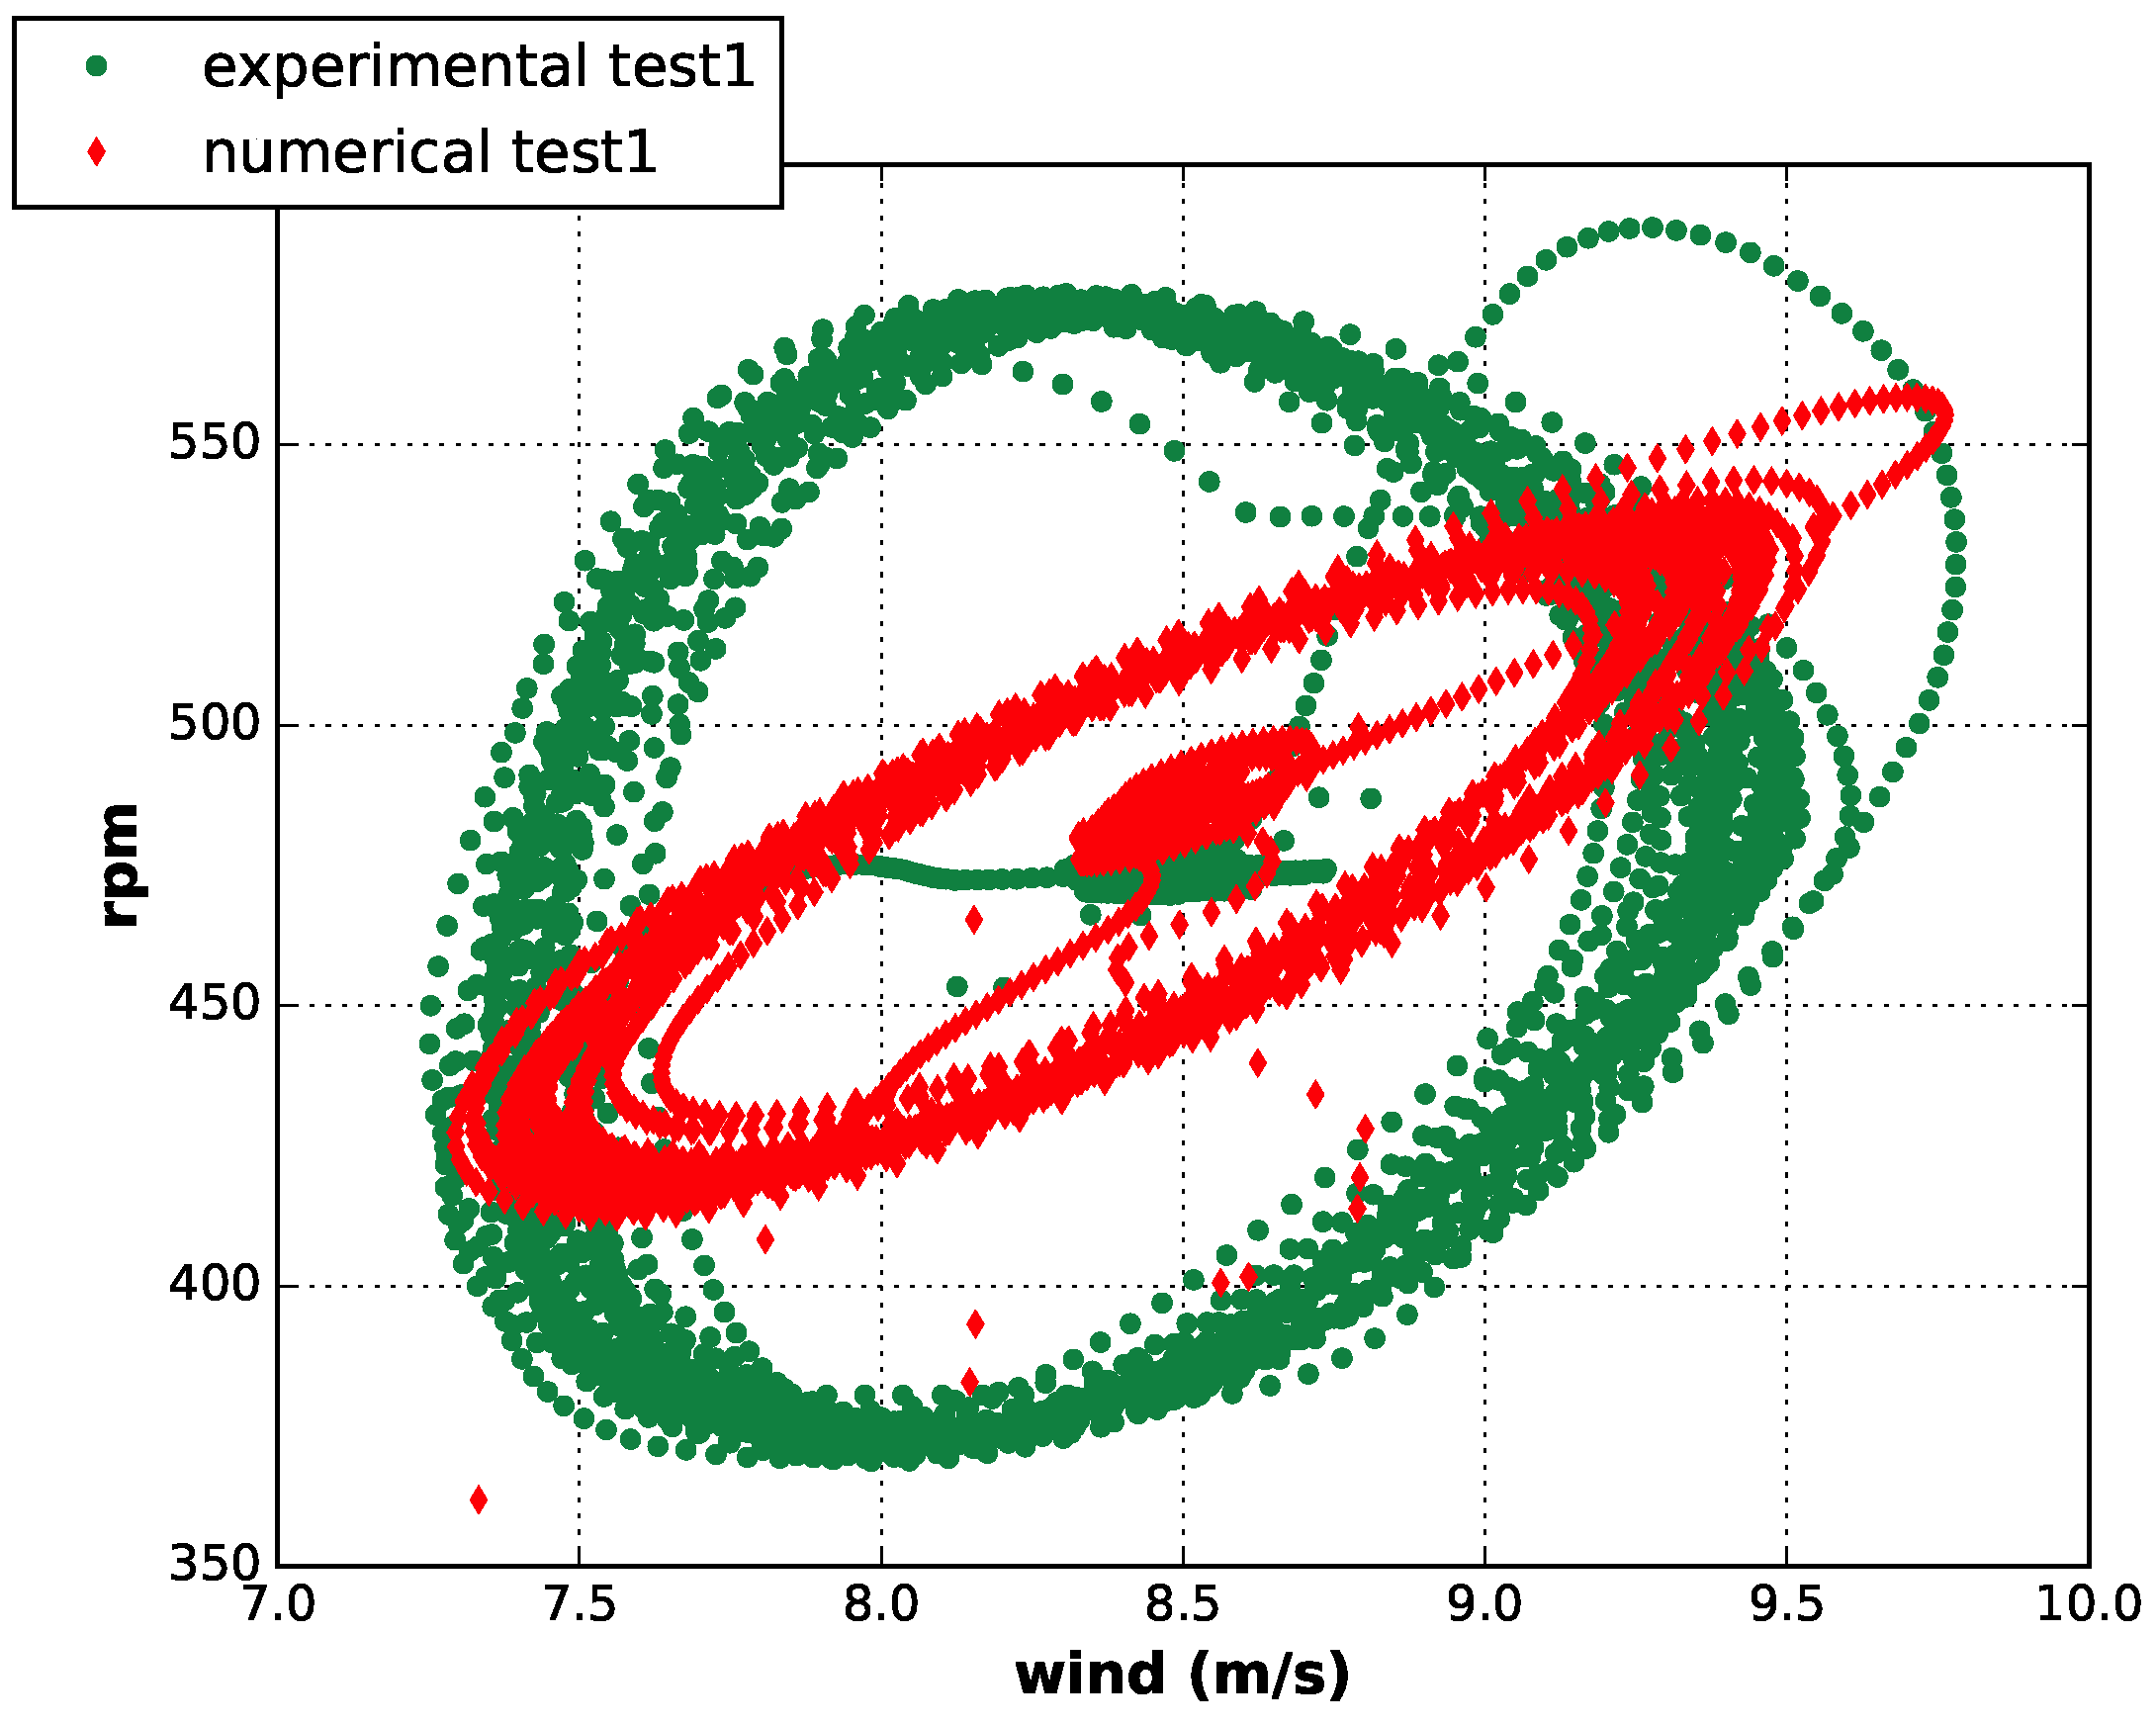
17], in the sense that also this work is a numerical and experimental study of a small HAWT and the numerical simulations are performed with the FAST software. The one-to-one feedback between model and experiment is valuable in order to cross-check the reliability of the model and the robustness of the experimental measurements. There is a considerable difference with respect to [17] because, while the experimental measurements in [
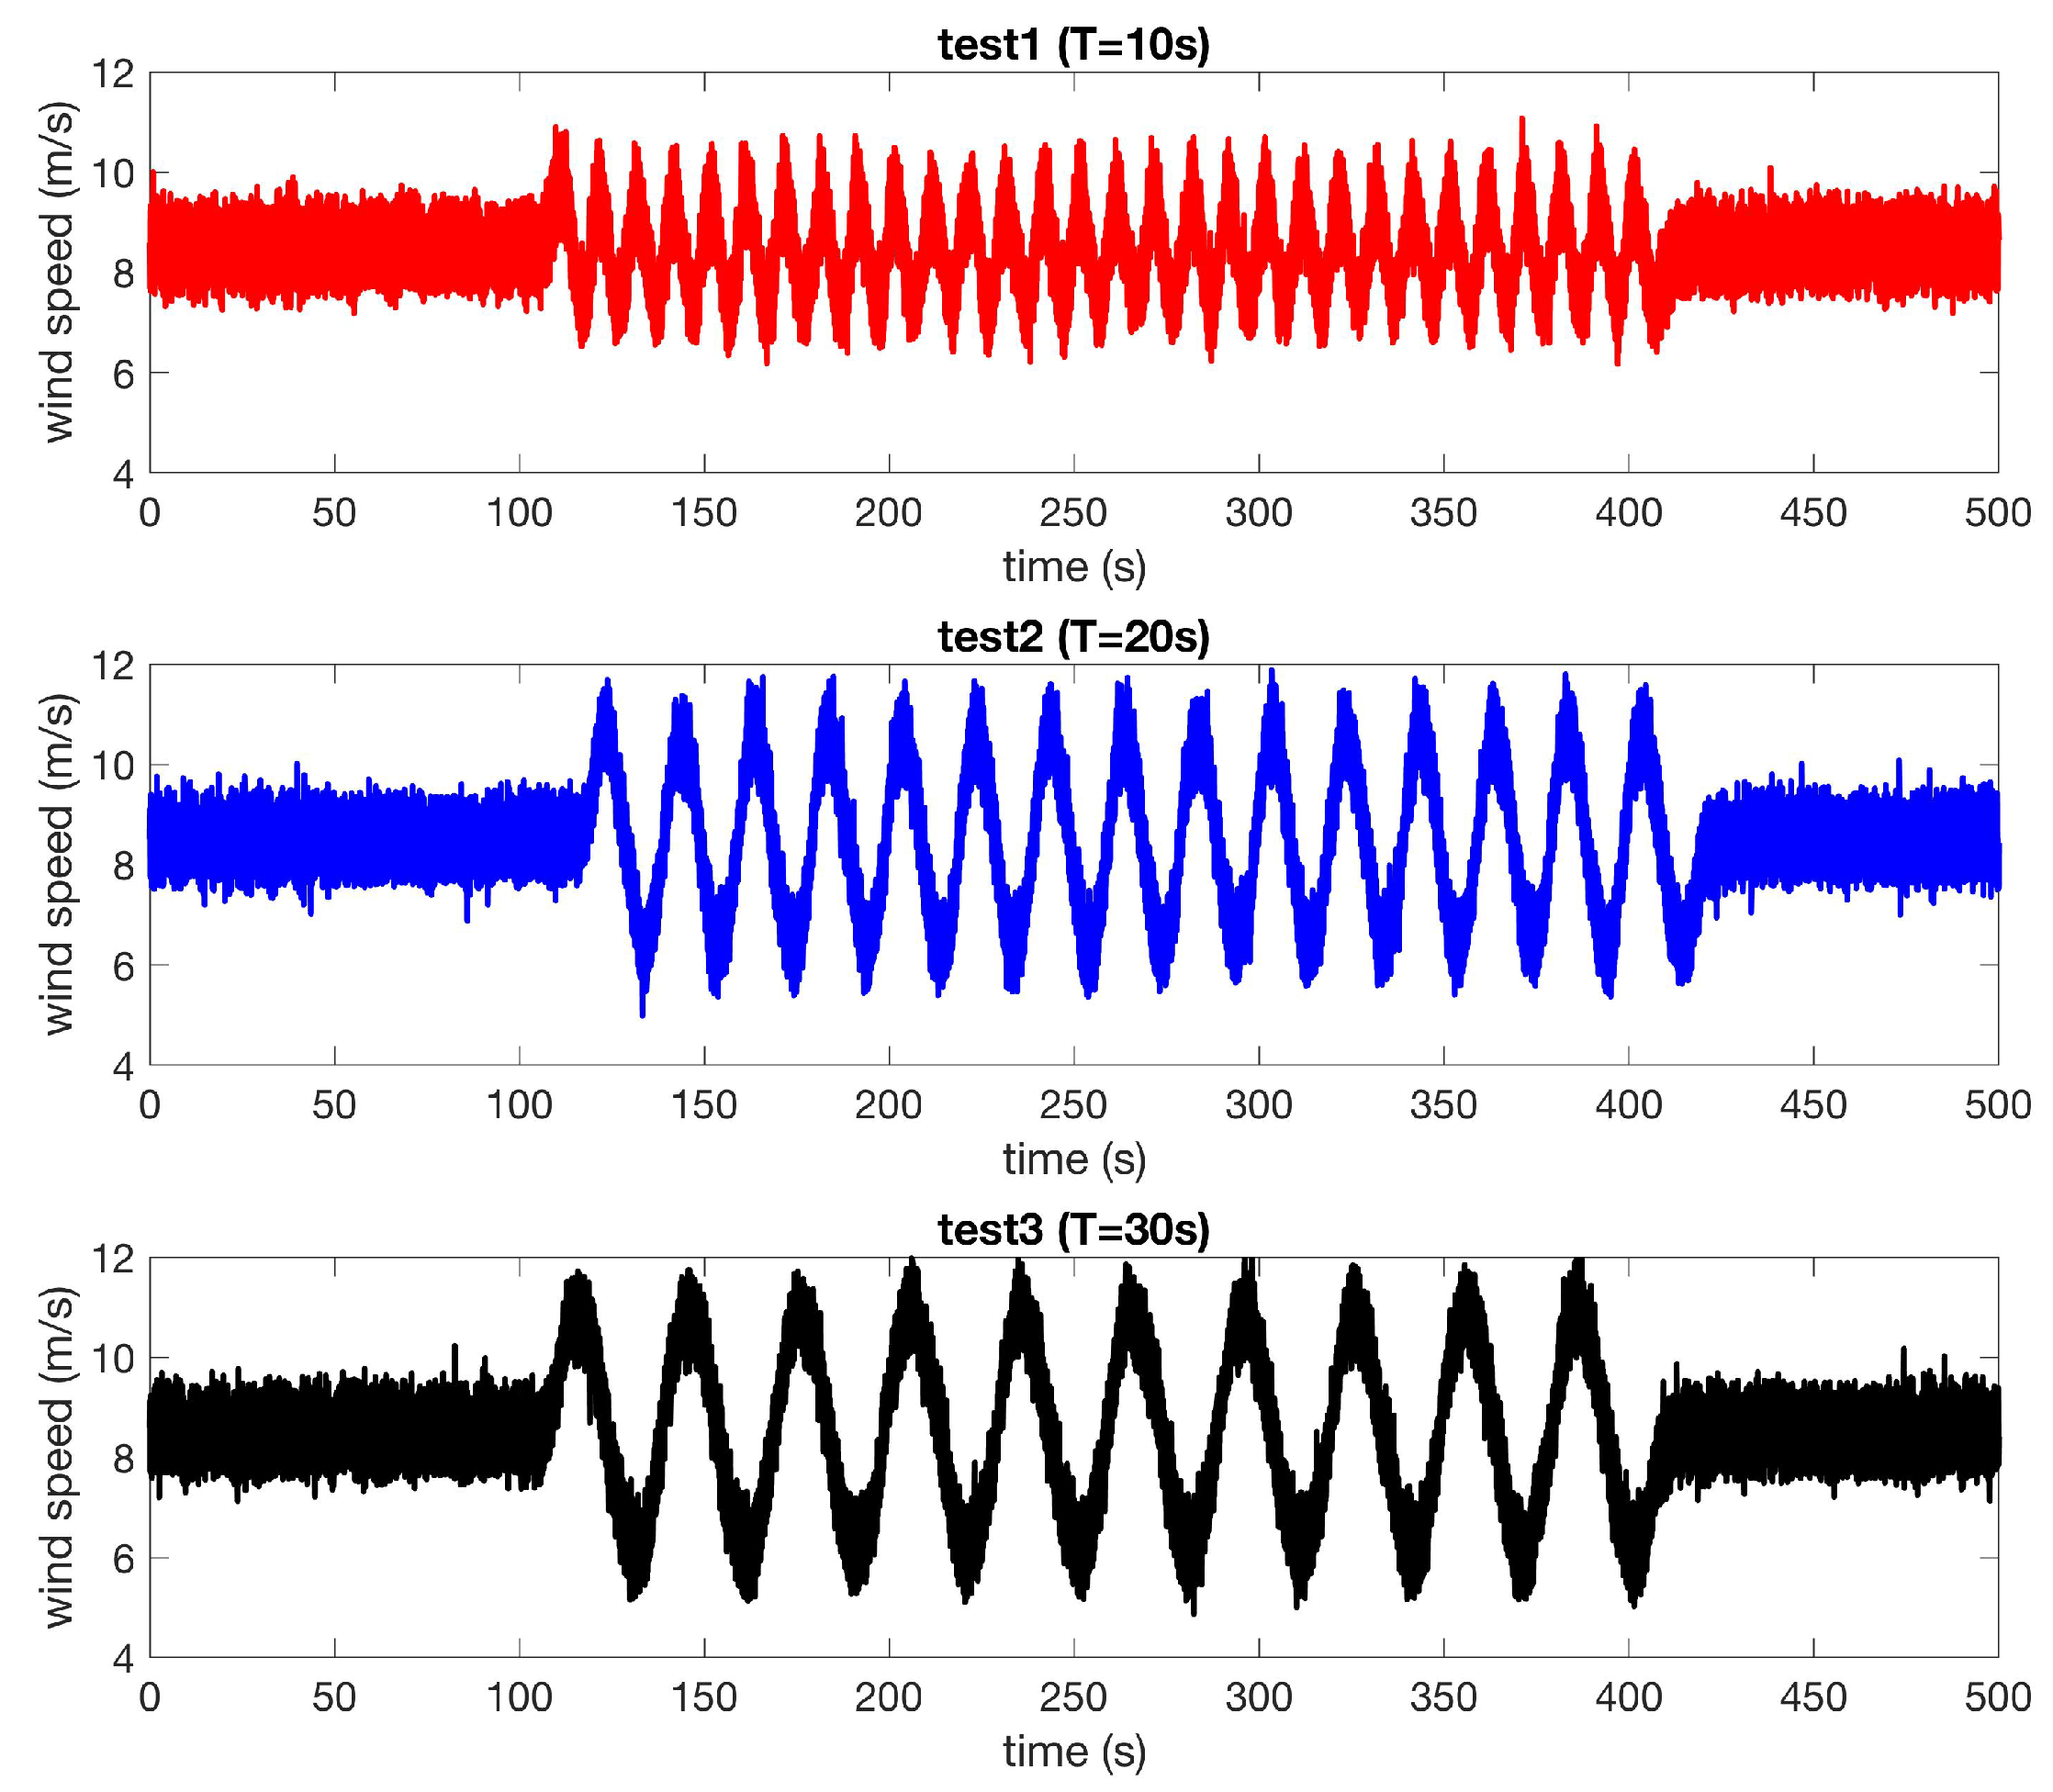
17] have been collected in a field testing in a highly turbulent site (and therefore under random uncontrolled conditions), the purpose of this work is studying the dynamical behavior of a small HAWT under non-stationary conditions that are controlled and repeatable: in particular, the test prototype is subjected to oscillating wind time series, with a custom period. This allows, on one hand, by varying the frequency of the oscillation, to study the dynamical response of the control system by stressing it almost arbitrarily. On the other hand, performing the measurements in the wind tunnel under controlled conditions, the repeatability of the tests is guaranteed.
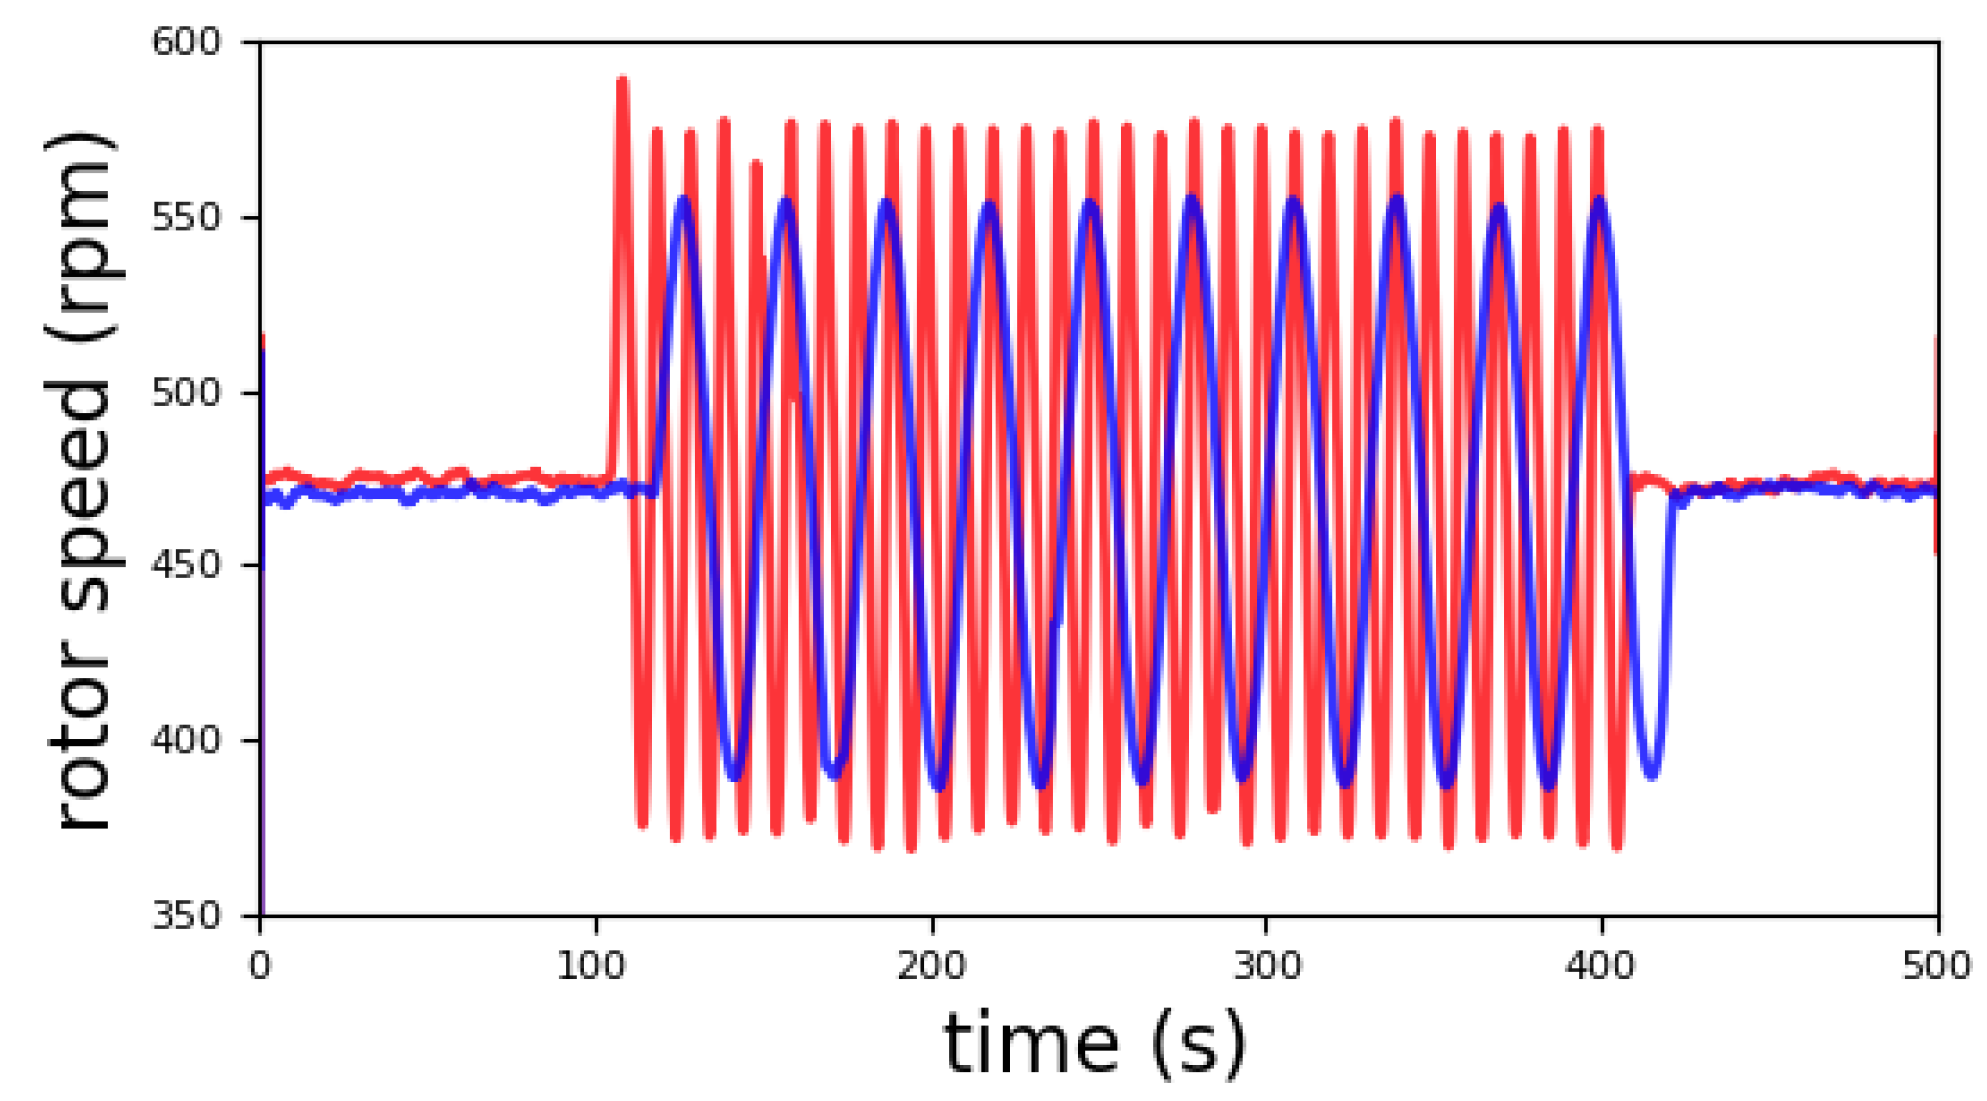
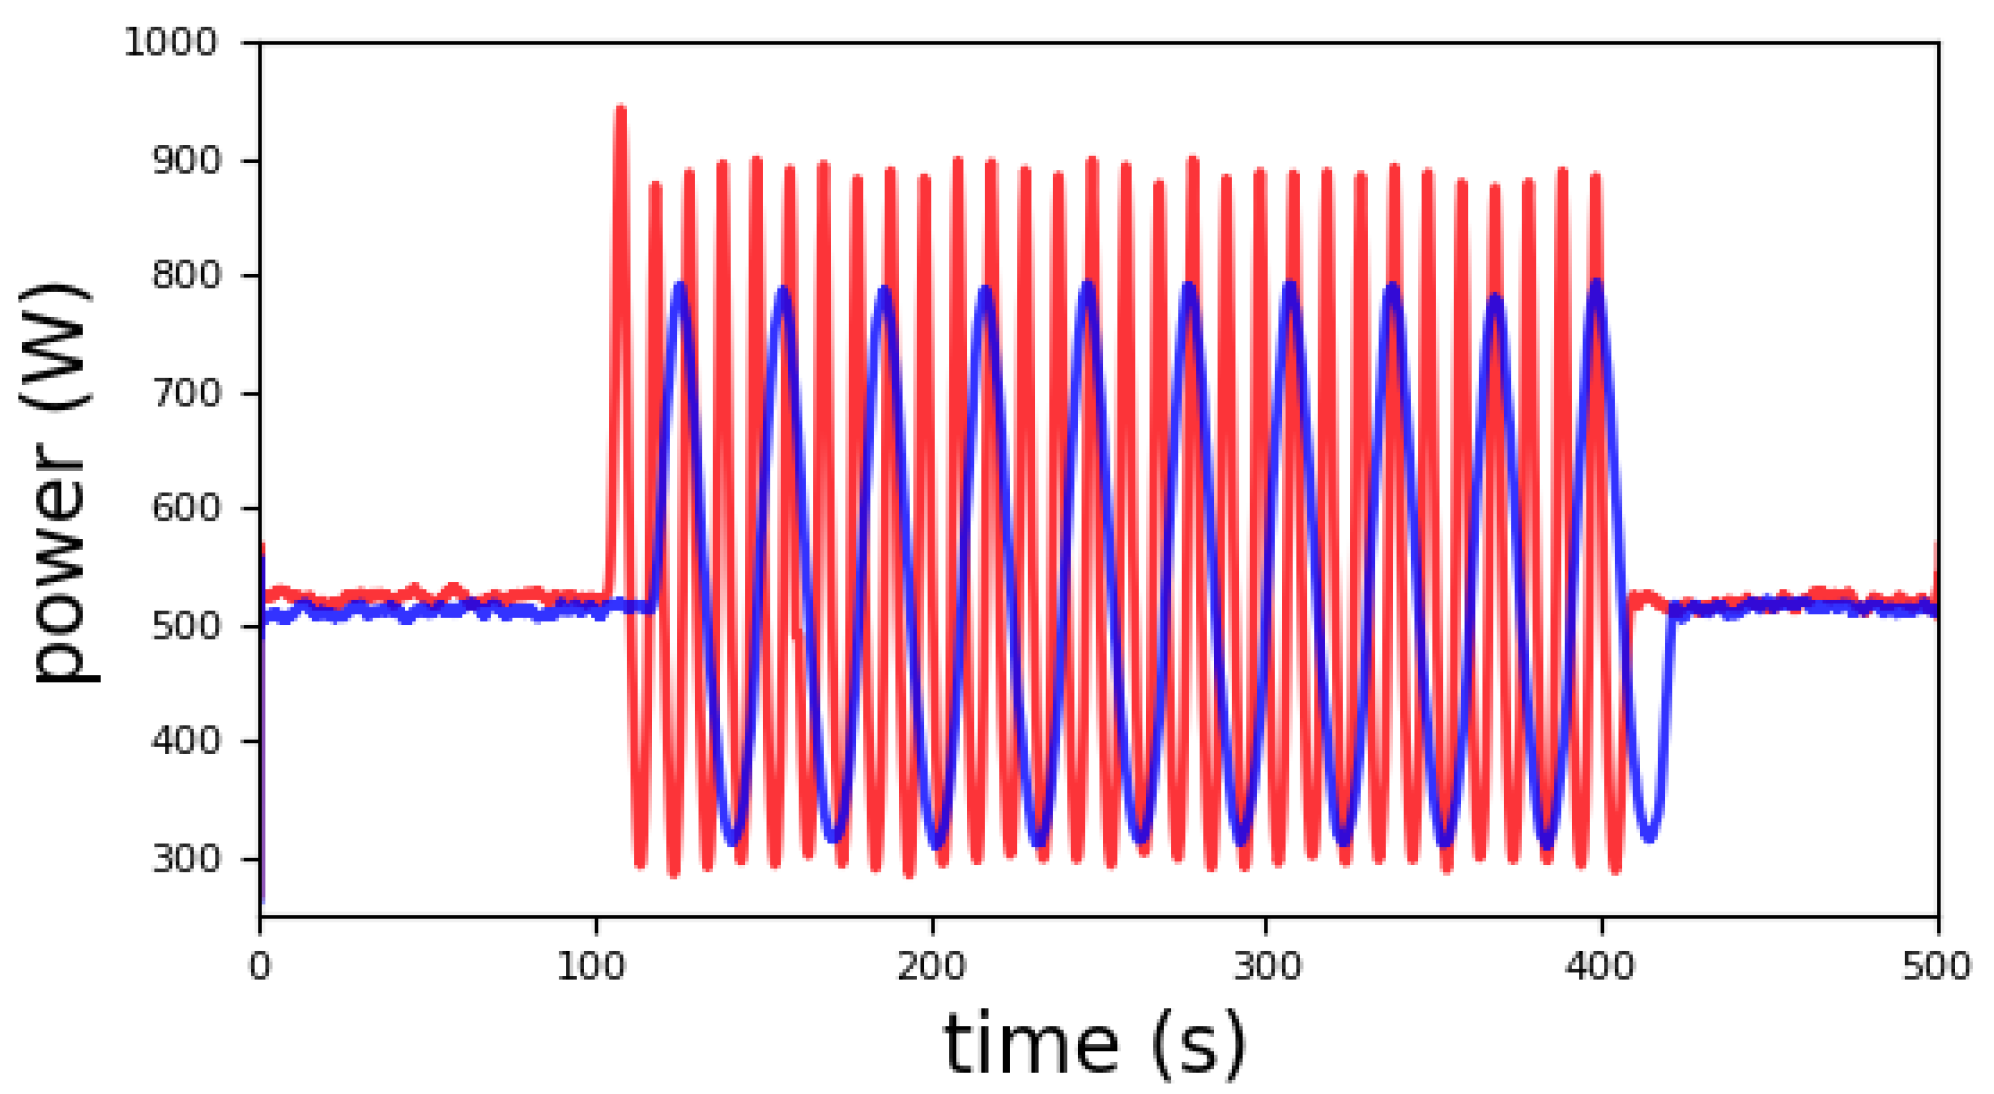
In this work, therefore, a new “unsteady” approach is formulated in order to characterize the dynamical behavior of the small HAWT turbine and of the control system. It consists in investigating the transient response of the machine, in particular in terms of delay and amplitude magnification between a controlled unsteady input (represented by wind speed) and rotor speed and power.
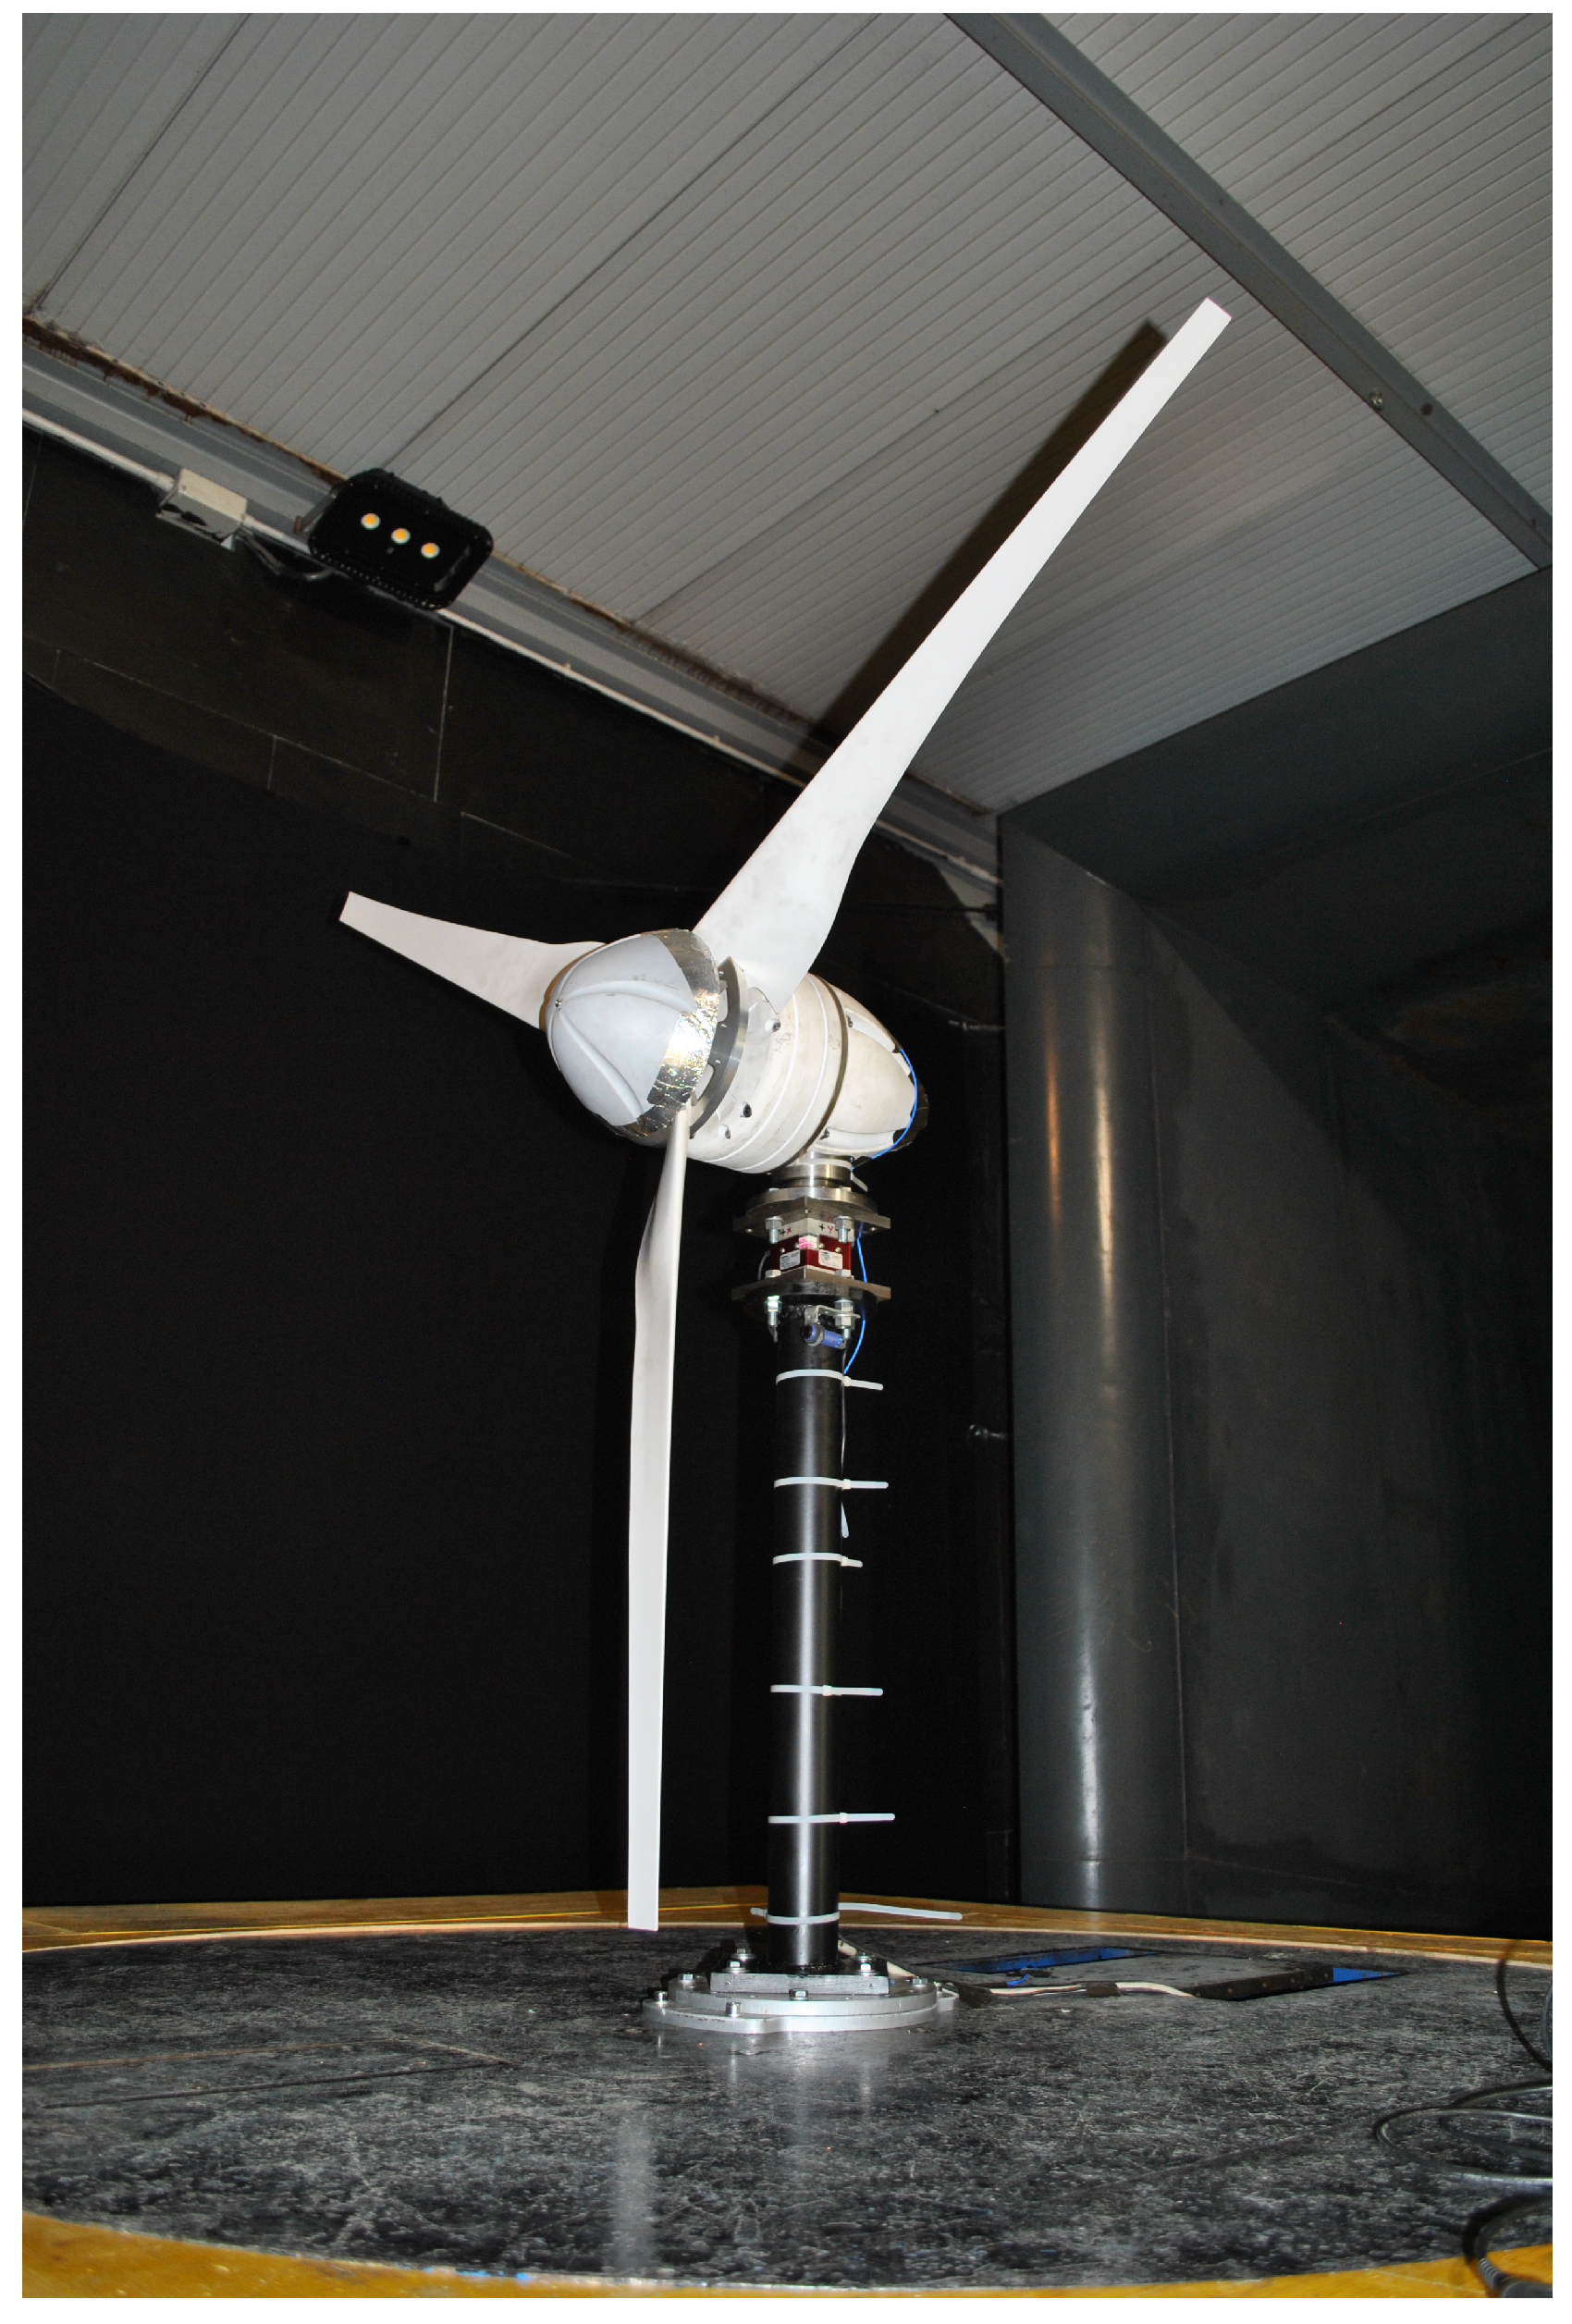
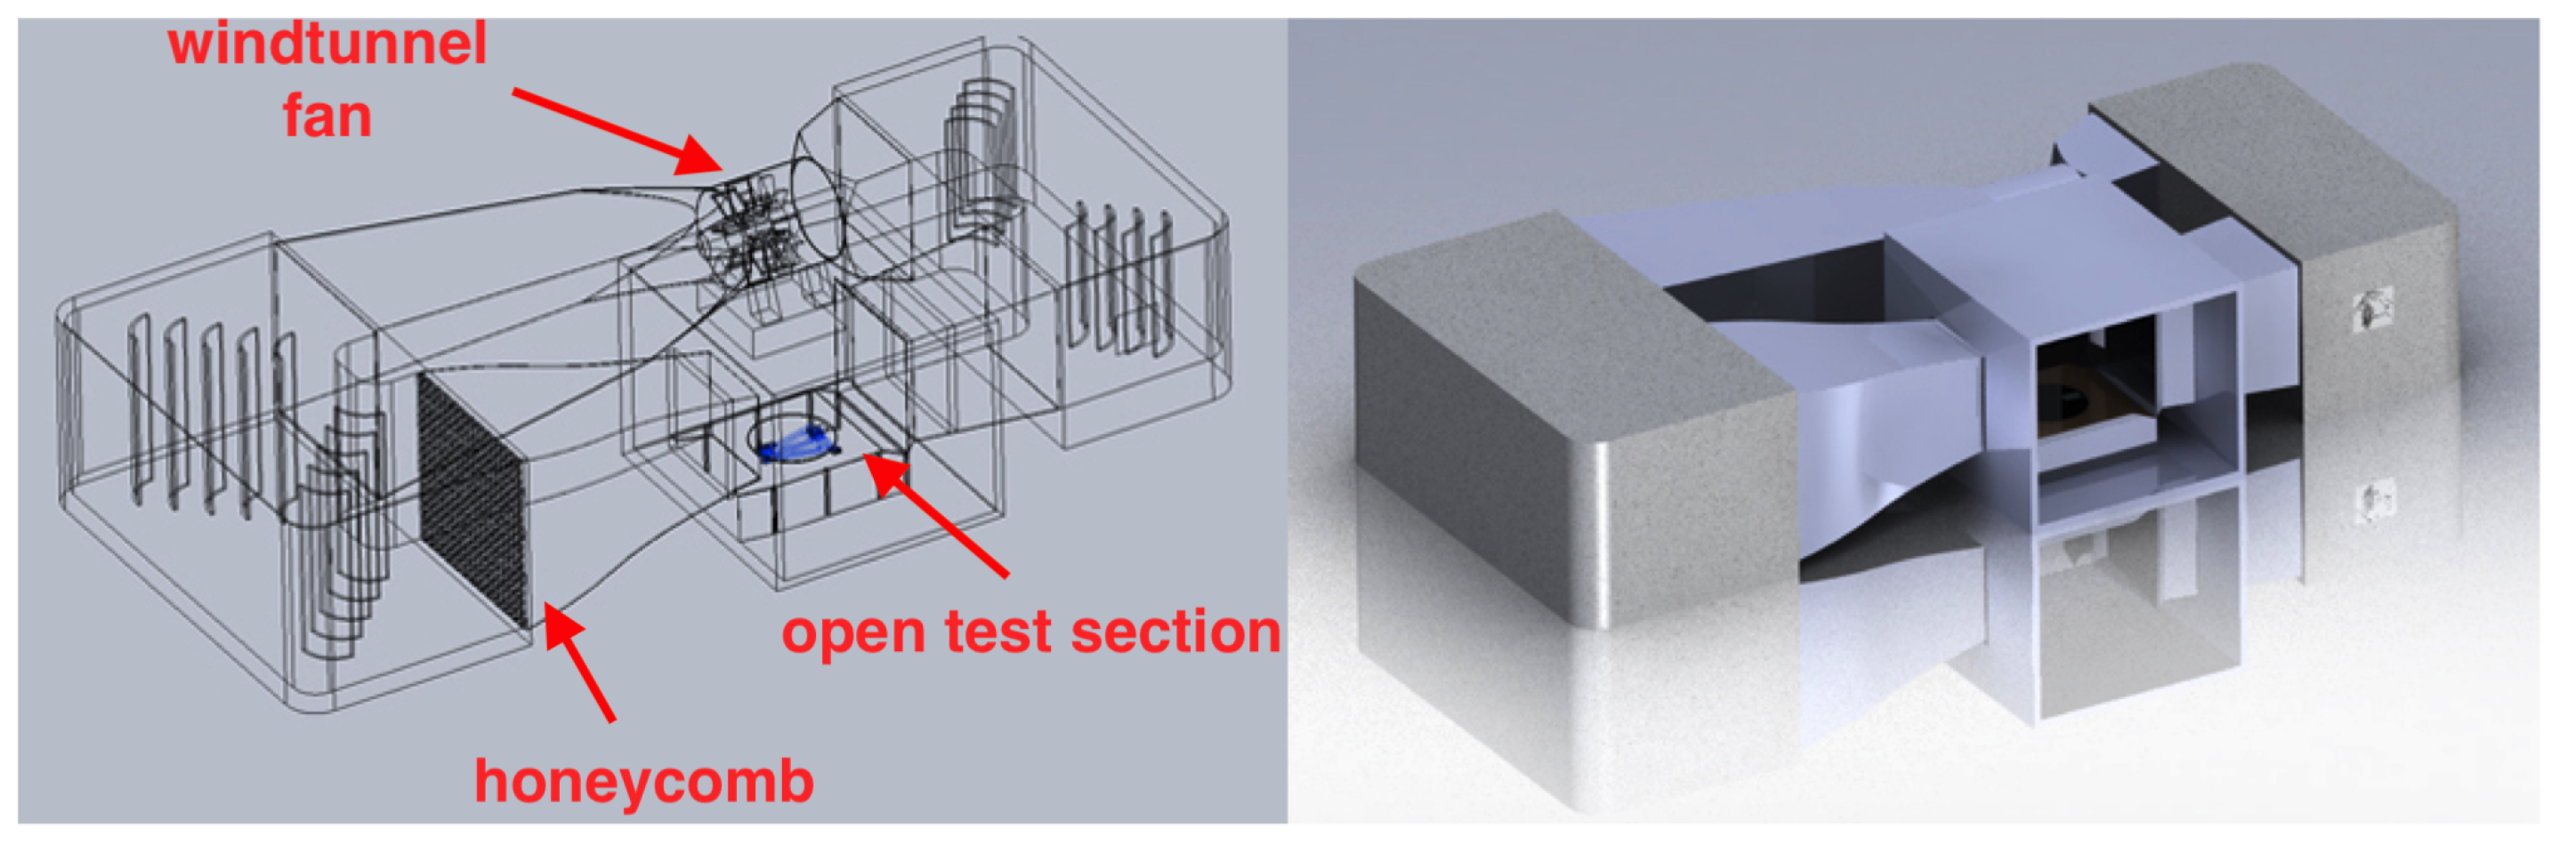
The prototype selected for this work is a small horizontal axis three-bladed wind turbine, having 3 kW of maximum power: the experimental tests have been conducted in the “R. Balli” (www.windtunnel.unipg.it) Wind Tunnel of the University of Perugia. Previous studies on this test wind turbine have been conducted in [2] (where the design optimization procedure is described) and in [18]: the latter work actually reports results about stationary and ramp wind tests, which have resulted in being useful in investigating some mechanical properties, such as the vibration spectra and the natural frequencies of the machine.
The manuscript is organized as follows: in Section 2, the HAWT prototype and the numerical and experimental methods are described. Section 3 is devoted to the results’ discussion and, finally, in Section 4, conclusions are drawn and some further directions of this work are indicated.

2. Methods and Facilities

2.1. Experimental Set Up

The selected small HAWT has the following features:
  • 3 kW of maximum power;
  • 2 m of rotor diameter;
  • 3 blades made of polymer reinforced with glass fibers;
  • fixed pitch angle;
  • rotor rotational speed between 200 and 700 revolutions per minute;
  • 40 kg of overall nacelle mass;
  • fully electric load control through a pulse width modulation on a resistive load (operated to follow the optimal rpm-power curve obtained from steady wind tests according to the Maximum Power Point Tracking).
The hub height is 1.2 m in the wind tunnel configuration. In Figure 1, the configuration of the prototype in the wind tunnel is reported.
The wind tunnel facility of the University of Perugia has an open test chamber section of 2.2 × 2.2 m and a recovery section of 2.7 × 2.7 m. The air can be accelerated up to a maximum speed of 47 m/s using a fan driven by a 375 kW electric motor in a closed loop circuit. The level of turbulence is quite low (<0.4%). The wind speed is measured by a Pitot tube and a cup anemometer placed at the inlet section; in the testing room, the ambient conditions (static air pressure, temperature and relative humidity) are also continuously monitored. In Figure 2, a scheme of the wind tunnel is reported.
The inverter controlling the fan drive allows for generating unsteady wind time histories. The performed tests have 500 s of overall duration and have been arranged as follows:
  • 100 s of steady wind (approximately 8.5 m/s);
  • 300 s of periodical wind with and amplitude of approximately 1.3 m/s and a variable period. Three periods T are tested: 10, 20 and 30 s (test 1, test 2, test 3);
  • 100 s of steady wind (same steady conditions as at the beginning of the test).
Finally, a test of the unloaded turbine has been done in a similar way (test 4), but the average wind speed has been kept lower (4 m/s) in order to avoid overspeed of the rotor. The collected measurements are:
  • Wind speed (through an anemometer and a pitot);
  • Rotor speed (through an optical tacho and a wind interface);
  • Power output.

2.2. Numerical Model

An aeroelastic model has been set up using the FAST v8 software developed at the National Renewable Energy Laboratory (NREL) in Golden, CO, USA. As discussed also in [18], this code is particularly adequate for the simulation of MW-scale wind turbines and therefore must be tuned carefully when adopting it for simulating the dynamic behavior of a small HAWT in the wind tunnel. For this reason, the Matlab-Simulink interface has been adopted, in order to have more freedom especially in modelling the power control in the simulation: as input, it receives the shaft speed (in revolutions per minute) and the power and it estimates in output the requested power that the wind turbine should produce. The rpm-optimal power table employed in the numerical simulation of the control is the same as the real turbine: it has been obtained through experimental steady-state tests in the wind tunnel with different wind speeds, changing the electrical load, until the turbine didn’t produce the maximum power, according to the MPPT theory (Maximum Power Point Tracking). These couples of values of rpm-optimal power are used in the Proportional-Integral-Derivative (PID) sub-system, where a closed-loop control is implemented. As output, it produces a value of tolerance for the power ( Δ P ), which can be positive or negative and is algebraically added to the optimal power for the current shaft speed. Notice that the PID parameters (Proportional K P , Integral K I , Derivative K D ) used in the simulation are different from the ones used by the real turbine. Actually, the model is necessarily simplified as regards some components that influence the behavior of the turbine and its control (the electrical generator, the rectifier, inductive and capacitive loads). FAST needs as input also the value of the torque, which is obtained by dividing the output power by the angular speed. In Figure 3, the flowchart of the Simulink closed loop control is reported.
Notice that both the real turbine and the numerical model don’t use the wind speed to control their power: this is very important for the numerical simulations because the wind speed can be considered as an “independent” input and, therefore, numerical and experimental tests can be repeated and lead to slightly different outputs that can be considered a response to the same input and can therefore be compared.
There are two main critical points as regards the adaptability of the numerical model to the experimental conditions:
  • the numerical model needs to be fed by the undisturbed wind speed history. To achieve this task, the mean and the amplitude of the sinusoidal wind was corrected according to the blockage of the tunnel, but the problem is to manage the time-shift;
  • the time response of the electrical interface. The easiest way to arrange an automatic load control has been employed, but also the model of the actual brake circuit should be included in the model.

3. Results

3.1. Experimental Tests Analysis

In the following, the way the unsteadiness transmits from the wind to the load is observed through the analysis of the experimental measurements depending on the frequency of the input wind. The selected statistical metrics are the mean μ , the relative standard deviation expressed in percentage R S D = 100 σ μ , the crest factor C F = | x peak | x rms . In Figure 4, wind time series for the three selected unsteady tests are reported.
Some results are reported below for test 1 (the one having lowest period equal to 10 s) and test 3 (the one having highest period equal to 30 s). In Figure 5, the time series of rotor speed is reported and, in Figure 6, the time series of power output is reported.
In Table 1, Table 2 and Table 3, the mean, the relative standard deviation and the crest factor of the wind, rotor speed and power output time series for test 1 and test 3 are reported. The main observation is that, as regards the wind, the metrics are comparable for test 1 and test 3. As regards rotor speed, the difference between test 1 and test 3 is mostly appreciable as regards the relative standard deviation of the time series. As regards power output time series, finally, test 1 and test 3 considerably differ as regards relative standard deviation and crest factor. The similarity regards the magnification of the unsteadiness (measured by the relative standard deviation) moving from the resource to the electrical load. Fast oscillations seem to have a higher effect of magnification. Adjustments in the control system possibly can play an important role in changing this behaviour.

3.2. Simulations vs. Experiments

In Table 4 and Table 5, the mean, the RSD and the CF of the measured and simulated time series of power and rotor revolutions per minute (rpm) are reported and compared. The main result is that there is a good agreement as regards the mean values, except for test 4. The results of test 4 are expected, because, when the wind turbine rotates unloaded, the equilibrium is given by the balance between the produced torque and the aerodynamic and friction losses, which are not correctly reproduced in the model. Furthermore, in general, the experimental measurements are characterized by a higher degree of unsteadiness, as demonstrated by higher values of standard deviations especially for test 1.
These results demonstrate how unstable the operation of a small HAWT can be and how the unsteady electric parameters can stress the electrical interface connecting the system to the local grid. Estimating the order of magnitude of the unsteadiness of the power output using the statistics (as in Table 4) can be useful in order to choose the final configuration for the connection to the local grid: namely, if the power fluctuations are too strong, the usage of a battery storage can be recommended.
Table 4 and Table 5 summarize the comparison between measurements and simulation by a statistical point of view. It is also interesting to see what happens at the level of time series. In Figure 7, a sample of rotor speed time series is reported: test 1 has been selected because it has the shortest period and therefore stretches to the limits the simulation framework.
From Figure 7, it arises that the simulation has some limitations in reproducing reliably the measurements at the level of time series. This fact can be observed also by another point of view: the phase shift between wind speed and rotor speed. The following situation arises:
  • in the numerical model, the rotor speed and the power are synchronized (ideal perfect control).;
  • in the experimental measurements, there is a positive shift of a few percent of the period;
  • this is mainly due to some effects of the electrical circuit (that was not simulated numerically) and of the aerodynamic damping that is not correctly reproduced by the model (as supported by the different behavior of test 4 with respect to the other tests; see Table 5).
  • the boundary conditions represented by the presence of the walls of the wind tunnel produce a flow that is not perfectly uniform, differently from what is modeled through the FAST code.
A further critical point regards the closed loop nature of the wind tunnel: actually, a positive shift can be observed between wind speed and rotor speed, especially for test 1 (with the smallest period of 10 s): this means that the rotor speed rises before the wind speed and this result is meaningless for an open field condition and is due to the dynamics of the closed-loop circuit of the tunnel. This fact is summarized in Table 6.
In Figure 8, the simulated and measured rpm-power curves are compared, while, in Figure 9, the wind-rpm ones are plotted; finally, in Figure 10, the couples of values of wind and rpm are plotted as a function of time.
The main observations arising from Figure 8, Figure 9 and Figure 10 are:
  • the power vs. rotor speed plot demonstrates that the numerical model is able to reproduce only very slow turbulent wind (similar to that of test 3 with an overall period of 30 s) in a reliable way and that a further development of the model is necessary to reproduce the real HAWT dynamics;
  • from the 3D-plot, it can be observed that the actual configuration of the model is able to correctly predict the initial overshoot in the transition between the steady wind condition and the sinusoidal regime for test 3 (which is characterized by the shortest periodicity); instead this is not visible for the tests having a longer period;
  • these results support that the fastest transition investigated in the present work is mainly governed by the aerodynamic and mechanical parameters that are already correctly included in the current version of the numerical model.

4. Conclusions

The actual performances of small HAWTs in real working environments can be remarkably different with respect to those measured under controlled and practically steady conditions, as in the wind tunnels. Therefore, it is important to study small HAWTs control system and in general their dynamic behavior. On these grounds, the idea of this work was subjecting a test HAWT prototype to an oscillating wind time series in the wind tunnel, so that, at the same time, the environment is also controlled and unsteady.
The experimental analysis in the wind tunnel has been compared to numerical simulations that have been performed using the aeroelastic code FAST. In general, the feedback between experiments and simulation is twofold: numerical models can be validated against measurement and, vice-versa, robust numerical models can extrapolate meaningful indications about wind turbine behavior under regimes that can’t be produced in laboratory.
The main results of this study are the following: the experimental measurements are reliable in terms of time series statistics and can be taken into account in order to characterize the dynamic behaviour of the system and define possible control improvements. In addition, the numerical model gives reliable results in terms of time series statistics and can therefore be useful in the developing phase of a small HAWT to choose the optimal mechanical and aerodynamic configuration. A further improvement is necessary to correctly reproduce the dynamic response of the control. Unfortunately, the closed-loop configuration of the tunnel doesn’t allow for estimating the phase shift between the wind and the machine response in terms of rotor speed or power. This can be due to the following effects that somehow can induce a delay in the wind speed measurements:
  • the open test chamber can act as a sort of reservoir and store part of the air flow when the rotor thrust is suddenly rising;
  • the effect of the pressure gradients can induce some small changes in volume/density on the large volume of air in the tunnel loop.
As future work, we are currently investigating this effect more in depth on the experimental side (using some additional pressure measurements inside the wind circuit) and also numerically (through CFD simulations). We are planning to develop other different methods to produce unsteady wind time histories (i.e., using oscillating grids). As regards the computational set-up, we are planning to investigate how to take this effect into account better, in order to resemble more reliably the real experimental environment. On the numerical side, a further development could be a more detailed representation of the chain of transformation of the wind flow into power: in particular, the presence of the synchronous generator, the rectifier and the resistive load should be taken into account. In this way, it could be possible to use the complete set of control parameters of the real turbine (PID parameters, PWM control law, etc.) in the numerical simulations and study how they influence the response on the machine—for example, in terms of the delay between wind speed and rotor rotational speed.
Furthermore, other future experimental directions of this research include:
  • extending the campaign to other prototypes of HAWT;
  • measuring the mechanical loads of the HAWT;
  • studying experimentally and numerically the dynamics of small HAWTs under yawed conditions.

Author Contributions

F.C. conceived and supervised the research, analyzed and interpreted the numerical and experimental results. D.A. wrote the manuscript, analyzed and interpreted the numerical and experimental results. M.B. performed the experimental tests. F.B. performed the numerical simulations.

Funding

This research received no external funding.

Conflicts of Interest

The authors declare no conflict of interest.

References

  1. Tummala, A.; Velamati, R.K.; Sinha, D.K.; Indraja, V.; Krishna, V.H. A review on small scale wind turbines. Renew. Sustain. Energy Rev. 2016, 56, 1351–1371. [Google Scholar] [CrossRef]
  2. Scappatici, L.; Bartolini, N.; Castellani, F.; Astolfi, D.; Garinei, A.; Pennicchi, M. Optimizing the design of horizontal-axis small wind turbines: From the laboratory to market. J. Wind Eng. Ind. Aerodyn. 2016, 154, 58–68. [Google Scholar] [CrossRef]
  3. Lanzafame, R.; Messina, M. Power curve control in micro wind turbine design. Energy 2010, 35, 556–561. [Google Scholar] [CrossRef]
  4. Joosse, P.; Blanch, M.; Dutton, A.; Kouroussis, D.; Philippidis, T.; Vionis, P. Acoustic emission monitoring of small wind turbine blades. J. Sol. Energy Eng. 2002, 124, 446–454. [Google Scholar] [CrossRef]
  5. Mollasalehi, E.; Sun, Q.; Wood, D. Contribution of small wind turbine structural vibration to noise emission. Energies 2013, 6, 3669–3691. [Google Scholar] [CrossRef]
  6. Lee, S.; Lee, S. Numerical and experimental study of aerodynamic noise by a small wind turbine. Renew. Energy 2014, 65, 108–112. [Google Scholar] [CrossRef]
  7. Grieser, B.; Sunak, Y.; Madlener, R. Economics of small wind turbines in urban settings: An empirical investigation for Germany. Renew. Energy 2015, 78, 334–350. [Google Scholar] [CrossRef]
  8. James, P.; Sissons, M.; Bradford, J.; Myers, L.; Bahaj, A.; Anwar, A.; Green, S. Implications of the UK field trial of building mounted horizontal axis micro-wind turbines. Energy Policy 2010, 38, 6130–6144. [Google Scholar] [CrossRef]
  9. Sunderland, K.; Woolmington, T.; Blackledge, J.; Conlon, M. Small wind turbines in turbulent (urban) environments: A consideration of normal and Weibull distributions for power prediction. J. Wind Eng. Ind. Aerodyn. 2013, 121, 70–81. [Google Scholar] [CrossRef] [Green Version]
  10. Sang, L.Q.; Murata, J.; Morimoto, M.; Kamada, Y.; Maeda, T. Experimental investigation of load fluctuation on horizontal axis wind turbine for extreme wind direction change. J. Fluid Sci. Technol. 2017, 12, JFST0005. [Google Scholar] [CrossRef]
  11. Tabrizi, A.B.; Whale, J.; Lyons, T.; Urmee, T. Performance and safety of rooftop wind turbines: Use of CFD to gain insight into inflow conditions. Renew. Energy 2014, 67, 242–251. [Google Scholar] [CrossRef] [Green Version]
  12. Lubitz, W.D. Impact of ambient turbulence on performance of a small wind turbine. Renew. Energy 2014, 61, 69–73. [Google Scholar] [CrossRef]
  13. Pagnini, L.C.; Burlando, M.; Repetto, M.P. Experimental power curve of small-size wind turbines in turbulent urban environment. Appl. Energy 2015, 154, 112–121. [Google Scholar] [CrossRef]
  14. Battisti, L.; Benini, E.; Brighenti, A.; Dell’Anna, S.; Castelli, M.R. Small wind turbine effectiveness in the urban environment. Renew. Energy 2018, 129, 102–113. [Google Scholar] [CrossRef]
  15. Tang, C.; Soong, W.L.; Freere, P.; Pathmanathan, M.; Ertugrul, N. Dynamic wind turbine output power reduction under varying wind speed conditions due to inertia. Wind Energy 2013, 16, 561–573. [Google Scholar] [CrossRef]
  16. Alpman, E. Aerodynamic performance of small-scale horizontal axis wind turbines under two different extreme wind conditions. J. Therm. Eng. 2015, 1, 420–432. [Google Scholar] [CrossRef]
  17. Bradney, D.; Evans, S.; Da Costa, M.S.P.; Clausen, P. Comparison of computational modelling and field testing of a small wind turbine operating in unsteady flows. J. Phys. Conf. Ser. 2016, 753, 082029. [Google Scholar] [CrossRef]
  18. Castellani, F.; Astolfi, D.; Becchetti, M.; Berno, F.; Cianetti, F.; Cetrini, A. Experimental and Numerical Vibrational Analysis of a Horizontal-Axis Micro-Wind Turbine. Energies 2018, 11, 456. [Google Scholar] [CrossRef]
Figure 1. The small HAWT in the wind tunnel open test section.
Machines 06 00052 g001
Figure 2. A sketch of the wind tunnel.
Machines 06 00052 g002
Figure 3. Simulink model of the closed loop control.
Machines 06 00052 g003
Figure 4. The wind time series for test 1, test 2, and test 3.
Machines 06 00052 g004
Figure 5. The rotor speed time series for test 1 (red) and test 3 (blue).
Machines 06 00052 g005
Figure 6. The power output time series for test 1 (red) and test 3 (blue).
Machines 06 00052 g006
Figure 7. Time series of the rotor speed for test 1.
Machines 06 00052 g007
Figure 8. Power versus rotor speed for experimental measurements of test 1 (green) and test 3 (black) compared to the numerical results (red).
Machines 06 00052 g008
Figure 9. Wind versus rotor speed for experimental measurements and numerical results (both for test 1).
Machines 06 00052 g009
Figure 10. Comparison of the experimental (green) and numerical (red) time series of the rotor speed versus wind speed (test 1).
Machines 06 00052 g010
Table 1. Mean, RSD and CF of the wind time series: test 1 and test 3.
MetricTest 1Test 3
μ (m/s)8.438.42
RSD (%)6.87.7
CF1.15711.1622
Table 2. Mean, RSD and CF of the rotor speed time series: test 1 and test 3.
MetricTest 1Test 3
μ (rpm)470471
RSD (%)11.49.7
CF1.24301.1723
Table 3. Mean, RSD and CF of the power output time series: test 1 and test 3.
MetricTest 1Test 3
μ (W)527526
RSD (%)30.025.0
CF1.71631.4701
Table 4. Mean, RSD and CF of power output time series from numerical and experimental analysis.
Output Power (W)
Test 1Test 2Test 3
μ RSD (%)CF μ RSD (%)CF μ RSD (%)CF
experimental52730.01.716352829.71.510752625.01.4701
numerical53318.01.479253725.01.445653724.41.4885
Table 5. Mean, RSD and CF of rotor speed time series from numerical and experimental analysis.
Rotor Speed (rpm)
Test 1Test 2Test 3Test 4
μ RSD (%)CF μ RSD (%)CF μ RSD (%)CF μ RSD (%)CF
experimental47011.41.243047211.61.18274719.71.172338619.21.2837
numerical4797.61.160547710.51.160947710.31.172046113.41.2117
Table 6. Numerical and experimental results for the phase shift (expressed in percentage of the period) between wind speed and rotor speed.
Phase Shift (%)
Test 1Test 2Test 3Test 4
experimental235−1−4
numerical−7−7−4−20

