1. Introduction
Tumor proliferation and early response to molecularly targeted therapy can be imaged using 3′-deoxy-3′[(18)F]-fluorothymidine positron emission tomography (18 F-FLT PET/CT) [
1,
2,
3,
4,
5].
Fluorine-18 fluorothymidine (
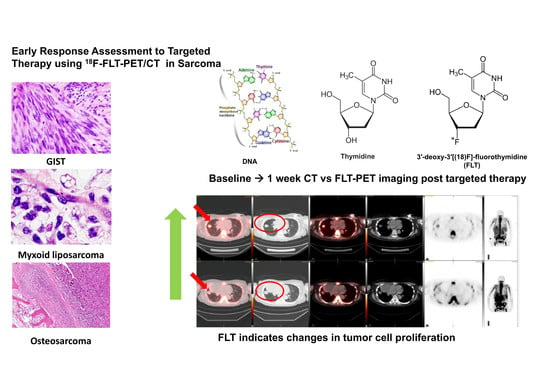
18F-FLT) is a structural analog of the DNA component, thymidine; however, it is not incorporated into the DNA. It is entrapped in the cell due to phosphorylation by thymidine kinase, a part of the proliferation pathway. Hence, this is trapped in the cell and accumulates in the cell. The advantage of
18F-FLT is that, it is a marker of tumor proliferation and its uptake has been shown to be proportional to the DNA synthesis rate and correlative with proliferative index [
1].
Therefore, imaging of cellular proliferation has the potential to become an important diagnostic and/or theranostic tool to not only evaluate the tumor growth rates, but also objectively assess potential response to treatment [
1].
18F-Fluorodeoxyglucose positron emission tomography/CT (
18F-FDG PET CT) is an established imaging modality for diagnosis and staging of many types of cancers including various types of sarcomas. In the imaging of bone and soft tissue sarcomas, FDG-PET was reported to be highly sensitive and especially relevant for estimation of individual prognosis. [
6,
7]
18F-FDG PET CT has been used in early response evaluation in patients with Ewing sarcoma to insulin-like growth factor receptor (IGF1R) targeted therapies. However, tumor grading and differentiation from benign versus malignant tumors may be impacted by nonspecific uptake in inflammatory cells and aggressive benign tumors in multiple sarcoma subtypes. Earlier studies of FDG-PET use in sarcoma have demonstrated an overlap between benign tumors and low-grade sarcomas [
2,
8,
9,
10].
Given these limitations, other novel imaging methods are warranted. Interestingly,
18F-FLT PET/CT has been utilized to image sarcomas and has the potential to be used for grading and staging of multiple aggressive sarcoma sub-types. In a study of
18F-FLT PET/CT in the context of neoadjuvant chemotherapy,
18F-FLT uptake, but not
18F-FDG uptake correlated significantly with tumor grading [
10]. Given this background, it would be appealing to non-invasively image cell proliferation and evaluate intra-tumoral kinetics in response to molecularly targeted therapy in sarcoma. We hypothesized that early response and/or resistance to targeted therapy can be evaluated using FLT-PET CT in patients with sarcoma. We evaluated intra-tumoral kinetics by FLT-PET imaging [
11], to c-MET inhibitors and MDM2 inhibitors in patients with multiple types of sarcoma.
2. Patients and Methods
This was a single-institution study that was approved by the local institutional review board and was compliant with the Health Insurance Portability and Accountability Act. Written informed consent was obtained from each participant. Fifteen patients with histologically proven sarcomas were enrolled. A baseline
18F-FLT PET/CT was obtained before treatment with
MDM2 or
C-MET inhibitor followed by a second
18F-FLT PET/CT approximately 1–15 weeks after treatment in all participants (
Table 1 and
Table 2).
The radiosynthesis of
18F-FLT was produced according to a method already described [
2,
3,
4,
12]. Briefly, fluorine-18 fluoride was prepared by the
18O (p, n)
18F reaction using >95% O-18 enriched water as the target material with a titanium window and target holder. The enriched water was bombarded with 17 MeV protons at 30 microamps. At the end of bombardment, the target water was pushed out of the target by helium pressure into the hot cell where the fluorine-18 fluoride was trapped on an anion exchange resin. The
18F fluoride was then eluted with [2.2.2.] Kryptofix
®/potassium carbonate solution and the fluoride was dried by azeotropic distillation with acetonitrile. The
18F fluoride was then reacted with the 5′-benzoate of 2,3′-anhydrothymine in DMSO at 160 °C (4); then, after cooling down to 50 °C, 1% NaOH (0.35 mL) heated to 50 °C, 0.2 M NaH
2PO
4 (0.75 mL), and 1.5 mL of 8% EtOH/92% 0.01 M NaH
2PO
4 were added before passing through an alumina cartridge and loaded on a preparative HPLC column. The FLT was purified by high-performance liquid chromatography on an
18C reversed phase column using 8% ethanol/92% 0.01 M NaH
2PO
4 as the mobile phase. The yield was typically 20–50 mCi, and the specific activity was 1–4 Ci/mmol.
We reviewed the medical records of patients with advanced cancer including sarcoma who had functional FLT/PET imaging as part of their care at MD Anderson. This study was performed in accordance with the guidelines of the MD Anderson Institutional Review Board (IRB). Because this was a retrospective chart review, IRB waived the consent requirements. They were enrolled on c-MET and mdm-2-based trials available in the institution.
After a washout period from progression of standard care therapy, patients were enrolled in the Phase 1 clinical trials with targeted therapies. Patients had baseline scans that included CT of the chest, abdomen, and pelvis, and a bone scan. This was primarily used for an evaluation of response. FLT studies were performed before the initiation of the study drug, and follow-up images were obtained according to the therapy protocol. Patients fasted for 3 h prior to 18F-FLT administration.
PET/CT studies were performed using a Discovery ST8 PET/CT system (GE Healthcare) in combination with the CT component of an 8-MDCT scanner (LightSpeed, GE Healthcare). A single-dose injection of 184–360 MBq (4.96–9.72 mCi) of 18F-FLT was administered intravenously. Whole-body PET imaging (WB PET) consisted of 4 or 5 bed positions, 10 min per bed position approximately 60 min after radiotracer injection. PET images were reconstructed using standard vendor-provided reconstruction algorithms. The CT component of the study consisted of a helical scan covering the head to the mid-thighs (120 kVp, 300 mA, 0.5-s rotation; table speed, 13.5 mm/rotation) with no contrast enhancement. Axial CT images were reconstructed with a slice thickness of 3.75 mm. The PET projection data were corrected for random coincidences, scatter, and attenuation. Transaxial images were reconstructed into 128 × 128 pixel images with a pixel size of at least 4.5 mm. PET images were reconstructed using standard vendor-provided reconstruction algorithms that incorporate ordered-subset expectation maximization and were corrected for attenuation using data from the CT component of the examination; emission data were corrected for scatter, random events, and dead-time losses as well using the PET/CT scanner’s standard algorithms. The dose calibrators (CRC-15R; Capintec) were cross-calibrated with the PET/CT measuring instrument to ensure quantitative accuracy of the PET data. Measurements of uptake and retention in tumors were obtained from the WB PET acquisition and compared to normal tissue.
Regional whole-body reconstructed PET/CT data were stored in the Digital Imaging and Communications in Medicine 3.0, part 10, file format, and transferred to a PET/CT image analysis workstation. Three-dimensional volumes of interest (VOIs) of identifiable primary tumors and metastases and source organs were constructed on the CT images, and their positions verified on the corresponding PET images to include all organ activity. These VOIs were then used for PET image analysis. The identifiable source organs analyzed were the heart, liver, gallbladder, kidneys, urinary bladder, small and large intestines, brain, and whole body. Three-dimensional VOI definitions were used to visually inspect for mis-registration due to motion between sequential scans of the same segment. Residual errors were manually corrected by redefining the VOIs when necessary; this was necessary only for the gall bladder and urinary bladder, in the event that gradual accumulation of radioactivity as well as enlargement over the course of the PET scan occurred.
Blinded image interpretation was performed by two experienced nuclear medicine specialists (>15 years of experience each, KK, ES). 18F-FLT PET/CT uptake of target lesions was evaluated visually as present or absent. Certainty of the findings was graded on a 3-point scale. Only after the scans were visually interpreted and the final interpretation/score entered for each patient did these specialists determine the maximum SUV for each residual mass/lesion by CT, regardless of whether it was FLT-PET-negative. Percentual FLT changes were calculated as compared to baseline SUV-values, and a change of >10% was considered significant (cut-off, see Discussion).
3. Results
A total of 15 patients with sarcoma were included in the study. The results are presented in
Table 1 and
Table 2. Five patients were treated with an
MDM2 inhibitor. They had a total of seven lesions analyzed with
18F-FLT PET CT. The patients had a diagnosis of malignant fibrous histiocytoma, Ewing sarcoma, liposarcoma, Gastro neuroectodermal tumor (GNET), and leiomyosarcoma (
Table 1)
The patients underwent FLT scanning at baseline and at least twice after the initiation of therapy. One patient had imaging studies at three time points. The first follow-up study was performed at 2–8 weeks and the second follow up was at 8–15 weeks. The interval between the investigations was at least six weeks. Three of these five patients responded according to the FLT-change, i.e., at least 10% decrease in activity (based on early response criteria). The two patients who did not respond had lung metastases unilaterally or bilaterally.
Four patient cases are shown (
Figure 1,
Figure 2,
Figure 3 and
Figure 4). A patient with GNET-tumor was studied at baseline and then subsequently at 1, 7, and 15 weeks with
18F-FLT. In addition, the patient also had
18F-FDG-PET imaging study at baseline and at 7 and 15 weeks (
Figure 1). This patient had two mesenteric lymph node metastases (annotated R (right) and L(left)); with
18F-FLT, the outcome at seven weeks was -25% (R) and +7% (L), whereas
18F-FDG did not show any response (+19% (R) and +21% (L)). Later, at 15 weeks, the response was clear for
18F-FLT, with a change of −38% (R) and −38% (L), whereas
18F-FDG did not show any clear response (−18% (R) and −2% (L)). A patient with liposarcoma is shown in
Figure 2 demonstrating anterior peritoneal mass with three connecting compartments. The patient was studied at baseline and at 1, 8, and 15 weeks with
18F-FLT. FLT-uptakes decreased in the most active site as follows: SUVmax 5.8→4.2 (−28%) →3.5 (−40%). The biggest tumor actually increased in size on CT as follows: 4.1 cm × 3.2 cm →5.5 cm × 4.1 cm→5.6cm × 5.2 cm (
Figure 2).
Next, 10 patients who were treated with c-met inhibitor (5 patients) or -2 inhibitor (5 patients) and had a total of 11 lesions were studied for early response with FLT (
Table 2). They were studied at baseline and once after the initiation of the new therapy at 1–4 weeks. Five patients demonstrated FLT response, three patients had no change, and two patients progressed. Among these patients, two anecdotal patient cases are detailed in the figures. A patient with clear cell sarcoma of the left foot was studied at baseline and at one week with
18F-FLT and with
18F-FDG (
Figure 3). This patient had a sub-carinal lymph node metastasis. With
18F-FLT, the outcome at one week was −13% (R), whereas
18F-FDG did not show any response +37%, and SUVmax increased from 8.9 to 12.2. On CT scans, the tumor was slightly larger: 2.2 cm × 1.2 cm →2.3 cm × 1.5 cm (
Figure 3). In
Figure 4, a patient with a fibrous tumor in pleura is shown, demonstrating a right lung mass. The patient was studied at baseline and at 1 week with
18F-FLT and the concentration decreased −43%. On CT, the tumor was slightly larger: 2.4 cm × 1.9 cm →2.5 cm × 2.0 cm (
Figure 4).
4. Discussion
The utility of
18F-FLT in the evaluation of early treatment response in patients with sarcomas is largely unknown, even though several anecdotal non-clinical [
13,
14,
15,
16,
17] and clinical experience in case reports exist [
18]. This is a preliminary report of using
18F-FLT-CT in the assessment of response/ early signals of activity for two novel targeted therapies in multiple types of sarcomas.
Sarcomas are very heterogeneous tumors. It has already been shown that diagnosis and staging can be performed in small populations both by using
18F-FLT and
18F-FDG [
2,
8,
9,
10]. Grading between low grade and high grade is also possible with both tracers. In one study [
10], mean FLT-SUV in benign lesions was 0.7 (range 0.3–1.3), and 1.3 in low-grade sarcoma (grade1; range 1.0–1.6), 4.1 (range, 2.2–6.0;
p = 0.002) and 6.1 (range, 2.5–8.3;
p = 0.001) in grade 2 and grade 3 tumors, respectively. FLT but not FDG uptake correlated significantly with tumor grading (
r = 0.71 versus
r = 0.01) [
10], and a cutoff value of 2.0 for FLT-SUV discriminated between low- and high-grade tumors. All the tumors in
Table 1 were high-grade sarcomas according to the FLT classification and these were imaged three times. The tumors in
Table 2 vary from grade 1 to grade 3.
The cut off-value for significant FLT-change has not been discussed in the assessment of early response, because there are no earlier studies nor published criteria. In
Figure 3, the decrease of 13% can be seen clearly. The change of 10% being significant is based on our own experience in this material where the highest baseline value was 8.8 and lowest 0.7, respectively. Thus, the 10% change would correspond to SUV changes more than 0.1–0.9 in these patients, which even can be visually observed. There might be a dynamic factor, but 10 of the 15 patients were studied at 1–4 weeks. Typically, PET response is evaluated at 2–3 months. In our case series of only five patients studied for more than three times should be viewed a preliminary. This does not enable further inferences for dynamic behavior of FLT in the early response assessment.
Because thymidine is a DNA base, not found in RNA, which can be labelled with fluorine without essentially changing thymidine kinetics, it acts as a surrogate for DNA synthesis and cellular proliferation. After an intravenous injection, FLT crosses cell membranes and enters tissues by nucleoside transporters, which influence uptake in tumors [
4]. This FLT uptake is proportional to cellular proliferation in tumors, whereas glucose uptake is regulated by
glut-1 transporter and characterized by glucose consumption.
Here, we have shown that multiple sarcoma subtypes can be imaged using FLT (
Figure 1,
Figure 2,
Figure 3 and
Figure 4.
Figure 1 demonstrates that FDG uptake increases early, whereas FLT remains stable or decreases. The FDG uptake may also demonstrate pseudoprogression, which is typical for immunotherapies. Similarly, in
Figure 3, the FLT uptake decreases and FDG uptake increases. We also see that the decrease in cell proliferation can be imaged using FLT in spite of the SUV level (
Figure 1,
Figure 2,
Figure 3 and
Figure 4).
Although this a small study, we show that FLT may be used to predict responses to c-MET inhibitor or MDM2 inhibitor in diverse sarcoma sub-types. In spite of a very heterogeneous population, we have been able to demonstrate early response in seven out of eight patients who responded according to early response criteria. Early progression based on FLT increase more than 10% was seen in four out of four patients who progressed (
Table 1 and
Table 2). Early FDG uptake increased in three patients studied at the same time, whereas the FLT uptake decreased. This should be considered as anecdotal, because FDG was not planned for comparison. Additionally, subtle changes and intra-tumor dynamics that may not be readily evaluable in conventional CT scans can be visualized with FLT PETs. Although RECIST responses are used in sarcomas in clinical trials, they have their shortcomings in sarcoma and may also be challenging to interpret (
Table 1 and
Table 2). Many sarcomas do not shrink when they respond to systemic therapy, especially targeted therapy. Several other criteria have been evaluated in sarcoma to assess response or lack of response to therapies.
FLT PET should always be used as a follow-up of a new therapy for comparison with baseline. A single study may be beneficial only for staging of aggressive tumors with high uptakes. We also observed that intra- and intertumoral heterogeneity could be visualized using FLT, such as in
Figure 2. There is a trend of sex difference showing that females’ response is more pronounced than males. However, given the heterogeneity of the tumors, heterogeneity of therapy, different therapies in different dose levels, low number of patients, and the power, it may be premature to make observations or any conclusions based on this data.
In this pilot study, proliferative early response was assessed by
18F-FLT-PET scans at baseline and during the course of the trial of c-met inhibitors and mdm2 –inhibitors. Especially, for the 10 patients who were imaged early, all the studies were carried out up to four weeks after initiation of the therapy. The additional five patients, who were assessed in at least three time points up to 15 weeks, were also assessed early. Earlier FLT has been assessed only after completing neoadjuvant therapy. A pilot study by Benz et al., which also studied tissue thymidine kinase 1(TK1) and Ki-67, did not find any correlation between FLT uptake and TK1 nor with Ki-67 [
8]. It turned out to be of limited value in the assessment of response; in their 20 patients, 3 responded to neoadjuvant therapy, i.e., mostly chemoradiotherapy or chemotherapy (15 patients totally), whereas targeted therapy was given only to three patients and two patients got radiation only [
8].
Here, we tested the use of early FLT in two forms of targeted therapy. In our 15 patient study, change in the FLT behavior was observed in 12 patients, 8 patients demonstrated response, and 4 progressed, meaning that 80% of the patients had new complementary information. There was no change in three patients (20%).
Our study demonstrates that in spite of its heterogeneity and challenges in early diagnostics, FLT may be relevant in the assessment of new targeted therapies in sarcomas.


