Article

Increased E2F1 mRNA and miR-17-5p Expression Is Correlated to Invasiveness and Proliferation of Pituitary Neuroendocrine Tumours

1
Research Laboratory, Hospital General Universitario de Alicante-Institute for Health and Biomedical Research (ISABIAL), 03010 Alicante, Spain
2
Department of Endocrinology & Nutrition, Hospital General Universitario de Alicante -ISABIAL, 03010 Alicante, Spain
3
Department of Endocrinology and Nutrition, Hospital La Ribera, Alzira, 46600 Valencia, Spain
4
Department of Endocrinology & Nutrition, Hospital Universitario y Politécnico La Fe, 46026 Valencia, Spain
5
Department of Endocrinology & Nutrition, Hospital General Universitario de Albacete, 02006 Albacete, Spain
6
Department of Pathology, Hospital General Universitario de Alicante -ISABIAL, 03010 Alicante, Spain
7
Department of Endocrinology & Nutrition, Hospital General Universitario de Alicante, Miguel Hernández University, 03010 Alicante, Spain
*
Author to whom correspondence should be addressed.
Diagnostics 2020, 10(4), 227; https://doi.org/10.3390/diagnostics10040227
Submission received: 16 March 2020 / Revised: 12 April 2020 / Accepted: 15 April 2020 / Published: 16 April 2020
(This article belongs to the Section Pathology and Molecular Diagnostics)

Abstract

:
miR-17-5p and E2F1 have been described as deregulated in cancer, but they have scarcely been studied in pituitary neuroendocrine tumours (PitNETs). This study evaluates the relationship of E2F1 and miR-17-5p with the invasiveness and proliferation of PitNETs. In this cross-sectional descriptive study, we evaluated the expression of E2F1, MYC, and miR-17-5p by quantitative real time PCR analysis in 60 PitNETs: 29 gonadotroph (GT), 15 functioning somatotroph (ST), and 16 corticotroph (CT) tumours, of which 8 were silent (sCT). The clinical data were collected from the Spanish Molecular Register of Pituitary Adenomas (REMAH) database. We defined invasiveness according to the Knosp classification and proliferation according to a molecular expression of Ki-67 ≥ 2.59. E2F1 was more expressed in invasive than in non-invasive tumours in the whole series (p = 0.004) and in STs (p = 0.01). In addition, it was overexpressed in the silent subtypes (GTs and sCTs; all macroadenomas) and normoexpressed in the functioning ones (fCTs and STs; some microadenomas). miR-17-5p was more expressed in proliferative than in non-proliferative tumours (p = 0.041) in the whole series but not by subtypes. Conclusions: Our study suggests that in PitNETs, E2F1 could be a good biomarker of invasiveness, and miR-17-5p of proliferation, helping the clinical management of these tumours.

1. Introduction

One of the hallmarks of cancer in humans is the deregulation of E2F transcriptional activity through the alteration of the p16INK4a-cyclinD1-retinoblastoma protein (Rb) pathway. E2F is a family of transcription factors that controls the expression of important genes for the progression of the cell cycle, apoptosis, DNA repair, and cellular differentiation. E2F1 is a transcription factor belonging to the E2F family that has the ability to induce two seemingly contradictory processes. Its activation can stimulate the growth and the proliferation of the cells, but it also participates in the apoptotic process, protecting against tumourigenesis [1,2,3]. E2F1 is widely involved in tumorigenesis [1,3,4]. In pituitary neuroendocrine tumours (PitNETs), its participation in the growth and proliferation of the tumours has been related through its relationship with other factors such as HMGA1 [5] or PTTG1 [6].
E2F1 is under the transcriptional regulation of MYC [7], and it has also been shown that some miRNAs have a great influence on its activity [4,8,9,10]. Moreover, miRNAs have also been involved in the tumourigenesis process of PitNETs [11]. Indeed, Bottoni et al. identified 30 miRNAs that are differentially expressed in normal and adenomatous pituitary tissues [12]. Pri-miR-17-92 is a primary miRNA that gives rise to the mature miRNAs 17, 18a, 19a, 20a, 19b, and 92a when processed. This polycistronic complex is under the regulation of MYC [13] and factors of the E2F1 family [14]. However, it has never been studied in PitNETs.
Therefore, the aim of this study was to assess the relationship between the expression of E2F1 and the behaviour of PitNETs and its regulation by MYC and the miR-17-92 cluster.

2. Materials and Methods

This study complies with the Declaration of Helsinki and was approved by the local ethics committee (2012/08 of 27 June 2012). All patients signed an informed consent.

2.1. Samples

We selected 60 PitNETs from the biobank pituitary collection of the Alicante General University Hospital and 9 normal pituitary glands obtained from autopsies performed at the same centre. All specimens were preserved within 24 h to 48 h after surgery at 4 °C in RNAlater solution and frozen at −80 °C.
The Spanish Molecular Registry of Pituitary Adenomas (REMAH) network initiative allowed us to identify the molecular subtypes of PitNETs [15,16,17]. Namely, we identified the molecular subtypes of PitNETs based on the gene expression of pituitary hormones and some receptors (POMC, CRHR1, AVPR1B, PRL, TSH, GH, FSH, and LH). After that, we chose the overall sample of this study, composed of 29 GTs (including 23 follicle-stimulating-hormone-secreting tumours (FSHoma), 1 luteinising-hormone-secreting-tumour (LHoma) and 5 mixed-gonadotropin-secreting -tumours), 8 sCTs (not expressing Cushing’s syndrome), 8 fCTs (expressing Cushing’s syndrome), and 15 STs (expressing acromegaly syndrome).

2.2. Clinical, Radiological, and Pathological Data of the Patients

Patients’ gender, age, and clinical and radiological data were retrieved anonymously. Clinical information included: endocrine or neuro-ophthalmological symptoms and signs, and biochemical evaluation of the pituitary function.
Two investigators independently reviewed the magnetic resonance images (MRIs) of selected patients. All exams where performed on a 1.5 Tesla magnet Philips Intera (Philips, Amsterdam, Netherlands) according to a predefined protocol including contrast enhanced dynamic and delayed image acquisitions. From these images, tumours were classified according to invasiveness and maximum tumour diameter (MTD). In terms of invasiveness, tumours were classified as invasive (Knosp grades III–IV) or non-invasive (Knosp grades I–II) [18].
Pathological data included the measurement of the relative gene expression of the Ki-67, because it was not possible to centralise its immunohistochemical (IHC) evaluation. To define a Ki-67 gene expression fold change (FC) equivalent to the 3% IHC cutoff, we performed a receiver operator curve analysis (ROC analysis). As a result, we found that 2.59 FC Ki-67 gene expression provided the highest sensitivity (85.5%) and specificity (77.6%). Therefore, tumours were classified as proliferative (Ki-67 ≥ 2.59) or non-proliferative (Ki-67 < 2.59).
According to the clinicopathological classification proposed by Trouillas et al. [19,20], we defined three grades: 1. non-invasive tumours, regardless of the Ki-67 index (value from 0.081 to 11.631; 6 tumours with ki-67 ≥ 2.59), 2. invasive and non-proliferative tumours with Ki-67 index < 2.59, and 3. invasive and proliferative tumours with Ki-67 index ≥ 2.59. Grade 1 corresponds to grades 1a and 1b of the Trouillas’ classification; grades 2 and 3 are similar to grade 2a and grade 2b respectively [19].
In all tumours, we quantified the gene expression of E2F1, MYC, pri-miR-17~92, miR-17-5p, and miR-20a.

2.3. Nucleic Acid Extraction

All experiments were performed equally on problem cases and normal pituitary glands. Tissue fragments, obtained from representative areas of the tumour, were efficiently disrupted, lysed, and homogenised using the TissueLyser (Qiagen, Hilden, Germany) and the corresponding buffer. Genomic DNA, RNA, and proteins were isolated from tumour and control tissues using the AllPrep DNA/RNA/Protein Mini Kit (Qiagen, Hilden, Germany), followed by an extension of the protocol to rescue the miRNAs, according to the manufacturer’s instructions. Total RNA was processed with RNase-Free DNase Set (Qiagen, Hilden, Germany) within the extraction protocol. We evaluated the quality and quantity of total RNA and miRNAs by microcapillary electrophoresis on the 2100 Bioanalyzer (Agilent Technologies, Santa Clara, CA, USA).

2.4. mRNA and miRNA Expression Analysis

Real time PCR (RT-PCR) was performed with the Revert Aid First Strand cDNA Synthesis Kit (Thermo Scientific, Waltham, MA, USA). To analyse miRNA expression, the RT-PCR was performed using the TaqMan MicroRNA Reverse Transcription Kit (Applied Biosystems, Foster City, CA, USA) with the RT-Primers pool, according to the manufacturer’s instructions.
The quantification of mRNA and microRNA expression was performed by quantitative real time PCR (qRT-PCR) with TaqMan technology. The TaqMan Gene Expression Assays and TaqMan MicroRNA Assays (Life Technologies, Carlsbad, CA, USA) chosen are detailed in Table 1. All analyses were done in duplicate and following the same protocol. Normal pituitary autopsy samples were mixed in equal parts into a pool that was analysed as a calibrator. The analyses were performed in 10-µL reaction volumes containing 5 µL of TaqMan Fast Advanced Master Mix (Life Technologies, Carlsbad, CA, USA), 0.5 µL of TaqMan Gene or miRNA Expression Assay (Life Technologies, Carlsbad, CA, USA), and 2.5 µL of template in the 7500 Fast Real Time PCR System (Applied Biosystems, Foster City, CA, USA), and were analysed using a SDS software (Applied Biosystems, Foster City, CA, USA). A relative quantification (RQ) was established based on the ΔΔCt method in FC units (Applied Biosystems, Foster City, CA, USA).
Gene and miRNA expression variables were categorised as repressed (RQ ≤ 0.5 FC), overexpressed (RQ ≥ 1.5 FC), or similar to physiological expression (normoexpressed: 0.5 FC < RQ < 1.5 FC) for statistical analysis.

2.5. Statistical Analysis

Molecular variables showed a non-normal distribution (Kolmogorov–Smirnov test). Associations between the molecular assays and the clinic-pathological features were calculated. Mann–Whitney U or Kruskal–Wallis tests were used for comparisons between two or more groups, as appropriate. The χ2 test followed by Fisher’s exact test when appropriate was used to identify the correlations between categorical variables. A non-parametric Spearman’s correlation test was used to test the association between molecular variables and age or MTD. The effect of a variable was estimated using 95% confidence interval (CI). For multivariable analysis, we used multiple linear regression between continuous variables and unconditional logistic regression between categorical variables. P values of less than 0.05 were considered statistically significant. Statistical analysis was performed with the SPSS 15.0 software (IBM Software, Armonk, NY, USA).

3. Results

We studied 60 samples from the collection of PitNETs of the biobank of the Alicante Health and Biomedical Research Institute. The demographic, clinical, and radiological characteristics of the patients are shown in Table 2.

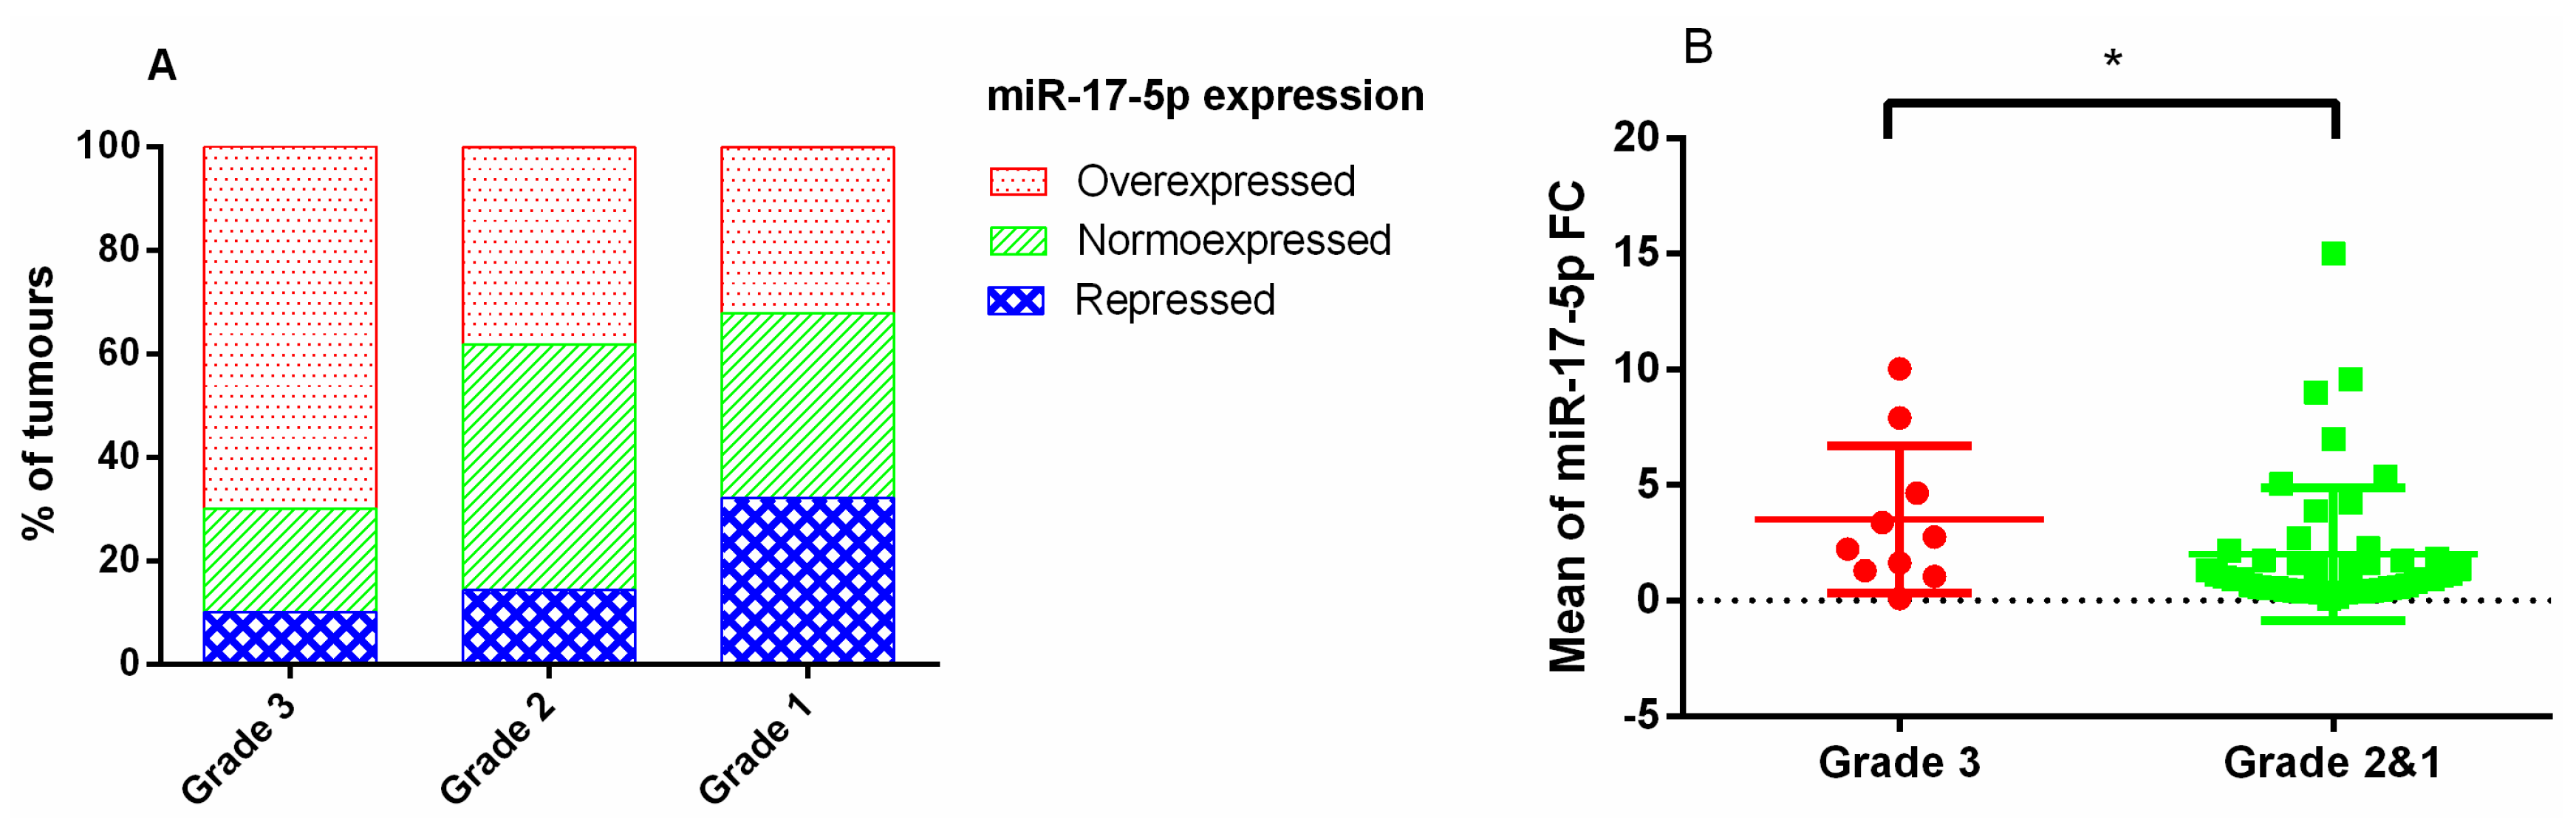
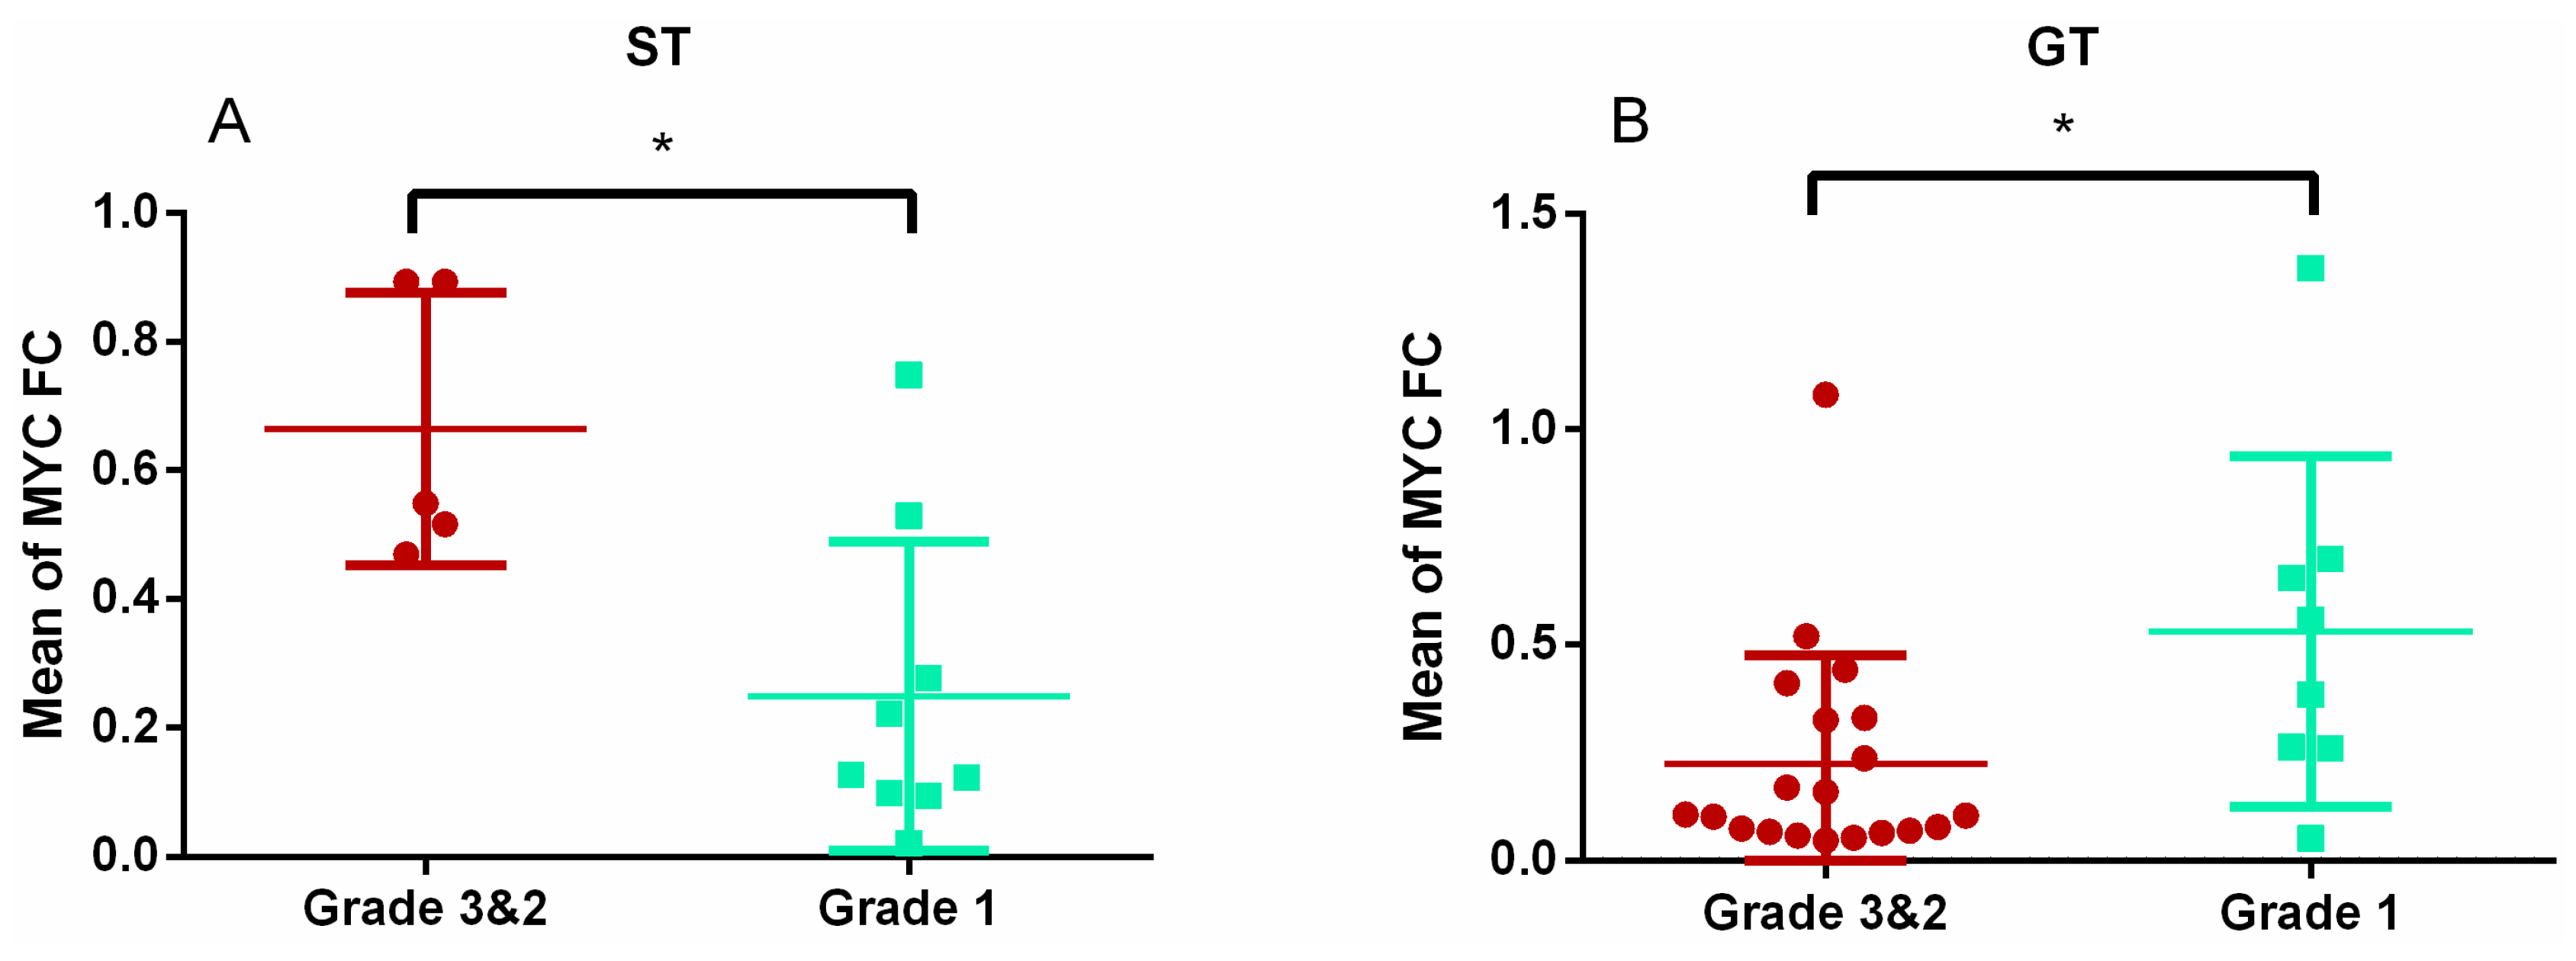
3.1. Relationships between Genes (E2F1/MYC) and miRNAs Studied and PitNET Proliferation

There was no correlation in the expression of E2F1 or MYC among the three categories of PitNETs in the whole series or by subtypes. When we grouped grades 1 and 2 (non-proliferative tumours) to compare them with grade 3 (proliferative tumours), the results did not change (Figure 1A,B).
By contrast, we found significant differences in the expression of miR-17-5p in the whole series, when we compared grade 3 (proliferative tumours) vs. grades 2 and 1 (non-proliferative or non-invasive tumours) (Figure 2A,B). This difference was not observed in the subtypes.
Indeed, when we compared the expression of the previous genes and miR 17-5p in the tumours according only to their Ki-67 expression, only miR-17-5p was significantly higher in proliferative (Ki-67 ≥ 2.59) compared with non-proliferative tumours (Ki-67 < 2.59) (p = 0.05).

3.2. Relationships between Genes (E2F1/MYC) and miRNAs with the Invasiveness of the Tumours by Magnetic Resonance Imaging

To evaluate the association between the expressions of the genes and miRNAs studied with the invasiveness of PitNETs, we compared invasive tumours (grades 3 and 2) with non-invasive tumours (grade 1).
In the whole series, invasive tumours showed higher E2F1 gene expression than non-invasive ones (p = 0.004; Figure 3A). By subtypes, this finding was only maintained in STs (p = 0.001; Figure 3B). MYC also showed higher expression in invasive STs than in non-invasive ones (p = 0.018; Figure 4A), but not in the whole series. Indeed, the expression of MYC was lower in invasive than in non-invasive GTs (p = 0.033; Figure 4B).
Unlike E2F1 and MYC, there were no differences in the expression of pri-miR-17-92 and mature miRNAs and invasiveness behaviour in the whole series or by subtypes.

3.3. Expression Profiles of E2F1, MYC Genes, and Pri-miR-17-92 by Subtypes

As shown in Table 3, E2F1 was overexpressed in the silent (GTs and sCTs) and normoexpressed in functioning PitNET subtypes (fCTs and STs). Contrarily, MYC was normoexpressed only in the tumours of the corticotroph line (both functioning and silent corticotroph tumours) and repressed in the other subtypes (GTs and STs).
As shown in Table 4, Pri-miR-17-92 was repressed in all PitNET subtypes. However, mature miRNAs (miR-20a and miR-17-5p), similarly to E2F1, appeared slightly overexpressed in the silent subtypes (GT and sCT) and normoexpressed in functioning PitNET subtypes (fCTs and STs).
Finally, there was a negative correlation between E2F1 and mature miRNAs expression in the whole series. Only pri-miR-17~92 correlated positively with E2F1 in fCTs, but not in sCTs.

4. Discussion

In this paper, we try to find biomarkers of proliferation and invasiveness in PitNETs and report the possible implication of E2F1, MYC, pri-miR-17~92, miR-20a, and miR-17-5p in pituitary tumourigenesis. The strength of the paper is the size of the sample studied, which allows the analysis of different subtypes of PitNETs, and the scarcity of other published data. On the other hand, one limitation of the study is that we report correlations, which allow the generation of hypotheses, but not definitive conclusions on the relationship between E2F1, MYC, and pri-miR-17-92 in the tumourigenesis of PitNETs.
PitNETs are among the most common intracranial tumours and are usually benign neoplasms [21]. However, 30% to 40% of them invade surrounding structures, and relapses or re-growth during follow-up are frequent [22]. In the absence of more specific markers, IHC assessment of either p53 or the Ki-67 labelling index has been traditionally used as marker of aggressiveness. However, many researchers have raised doubts about their usefulness [12,23,24,25]. Indeed, some years ago, Trouillas et al. [19,20] suggested a classification of the behaviour of pituitary tumours taking into account not only markers of proliferation, but also the IHC type, the invasiveness of the tumours, and their ability to relapse. To the best of our knowledge, E2F1 and MYC have never been studied as possible biomarkers of PitNETs.
E2F1 is a transcription factor with activities related to either inhibiting or stimulating the development of the tumours; therefore, it could be considered a modulator of cell growth and death [1,2,3]. Recently, Fu et al. showed that E2F1 was implicated in the overexpression of CCAT2, which, by interacting with PPTG1, could stimulate the development and progression of PitNETs [26]. In addition, Araki et al. also demonstrated that E2F1 could play a role in pituitary tumourigenesis, through its induction of POMC and ACTH in fCT [27,28]. More recently, Metin-Armagan et al. have suggested the involvement of E2F1 and other genes and proteins, such as CHEK2 and p73, in the tumourigenesis process of non-functioning and functioning (Cushing Disease and Acromegaly) PitNETs [29]. Indeed, in the present study, we observed higher expression of E2F1 in invasive versus non-invasive tumours in the whole series and in the ST subtype. However, we did not find differences in the expression of E2F1 between proliferative (Ki-67 ≥ 2.59) and non-proliferative tumours. Thus, E2F1 could be a potential biomarker of PitNET invasiveness, but not of proliferation.
MYC is an oncogene that participates in the tumourigenesis of most cancers and is associated with poor prognosis [30,31]. In PitNETs, Liu et al. found that the increase of MYC expression could predict the aggressiveness of silent tumours [32]. On the other hand, other authors found protein expression of MYC in just 27% of PitNETs [33]; thus, it can hardly be considered a biomarker of tumour behaviour. In our study, MYC was repressed in all PitNET subtypes, and there was no association between MYC and proliferation in the whole series or for subtypes. However, similarly to E2F1, we found a positive relationship between MYC expression and tumour invasiveness, although only in the ST subtype. The opposite occurred in the GT subtype. In conclusion, and like E2F1, MYC could not be considered a biomarker for PitNET proliferation. On the other hand, more studies are needed to establish a relationship between MYC expression and PitNET invasiveness, because its behaviour could depend on the tumour subtype.
miRNAs are a large group of small RNAs that do not code for proteins and are a fundamental component of gene regulation through the regulation of post-transcriptional events [34,35]. Di Ieva et al. have highlighted the possible role of miRNAs as circulating biomarkers of pituitary tumours, given the high vascularisation of the pituitary gland [11]. Moreover, a recent review performed by Wierinckx et al. highlights the relevant role of miRNAs in tumorigenesis and aggressiveness in PitNETs through their up- or down-regulation and their gene targets [36]. For instance, some years ago, down-regulation of a subset of miRNAs that target HMGA1 and HMGA2 (proteins overexpressed in malignant neoplasms [37]) were identified in PitNETs [38]. Similarly, D’Angelo et al. also observed a down-regulation of a set of miRNAs that target genes (such as HMGA1, 2, and E2F1) whose overexpression or activation plays a critical role in tumorigenesis in pituitary tumours of the somatotroph line [39,40]. Finally, the expressions of miR-23b and miR-130b, which target HMGA2 and CCNA2 genes [41], have been reported as down-regulated in somatotroph, gonadotroph, and silent PitNETs, while miR-183, which targets KIAA0101 [42], appears to be down-regulated in aggressive lactotroph tumours.
In the present paper, we observed that miR-17-5p was overexpressed in proliferative tumours. Wei et al. [43] also have demonstrated higher miR-17-5p expression in pituitary carcinoma and atypical PitNETs compared with typical PitNETs. In their study, they suggest that miR-17-5p is involved in pituitary carcinoma metastasis, attenuating target genes such as PTEN, a tumour suppressor gene, and TIMP2, involved in inhibiting the degradation of the extracellular matrix and basement membrane. Therefore, miR-17-5p could be a good biomarker of proliferation in PitNETs.
Therefore, the higher expression of E2F, MYC, and miR-17-5p in invasive and proliferative tumours (grade 3) than in grade 1 (non-invasive tumours) confirms that both invasiveness and proliferation must be taken into account in PitNET classification [20]. In addition, the high expression of these genes and miRNA, implicated in the cancer, confirms that an invasive and proliferative tumour is not a benign adenoma as a non-invasive tumour, with or without proliferation [20].
In addition to the possible implication of E2F1, MYC, and miRNAs in the behaviour of PitNETs, they could also participate in their functionality. However, there is very little information in the literature. Only Tani et al. looked for differences in the expression of E2F1 between functioning and silent subtypes, without finding any changes [44]. Contrarily, we found that E2F1 was overexpressed in the silent subtypes (GTs and sCTs) and normoexpressed in functioning PitNET subtypes (fCTs and STs). Nonetheless, functioning PitNETs comprised both macroadenomas and microadenomas, whereas all operated silent tumours were macroadenomas. Therefore, there is an important bias of size when trying to interpret the role of E2F1 in the functionality of PitNETs.
As previously noted, E2F1 is under the transcriptional regulation of MYC [7] and of some miRNAs. In the present paper, E2F1 was overexpressed while MYC was repressed in GTs, which suggests a negative feedback between E2F1 and MYC in the regulation of cellular cycle in this subtype. The negative feedback between E2F1 and MYC has been previously described by Zhang et al. in human oesophageal fibroblast (HOF) cells [45,46], through the negative effect of E2F1 on hTERT transcription [45]. However, positive feedback between E2F1 and MYC has also been reported [47,48]. Moreover, it has been recently suggested that the miR-17~92 cluster also participates in the regulation of MYC and E2F1 networks [14,49,50,51]. Indeed, in our study, miR-17-5p was also overexpressed in GTs. The possible interrelations among E2F1, MYC, and miRNAs are outlined in Figure 5, which shows that the negative effect of MYC on E2F1 translation, mediated by miR 17-5p, would surpass its positive effect on E2F1 transcription. A similar relationship between MYC/E2F1 and miR-17-5p was observed in sCTs, but not in the functioning variants of PitNETs (fCTs and STs.) As all non-functioning PitNETs (GTs and sCTs) were macroadenomas, while some functioning PitNETs (fCTs and STs) were microadenomas, the effect of E2F1 on the growth and invasiveness of pituitary tumours could be mediated by its interaction with MYC and miR-17-5p.

5. Conclusions

Our study suggests that in PitNETs, E2F1 could be a good biomarker of invasiveness, and miR-17-5p of proliferation, helping the clinical management of these tumours. In contrast, MYC’s role in PitNET behaviour could be subtype-dependent. The expression of these genes must be evaluated in recurrent/progressive or aggressive PitNETs to precise if they are prognostic markers of tumour behaviour.
Despite some differences in E2F1 expression between functioning (ST and fCT) and non-functioning (GT and sCT) PitNETs, it is difficult to establish a relationship between E2F1 expression and functionality, because all silent operated tumours were macroadenomas, while most STs and fCTs were microadenomas. Finally, the effect of E2F1 on the growth of PitNETs could be mediated by a complex interaction between MYC and miR-17-5p.

Author Contributions

Conceptualisation, A.G.-M. and A.P.; methodology, A.G.-M. and A.P.; validation, A.G.-M. and A.P.; formal analysis, A.G.-M. and A.P.; investigation, A.G.-M. and A.P.; resources, A.G.-M., B.L.-M., C.F., R.C., C.L., S.S.-O., I.A., and A.P.; writing—original draft preparation, A.G.-M. and A.P.; writing—review and editing, A.G.-M., B.L.-M., C.F., R.C., C.L., S.S.-O., I.A., and A.P.; supervision, A.P.; project administration, A.G.-M. and A.P.; funding acquisition, A.P. All authors have read and agreed to the published version of the manuscript.

Funding

This work was supported by a grant from the Investigator Initiated Research (IIR) Program from Pfizer (WS1568384).

Acknowledgments

We thank J. Abarca (Neurosurgery Department, Hospital General Universitario de Alicante, Alicante, Spain), I. Monjas (Otolaryngology Department, Hospital General Universitario de Alicante, Alicante, Spain), P. Riesgo (Neurosurgery Department, Hospital Universitario La Ribera, Valencia, Spain), J.A. Simal (Neurosurgery Department, Hospital Universitario y Politécnico La Fe, Valencia, Spain), and H. Sandoval (Neurosurgery Department, Complejo Universitario de Albacete, Albacete, Spain) for their surgical contributions. We also thank the biobanks of the Complejo Hospitalario Universitario de Albacete, Hospital General Universitario de Alicante, and Hospital Universitario y Politécnico La Fe.

Conflicts of Interest

The authors declare no conflict of interest. The funders had no role in the design of the study; in the collection, analyses, or interpretation of data; in the writing of the manuscript, or in the decision to publish the results.

Abbreviations

CIConfidence interval
CTCorticotroph tumour
FCFold change
fCTFunctioning corticotroph tumour
GTGonadotroph
HOFHuman oesophageal fibroblast
IHCImmunohistochemical
IQRInterquartile range
MTDMaximum tumour diameter
MRIMagnetic resonance image
OROdds ratio
qRT-PCRQuantitative real time polymerase chain reaction
ROCReceiver operator curve
RQRelative quantification
RT-PCRReal time polymerase chain reaction
sCTSilent corticotroph tumour
STSomatotroph tumour

References

  1. Bell, L.A.; Ryan, K.M. Life and death decisions by E2F-1. Cell Death Differ. 2004, 11, 137–142. [Google Scholar] [CrossRef] [PubMed] [Green Version]
  2. Olson, M.V.; Johnson, D.G.; Jiang, H.; Xu, J.; Alonso, M.M.; Aldape, K.D.; Fuller, G.N.; Bekele, B.N.; Yung, W.K.A.; Gomez-Manzano, C.; et al. Transgenic E2F1 expression in the mouse brain induces a human-like bimodal pattern of tumors. Cancer Res. 2007, 67, 4005–4009. [Google Scholar] [CrossRef] [PubMed] [Green Version]
  3. Knoll, S.; Emmrich, S.; Pützer, B.M. The E2F1-miRNA cancer progression network. In MicroRNA Cancer Regulation; Springer: Dordrecht, The Netherland, 2013; pp. 135–147. [Google Scholar] [CrossRef]
  4. Emmrich, S.; Pützer, B.M. Checks and balances: E2F-microRNA crosstalk in cancer control. Cell Cycle 2010, 9, 2555–2567. [Google Scholar] [CrossRef]
  5. Massimi, I.; Guerrieri, F.; Petroni, M.; Veschi, V.; Truffa, S.; Screpanti, I.; Frati, S.; Levrero, M.; Gulino, A.; Giannini, G. The HMGA1 protoncogene frequently deregulated in cancer is a transcriptional target of E2F1. Mol. Carcinog. 2013, 52, 526–534. [Google Scholar] [CrossRef]
  6. Zhou, C.; Wawrowsky, K.; Bannykh, S.; Gutman, S.; Melmed, S. E2F1 induces pituitary tumor transforming gene (PTTG1) expression in human pituitary tumors. Mol. Endocrinol. 2009, 23, 2000–2012. [Google Scholar] [CrossRef] [Green Version]
  7. Dong, P.; Maddali, M.V.; Srimani, J.K.; Thélot, F.; Nevins, J.R.; Mathey-Prevot, B.; You, L. Division of labour between Myc and G1 cyclins in cell cycle commitment and pace control. Nat. Commun. 2014, 5, 4750. [Google Scholar] [CrossRef] [PubMed] [Green Version]
  8. Ma, C.; Han, J.; Dong, D.; Wang, N. MicroRNA-152 suppresses human osteosarcoma cell proliferation and invasion by targeting E2F transcription factor 3. Oncol. Res. 2018, 26, 765–773. [Google Scholar] [CrossRef] [PubMed]
  9. Sippl, C.; Teping, F.; Ketter, R.; Braun, L.; Tremmel, L.; Schulz-Schaeffer, W.; Oertel, J.; Urbschat, S. The Influence of Distinct Regulatory miRNAs of the p15/p16/RB1/E2F Pathway on the Clinical Progression of Glioblastoma Multiforme. World Neurosurg. 2019, 132, e900–e908. [Google Scholar] [CrossRef]
  10. Guo, H.; Zhang, L. MicroRNA-30a suppresses papillary thyroid cancer cell proliferation, migration and invasion by directly targeting E2F7. Exp. Ther. Med. 2019, 18, 209–215. [Google Scholar] [CrossRef] [Green Version]
  11. Di Ieva, A.; Butz, H.; Niamah, M.; Rotondo, F.; De Rosa, S.; Sav, A.; Yousef, G.M.; Kovacs, K.; Cusimano, M.D. MicroRNAs as Biomarkers in Pituitary Tumors. Neurosurgery 2014, 75, 181–189. [Google Scholar] [CrossRef]
  12. Botelho, C.H.A.; De Magalhães, A.V.; De Mello, P.A.; Schmitt, F.C.; Casulari, L.A. Expression of p53, KI-67 and c-erb B2 in growth hormone- and/or prolactin-secreting pituitary adenomas. Arq. Neuro-Psiquiatr. 2006, 64, 60–66. [Google Scholar] [CrossRef] [PubMed] [Green Version]
  13. Cloonan, N.; Brown, M.K.; Steptoe, A.L.; Wani, S.; Chan, W.L.; Forrest, A.R.; Kolle, G.; Gabrielli, B.; Grimmond, S.M. The miR-17-5p microRNA is a key regulator of the G1/S phase cell cycle transition. Genome Biol. 2008, 9, R127. [Google Scholar] [CrossRef] [PubMed] [Green Version]
  14. Aguda, B.D.; Kim, Y.; Piper-hunter, M.G.; Friedman, A.; Marsh, C.B. MicroRNA regulation of a cancer network: MiR-17-92, E2F, and Myc. Proc. Natl. Acad. Sci. USA 2008, 105, 19678–19683. [Google Scholar] [CrossRef] [PubMed] [Green Version]
  15. Luque, R.M.; Ibáñez-Costa, A.; Sánchez-Tejada, L.; Rivero-Cortés, E.; Robledo, M.; Madrazo-Atutxa, A.; Mora, M.; Álvarez, C.V.; Lucas-Morante, T.; Álvarez-Escolá, C.; et al. El Registro Molecular de Adenomas Hipofisarios (REMAH): Una apuesta de futuro de la Endocrinología española por la medicina individualizada y la investigación traslacional. Endocrinol. Nutr. 2016, 63, 274–284. [Google Scholar] [CrossRef]
  16. Sanchez-Tejada, L.; Sanchez-Ortiga, R.; Lamas, C.; Camara, R.; Riesgo, P.; Fajardo, C.; Aranda, F.I.; Pico, A. Contribution of molecular analysis to the typification of the non-functioning pituitary adenomas. PLoS ONE 2017, 12, e0180039. [Google Scholar] [CrossRef] [Green Version]
  17. García-Martínez, A.; Sottile, J.; Fajardo, C.; Riesgo, P.; Cámara, R.; Simal, J.A.; Lamas, C.; Sandoval, H.; Aranda, I.; Picó, A. Is it time to consider the expression of specific-pituitary hormone genes when typifying pituitary tumours? PLoS ONE 2018, 13, e0198877. [Google Scholar] [CrossRef] [PubMed] [Green Version]
  18. Micko, A.S.G.; Wöhrer, A.; Wolfsberger, S.; Knosp, E. Invasion of the cavernous sinus space in pituitary adenomas: Endoscopic verification and its correlation with an MRI-based classification. J. Neurosurg. 2015, 122, 803–811. [Google Scholar] [CrossRef]
  19. Trouillas, J.; Roy, P.; Sturm, N.; Dantony, E.; Cortet-Rudelli, C.; Viennet, G.; Bonneville, J.-F.; Assaker, R.; Auger, C.; Brue, T.; et al. A new prognostic clinicopathological classification of pituitary adenomas: A multicentric case-control study of 410 patients with 8 years post-operative follow-up. Acta Neuropathol. 2013, 126, 123–135. [Google Scholar] [CrossRef]
  20. Trouillas, J.; Jaffrain-Rea, M.L.; Vasiljevic, A.; Raverot, G.; Roncaroli, F.; Villa, C.C. How to classify the pituitary neuroendocrine tumors (PitNET)s in 2020. Cancers 2020, 12, 514. [Google Scholar] [CrossRef] [Green Version]
  21. Yang, Q.; Li, X. Molecular network basis of invasive pituitary adenoma: A review. Front. Endocrinol. 2019, 10, 7. [Google Scholar] [CrossRef] [Green Version]
  22. Scheithauer, B.W.; Kovacs, K.T.; Laws, E.R.; Randall, R.V. Pathology of invasive pituitary tumors with special reference to functional classification. J. Neurosurg. 1986, 65, 733–744. [Google Scholar] [CrossRef] [PubMed] [Green Version]
  23. Suliman, M.; Royds, J.; Cullen, D.; Timperley, W.; Powell, T.; Battersby, R.; Jones, T.H. Mdm2 and the p53 pathway in human pituitary adenomas. Clin. Endocrinol. 2001, 54, 317–325. [Google Scholar] [CrossRef] [PubMed]
  24. Madsen, H.; Borges, T.M.; Knox, A.J.; Michaelis, K.A.; Xu, M.; Lillehei, K.O.; Wierman, M.E.; Kleinschmidt-DeMasters, B.K. Giant pituitary adenomas: Pathologic-radiographic correlations and lack of role for p53 and MIB-1 labeling. Am. J. Surg. Pathol. 2011, 35, 1204–1213. [Google Scholar] [CrossRef]
  25. Hentschel, S.J.; McCutcheon, I.E.; Moore, W.; Durity, F.A. P53 and MIB-1 immunohistochemistry as predictors of the clinical behavior of nonfunctioning pituitary adenomas. Can. J. Neurol. Sci. 2003, 30, 215–219. [Google Scholar] [CrossRef] [PubMed] [Green Version]
  26. Fu, D.; Zhang, Y.; Cui, H. Long noncoding RNA CCAT2 is activated by E2F1 and exerts oncogenic properties by interacting with PTTG1 in pituitary adenomas. Am. J. Cancer Res. 2018, 8, 245–255. [Google Scholar]
  27. Araki, T.; Liu, N.A.; Tone, Y.; Cuevas-Ramos, D.; Heltsley, R.; Tone, M.; Melmed, S. E2F1-mediated human POMC expression in ectopic Cushing’s syndrome. Endocr. Relat. Cancer 2016, 23, 857–870. [Google Scholar] [CrossRef] [Green Version]
  28. Araki, T.; Liu, X.; Kameda, H.; Tone, Y.; Fukuoka, H.; Tone, M.; Melmed, S. EGFR Induces E2F1-Mediated Corticotroph Tumorigenesis. J. Endocr. Soc. 2017, 1, 127–143. [Google Scholar] [CrossRef] [Green Version]
  29. Metin-Armagan, D.; Comunoglu, N.; Bulut, G.; Kadioglu, P.; Kameda, H.; Gazioglu, N.; Tanriover, N.; Ozturk, M. A Novel Expression Profile of Cell Cycle and DNA Repair Proteins in Nonfunctioning Pituitary Adenomas. Endocr. Pathol. 2020, 31, 2–13. [Google Scholar] [CrossRef]
  30. Albihn, A.; Johnsen, J.I.; Henriksson, M.A. MYC in oncogenesis and as a target for cancer therapies. Adv. Cancer Res. 2010, 107, 163–224. [Google Scholar] [CrossRef]
  31. Fernandez, P.C.; Frank, S.R.; Wang, L.; Schroeder, M.; Liu, S.; Greene, J.; Cocito, A.; Amati, B. Genomic targets of the human c-Myc protein. Genes Dev. 2003, 17, 1115–1129. [Google Scholar] [CrossRef] [Green Version]
  32. Liu, C.; Wu, Y.; Yu, S.; Bai, J.; Li, C.; Wu, D.; Zhang, Y. Increased β-catenin and c-myc expression predict aggressive growth of non-functioning pituitary adenomas: An assessment using a tissue microarray-based approach. Mol. Med. Rep. 2017, 15, 1793–1799. [Google Scholar] [CrossRef] [PubMed] [Green Version]
  33. Wang, D.G.; Johnston, C.F.; Atkinson, A.B.; Heaney, A.P.; Mirakhur, M.; Buchanan, K.D. Expression of bcl-2 oncoprotein in pituitary tumours: Comparison with c-myc. J. Clin. Pathol. 1996, 49, 795–797. [Google Scholar] [CrossRef] [PubMed] [Green Version]
  34. Lu, T.X.; Rothenberg, M.E. MicroRNA. J. Allergy Clin. Immunol. 2018, 141, 1202–1207. [Google Scholar] [CrossRef] [Green Version]
  35. Gulyaeva, L.F.; Kushlinskiy, N.E. Regulatory mechanisms of microRNA expression. J. Transl. Med. 2016, 14, 143. [Google Scholar] [CrossRef] [PubMed] [Green Version]
  36. Wierinckx, A.; Roche, M.; Legras-Lachuer, C.; Trouillas, J.; Raverot, G.; Lachuer, J. MicroRNAs in pituitary tumors. Mol. Cell. Endocrinol. 2017, 456, 51–61. [Google Scholar] [CrossRef]
  37. Fusco, A.; Fedele, M. Roles of HMGA proteins in cancer. Nat. Rev. Cancer 2007, 7, 899–910. [Google Scholar] [CrossRef]
  38. Palmieri, D.; D’angelo, D.; Valentino, T.; De Martino, I.; Ferraro, A.; Wierinckx, A.; Trouillas, J.; Fusco, A. Downregulation of HMGA-targeting microRNAs has a critical role in human pituitary tumorigenesis. Oncogene 2012, 31, 3857–3865. [Google Scholar] [CrossRef] [Green Version]
  39. D’Angelo, D.; Palmieri, D.; Mussnich, P.; Roche, M.; Wierinckx, A.; Raverot, G.; Fedele, M.; Croce, C.M.; Trouillas, J.; Fusco, A. Altered microRNA expression profile in human pituitary GH adenomas: Down-regulation of miRNA targeting HMGA1, HMGA2, and E2F1. J. Clin. Endocrinol. Metab. 2012, 97. [Google Scholar] [CrossRef] [PubMed]
  40. D’Angelo, D.; Esposito, F.; Fusco, A. Epigenetic mechanisms leading to overexpression of HMGA proteins in human pituitary adenomas. Front. Med. 2015, 2. [Google Scholar] [CrossRef] [Green Version]
  41. Leone, V.; Langella, C.; D’Angelo, D.; Mussnich, P.; Wierinckx, A.; Terracciano, L.; Raverotd, G.; Lachuere, J.; Rotondif, S.; Jaffrain-Rea, M.L.; et al. MiR-23b and miR-130b expression is downregulated in pituitary adenomas. Mol. Cell Endocrinol. 2014, 390, 1–7. [Google Scholar] [CrossRef] [PubMed]
  42. Roche, M.; Wierinckx, A.; Croze, S.; Rey, C.; Legras-Lachuer, C.; Morel, A.P.; Fusco, A.; Raverot, G.; Trouillas, J.; Lachuer, J. Deregulation of miR-183 and KIAA0101 in aggressive and malignant pituitary tumors. Front. Med. 2015, 2, 54. [Google Scholar] [CrossRef] [PubMed] [Green Version]
  43. Wei, Z.; Zhou, C.; Liu, M.; Yao, Y.; Sun, J.; Xiao, J.; Ma, W.; Zhu, H.; Wang, R. MicroRNA involvement in a metastatic non-functioning pituitary carcinoma. Pituitary 2015, 18, 710–721. [Google Scholar] [CrossRef] [PubMed]
  44. Tani, Y.; Inoshita, N.; Sugiyama, T.; Kato, M.; Yamada, S.; Shichiri, M.; Hirata, Y. Upregulation of CDKN2A and suppression of cyclin D1 gene expressions in ACTH-secreting pituitary adenomas. Eur. J. Endocrinol. 2010, 163, 523–529. [Google Scholar] [CrossRef] [PubMed] [Green Version]
  45. Zhang, Y.; Chen, L.; Yang, S.; Fang, D. E2F1: A potential negative regulator of hTERT transcription in normal cells upon activation of oncogenic c-Myc. Med. Sci. Monit. 2012, 18, RA12. [Google Scholar] [CrossRef] [PubMed] [Green Version]
  46. Zhang, Y.; Zhang, A.; Shen, C.; Zhang, B.; Rao, Z.; Wang, R.; Yang, S.; Ning, S.; Mao, G.; Fang, D. E2F1 acts as a negative feedback regulator of c-Myc-induced hTERT transcription during tumorigenesis. Oncol. Rep. 2014, 32, 1273–1280. [Google Scholar] [CrossRef]
  47. Matsumura, I.; Tanaka, H.; Kanakura, Y. E2F1 and c-Myc in cell growth and death. Cell Cycle 2003, 2, 333–338. [Google Scholar] [CrossRef] [Green Version]
  48. Leone, G.; DeGregori, J.; Sears, R.; Jakoi, L.; Nevins, J.R. Myc and Ras collaborate in inducing accumulation of active cyclin E/Cdk2 and E2F. Nature 1997, 387, 422–426. [Google Scholar] [CrossRef]
  49. Coller, H.A.; Forman, J.J.; Legesse-Miller, A. “Myc’ed messages”: Myc induces transcription of E2F1 while inhibiting its translation via a microRNA polycistron. PLoS Genet. 2007, 3, 1319–1324. [Google Scholar] [CrossRef] [Green Version]
  50. O’Donnell, K.A.; Wentzel, E.A.; Zeller, K.I.; Dang, C.V.; Mendell, J.T. c-Myc-regulated microRNAs modulate E2F1 expression. Nature 2005, 435, 839–843. [Google Scholar] [CrossRef]
  51. Sylvestre, Y.; De Guire, V.; Querido, E.; Mukhopadhyay, U.K.; Bourdeau, V.; Major, F.; Ferbeyre, G.; Chartrand, P. An E2F/miR-20a autoregulatory feedback loop. J. Biol. Chem. 2007, 282, 2135–2143. [Google Scholar] [CrossRef] [Green Version]
Figure 1. Association between E2F1 (A) and MYC (B) fold change expression and grades of invasiveness and proliferation (grade 3 vs. grade 2 and 1) in the whole series. Grade 3: proliferative and invasive tumours; grades 2 and 1: non-proliferative and non-invasive tumours. ns, non significant; FC, fold change.
Diagnostics 10 00227 g001
Figure 2. (A) Percentage of tumours with miR-17-5p overexpressed, normoexpressed, or repressed depending on grade of invasiveness and proliferation in the whole series; (B) Differences in miR-17-5p fold change expression between proliferative and invasive tumours (grade 3) and non-proliferative or non-invasive tumours (grades 2 and 1) in the whole series. * Mann–Whitney U, p = 0.041.
Diagnostics 10 00227 g002
Figure 3. Different expression of E2F1 depending on invasiveness. E2F1 fold change values between invasive (grade 3 and 2) and non-invasive (grade 1) tumours in the whole sample (A) and in the ST subtype (B). ** Mann–Whitney U, p = 0.004 and p = 0.001, respectively).
Diagnostics 10 00227 g003
Figure 4. Different expression of MYC depending on invasiveness. MYC fold change values between invasive (grade 3 and 2) and non-invasive (grade 1) tumours in the ST (A) and in the GT subtypes (B). * Mann–Whitney U, p = 0.018 and p = 0.033, respectively.
Diagnostics 10 00227 g004
Figure 5. Participation of mature miR-17-5p in the regulation of MYC and E2F1 networks in PitNETs.
Diagnostics 10 00227 g005
Table 1. TaqMan Expression Assays chosen (Life Technologies).
GeneTaqMan Gene Expression Assays
E2F1Hs00153451_m1
MYCHs00153408_m1
Ki-67Hs01032443_m1
Pri-miR~17-92Hs03295901_pri
Housekeeping genes
ACTBHs99999903_m1
GAPDHHs99999905_m1
YWHAZHs00237047_m1
microRNATaqMan miRNA Expression Assays
Hsa-miR-17-5p002308
Hsa-miR-20a000580
Small nucleoar RNA (for normalisation)
RNU43001095
U54001210
Table 2. Baseline characteristics of included patients with pituitary neuroendocrine tumours (PitNETs) (N = 60).
VariablesFrequency or Mean ± SD
Age (years)54 ± 15
Women33/60 (55%)
Maximum tumour diameter (mm)22.51 ± 10.92
PitNET subtypes
ST tumours 15/60 (25%)
fCT tumours 8/60 (13.33%)
sCT tumours 8/60 (13.33%)
GT tumours 29/60 (48.33%)
InvasivenessKnosp grade59/60 *
Non-invasive Grades I–II28/59 (47.5%)
Invasive Grades III–IV31/59 (52.5%)
ProliferationKi-6759/60 *
Non-proliferative<2.5942/59 (71.2%)
Proliferative≥2.5917/59 (28.8%)
Grades 59/60 *
Grade 1Non-invasive (regardless Ki-67 index)28/59 (47.5%)
Grade 2Invasive and non-proliferative (Ki-67 < 2.59)21/59 (35.6%)
Grade 3Invasive and proliferative (Ki-67 ≥ 2.59)10/59 (16.9%)
SD: standard deviation; ST: functioning somatotroph; fCT: functioning corticotroph; sCT: silent corticotroph; GT: gonadotroph * One case missed.
Table 3. Distribution of E2F1 and MYC expressions (fold change) according to PitNET subtype.
SubtypeE2F1MYC
Mean Fold Change (IQR)
All2.09 (1.16–3.78)0.32 (0.11–0.64)
GT3.03 (2.01–4.03) *0.17 (0.07–0.41)
fCT1.32 (1.17–1.90) *0.59 (0.44–1.02)
sCT3.45 (1.01–5.00)0.70 (0.25–1.88)
ST0.96 (0.69–1.41) *0.28 (0.13–0.54)
p value<0.0010.004
GT: gonadotroph; fCT: functioning corticotroph, IQR: interquartile range, sCT: silent corticotroph, ST: functioning somatotroph). p values: according to Kruskal–Wallis test for differences between PitNET subtypes. * Differences between GT and fCT (p = 0.002) and between GT and ST (p < 0.001). Differences between fCT and ST (p = 0.047), between fCT and GT (p = 0.002), between ST and sCT (p = 0.056), and between sCT and GT (p = 0.009).
Table 4. Distribution of Pri-miR-17~92 and mature microRNAs expression (fold change) according to PitNET subtype.
SubtypePri-miR-17~92miR-17-5pmiR-20a
Mean Fold Change (IQR)
All0.12 (0.08–0.27)1.15 (0.53–2.61)1.21 (0.51–2.54)
GT0.11 (0.07–0.25)1.62 (0.92–2.77)1.69 (0.80–2.82)
fCT0.13 (0.09–0.24)0.69 (0.53–1.27)1.02 (0.53–1.28)
sCT0.22 (0.13–0.31)1.59 (0.54–6.84)1.56 (0.55–8.44)
ST0.12 (0.09–0.42)0.92 (0.42–1.56)0.83 (0.46–1.93)
p value0.4210.2860.477
GT: gonadotroph; fCT: functioning corticotroph; IQR: interquartile range; sCT: silent corticotroph; ST: somatotroph. p values: according to Kruskal–Wallis test for differences between PitNET subtypes.

