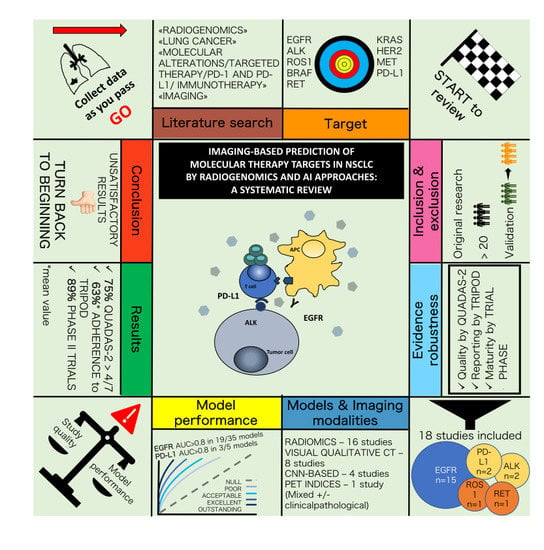
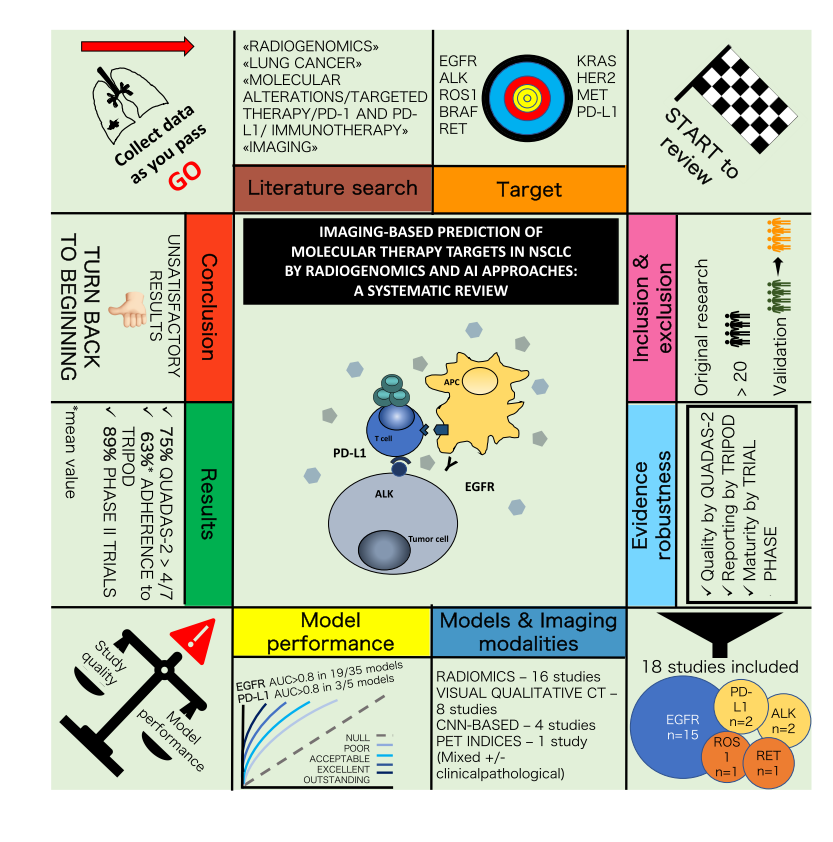
Imaging-Based Prediction of Molecular Therapy Targets in NSCLC by Radiogenomics and AI Approaches: A Systematic Review
 ,
,  , , and
Abstract
:
1. Introduction
2. Materials and Methods
2.1. Eligibility Criteria, Search Strategy and Study Selection
2.2. Analysis of Quality and Reporting Completeness
2.3. Data Extraction and Analysis
3. Results
3.1. Study Selection
3.2. Study Characteristics and Risk of Bias within Studies
3.3. Main Results
3.3.1. Prediction of EGFR Status
3.3.2. Prediction of EGFR Mutation Subtypes
3.3.3. Prediction of ALK Status and ALK/ROS1/RET Fusions
3.3.4. Prediction of PD-L1 Expression Levels
4. Discussion
5. Conclusions
Supplementary Materials
Author Contributions
Funding
Conflicts of Interest
References
- Bray, F.; Ferlay, J.; Soerjomataram, I.; Siegel, R.L.; Torre, L.A.; Jemal, A. Global cancer statistics 2018: GLOBOCAN estimates of incidence and mortality worldwide for 36 cancers in 185 countries. CA Cancer J. Clin. 2018, 68, 394–424. [Google Scholar] [CrossRef] [PubMed] [Green Version]
- Remon, J.; Ahn, M.-J.; Girard, N.; Johnson, M.; Kim, D.-W.; Lopes, G.; Pillai, R.N.; Solomon, B.; Villacampa, G.; Zhou, Q. Advanced-Stage Non–Small Cell Lung Cancer: Advances in Thoracic Oncology 2018. J. Thorac. Oncol. 2019, 14, 1134–1155. [Google Scholar] [CrossRef] [PubMed]
- Lindeman, N.I.; Cagle, P.T.; Aisner, D.L.; Arcila, M.E.; Beasley, M.B.; Bernicker, E.H.; Colasacco, C.; Dacic, S.; Hirsch, F.R.; Kerr, K.; et al. Updated Molecular Testing Guideline for the Selection of Lung Cancer Patients for Treatment With Targeted Tyrosine Kinase Inhibitors: Guideline From the College of American Pathologists, the International Association for the Study of Lung Cancer, and the Association for Molecular Pathology. Arch. Pathol. Lab. Med. 2018, 142, 321–346. [Google Scholar] [CrossRef] [PubMed] [Green Version]
- Kalemkerian, G.P.; Narula, N.; Kennedy, E.B.; Biermann, W.A.; Donington, J.; Leighl, N.B.; Lew, M.; Pantelas, J.; Ramalingam, S.S.; Reck, M.; et al. Molecular Testing Guideline for the Selection of Patients With Lung Cancer for Treatment With Targeted Tyrosine Kinase Inhibitors: American Society of Clinical Oncology Endorsement of the College of American Pathologists/International Association for the Study of Lung Cancer/Association for Molecular Pathology Clinical Practice Guideline Update. J. Clin. Oncol. 2018, 36, 911–919. [Google Scholar] [CrossRef]
- Planchard, D.; Popat, S.; Kerr, K.; Novello, S.; Smit, E.F.; Faivre-Finn, C.; Mok, T.S.; Reck, M.; Van Schil, P.E.; Hellmann, M.D.; et al. Metastatic non-small cell lung cancer: ESMO Clinical Practice Guidelines for diagnosis, treatment and follow-up. Ann. Oncol. 2018, 29, iv192–iv237. [Google Scholar] [CrossRef]
- Shepherd, F.A.; Rodrigues Pereira, J.; Ciuleanu, T.; Tan, E.H.; Hirsh, V.; Thongprasert, S.; Campos, D.; Maoleekoonpiroj, S.; Smylie, M.; Martins, R.; et al. Erlotinib in Previously Treated Non–Small-Cell Lung Cancer. N. Engl. J. Med. 2005, 353, 123–132. [Google Scholar] [CrossRef] [Green Version]
- Mok, T.S.; Wu, Y.-L.; Thongprasert, S.; Yang, C.-H.; Chu, D.-T.; Saijo, N.; Sunpaweravong, P.; Han, B.; Margono, B.; Ichinose, Y.; et al. Gefitinib or Carboplatin–Paclitaxel in Pulmonary Adenocarcinoma. N. Engl. J. Med. 2009, 361, 947–957. [Google Scholar] [CrossRef]
- Wu, Y.-L.; Cheng, Y.; Zhou, X.; Lee, K.H.; Nakagawa, K.; Niho, S.; Tsuji, F.; Linke, R.; Rosell, R.; Corral, J.; et al. Dacomitinib versus gefitinib as first-line treatment for patients with EGFR-mutation-positive non-small-cell lung cancer (ARCHER 1050): A randomised, open-label, phase 3 trial. Lancet Oncol. 2017, 18, 1454–1466. [Google Scholar] [CrossRef]
- Soria, J.-C.; Tan, D.S.W.; Chiari, R.; Wu, Y.-L.; Paz-Ares, L.; Wolf, J.; Geater, S.L.; Orlov, S.; Cortinovis, D.; Yu, C.-J.; et al. First-line ceritinib versus platinum-based chemotherapy in advanced ALK -rearranged non-small-cell lung cancer (ASCEND-4): A randomised, open-label, phase 3 study. Lancet 2017, 389, 917–929. [Google Scholar] [CrossRef]
- Hida, T.; Nokihara, H.; Kondo, M.; Kim, Y.H.; Azuma, K.; Seto, T.; Takiguchi, Y.; Nishio, M.; Yoshioka, H.; Imamura, F.; et al. Alectinib versus crizotinib in patients with ALK -positive non-small-cell lung cancer (J-ALEX): An open-label, randomised phase 3 trial. Lancet 2017, 390, 29–39. [Google Scholar] [CrossRef]
- Shaw, A.T.; Solomon, B.J.; Besse, B.; Bauer, T.M.; Lin, C.-C.; Soo, R.A.; Riely, G.J.; Ou, S.-H.I.; Clancy, J.S.; Li, S.; et al. ALK Resistance Mutations and Efficacy of Lorlatinib in Advanced Anaplastic Lymphoma Kinase-Positive Non–Small-Cell Lung Cancer. J. Clin. Oncol. 2019, 37, 1370–1379. [Google Scholar] [CrossRef] [PubMed]
- Gautschi, O.; Milia, J.; Cabarrou, B.; Bluthgen, M.-V.; Besse, B.; Smit, E.F.; Wolf, J.; Peters, S.; Früh, M.; Koeberle, D.; et al. Targeted Therapy for Patients with BRAF-Mutant Lung Cancer Results from the European EURAF Cohort. J. Thorac. Oncol. 2015, 10, 1451–1457. [Google Scholar] [CrossRef] [PubMed] [Green Version]
- Camidge, D.R.; Kim, H.R.; Ahn, M.-J.; Yang, J.C.-H.; Han, J.-Y.; Lee, J.-S.; Hochmair, M.J.; Li, J.Y.-C.; Chang, G.-C.; Lee, K.H.; et al. Brigatinib versus Crizotinib in ALK -Positive Non–Small-Cell Lung Cancer. N. Engl. J. Med. 2018, 379, 2027–2039. [Google Scholar] [CrossRef] [PubMed]
- Han, J.-Y.; Park, K.; Kim, S.-W.; Lee, D.H.; Kim, H.Y.; Kim, H.T.; Ahn, M.J.; Yun, T.; Ahn, J.S.; Suh, C.; et al. First-SIGNAL: First-Line Single-Agent Iressa Versus Gemcitabine and Cisplatin Trial in Never-Smokers With Adenocarcinoma of the Lung. J. Clin. Oncol. 2012, 30, 1122–1128. [Google Scholar] [CrossRef] [PubMed]
- Maemondo, M.; Inoue, A.; Kobayashi, K.; Sugawara, S.; Oizumi, S.; Isobe, H.; Gemma, A.; Harada, M.; Yoshizawa, H.; Kinoshita, I.; et al. Gefitinib or Chemotherapy for Non–Small-Cell Lung Cancer with Mutated EGFR. N. Engl. J. Med. 2010, 362, 2380–2388. [Google Scholar] [CrossRef] [PubMed] [Green Version]
- Solomon, B.J.; Mok, T.; Kim, D.-W.; Wu, Y.-L.; Nakagawa, K.; Mekhail, T.; Felip, E.; Cappuzzo, F.; Paolini, J.; Usari, T.; et al. First-Line Crizotinib versus Chemotherapy in ALK -Positive Lung Cancer. N. Engl. J. Med. 2014, 371, 2167–2177. [Google Scholar] [CrossRef] [Green Version]
- Shaw, A.T.; Ou, S.-H.I.; Bang, Y.-J.; Camidge, D.R.; Solomon, B.J.; Salgia, R.; Riely, G.J.; Varella-Garcia, M.; Shapiro, G.I.; Costa, D.B.; et al. Crizotinib in ROS1 -Rearranged Non–Small-Cell Lung Cancer. N. Engl. J. Med. 2014, 371, 1963–1971. [Google Scholar] [CrossRef] [Green Version]
- Mazières, J.; Zalcman, G.; Crinò, L.; Biondani, P.; Barlesi, F.; Filleron, T.; Dingemans, A.-M.C.; Léna, H.; Monnet, I.; Rothschild, S.I.; et al. Crizotinib Therapy for Advanced Lung Adenocarcinoma and a ROS1 Rearrangement: Results From the EUROS1 Cohort. J. Clin. Oncol. 2015, 33, 992–999. [Google Scholar]
- Drilon, A.; Siena, S.; Dziadziuszko, R.; Barlesi, F.; Krebs, M.G.; Shaw, A.T.; de Braud, F.; Rolfo, C.; Ahn, M.-J.; Wolf, J.; et al. Entrectinib in ROS1 fusion-positive non-small-cell lung cancer: Integrated analysis of three phase 1–2 trials. Lancet Oncol. 2020, 21, 261–270. [Google Scholar] [CrossRef]
- Sequist, L.V.; Yang, J.C.-H.; Yamamoto, N.; O’Byrne, K.; Hirsh, V.; Mok, T.; Geater, S.L.; Orlov, S.; Tsai, C.-M.; Boyer, M.; et al. Phase III Study of Afatinib or Cisplatin Plus Pemetrexed in Patients With Metastatic Lung Adenocarcinoma With EGFR Mutations. J. Clin. Oncol. 2013, 31, 3327–3334. [Google Scholar] [CrossRef] [Green Version]
- Soria, J.-C.; Ohe, Y.; Vansteenkiste, J.; Reungwetwattana, T.; Chewaskulyong, B.; Lee, K.H.; Dechaphunkul, A.; Imamura, F.; Nogami, N.; Kurata, T.; et al. Osimertinib in Untreated EGFR -Mutated Advanced Non–Small-Cell Lung Cancer. N. Engl. J. Med. 2018, 378, 113–125. [Google Scholar] [CrossRef]
- Carbone, D.P.; Reck, M.; Paz-Ares, L.; Creelan, B.; Horn, L.; Steins, M.; Felip, E.; van den Heuvel, M.M.; Ciuleanu, T.-E.; Badin, F.; et al. First-Line Nivolumab in Stage IV or Recurrent Non–Small-Cell Lung Cancer. N. Engl. J. Med. 2017, 376, 2415–2426. [Google Scholar] [CrossRef] [PubMed]
- Mok, T.S.K.; Wu, Y.; Kudaba, I.; Kowalski, D.M.; Cho, B.C.; Turna, H.Z.; Castro, G.; Srimuninnimit, V.; Laktionov, K.K.; Bondarenko, I.; et al. Pembrolizumab versus chemotherapy for previously untreated, PD-L1-expressing, locally advanced or metastatic non-small-cell lung cancer (KEYNOTE-042): A randomised, open-label, controlled, phase 3 trial. Lancet 2019, 393, 1819–1830. [Google Scholar] [CrossRef]
- Socinski, M.A.; Jotte, R.M.; Cappuzzo, F.; Orlandi, F.; Stroyakovskiy, D.; Nogami, N.; Rodríguez-Abreu, D.; Moro-Sibilot, D.; Thomas, C.A.; Barlesi, F.; et al. Atezolizumab for First-Line Treatment of Metastatic Nonsquamous NSCLC. N. Engl. J. Med. 2018, 378, 2288–2301. [Google Scholar] [CrossRef] [PubMed]
- Garon, E.B.; Rizvi, N.A.; Hui, R.; Leighl, N.; Balmanoukian, A.S.; Eder, J.P.; Patnaik, A.; Aggarwal, C.; Gubens, M.; Horn, L.; et al. Pembrolizumab for the Treatment of Non–Small-Cell Lung Cancer. N. Engl. J. Med. 2015, 372, 2018–2028. [Google Scholar] [CrossRef]
- Murakami, S. Durvalumab for the treatment of non-small cell lung cancer. Expert Rev. Anticancer Ther. 2019, 19, 1009–1016. [Google Scholar] [CrossRef]
- Rizvi, N.A.; Mazières, J.; Planchard, D.; Stinchcombe, T.E.; Dy, G.K.; Antonia, S.J.; Horn, L.; Lena, H.; Minenza, E.; Mennecier, B.; et al. Activity and safety of nivolumab, an anti-PD-1 immune checkpoint inhibitor, for patients with advanced, refractory squamous non-small-cell lung cancer (CheckMate 063): A phase 2, single-arm trial. Lancet Oncol. 2015, 16, 257–265. [Google Scholar] [CrossRef] [Green Version]
- Zhang, Y.L.; Yuan, J.Q.; Wang, K.F.; Fu, X.H.; Han, X.R.; Threapleton, D.; Yang, Z.Y.; Mao, C.; Tang, J.L. The prevalence of EGFR mutation in patients with non-small cell lung cancer: A systematic review and meta-analysis. Oncotarget 2016, 7, 78985–78993. [Google Scholar] [CrossRef] [Green Version]
- Sweeney, S.M.; Cerami, E.; Baras, A.; Pugh, T.J.; Schultz, N.; Stricker, T.; Lindsay, J.; Del Vecchio Fitz, C.; Kumari, P.; Micheel, C.; et al. AACR Project GENIE: Powering Precision Medicine through an International Consortium. Cancer Discov. 2017, 7, 818–831. [Google Scholar]
- Skov, B.G.; Rørvig, S.B.; Jensen, T.H.L.; Skov, T. The prevalence of programmed death ligand-1 (PD-L1) expression in non-small cell lung cancer in an unselected, consecutive population. Mod. Pathol. 2020, 33, 109–117. [Google Scholar] [CrossRef]
- Sholl, L.M.; Aisner, D.L.; Varella-Garcia, M.; Berry, L.D.; Dias-Santagata, D.; Wistuba, I.I.; Chen, H.; Fujimoto, J.; Kugler, K.; Franklin, W.A.; et al. Multi-institutional oncogenic driver mutation analysis in lung adenocarcinoma: The lung cancer mutation consortium experience. J. Thorac. Oncol. 2015, 10, 768–777. [Google Scholar] [CrossRef] [Green Version]
- Barlesi, F.; Mazieres, J.; Merlio, J.-P.; Debieuvre, D.; Mosser, J.; Lena, H.; Ouafik, L.; Besse, B.; Rouquette, I.; Westeel, V.; et al. Routine molecular profiling of patients with advanced non-small-cell lung cancer: Results of a 1-year nationwide programme of the French Cooperative Thoracic Intergroup (IFCT). Lancet 2016, 387, 1415–1426. [Google Scholar] [CrossRef]
- Midha, A.; Dearden, S.; McCormack, R. EGFR mutation incidence in non-Small-cell lung cancer of adenocarcinoma histology: A systematic review and global map by ethnicity (mutMapII). Am. J. Cancer Res. 2015, 5, 2892–2911. [Google Scholar]
- Vansteenkiste, J.; Crino, L.; Dooms, C.; Douillard, J.Y.; Faivre-Finn, C.; Lim, E.; Rocco, G.; Senan, S.; Van Schil, P.; Veronesi, G.; et al. 2nd ESMO Consensus Conference on Lung Cancer: Early-stage non-small-cell lung cancer consensus on diagnosis, treatment and follow-up. Ann. Oncol. 2014, 25, 1462–1474. [Google Scholar] [CrossRef]
- Litjens, G.; Kooi, T.; Bejnordi, B.E.; Setio, A.A.A.; Ciompi, F.; Ghafoorian, M.; van der Laak, J.A.W.M.; van Ginneken, B.; Sánchez, C.I. A survey on deep learning in medical image analysis. Med. Image Anal. 2017, 42, 60–88. [Google Scholar] [CrossRef] [Green Version]
- Gillies, R.J.; Kinahan, P.E.; Hricak, H. Radiomics: Images Are More than Pictures, They Are Data. Radiology 2016, 278, 563–577. [Google Scholar] [CrossRef] [PubMed] [Green Version]
- deSouza, N.M.; Achten, E.; Alberich-Bayarri, A.; Bamberg, F.; Boellaard, R.; Clément, O.; Fournier, L.; Gallagher, F.; Golay, X.; Heussel, C.P.; et al. Validated imaging biomarkers as decision-making tools in clinical trials and routine practice: Current status and recommendations from the EIBALL* subcommittee of the European Society of Radiology (ESR). Insights Imaging 2019, 10, 87. [Google Scholar] [CrossRef] [PubMed] [Green Version]
- Rutman, A.M.; Kuo, M.D. Radiogenomics: Creating a link between molecular diagnostics and diagnostic imaging. Eur. J. Radiol. 2009, 70, 232–241. [Google Scholar] [CrossRef] [PubMed]
- Bodalal, Z.; Trebeschi, S.; Nguyen-Kim, T.D.L.; Schats, W.; Beets-Tan, R. Radiogenomics: Bridging imaging and genomics. Abdom. Radiol. 2019, 44, 1960–1984. [Google Scholar] [CrossRef] [PubMed] [Green Version]
- Chartrand, G.; Cheng, P.M.; Vorontsov, E.; Drozdzal, M.; Turcotte, S.; Pal, C.J.; Kadoury, S.; Tang, A. Deep Learning: A Primer for Radiologists. RadioGraphics 2017, 37, 2113–2131. [Google Scholar] [CrossRef] [PubMed] [Green Version]
- Neri, E.; Del Re, M.; Paiar, F.; Erba, P.; Cocuzza, P.; Regge, D.; Danesi, R. Radiomics and liquid biopsy in oncology: The holons of systems medicine. Insights Imaging 2018, 9, 915–924. [Google Scholar] [CrossRef] [PubMed] [Green Version]
- Sollini, M.; Bandera, F.; Kirienko, M. Quantitative imaging biomarkers in nuclear medicine: From SUV to image mining studies. Highlights from annals of nuclear medicine 2018. Eur. J. Nucl. Med. Mol. Imaging 2019, 46, 2737–2745. [Google Scholar] [CrossRef] [PubMed]
- Park, H.; Sholl, L.M.; Hatabu, H.; Awad, M.M.; Nishino, M. Imaging of precision therapy for lung cancer: Current state of the art. Radiology 2019, 293, 15–29. [Google Scholar] [CrossRef] [PubMed]
- Sollini, M.; Cozzi, L.; Ninatti, G.; Antunovic, L.; Cavinato, L.; Chiti, A.; Kirienko, M. PET/CT radiomics in breast cancer: Mind the step. Methods 2020, S1046-2023, 30263–30264. [Google Scholar] [CrossRef] [PubMed]
- Sollini, M.; Cozzi, L.; Antunovic, L.; Chiti, A.; Kirienko, M. PET Radiomics in NSCLC: State of the art and a proposal for harmonization of methodology. Sci. Rep. 2017, 7, 358. [Google Scholar] [CrossRef] [PubMed] [Green Version]
- Home-ClinicalTrials.gov. Available online: https://clinicaltrials.gov/ct2/home (accessed on 12 February 2020).
- Whiting, P.; Rutjes, A.; Westwood, M.; Mallett, S.; Deeks, J.; Reitsma, J.; Leeflang, M.; Sterne, J.; Bossuyt, P.; Rutjes, A. QUADAS-2: A revised tool for the quality assessment of diagnostic accuracy studies. Ann. Intern. Med. 2011, 155, 529–536. [Google Scholar] [CrossRef]
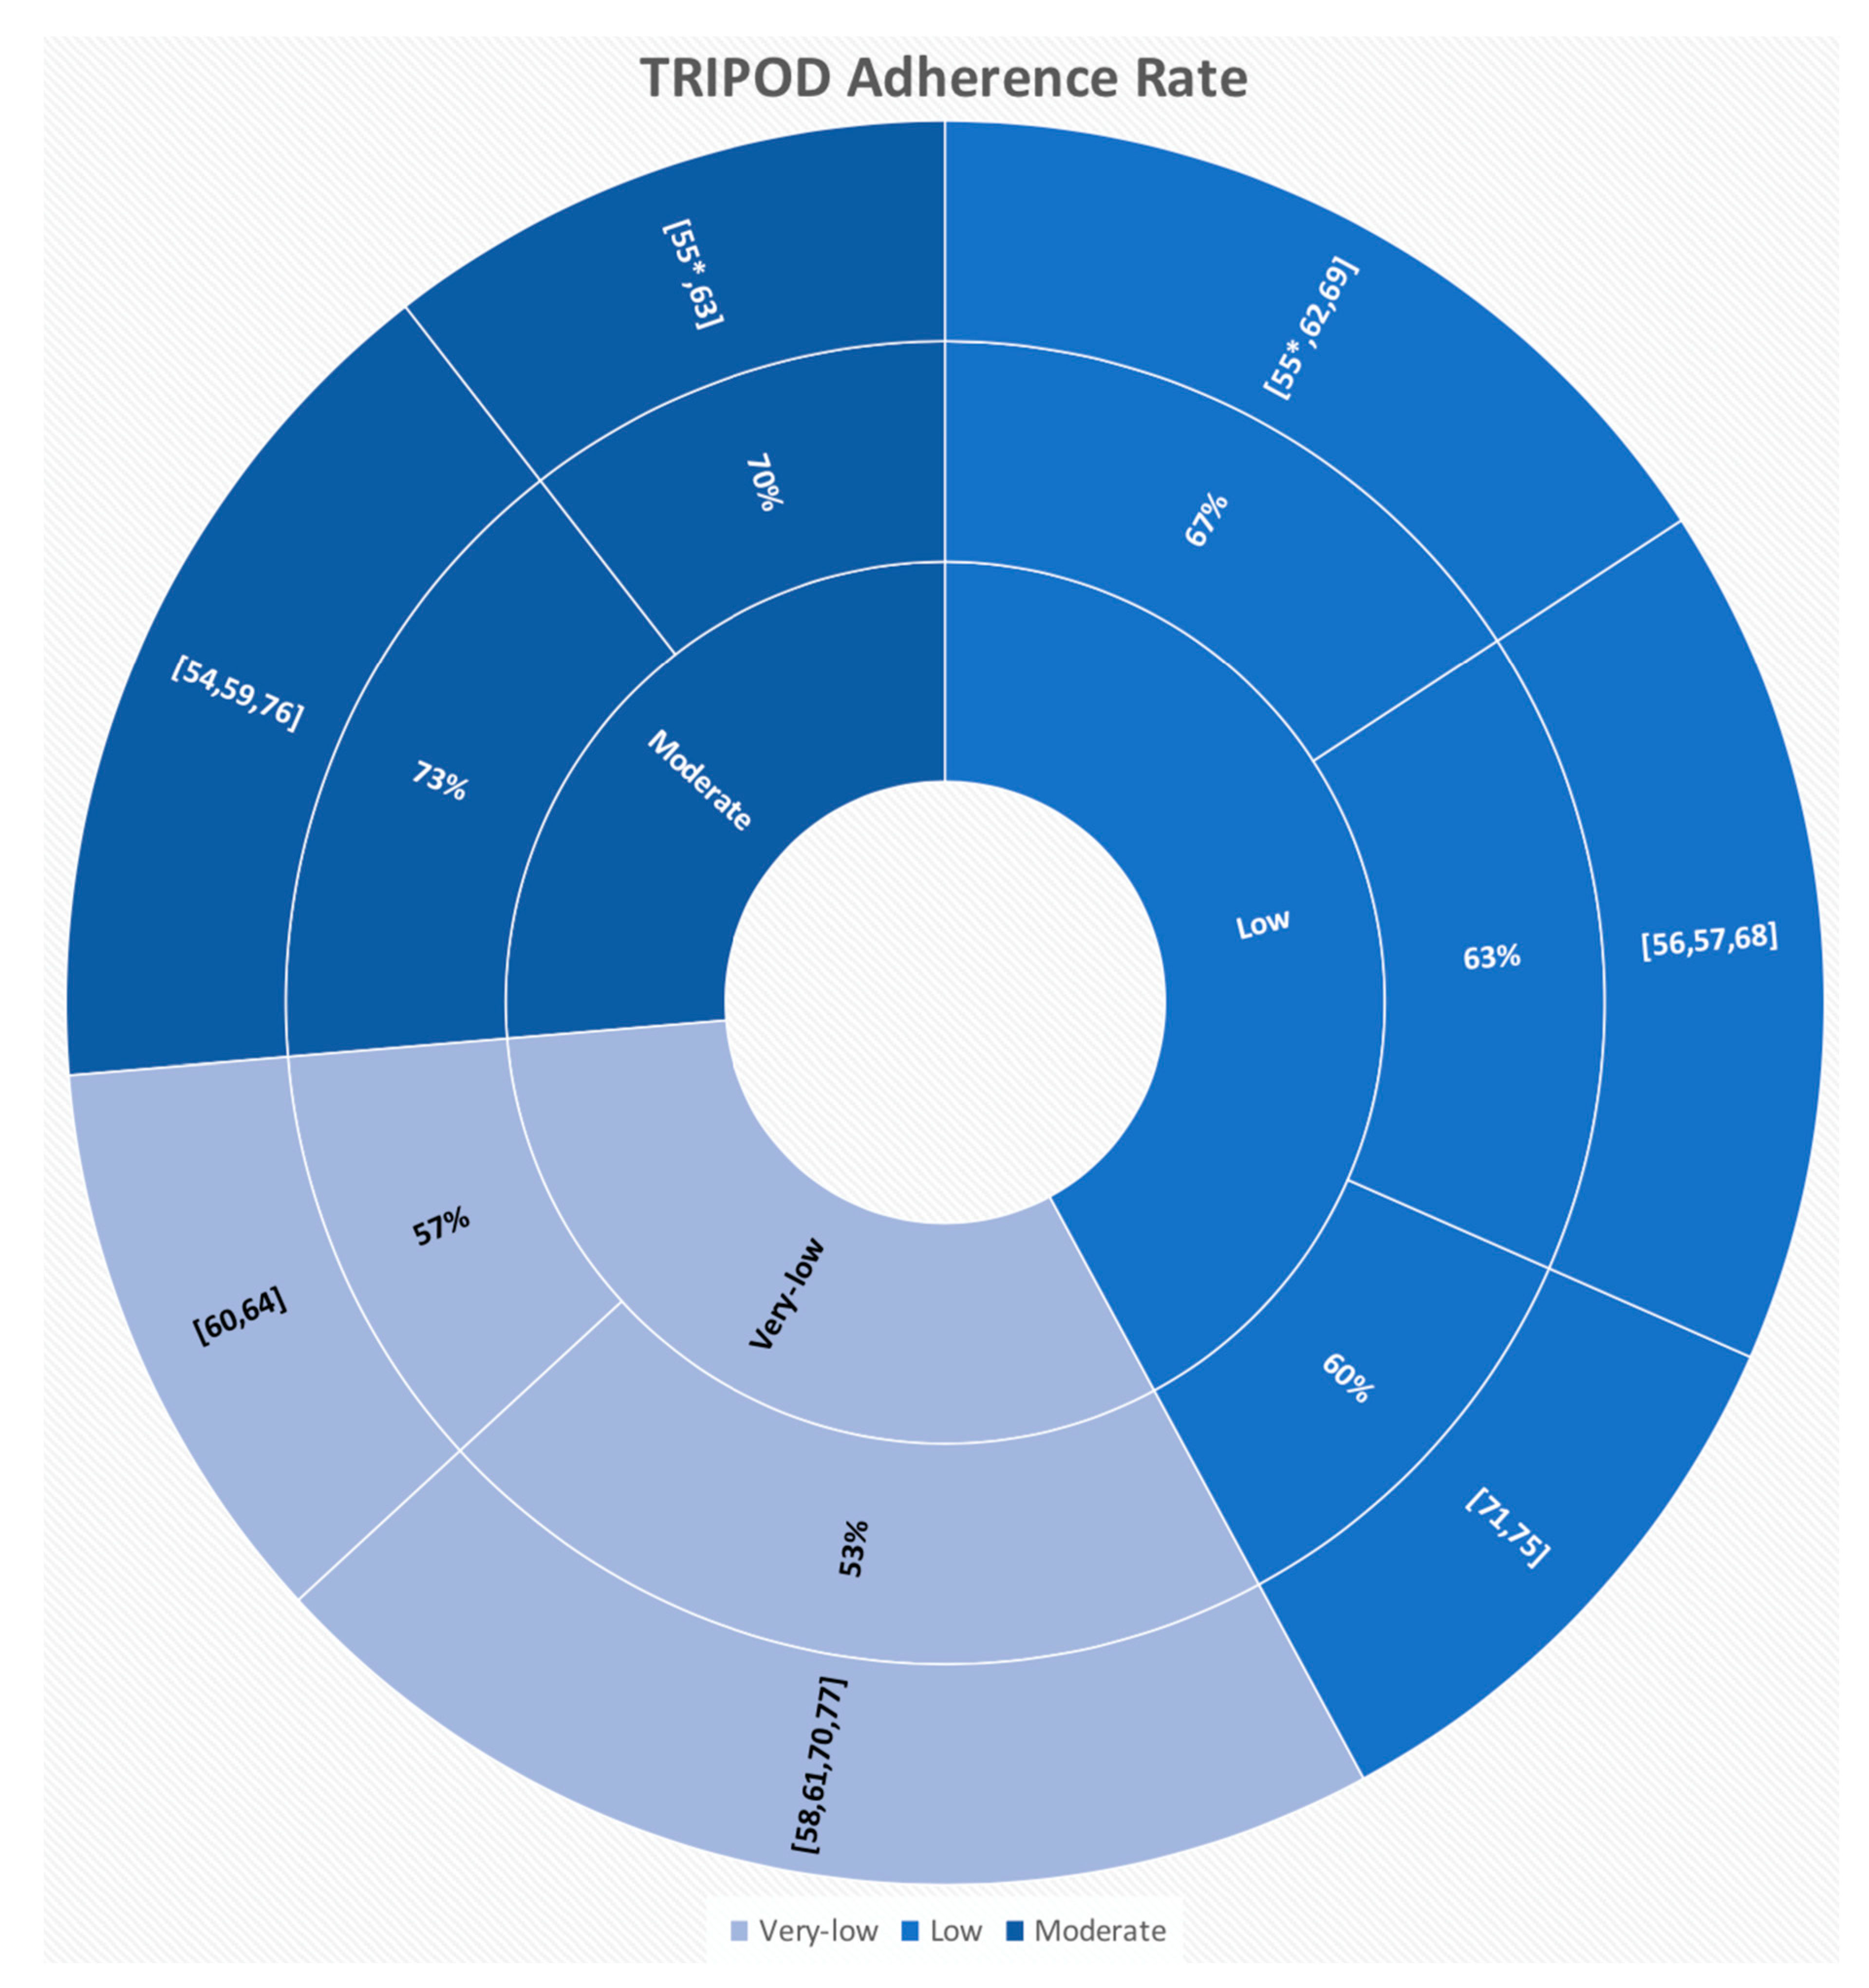
- Collins, G.S.; Reitsma, J.B.; Altman, D.G.; Moons, K.G.M. Transparent reporting of a multivariable prediction model for individual prognosis or diagnosis (TRIPOD): The TRIPOD statement. Ann. Intern. Med. 2015, 162, 55–63. [Google Scholar] [CrossRef] [Green Version]
- Park, J.E.; Kim, D.; Kim, H.S.; Park, S.Y.; Kim, J.Y.; Cho, S.J.; Shin, J.H.; Kim, J.H. Quality of science and reporting of radiomics in oncologic studies: Room for improvement according to radiomics quality score and TRIPOD statement. Eur. Radiol. 2020, 30, 523–536. [Google Scholar] [CrossRef]
- Mandrekar, J.N. Receiver Operating Characteristic Curve in Diagnostic Test Assessment. J. Thorac. Oncol. 2010, 5, 1315–1316. [Google Scholar] [CrossRef] [Green Version]
- Fawcett, T. An introduction to ROC analysis. Pattern Recognit. Lett. 2006, 27, 861–874. [Google Scholar] [CrossRef]
- Sollini, M.; Antunovic, L.; Chiti, A.; Kirienko, M. Towards clinical application of image mining: A systematic review on artificial intelligence and radiomics. Eur. J. Nucl. Med. Mol. Imaging 2019, 46, 2656–2672. [Google Scholar] [CrossRef] [PubMed] [Green Version]
- Sollini, M.; Gelardi, F.; Matassa, G.; Delgado Bolton, R.C.; Chiti, A.; Kirienko, M. Interdisciplinarity: An essential requirement for translation of radiomics research into clinical practice–a systematic review focused on thoracic oncology. Rev. Española Med. Nucl. e Imagen Mol. (English Ed.) 2020, 39, 146–156. [Google Scholar] [CrossRef]
- Zhao, W.; Wu, Y.; Xu, Y.; Sun, Y.; Gao, P.; Tan, M.; Ma, W.; Li, C.; Jin, L.; Hua, Y.; et al. The Potential of Radiomics Nomogram in Non-invasively Prediction of Epidermal Growth Factor Receptor Mutation Status and Subtypes in Lung Adenocarcinoma. Front. Oncol. 2020, 9, 1485. [Google Scholar] [CrossRef] [PubMed]
- Lu, X.; Li, M.; Zhang, H.-M.; Hua, S.; Meng, F.; Yang, H.; Li, X.; Cao, D. A novel radiomic nomogram for predicting epidermal growth factor receptor mutation in peripheral lung adenocarcinoma. Phys. Med. Biol. 2020, 65, 055012. [Google Scholar] [CrossRef]
- Yang, X.; Dong, X.; Wang, J.; Li, W.; Gu, Z.; Gao, D.; Zhong, N.; Guan, Y. Computed Tomography-Based Radiomics Signature: A Potential Indicator of Epidermal Growth Factor Receptor Mutation in Pulmonary Adenocarcinoma Appearing as a Subsolid Nodule. Oncologist 2019, 24, 1156–1164. [Google Scholar] [CrossRef] [Green Version]
- Jia, T.Y.; Xiong, J.F.; Li, X.Y.; Yu, W.; Xu, Z.Y.; Cai, X.W.; Ma, J.C.; Ren, Y.C.; Larsson, R.; Zhang, J.; et al. Identifying EGFR mutations in lung adenocarcinoma by noninvasive imaging using radiomics features and random forest modeling. Eur. Radiol. 2019, 29, 4742–4750. [Google Scholar] [CrossRef]
- Li, X.Y.; Xiong, J.F.; Jia, T.Y.; Shen, T.L.; Hou, R.P.; Zhao, J.; Fu, X.L. Detection of epithelial growth factor receptor (EGFR) mutations on CT images of patients with lung adenocarcinoma using radiomics and/or multi-level residual convolutionary neural networks. J. Thorac. Dis. 2018, 10, 6624–6635. [Google Scholar] [CrossRef]
- Wang, S.; Shi, J.; Ye, Z.; Dong, D.; Yu, D.; Zhou, M.; Liu, Y.; Gevaert, O.; Wang, K.; Zhu, Y.; et al. Predicting EGFR mutation status in lung adenocarcinoma on computed tomography image using deep learning. Eur. Respir. J. 2019, 53, 1800986. [Google Scholar] [CrossRef]
- Li, Y.; Lu, L.; Xiao, M.; Dercle, L.; Huang, Y.; Zhang, Z.; Schwartz, L.H.; Li, D.; Zhao, B. CT Slice Thickness and Convolution Kernel Affect Performance of a Radiomic Model for Predicting EGFR Status in Non-Small Cell Lung Cancer: A Preliminary Study. Sci. Rep. 2018, 8, 1–10. [Google Scholar] [CrossRef]
- Xiong, J.-F.; Jia, T.-Y.; Li, X.-Y.; Yu, W.; Xu, Z.-Y.; Cai, X.-W.; Fu, L.; Zhang, J.; Qin, B.-J.; Fu, X.-L.; et al. Identifying epidermal growth factor receptor mutation status in patients with lung adenocarcinoma by three-dimensional convolutional neural networks. Br. J. Radiol. 2018, 91, 20180334. [Google Scholar] [CrossRef]
- Zhang, L.; Chen, B.; Liu, X.; Song, J.; Fang, M.; Hu, C.; Dong, D.; Li, W.; Tian, J. Quantitative Biomarkers for Prediction of Epidermal Growth Factor Receptor Mutation in Non-Small Cell Lung Cancer. Transl. Oncol. 2018, 11, 94–101. [Google Scholar] [CrossRef] [PubMed]
- Zhang, J.; Zhao, X.; Zhao, Y.; Zhang, J.; Zhang, Z.; Wang, J.; Wang, Y.; Dai, M.; Han, J. Value of pre-therapy 18F-FDG PET/CT radiomics in predicting EGFR mutation status in patients with non-small cell lung cancer. Eur. J. Nucl. Med. Mol. Imaging 2020, 47, 1137–1146. [Google Scholar] [CrossRef] [PubMed]
- Li, X.; Yin, G.; Zhang, Y.; Dai, D.; Liu, J.; Chen, P.; Zhu, L.; Ma, W.; Xu, W. Predictive Power of a Radiomic Signature Based on 18F-FDG PET/CT Images for EGFR Mutational Status in NSCLC. Front. Oncol. 2019, 9, 1–11. [Google Scholar] [CrossRef] [PubMed] [Green Version]
- Koyasu, S.; Nishio, M.; Isoda, H.; Nakamoto, Y.; Togashi, K. Usefulness of gradient tree boosting for predicting histological subtype and EGFR mutation status of non-small cell lung cancer on 18F FDG-PET/CT. Ann. Nucl. Med. 2020, 34, 49–57. [Google Scholar] [CrossRef]
- Wang, X.; Kong, C.; Xu, W.; Yang, S.; Shi, D.; Zhang, J.; Du, M.; Wang, S.; Bai, Y.; Zhang, T.; et al. Decoding tumor mutation burden and driver mutations in early stage lung adenocarcinoma using CT-based radiomics signature. Thorac. Cancer 2019, 10, 1904–1912. [Google Scholar] [CrossRef] [Green Version]
- Li, S.; Ding, C.; Zhang, H.; Song, J.; Wu, L. Radiomics for the prediction of EGFR mutation subtypes in non-small cell lung cancer. Med. Phys. 2019, 46, 4545–4552. [Google Scholar] [CrossRef]
- Jiang, M.; Zhang, Y.; Xu, J.; Ji, M.; Guo, Y.; Guo, Y.; Xiao, J.; Yao, X.; Shi, H.; Zeng, M. Assessing EGFR gene mutation status in non-small cell lung cancer with imaging features from PET/CT. Nucl. Med. Commun. 2019, 40, 842–849. [Google Scholar] [CrossRef]
- Tu, W.; Sun, G.; Fan, L.; Wang, Y.; Xia, Y.; Guan, Y.; Li, Q.; Zhang, D.; Liu, S.; Li, Z. Radiomics signature: A potential and incremental predictor for EGFR mutation status in NSCLC patients, comparison with CT morphology. Lung Cancer 2019, 132, 28–35. [Google Scholar] [CrossRef]
- Zhao, W.; Yang, J.; Ni, B.; Bi, D.; Sun, Y.; Xu, M.; Zhu, X.; Li, C.; Jin, L.; Gao, P.; et al. Toward automatic prediction of EGFR mutation status in pulmonary adenocarcinoma with 3D deep learning. Cancer Med. 2019, 8, 3532–3543. [Google Scholar] [CrossRef] [Green Version]
- Yamamoto, S.; Korn, R.L.; Oklu, R.; Migdal, C.; Gotway, M.B.; Weiss, G.J.; Iafrate, A.J.; Kim, D.W.; Kuo, M.D. ALK molecular phenotype in non-small cell lung cancer: CT radiogenomic characterization. Radiology 2014, 272, 568–576. [Google Scholar] [CrossRef] [PubMed]
- Rizzo, S.; Raimondi, S.; de Jong, E.E.C.; van Elmpt, W.; De Piano, F.; Petrella, F.; Bagnardi, V.; Jochems, A.; Bellomi, M.; Dingemans, A.M.; et al. Genomics of non-small cell lung cancer (NSCLC): Association between CT-based imaging features and EGFR and K-RAS mutations in 122 patients—An external validation. Eur. J. Radiol. 2019, 110, 148–155. [Google Scholar] [CrossRef] [PubMed]
- Rios Velazquez, E.; Parmar, C.; Liu, Y.; Coroller, T.P.; Cruz, G.; Stringfield, O.; Ye, Z.; Makrigiorgos, M.; Fennessy, F.; Mak, R.H.; et al. Somatic Mutations Drive Distinct Imaging Phenotypes in Lung Cancer. Cancer Res. 2017, 77, 3922–3930. [Google Scholar] [CrossRef] [PubMed] [Green Version]
- Gevaert, O.; Echegaray, S.; Khuong, A.; Hoang, C.D.; Shrager, J.B.; Jensen, K.C.; Berry, G.J.; Guo, H.H.; Lau, C.; Plevritis, S.K.; et al. Predictive radiogenomics modeling of EGFR mutation status in lung cancer. Sci. Rep. 2017, 7, 1–8. [Google Scholar] [CrossRef] [PubMed]
- Yoon, H.J.; Sohn, I.; Cho, J.H.; Lee, H.Y.; Kim, J.H.; Choi, Y.L.; Kim, H.; Lee, G.; Lee, K.S.; Kim, J. Decoding tumor phenotypes for ALK, ROS1, and RET fusions in lung adenocarcinoma using a radiomics approach. Medicine 2015, 94, e1753. [Google Scholar] [CrossRef]
- Yoon, J.; Suh, Y.J.; Han, K.; Cho, H.; Lee, H.; Hur, J.; Choi, B.W. Utility of CT radiomics for prediction of PD-L1 expression in advanced lung adenocarcinomas. Thorac. Cancer 2020, 11, 993–1004. [Google Scholar] [CrossRef] [Green Version]
- Jiang, M.; Sun, D.; Guo, Y.; Guo, Y.; Xiao, J.; Wang, L.; Yao, X. Assessing PD-L1 Expression Level by Radiomic Features From PET/CT in Nonsmall Cell Lung Cancer Patients: An Initial Result. Acad. Radiol. 2020, 27, 171–179. [Google Scholar] [CrossRef]
- Jansen, R.W.; van Amstel, P.; Martens, R.M.; Kooi, I.E.; Wesseling, P.; de Langen, A.J.; Menke-Van der Houven van Oordt, C.W.; Jansen, B.H.E.; Moll, A.C.; Dorsman, J.C.; et al. Non-invasive tumor genotyping using radiogenomic biomarkers, a systematic review and oncology-wide pathway analysis. Oncotarget 2018, 9, 20134–20155. [Google Scholar] [CrossRef]
- Mendoza, D.P.; Stowell, J.; Muzikansky, A.; Shepard, J.-A.O.; Shaw, A.T.; Digumarthy, S.R. Computed Tomography Imaging Characteristics of Non–Small-Cell Lung Cancer With Anaplastic Lymphoma Kinase Rearrangements: A Systematic Review and Meta-Analysis. Clin. Lung Cancer 2019, 20, 339–349. [Google Scholar] [CrossRef]
- Sanduleanu, S.; Woodruff, H.C.; de Jong, E.E.C.; van Timmeren, J.E.; Jochems, A.; Dubois, L.; Lambin, P. Tracking tumor biology with radiomics: A systematic review utilizing a radiomics quality score. Radiother. Oncol. 2018, 127, 349–360. [Google Scholar] [CrossRef]
- Shi, Y.; Au, J.S.-K.; Thongprasert, S.; Srinivasan, S.; Tsai, C.-M.; Khoa, M.T.; Heeroma, K.; Itoh, Y.; Cornelio, G.; Yang, P.-C. A Prospective, Molecular Epidemiology Study of EGFR Mutations in Asian Patients with Advanced Non–Small-Cell Lung Cancer of Adenocarcinoma Histology (PIONEER). J. Thorac. Oncol. 2014, 9, 154–162. [Google Scholar] [CrossRef] [Green Version]
- Dearden, S.; Stevens, J.; Wu, Y.-L.; Blowers, D. Mutation incidence and coincidence in non small-cell lung cancer: Meta-analyses by ethnicity and histology (mutMap). Ann. Oncol. 2013, 24, 2371–2376. [Google Scholar] [CrossRef] [PubMed]
- Park, S.H.; Han, K. Methodologic Guide for Evaluating Clinical Performance and Effect of Artificial Intelligence Technology for Medical Diagnosis and Prediction. Radiology 2018, 286, 800–809. [Google Scholar] [CrossRef]
- Dogan, S.; Shen, R.; Ang, D.C.; Johnson, M.L.; D’Angelo, S.P.; Paik, P.K.; Brzostowski, E.B.; Riely, G.J.; Kris, M.G.; Zakowski, M.F.; et al. Molecular Epidemiology of EGFR and KRAS Mutations in 3026 Lung Adenocarcinomas: Higher Susceptibility of Women to Smoking-Related KRAS-Mutant Cancers. Clin. Cancer Res. 2012, 18, 6169–6177. [Google Scholar] [CrossRef] [PubMed] [Green Version]
- Teixidó, C.; Vilariño, N.; Reyes, R.; Reguart, N. PD-L1 expression testing in non-small cell lung cancer. Ther. Adv. Med. Oncol. 2018, 10, 1758835918763493. [Google Scholar] [CrossRef] [PubMed]
- Haragan, A.; Field, J.K.; Davies, M.P.A.; Escriu, C.; Gruver, A.; Gosney, J.R. Heterogeneity of PD-L1 expression in non-small cell lung cancer: Implications for specimen sampling in predicting treatment response. Lung Cancer 2019, 134, 79–84. [Google Scholar] [CrossRef] [Green Version]
- Patel, S.P.; Kurzrock, R. PD-L1 Expression as a Predictive Biomarker in Cancer Immunotherapy. Mol. Cancer Ther. 2015, 14, 847–856. [Google Scholar] [CrossRef] [PubMed]
- Whiting, P.F.; Rutjes, A.W.S.; Westwood, M.E.; Mallett, S.; Deeks, J.J.; Reitsma, J.B.; Leeflang, M.M.G.; Sterne, J.A.C.; Bossuyt, P.M.M. QUADAS-2: Strumento per valutare la qualità degli studi di accuratezza diagnostica. Evidence 2016, 8, e1000131. [Google Scholar]
- Heus, P.; Damen, J.A.A.G.; Pajouheshnia, R.; Scholten, R.J.P.M.; Reitsma, J.B.; Collins, G.S.; Altman, D.G.; Moons, K.G.M.; Hooft, L. Poor reporting of multivariable prediction model studies: Towards a targeted implementation strategy of the TRIPOD statement. BMC Med. 2018, 16, 120. [Google Scholar] [CrossRef]
- Nagendran, M.; Chen, Y.; Lovejoy, C.A.; Gordon, A.C.; Komorowski, M.; Harvey, H.; Topol, E.J.; Ioannidis, J.P.A.; Collins, G.S.; Maruthappu, M. Artificial intelligence versus clinicians: Systematic review of design, reporting standards, and claims of deep learning studies. BMJ 2020, 368, m689. [Google Scholar] [CrossRef] [Green Version]
- Collins, G.S.; Moons, K.G.M. Reporting of artificial intelligence prediction models. Lancet 2019, 393, 1577–1579. [Google Scholar] [CrossRef]
- Zwanenburg, A.; Vallières, M.; Abdalah, M.A.; Aerts, H.J.W.L.; Andrearczyk, V.; Apte, A.; Ashrafinia, S.; Bakas, S.; Beukinga, R.J.; Boellaard, R.; et al. The Image Biomarker Standardization Initiative: Standardized Quantitative Radiomics for High-Throughput Image-based Phenotyping. Radiology 2020, 295, 328–338. [Google Scholar] [CrossRef] [PubMed] [Green Version]
- Wilkinson, M.D.; Dumontier, M.; Aalbersberg, I.J.; Appleton, G.; Axton, M.; Baak, A.; Blomberg, N.; Boiten, J.-W.; da Silva Santos, L.B.; Bourne, P.E.; et al. The FAIR Guiding Principles for scientific data management and stewardship. Sci. Data 2016, 3, 160018. [Google Scholar] [CrossRef] [PubMed] [Green Version]
- Rolfo, C.; Mack, P.C.; Scagliotti, G.V.; Baas, P.; Barlesi, F.; Bivona, T.G.; Herbst, R.S.; Mok, T.S.; Peled, N.; Pirker, R.; et al. Liquid Biopsy for Advanced Non-Small Cell Lung Cancer (NSCLC): A Statement Paper from the IASLC. J. Thorac. Oncol. 2018, 13, 1248–1268. [Google Scholar] [CrossRef] [PubMed] [Green Version]
- Goldman, J.W.; Noor, Z.S.; Remon, J.; Besse, B.; Rosenfeld, N. Are liquid biopsies a surrogate for tissue EGFR testing? Ann. Oncol. 2018, 29, i38–i46. [Google Scholar] [CrossRef]
- Mayo-de-las-Casas, C.; Jordana-Ariza, N.; Garzón-Ibañez, M.; Balada-Bel, A.; Bertrán-Alamillo, J.; Viteri-Ramírez, S.; Reguart, N.; Muñoz-Quintana, M.A.; Lianes-Barragan, P.; Camps, C.; et al. Large scale, prospective screening of EGFR mutations in the blood of advanced NSCLC patients to guide treatment decisions. Ann. Oncol. 2017, 28, 2248–2255. [Google Scholar] [CrossRef]
- Laufer-Geva, S.; Rozenblum, A.B.; Twito, T.; Grinberg, R.; Dvir, A.; Soussan-Gutman, L.; Ilouze, M.; Roisman, L.C.; Dudnik, E.; Zer, A.; et al. The Clinical Impact of Comprehensive Genomic Testing of Circulating Cell-Free DNA in Advanced Lung Cancer. J. Thorac. Oncol. 2018, 13, 1705–1716. [Google Scholar] [CrossRef] [Green Version]
- Remon, J.; Caramella, C.; Jovelet, C.; Lacroix, L.; Lawson, A.; Smalley, S.; Howarth, K.; Gale, D.; Green, E.; Plagnol, V.; et al. Osimertinib benefit inEGFR-mutant NSCLC patients withT790M-mutation detected by circulating tumour DNA. Ann. Oncol. 2017, 28, 784–790. [Google Scholar] [CrossRef]
- Saarenheimo, J.; Eigeliene, N.; Andersen, H.; Tiirola, M.; Jekunen, A. The value of liquid biopsies for guiding therapy decisions in non-small cell lung cancer. Front. Oncol. 2019, 9, 129. [Google Scholar] [CrossRef] [Green Version]
- Hofman, P.; Heeke, S.; Alix-Panabières, C.; Pantel, K. Liquid biopsy in the era of immuno-oncology: Is it ready for prime-time use for cancer patients? Ann. Oncol. 2019, 30, 1448–1459. [Google Scholar] [CrossRef] [Green Version]
- Higgins, J.P.T.; Thomas, J.; Chandler, J.; Cumpston, M.; Li, T.; Page, M.J.; Welch, V.A. (Eds.) Cochrane Handbook for Systematic Reviews of Interventions; Wiley: Hoboken, NJ, USA, 2019; ISBN 9781119536628. [Google Scholar]


| Target/Biomarker | Frequency [28,29,30,31,32,33] | Targeted Therapy/Immunotherapy Options | ||
|---|---|---|---|---|
| EGFR mutation | Erlotinib [6], gefitinib [7], afatinib [20], osimertinib [21], dacomitinib [8] | |||
| Overall | 10–20% 1, 40–50% 2 | |||
| Exon 19 deletion | ≃45% | |||
| Exon 21 L858R mutation | ≃40% | |||
| Others | ≃15% | |||
| ALK rearrangement | 3–7% | Crizotinib [16], alectinib [10], ceritinib [9], brigatinib [13], lorlatinib [11] | ||
| ROS1 rearrangement | 1–4% | Crizotinib [17], entrectinib [19] | ||
| BRAF mutation | 1–5% | Dabrafenib + trametinib [12] | ||
| Tumor cells PD-L1 expression | Nivolumab 3 [22,27], pembrolizumab 3 [23,25], atezolizumab 4 [24], durvalumab 4 [26] | |||
| <1% | 30–40% | |||
| 1–49% | 30–40% | |||
| ≥50% | ≃30% | |||
| Evolving target/biomarker 5 | ||||
| RET rearrangement | 1–3% | |||
| ERRB2 (HER2) mutation | 2–4% | |||
| KRAS mutation | 15–30% | |||
| MET amplification | 3–4% | |||
| Study Characteristic | “High-Quality” Papers (n = 18) | All Eligible Papers (n = 24) | |
|---|---|---|---|
| Year of publication | |||
| 2014–2017 | 2 (11%) | 4 (17%) | |
| 2018–2020 | 16 (89%) | 20 (83%) | |
| Number of patients | |||
| 0–100 | 2 (11%) | 3 (12.5%) | |
| 100–300 | 6 (33%) | 9 (37.5%) | |
| 300–500 | 3 (17%) | 4 (17%) | |
| >500 | 7 (39%) | 8 (33%) | |
| Study type | |||
| Prospective | 0 | 0 | |
| Retrospective | 18 (100%) | 24 (100%) | |
| Imaging modality | |||
| CT | 14 (74%) | 18 (75%) | |
| 18F-FDG PET/CT | 4 (26%) | 6 (25%) | |
| Molecule(s) of interest 1 | |||
| EGFR | 15 2 | 20 | |
| ALK | 2 | 2 | |
| ROS1 | 1 | 1 | |
| BRAF | 0 | 0 | |
| RET | 1 | 1 | |
| HER2 | 0 | 0 | |
| KRAS | 0 | 3 | |
| MET | 0 | 0 | |
| PD-L1 | 2 | 2 | |
| Imaging predictors 3 | |||
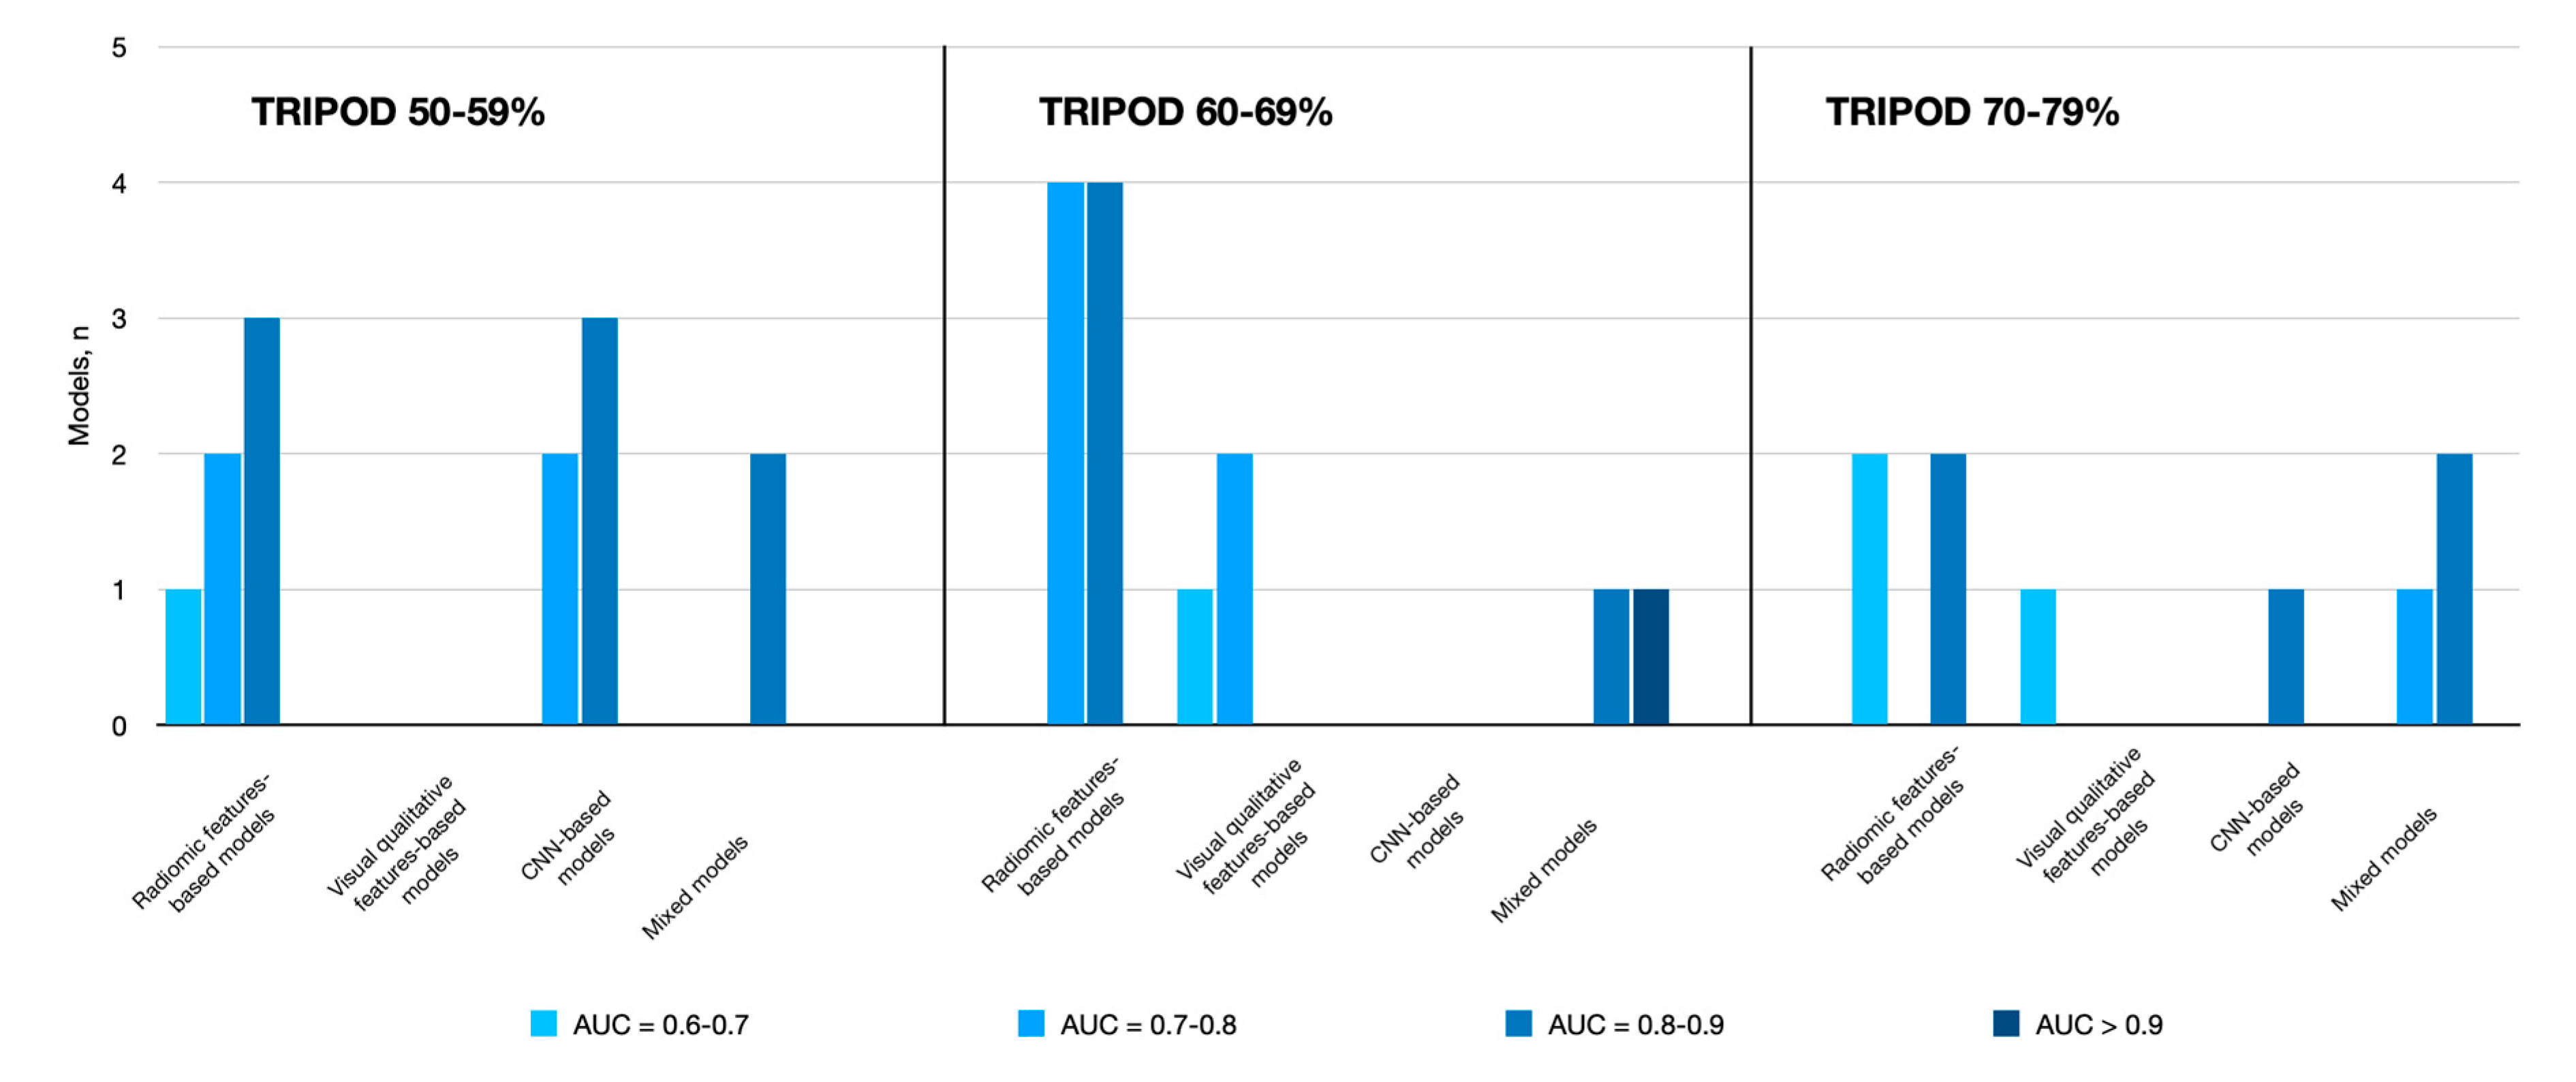
| Visual qualitative CT features | 8 | 10 | |
| Conventional PET parameters | 2 | 3 | |
| Radiomic features | 16 | 20 | |
| CNN-based approaches | 4 | 4 | |
| Type of validation | |||
| Internal | 5 (28%) | 7 (29%) | |
| Split sample | 12 (67%) | 15 (63%) | |
| Geographic external validation | 1 (5%) | 2 (8%) | |
| Study | N (% EGFR+) | Study Population | Imaging Modality | Method | Validation | Main Results T, V | TRIPOD |
|---|---|---|---|---|---|---|---|
| TRIPOD Adherence Rate 70–79% | |||||||
| [54] | 637 (54%) | Stage I–IV AC | CT | Radiomics | Split Sample | AUC = 0.71, 0.69 | 73% |
| Selected CT r=Radiomic Features: First-Order Features (Mean, Skewness), GLCM Features (Homogeneity, Contrast), GLRLM Features (RLNU) | |||||||
| [59] | 844 (56%) | Stage I–IV AC | CT | Radiomics | Split Sample | AUC = 0.70, 0.64 | 73% |
| Selected CT Radiomic Features: Not Reported | |||||||
| [55] | 104 (62%) | Stage I–IV AC | CT | Radiomics Radiomics + Clinical | Split Sample | AUC = 0.92, 0.84 AUC = 0.90, 0.89 | 70% |
| Selected CT Radiomic Features: GLCM Features (Cluster Prominence), GLDM Features (LGE, DNN), GLSZM Features (SZHGE, SZLGE), Wavelet Features Selected Clinicopathologic Features: Sex, Smoking, Vascular Infiltration, Histological Subtype | |||||||
| TRIPOD Adherence Rate 60–69% | |||||||
| [69] | 404 (46%) | Stage I–IV NSCLC | CT | Radiomics | Split Sample | AUC = 0.76, 0.78 | 67% |
| Selected CT Radiomic Features: First-Order Features (Median, Entropy), GLCM Features (Homogeneity), GLRLM Features (RLNU) | |||||||
| [62] | 180 (48%) | Stage III–IV NSCLC | CT | Radiomics Radiomics + Clinical | Split Sample | AUC = 0.76, 0.77 AUC = 0.86, 0.87 | 67% |
| Selected CT Radiomic Features: First-Order Features (Range, Skewness), GLRLM Features (HGRE), Wavelet Features Selected Clinicopathologic Features: Sex, Smoking, Histological subtype | |||||||
| [68] | 80 (38%) | Stage II–III NSCLC | PET/CT | Radiomics | Cross Validation | AUC = 0.83 | 63% |
| Selected Radiomic Features: Not Reported | |||||||
| [56] | 467 (64%) | Early-Stage AC | CT | Radiomics Radiomics + Clinical | Split Sample | AUC = 0.83, 0.79 AUC = 0.83, 0.78 | 63% |
| Selected CT Radiomic Features: First-Order Features (Energy, Entropy, Total Energy, Range, Flatness, Maximum 2D Diameter Slice, Surface Area), First-Order Features from LBP2D image (Major Axis, Maximum 2D Diameter Column, Maximum 2D Diameter Row, Maximum 3D Diameter, Sphericity), First-Order Features from LBP3D image (90th Percentile, Variance), GLCM Features (Sum Entropy, Autocorrelation, Cluster Prominence), GLSZM Features (HGZE, ZSNU), GLRLM Features (RLNU, GLV, HGRE, RE, SRLGE), GLDM Features (GLNU, DE, LGE), Wavelet Features Selected Clinicopathologic Features: Age, Histologic Subtype | |||||||
| [57] | 503 (61%) | Stage I–IV AC | CT | Radiomics Radiomics + Clinical | Split Sample | AUC = NR, 0.80 AUC = NR, 0.83 | 63% |
| Selected CT Radiomic Features: Not Reported Selected Clinicopathologic Features: Sex, Smoking | |||||||
| TRIPOD Adherence Rate 50–59% | |||||||
| [64] | 115 (56%) | Stage I–IV AC | PET/CT | Radiomics Radiomics + Clinical | Cross Validation | AUC = 0.81 AUC = 0.82 | 57% |
| Selected PET Radiomic Features: First-Order Features (Mean, Concavity), GLCM Features (Homogeneity, Energy, Entropy, Contrast, Correlation) Selected CT Radiomic Features: First-Order Features (Range, Mean) Selected Clinicopathologic Features: Age, Sex, Smoking, Stage, Lesion Location | |||||||
| [60] | 51 (45%) | Stage I–III AC | CT | Radiomics | Cross Validation | AUC = 0.83 | 57% |
| Selected CT Radiomic Features: First-Order Features (Entropy, Energy, Volume, Shape Index), Wavelet Features | |||||||
| [70] | 579 (53%) 37 (24%) 1 | Stage I–IV AC | CT | Radiomics | Split Sample External | AUC = NR, 0.65 AUC = 0.69 | 53% |
| Selected CT Radiomic Features: Not Clear | |||||||
| [58] | 1010 (50%) | Stage I–IV AC | CT | Radiomics Radiomics + Clinical | Split Sample | AUC = NR, 0.74 AUC = NR, 0.76 | 53% |
| Selected CT Radiomic Features: Not Clear Selected Clinicopathologic Features: Sex, Smoking | |||||||
| Study | N (% EGFR+) | Study Population | Imaging Modality | Method | Validation | Main Results T, V | TRIPOD |
|---|---|---|---|---|---|---|---|
| TRIPOD Adherence Rate 70–79% | |||||||
| [59] | 844 (56%) | Stage I–IV AC | CT | Visual Qualitative Image Analysis | Split Sample | AUC = 0.76, 0.64 | 73% |
| Selected Visual Qualitative CT Features: Pleural Attachment, Border Definition, Spiculation, Density, Air Bronchogram, Bubblelike Lucency, Enhancement Heterogeneity, Vascular Convergence, Thickened Adjacent Bronchovascular Bundles, Pleural Indentation, Emphysema, Peripheral Fibrosis, Lymphadenopathy, Size, Long-Axis Diameter, Short-Axis Diameter | |||||||
| TRIPOD Adherence Rate 60–69% | |||||||
| [55] | 104 (62%) | Stage I–IV AC | CT | Visual Qualitative Image Analysis + Clinical | Split Sample | AUC = 0.78, 0.77 | 67% |
| Selected Visual Qualitative CT Features: Spiculation, Tumor Necrosis Selected Clinicopathologic Features: Sex, Age, Visceral Pleural Infiltration, Histological Subtype | |||||||
| [69] | 404 (46%) | Stage I–IV NSCLC | CT | Visual Qualitative Image Analysis + Clinical | Split Sample | AUC = 0.69, 0.62 | 67% |
| Selected Visual Qualitative CT Features: Density, Location Selected Clinicopathologic Features: Sex | |||||||
| [68] | 80 (38%) | Stage II–III NSCLC | CT | Visual Qualitative Image Analysis | Cross Validation | AUC = 0.73 | 63% |
| Selected Visual Qualitative CT Features: Lobulation, Spiculation, Emphysema, Pleural Indentation | |||||||
| Clinicopathologic Feature | % Studies Reporting Statistically Significant Association |
|---|---|
| Spiculation | 75% |
| Absence of Emphysema | 75% |
| Pleural Indentation | 50% |
| Subsolid Nodule | 50% |
| Study | N (% EGFR+) | Study Population | Imaging Modality | Method | Validation | Main Results T, V | TRIPOD |
|---|---|---|---|---|---|---|---|
| TRIPOD Adherence Rate 70–79% | |||||||
| [59] | 844 (56%) | Stage I–IV AC | CT | CNN | Split Sample | AUC = 0.85, 0.81 | 73% |
| TRIPOD Adherence Rate 50–59% | |||||||
| [70] | 579 (53%) 37 (24%) 1 | Stage I–IV AC | CT | CNN | Split Sample External | AUC = NR, 0.76 AUC = 0.75 | 53% |
| [61] | 503 (61%) | Stage I–IV AC | CT | CNN CNN + Clinical | Split Sample | AUC = NR, 0.78 AUC = NR, 0.84 | 53% |
| Selected Clinicopathologic Features: Sex, Smoking | |||||||
| [58] | 1010 (50%) | Stage I–IV AC | CT | CNN CNN + Clinical | Split Sample | AUC = NR, 0.81 AUC = NR, 0.83 | 53% |
| Selected Clinicopathologic Features: Sex, Smoking | |||||||
| Study | N (% EGFR+) | Study Population | Imaging Modality | Method | Validation | Main Results T, V | TRIPOD |
|---|---|---|---|---|---|---|---|
| TRIPOD adherence rate 70–79% | |||||||
| [54] | 637 (54%) | Stage I–IV AC | CT | Radiomics + Visual Qualitative Image Analysis + Clinical | Split Sample | AUC = 0.76, 0.73 | 73% |
| Selected CT Radiomic Features: First-Order Features (Mean, Skewness), GLCM Features (Homogeneity, Contrast), GLRLM Features (RLNU) Selected Visual Qualitative CT Features: Emphysema Selected Clinicopathologic Features: Sex | |||||||
| [63] | 248 (54%) | Stage I–IV AC | PET/CT | Radiomics + PET Parameters Radiomics + PET Parameters + Clinical | Split Sample | AUC = 0.79, 0.85 AUC = 0.86, 0.87 | 70% |
| Selected PET Radiomic Features: First-Order Features (Compacity), GLCM Features (Energy), GLSZM Features (SZE, ZP) Selected CT Radiomic Features: First-Order Features (Maximum, Sphericity), GLSZM Features (ZLNU), GLRLM Features (HGRE), NGLDM Features (Busyness) Selected PET Parameters: SUVpeak Selected Clinicopathologic Features: Sex, Smoking | |||||||
| TRIPOD adherence rate 60–69% | |||||||
| [69] | 404 (46%) | Stage I–IV NSCLC | CT | Radiomics + Visual Qualitative Image Analysis + Clinical | Split Sample | AUC = 0.80, 0.82 | 67% |
| Selected CT Radiomic Features: First-Order Features (Median, Entropy), GLCM Features (Homogeneity), GLRLM Features (RLNU) Selected Visual Qualitative CT Features: Long-Axis Diameter, Location Selected Clinicopathologic Features: Sex | |||||||
| [68] | 80 (38%) | Stage II–III NSCLC | PET/CT | Radiomics + Visual Qualitative Image Analysis | Cross Validation | AUC = 0.95 | 63% |
| Selected CT Radiomic Features: Not Clear Selected Visual Qualitative CT Features: Lobulation, Spiculation, Emphysema, Pleural indentation | |||||||
| TRIPOD adherence rate 50–59% | |||||||
| [58] | 1010 (50%) | Stage I–IV AC | CT | CNN + Radiomics CNN + Radiomics + Clinical | Split Sample | AUC = NR, 0.81 AUC = NR, 0.83 | 53% |
| Selected CT Radiomic Features: Not Clear Selected Clinicopathologic Features: Sex, Smoking | |||||||
| Clinicopathologic Feature | % Studies Reporting Statistically Significant Association |
|---|---|
| Female Sex | 90% |
| Non-Smoking Status | 70% |
| Study | N (exon19del: L858R) | Study Population | Imaging Modality | Method | Validation | Main Results T, V | TRIPOD |
|---|---|---|---|---|---|---|---|
| [54] | 320 (130:190) | Stage I–IV AC | CT | Radiomics Radiomics + Clinical | Split Sample | AUC = 0.68, 0.71 AUC = 0.69, 0.76 | 73% |
| Selected CT Radiomic Features: First-Order Features (Mean, Skewness, Standard Deviation), GLCM Features (Homogeneity, Correlation, Entropy, Contrast), GLSZM Features (GLNU), GLRLM Features (LRE, SRE, RLNU) Selected Clinicopathologic Features: Age | |||||||
| Study | N (% ALK+) | Study Population | Imaging Modality | Method | Validation | Main Results (T) (V) | TRIPOD |
|---|---|---|---|---|---|---|---|
| [71] | 172 (27%) | Stage I–IV NSCLC | CT | Visual Qualitative Image Analysis + Clinical | Split Sample | SE, SP, ACC = 86%, 77%, 81% (T) 83%, 78%, 79% (V) | 60% |
| Selected Visual Qualitative CT Features: Location, Pleural Effusion, Pleural Tail Sign Selected Clinicopathologic Features: Age | |||||||
| Study | N (% Fusion-Positive) | Study Population | Imaging Modality | Method | Validation | Main Results (T) (V) | TRIPOD |
|---|---|---|---|---|---|---|---|
| [75] | 537 (16%) | Stage I–IV AC | PET/CT | Radiomics + PET Parameters + Visual Qualitative Image Analysis + Clinical | Cross Validation | SE, SP, = NR (T) 73%, 70% (V) | 60% |
| Selected CT Radiomic Features: First-Order Features (Kurtosis), GLCM Features (Inverse Variance) Selected PET parameters: SUVmax Selected Visual Qualitative CT Features: Density, Mass Selected Clinicopathologic Features: Age, Stage | |||||||
| Study | N (% PD-L1 ≥1% /≥50%) | Study Population | Imaging Modality | Method | Validation | Main Results T, V | TRIPOD |
|---|---|---|---|---|---|---|---|
| Prediction of PD-L1 expression level ≥1% | |||||||
| [77] 1 | 399 (66%) | Stage I–IV NSCLC | PET/CT | Radiomics | Split Sample | AUC = NR, 0.86 AUC = NR, 0.97 | 53% |
| Selected PET Radiomic Features: First-Order Features (Maximum 2D Diameter Slice, Interquartile Range), Wavelet Features Selected CT Radiomic Features: First-Order Features (Maximum), First-Order Features from LBP3D Image (10th Percentile), GLRLM Features (RLNU), Wavelet Features | |||||||
| Prediction of PD-L1 expression level ≥50% | |||||||
| [76] | 153 (35%) | Stage IIIb–IV AC | CT | Radiomics + Clinical | Bootstrapping Validation | AUC = 0.67, 0.67 | 73% |
| Selected CT Radiomic Features: GLCM Features (Energy), GLRLM Features (RV, RE, SRHGE) Selected Clinicopathologic Features: Age, Sex, Smoking, EGFR status | |||||||
| [77] 1 | 399 (21%) | Stage I-IV NSCLC | PET/CT | Radiomics | Split Sample | AUC = NR, 0.910 AUC = NR, 0.770 | 53% |
| Selected PET Radiomic Features: First-Order Features (Maximum 2D Diameter Slice, Interquartile Range), Wavelet Features Selected CT Radiomic Features: First-Order Features (Maximum), First-Order Features from LBP3D Image (10th Percentile), GLRLM Features (RLNU), Wavelet Features | |||||||
© 2020 by the authors. Licensee MDPI, Basel, Switzerland. This article is an open access article distributed under the terms and conditions of the Creative Commons Attribution (CC BY) license (http://creativecommons.org/licenses/by/4.0/).
Share and Cite
Ninatti, G.; Kirienko, M.; Neri, E.; Sollini, M.; Chiti, A. Imaging-Based Prediction of Molecular Therapy Targets in NSCLC by Radiogenomics and AI Approaches: A Systematic Review. Diagnostics 2020, 10, 359. https://doi.org/10.3390/diagnostics10060359
Ninatti G, Kirienko M, Neri E, Sollini M, Chiti A. Imaging-Based Prediction of Molecular Therapy Targets in NSCLC by Radiogenomics and AI Approaches: A Systematic Review. Diagnostics. 2020; 10(6):359. https://doi.org/10.3390/diagnostics10060359
Chicago/Turabian StyleNinatti, Gaia, Margarita Kirienko, Emanuele Neri, Martina Sollini, and Arturo Chiti. 2020. "Imaging-Based Prediction of Molecular Therapy Targets in NSCLC by Radiogenomics and AI Approaches: A Systematic Review" Diagnostics 10, no. 6: 359. https://doi.org/10.3390/diagnostics10060359