
IVUS Longitudinal and Axial Registration for Atherosclerosis Progression Evaluation

 ,
,  ,
,  , and
, and
Abstract
:1. Introduction
2. Problem Formulation
2.1. Data Preparation
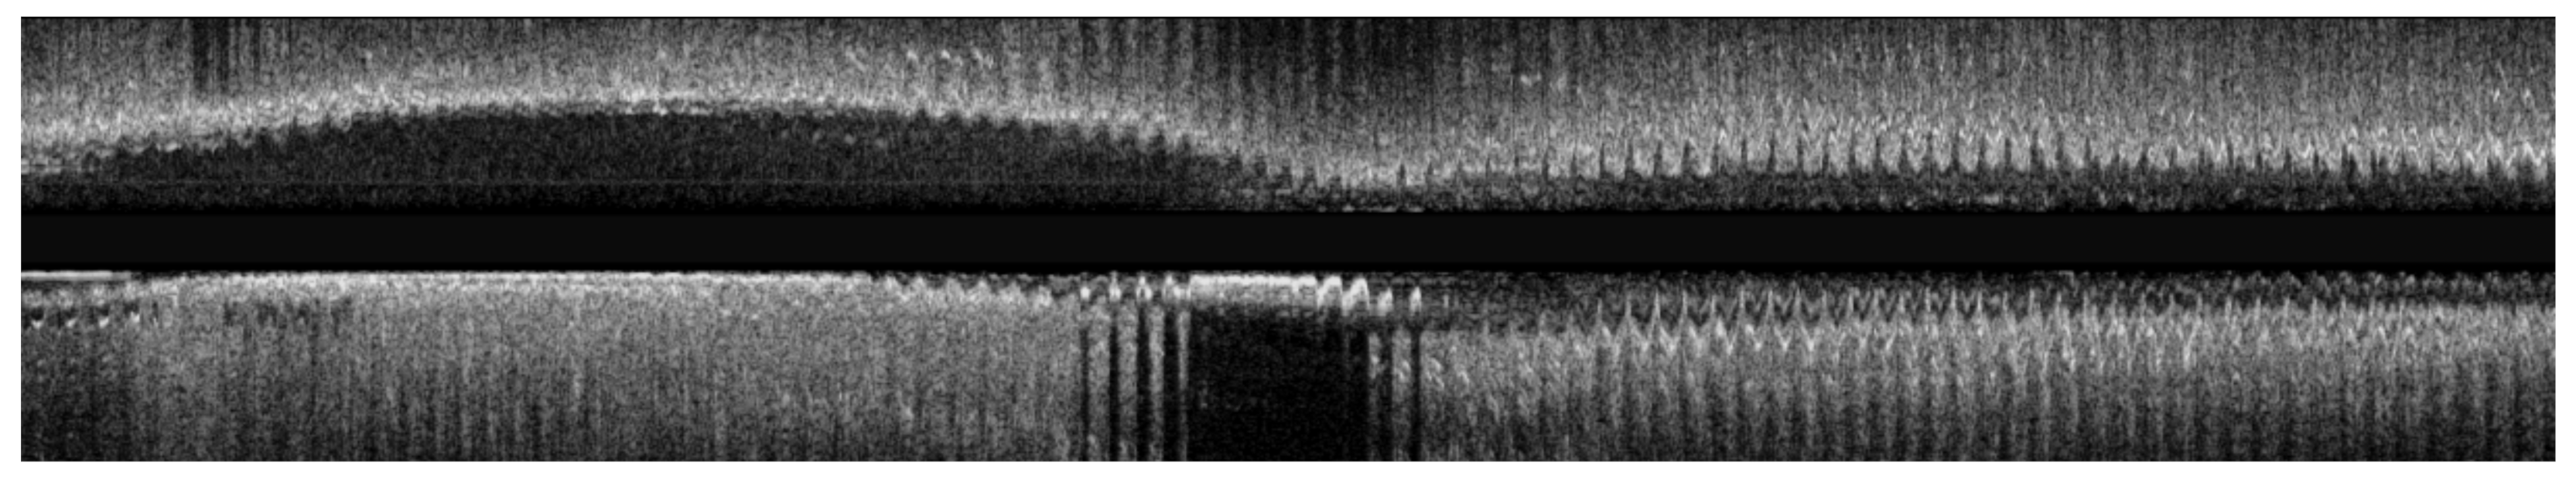
2.2. IVUS Pullbacks Registration
3. Proposed Registration Pipeline
- Data Preprocessing: Image processing methods are employed for the removal of unnecessary artifacts and noise.
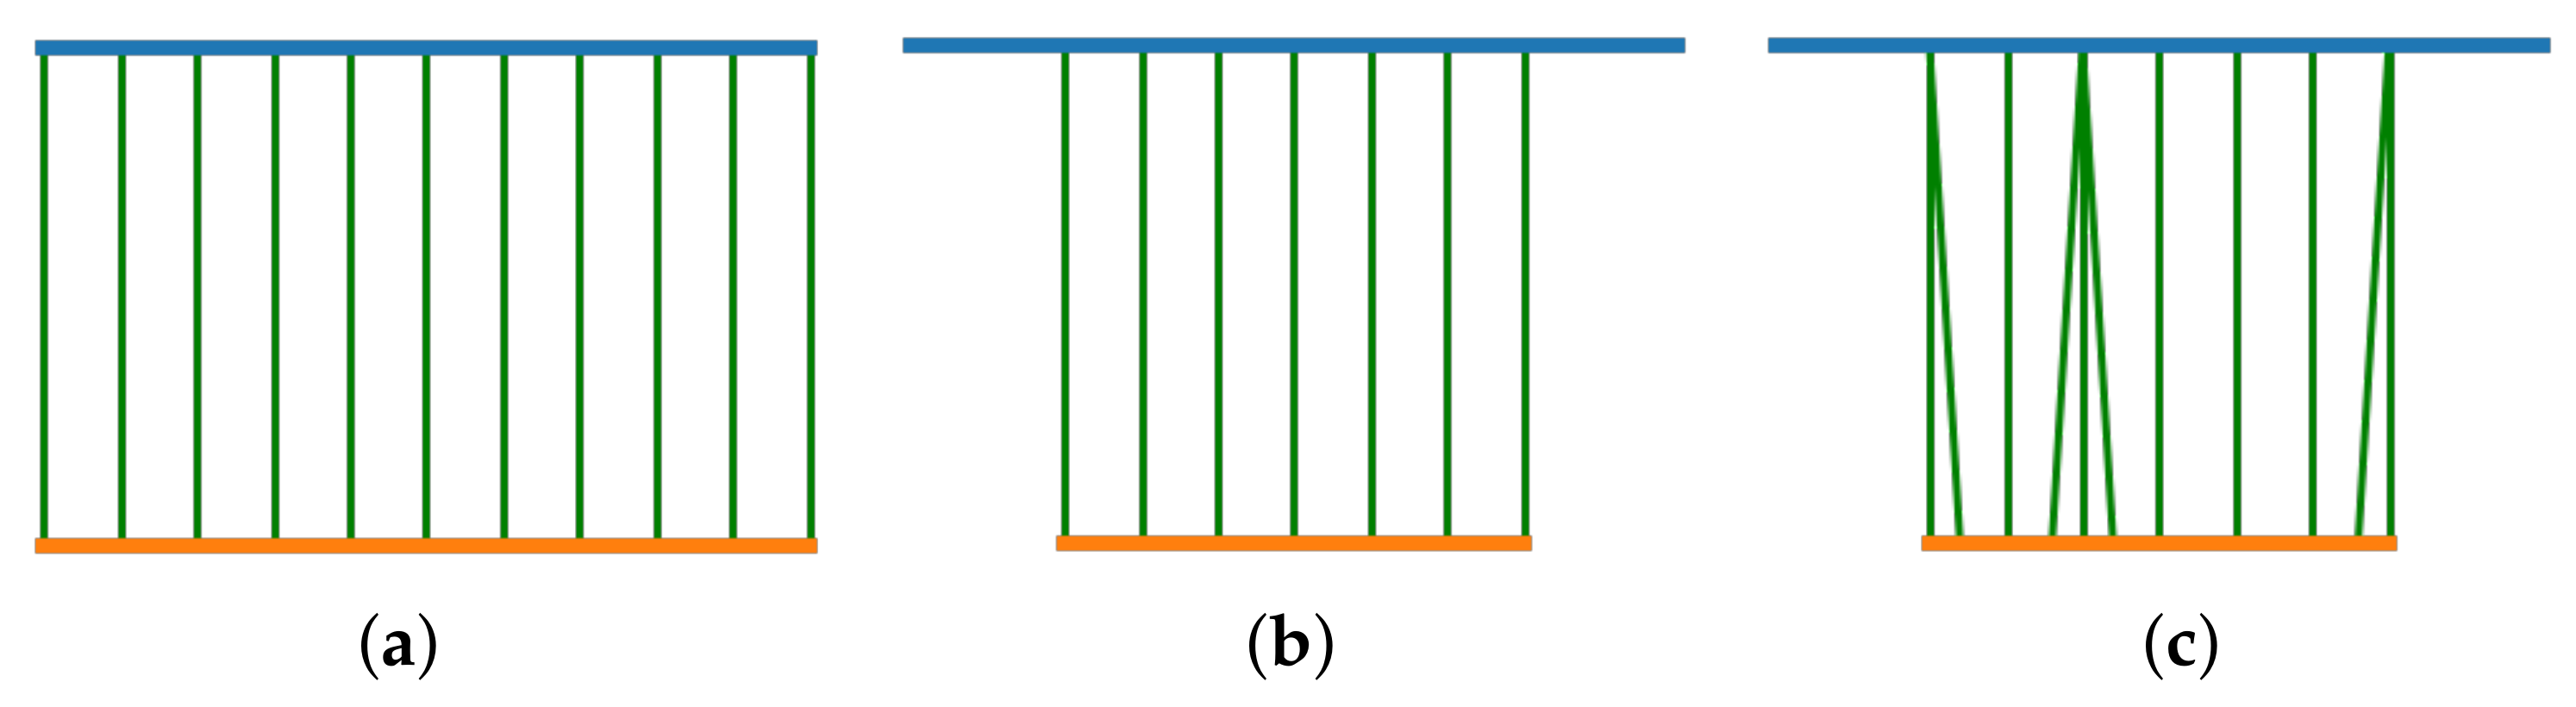
- Longitudinal Registration: The corresponding image pairs of the two IVUS image sequences are selected.
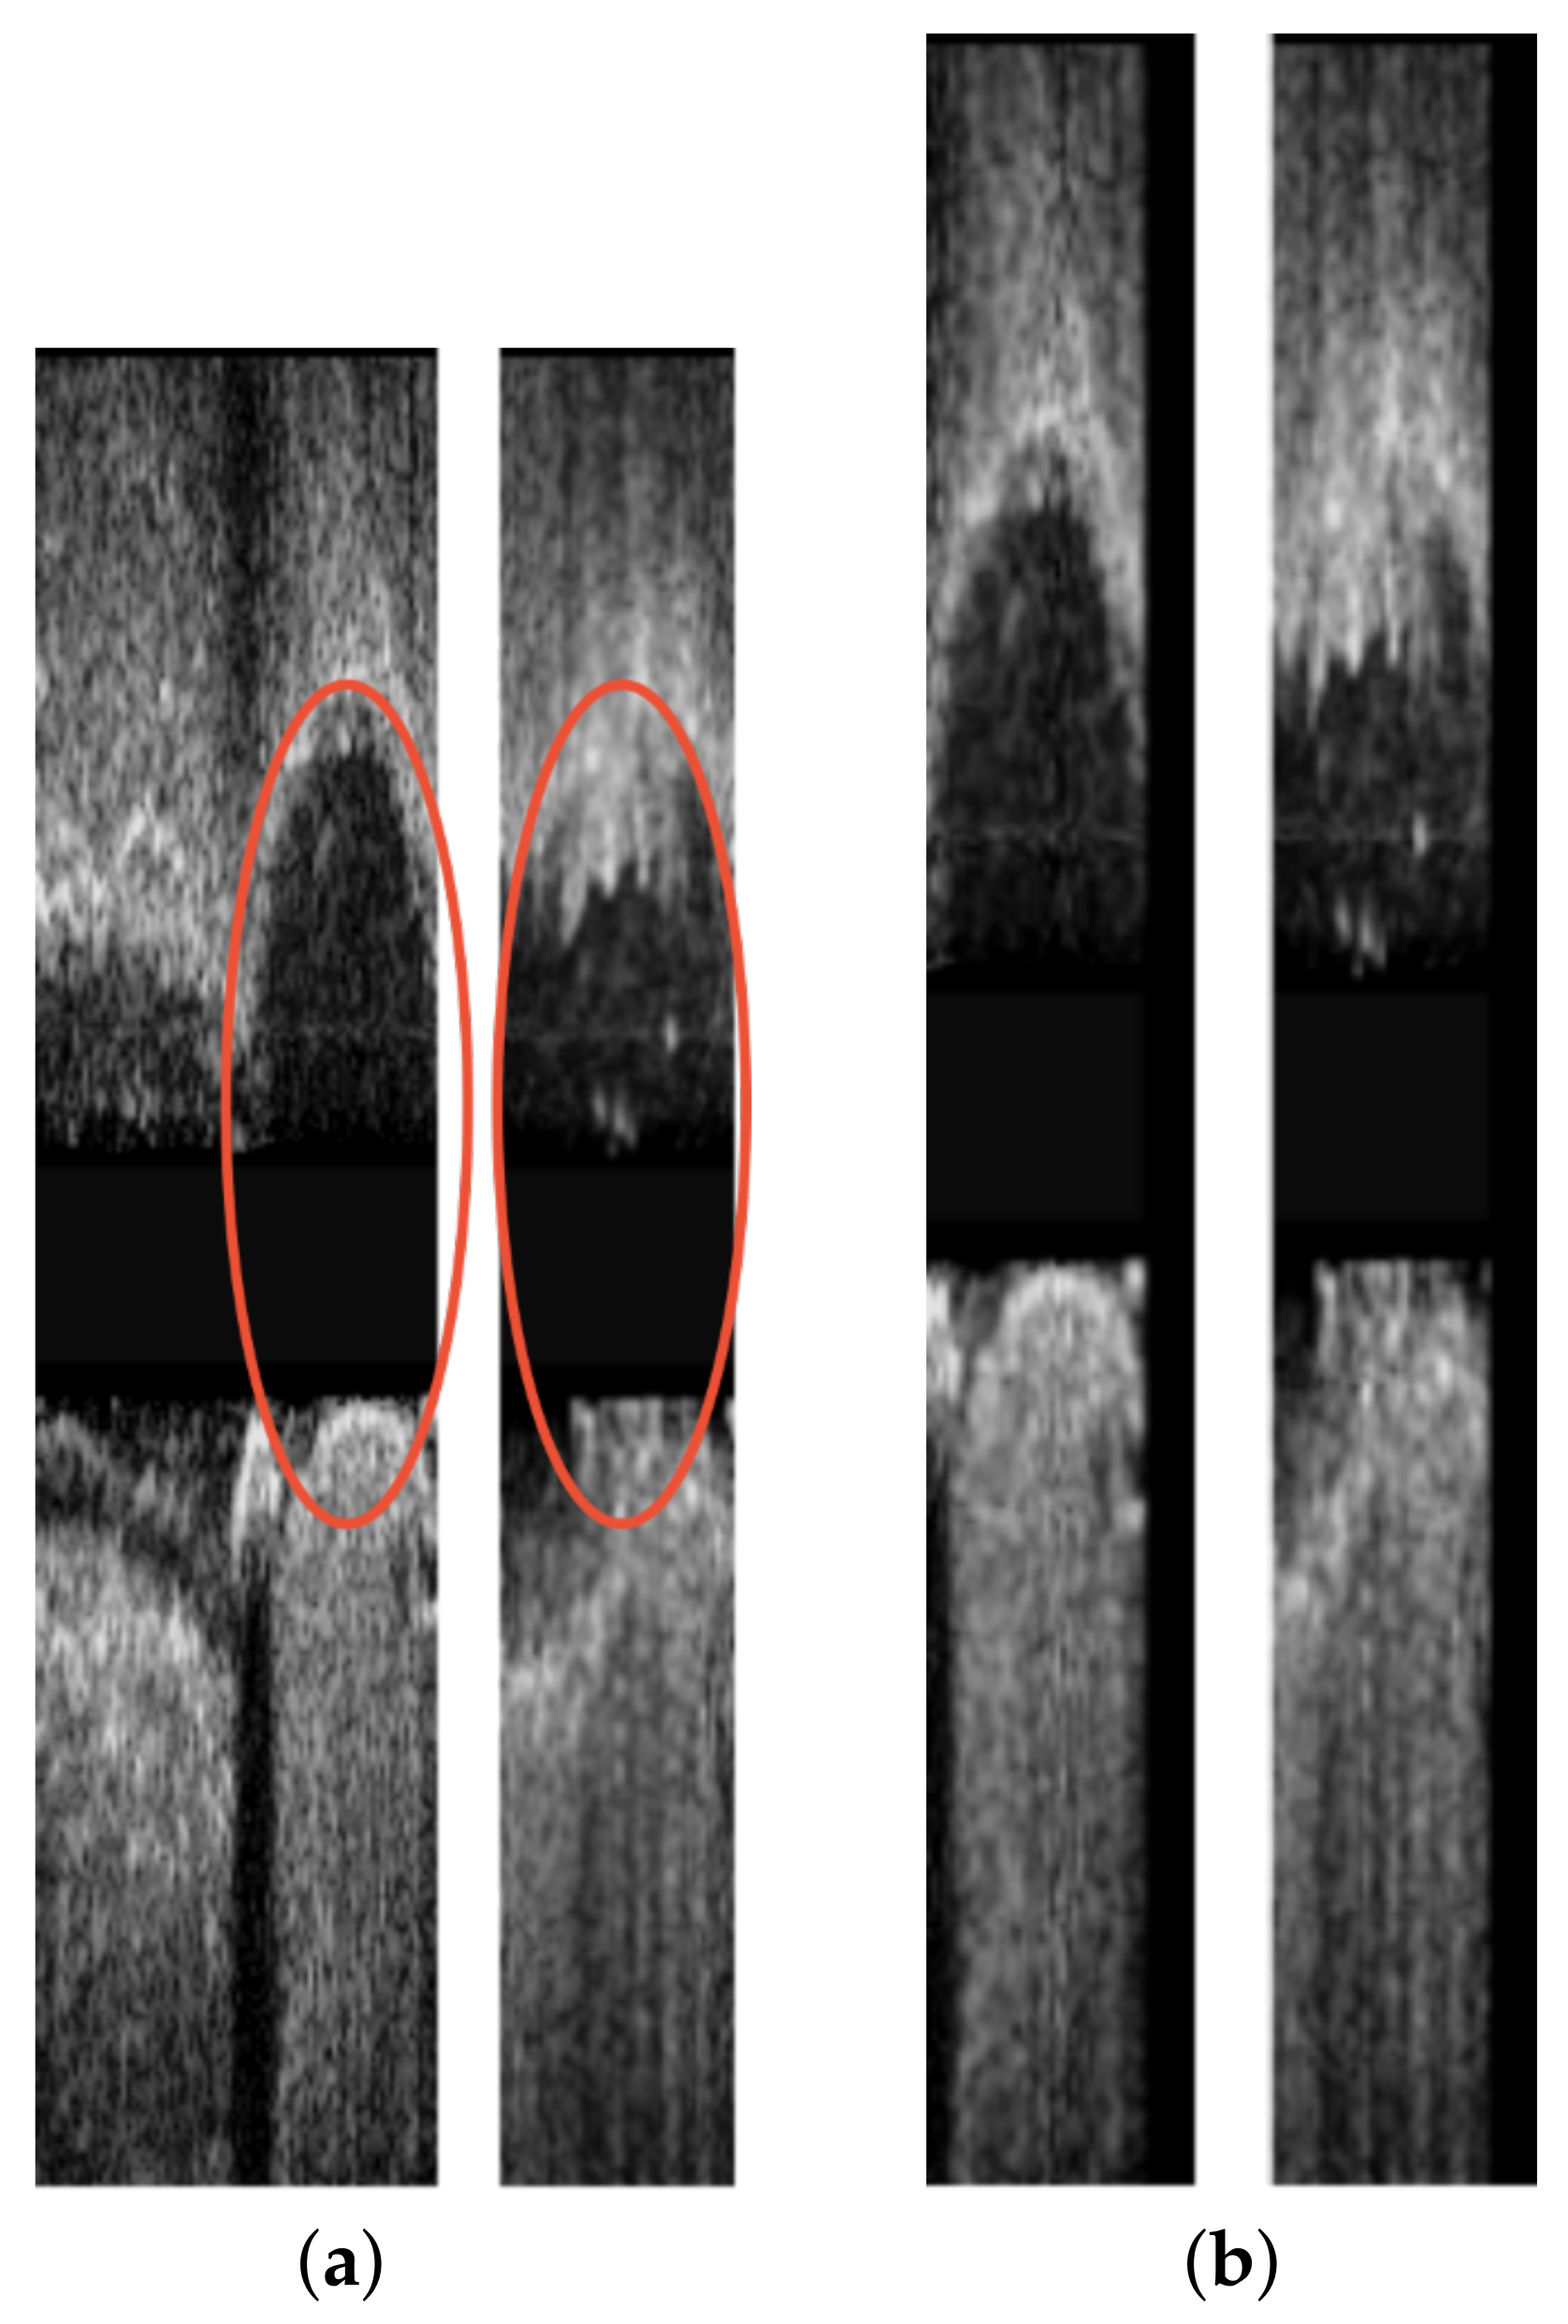
- Axial Registration: Axial alignment of the corresponding images using rigid image registration is performed.
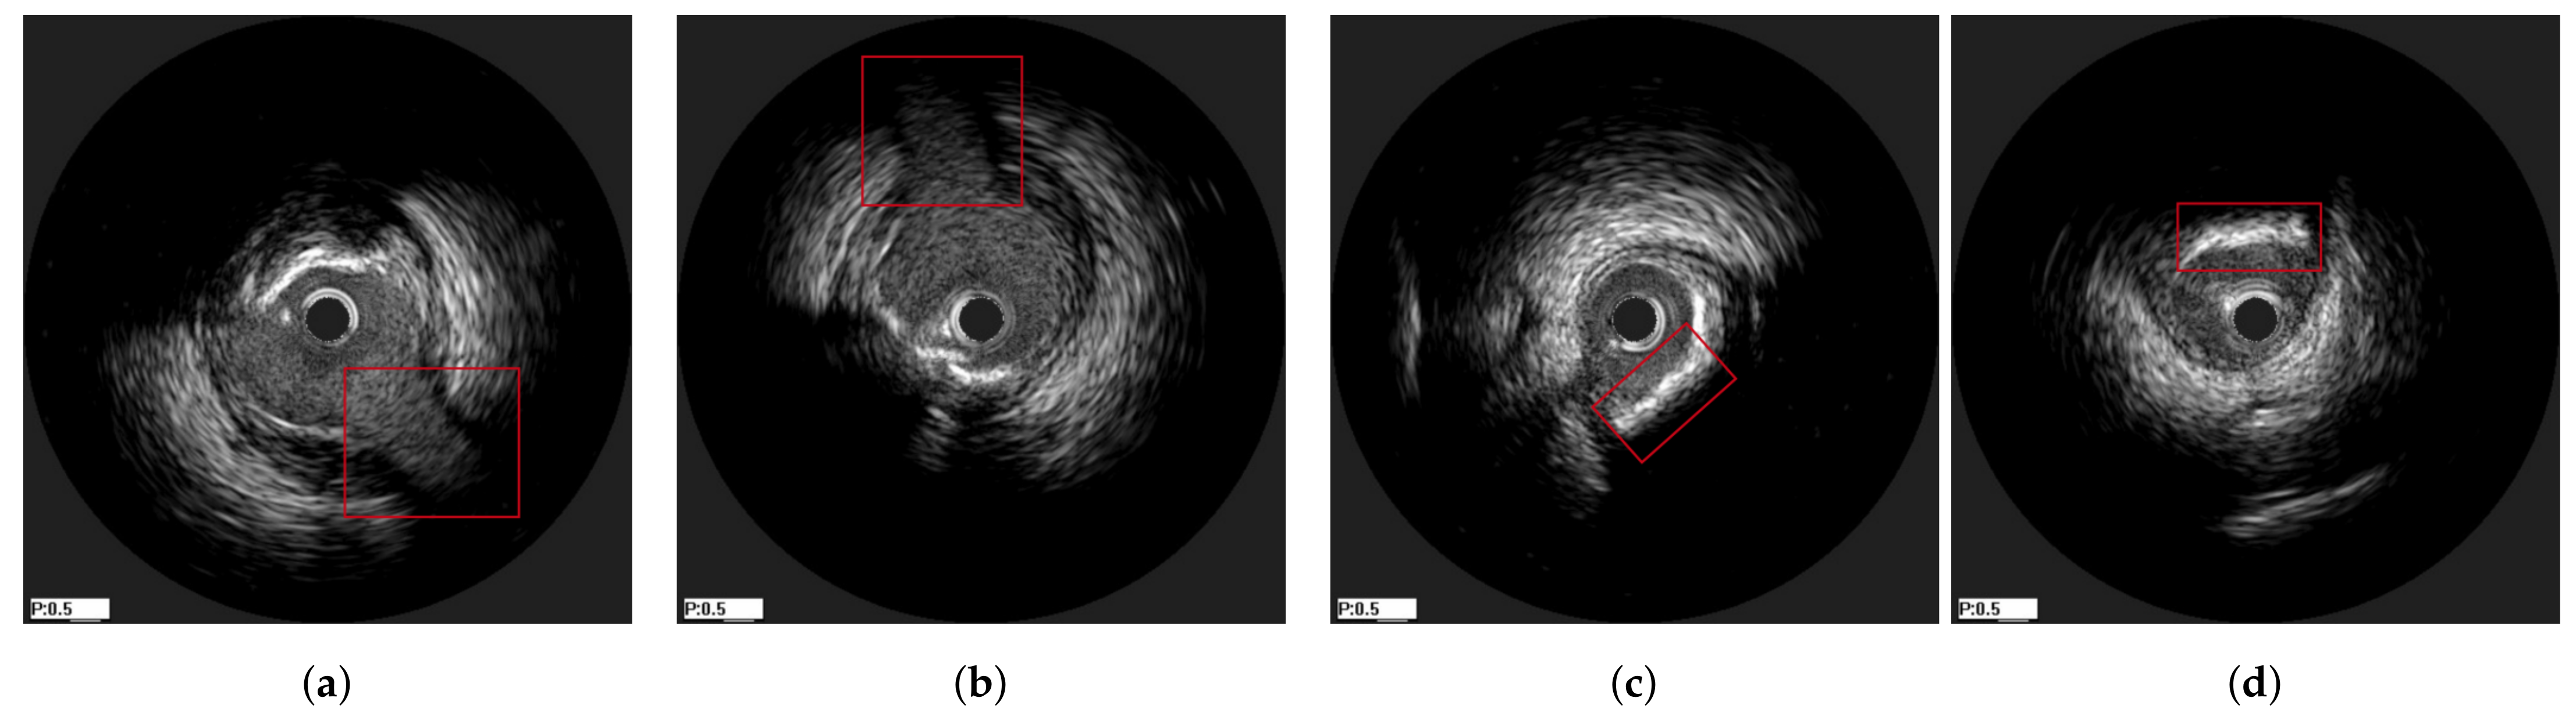
3.1. Data Preprocessing
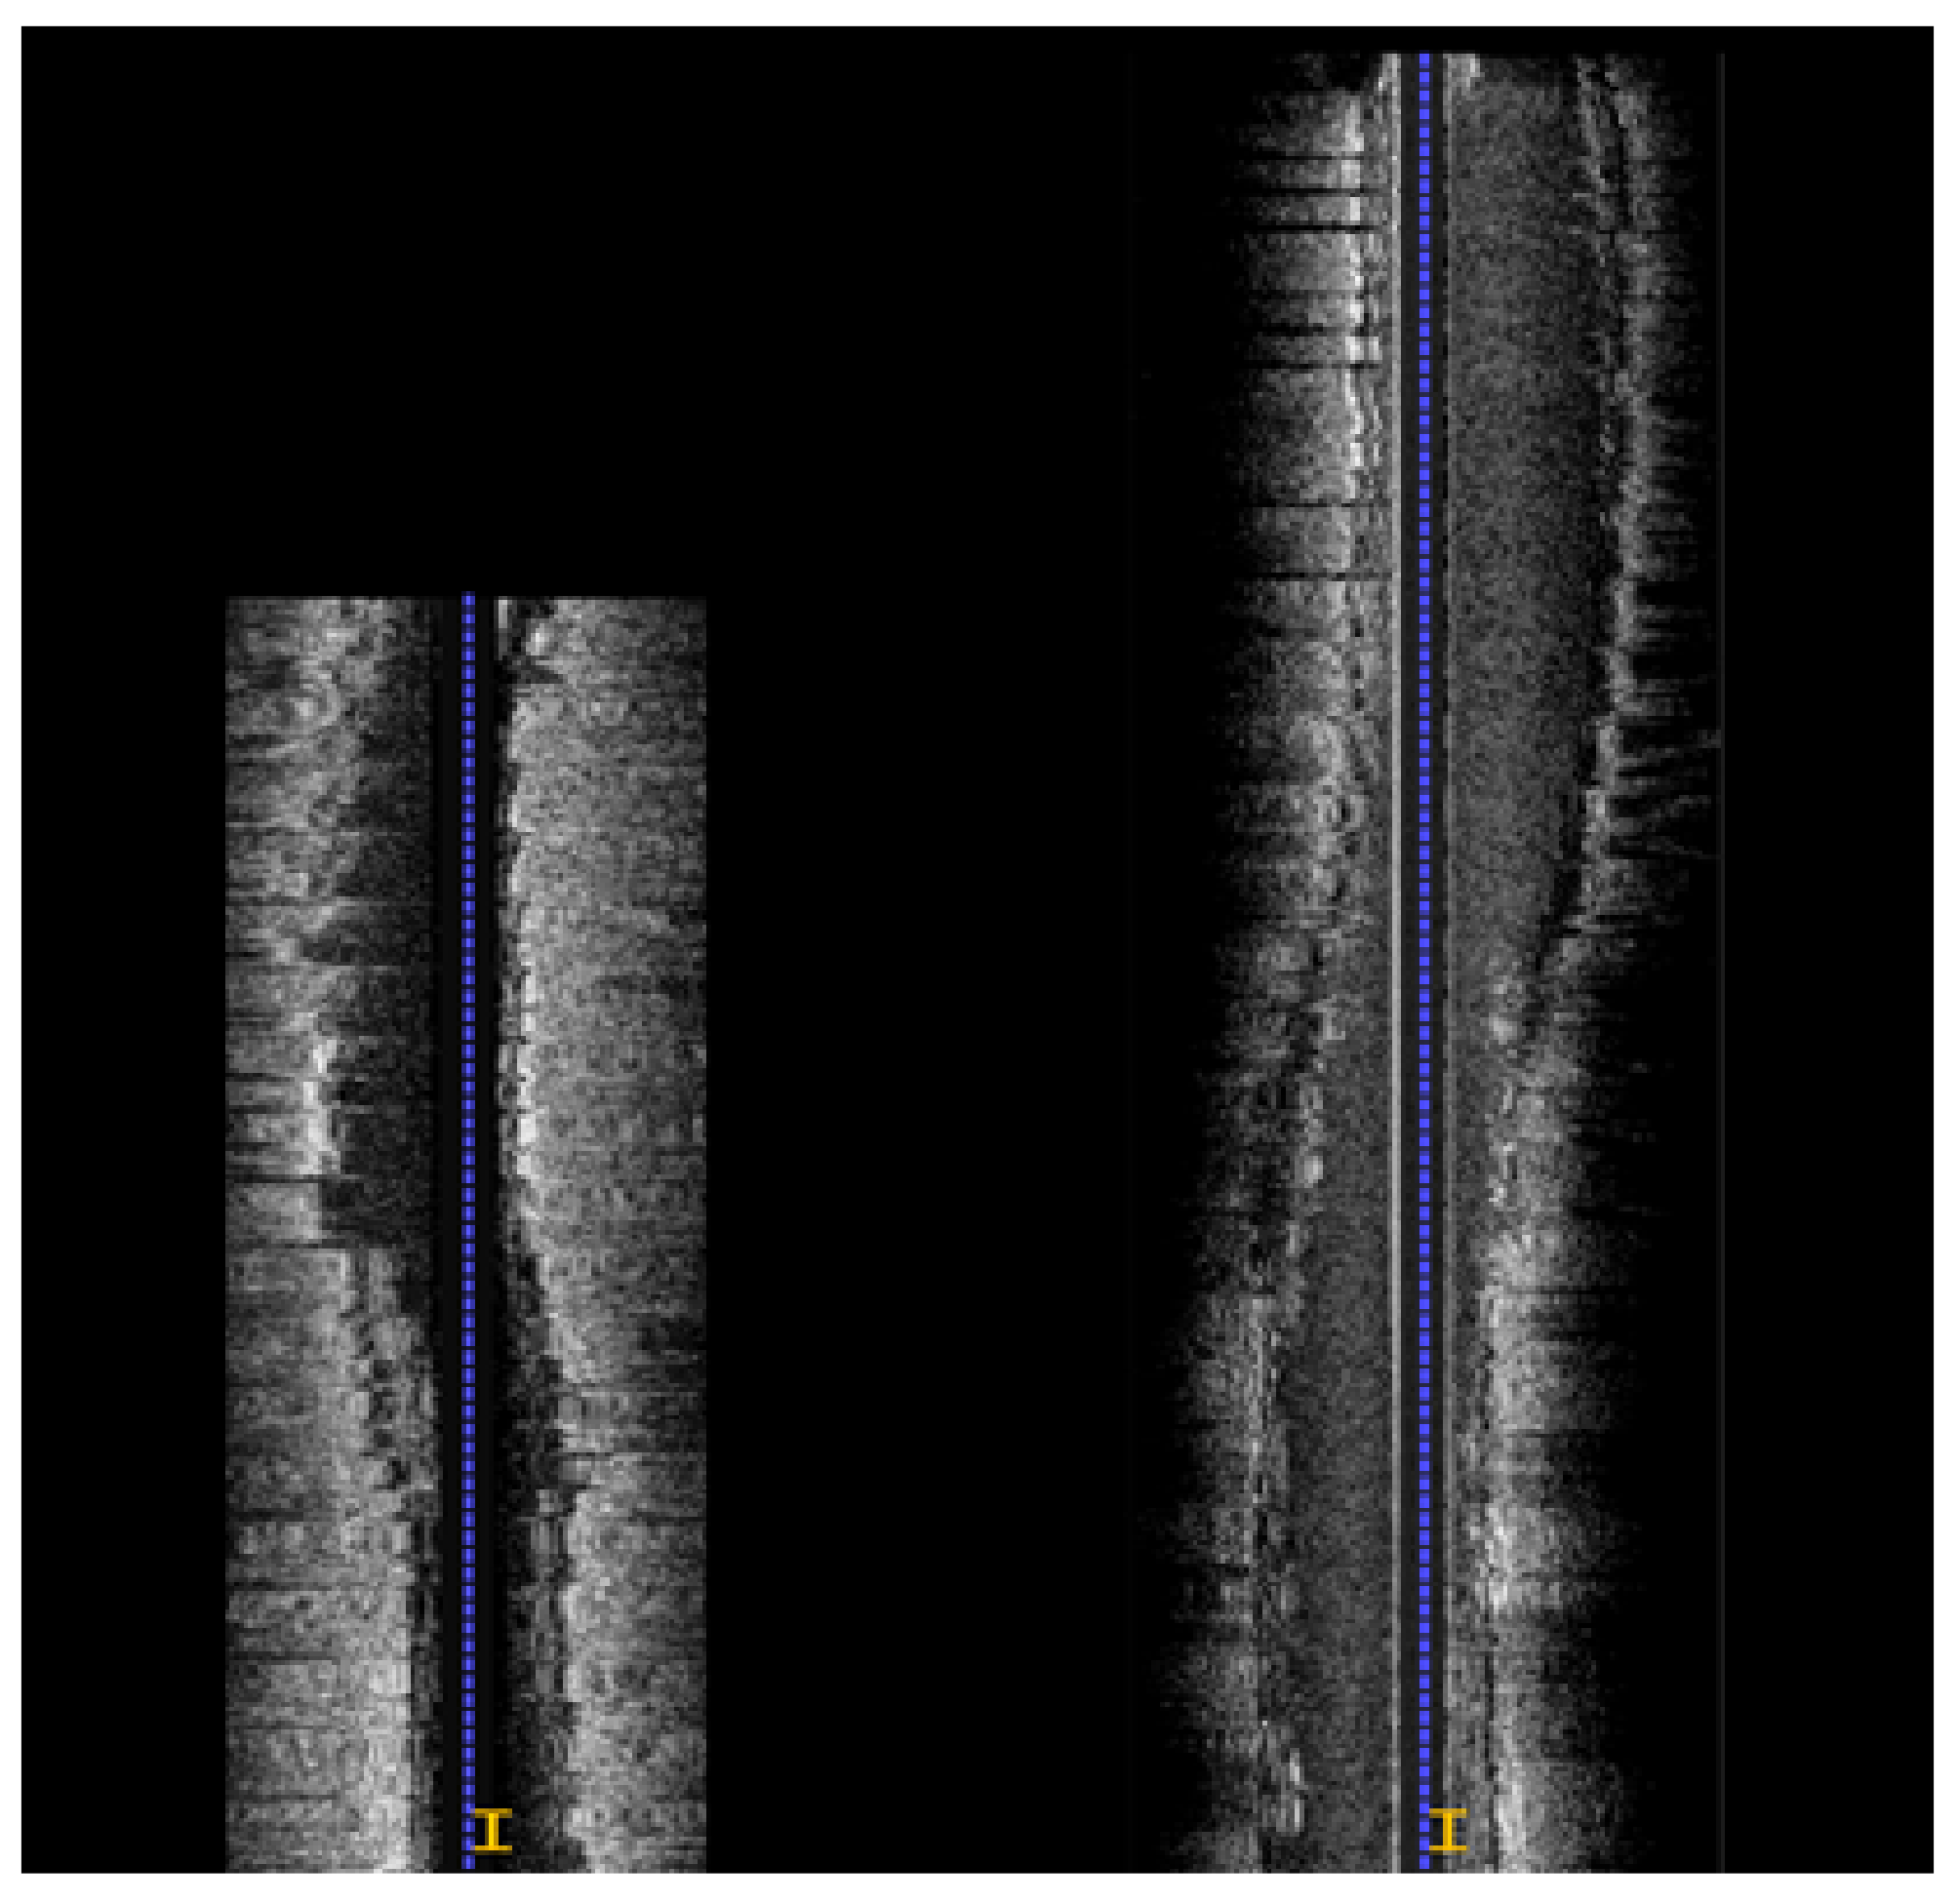
3.2. Longitudinal Registration
3.3. Axial Registration
3.3.1. Mutual Information
3.3.2. Harmony Search Optimizer
4. Results
4.1. Experiments on Synthetic Data
- Amplitude distortion, by adding random zero-mean Gaussian noise to the image.
- Partial overlapping, by discarding a subset of the pullback at its beginning and its ending. The length of the overlap was between 60–80% of the original size, randomly sampled based on the uniform distribution.
- Longitudinal distortion, by randomly repeating an image of the pullbacks to simulate the longitudinal oscillation of the probe. Each image in the pullback had a probability to be repeated, and the times of that repetition was randomly sampled between 1–4 based on the uniform distribution.
- Rigid distortion, by randomly translating and rotating an image to simulate the circumferential movement of the probe. The rotation range was , the translation range is pixels and both are sampled based on the uniform distribution.
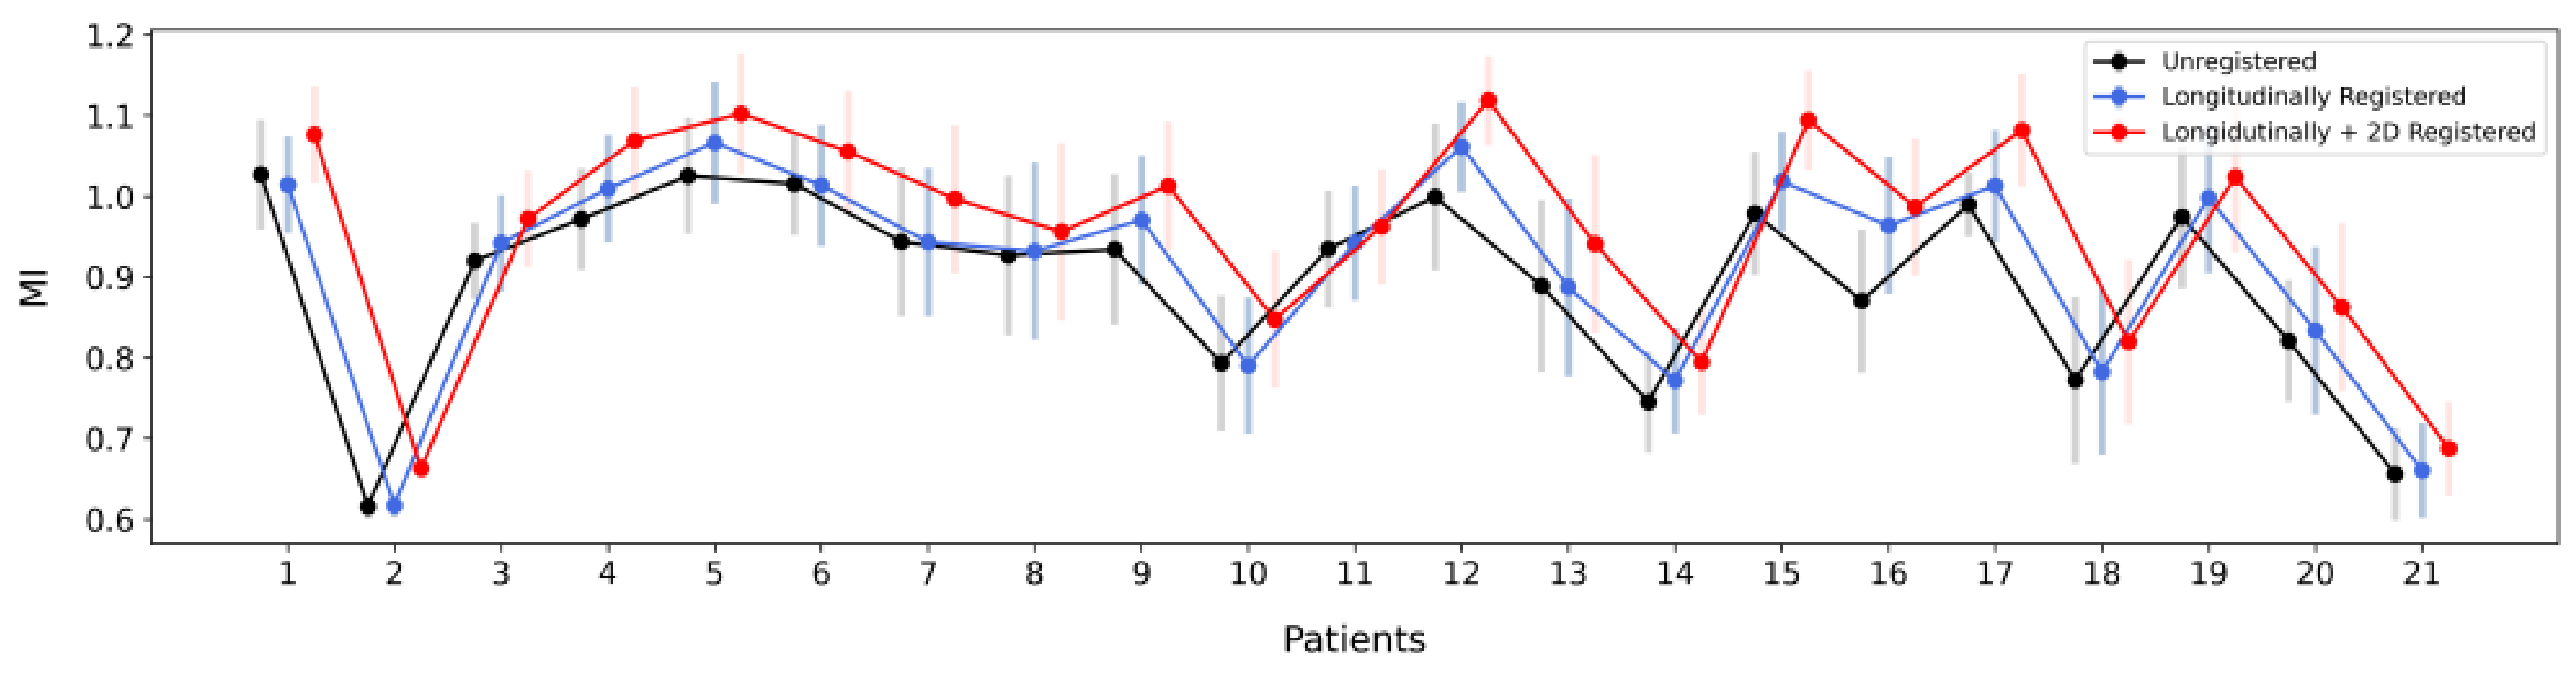
4.2. Experiments on In-Vivo Data
- Mean MI of the corresponding frames in the overlap of the unregistered end-diastolic IVUS pullbacks starting from the first frame of each sequence. (blue)
- Mean MI of the matched frames of the longitudinally registered sequences. (red)
- Mean MI of the 2D (axially) registered frame pairs of the longitudinally registered sequences. (grey)
5. Discussion
Method, Novelty and Results
6. Conclusions
Author Contributions
Funding
Institutional Review Board Statement
Informed Consent Statement
Data Availability Statement
Conflicts of Interest
Abbreviations
| IVUS | Intravascular Ultrasound |
| DTW | Dynamic Time Warping |
| 2D | Two-Dimensional |
| 3D | Three-Dimensional |
| ECG | Electrocardiogram |
| CDF | Cumulative Distribution Function |
| CC | Cross Correlation |
| HS | Harmony Search |
| MI | Mutual Information |
References
- Gatta, C.; Pujol, O.; Leor, O.R.; Ferre, J.M.; Radeva, P. Robust image-based ivus pullbacks gating. In Proceedings of the International Conference on Medical Image Computing and Computer-Assisted Intervention, New York, NY, USA, 6–10 September 2008; Springer: Berlin/Heidelberg, Germany, 2008; pp. 518–525. [Google Scholar]
- Alberti, M.; Balocco, S.; Carrillo, X.; Mauri, J.; Radeva, P. Automatic non-rigid temporal alignment of IVUS sequences. In Proceedings of the International Conference on Medical Image Computing and Computer-Assisted Intervention, Nice, France, 1–5 October 2012; Springer: Berlin/Heidelberg, Germany, 2012; pp. 642–650. [Google Scholar]
- Alberti, M.; Balocco, S.; Carrillo, X.; Mauri, J.; Radeva, P. Automatic non-rigid temporal alignment of intravascular ultrasound sequences: Method and quantitative validation. Ultrasound Med. Biol. 2013, 39, 1698–1712. [Google Scholar] [CrossRef] [PubMed]
- Katouzian, A.; Karamalis, A.; Lisauskas, J.; Eslami, A.; Navab, N. IVUS-histology image registration. In Proceedings of the International Workshop on Biomedical Image Registration, Nashville, TN, USA, 7–8 July 2012; Springer: Berlin/Heidelberg, Germany, 2012; pp. 141–149. [Google Scholar]
- Liu, J.; Wang, Y.; Man, K.; Gao, X. Unsupervised registration of intravascular ultrasound images combined with attention mechanism. J. Phys. 2021, 1873, 012030. [Google Scholar]
- Zhang, L.; Wahle, A.; Chen, Z.; Zhang, L.; Downe, R.W.; Kovarnik, T.; Sonka, M. Simultaneous registration of location and orientation in intravascular ultrasound pullbacks pairs via 3D graph-based optimization. IEEE Trans. Med Imaging 2015, 34, 2550–2561. [Google Scholar] [CrossRef] [PubMed] [Green Version]
- Molony, D.S.; Timmins, L.H.; Rasoul-Arzrumly, E.; Samady, H.; Giddens, D.P. Evaluation of a framework for the co-registration of intravascular ultrasound and optical coherence tomography coronary artery pullbacks. J. Biomech. 2016, 49, 4048–4056. [Google Scholar] [CrossRef] [PubMed]
- Zhang, L.; Downe, R.; Chen, Z.; Sun, S.; Masiarov, T.; Kovarnik, T.; Lopez, J.; Sonka, M.; Wahle, A. Side-branch guided registration of intravascular ultrasound pullbacks in coronary arteries. In Proceedings of the MICCAI Workshop in Computing and Visualization for IntraVascular Imaging and Computer Assisted Stenting (CVII-STENT), Boston, MA, USA, 14–18 September 2014; pp. 44–51. [Google Scholar]
- Balocco, S.; Gatta, C.; Ciompi, F.; Wahle, A.; Radeva, P.; Carlier, S.; Unal, G.; Sanidas, E.; Mauri, J.; Carillo, X.; et al. Standardized evaluation methodology and reference database for evaluating IVUS image segmentation. Comput. Med Imaging Graph. 2014, 38, 70–90. [Google Scholar] [CrossRef] [PubMed] [Green Version]
- Talou, G.D.M.; Blanco, P.J.; Larrabide, I.; Bezerra, C.G.; Lemos, P.A.; Feijóo, R.A. Registration methods for IVUS: Transversal and longitudinal transducer motion compensation. IEEE Trans. Biomed. Eng. 2016, 64, 890–903. [Google Scholar] [CrossRef] [PubMed]
- Bruining, N.; von Birgelen, C.; de Feyter, P.J.; Ligthart, J.; Li, W.; Serruys, P.W.; Roelandt, J.R. ECG-gated versus nongated three-dimensional intracoronary ultrasound analysis: Implications for volumetric measurements. Catheter. Cardiovasc. Diagn. 1998, 43, 254–260. [Google Scholar] [CrossRef]
- O’Malley, S.M.; Granada, J.F.; Carlier, S.; Naghavi, M.; Kakadiaris, I.A. Image-based gating of intravascular ultrasound pullback sequences. IEEE Trans. Inf. Technol. Biomed. 2008, 12, 299–306. [Google Scholar] [CrossRef] [PubMed]
- Perona, P.; Malik, J. Scale-space and edge detection using anisotropic diffusion. IEEE Trans. Pattern Anal. Mach. Intell. 1990, 12, 629–639. [Google Scholar] [CrossRef] [Green Version]
- Gerig, G.; Kubler, O.; Kikinis, R.; Jolesz, F.A. Nonlinear anisotropic filtering of MRI data. IEEE Trans. Med Imaging 1992, 11, 221–232. [Google Scholar] [CrossRef] [PubMed] [Green Version]
- Gatta, C.; Pujol, O.; Leor, O.R.; Ferre, J.M.; Radeva, P. Fast rigid registration of vascular structures in IVUS sequences. IEEE Trans. Inf. Technol. Biomed. 2009, 13, 1006–1011. [Google Scholar] [CrossRef] [PubMed]
- Senin, P. Dynamic time warping algorithm review. Inf. Comput. Sci. Dep. Univ. Hawaii Manoa Honol. USA 2008, 855, 40. [Google Scholar]
- Spanakis, C.; Mathioudakis, E.; Kampanis, N.; Tsiknakis, M.; Marias, K. A new approach in image registration. In Proceedings of the 2016 IEEE International Conference on Imaging Systems and Techniques (IST), Chania, Greece, 4–6 October 2016; pp. 449–453. [Google Scholar]
- Viola, P.; Wells, W.M., III. Alignment by maximization of mutual information. Int. J. Comput. Vis. 1997, 24, 137–154. [Google Scholar] [CrossRef]
- Stratis, P.N.; Karatzas, G.P.; Papadopoulou, E.P.; Zakynthinaki, M.S.; Saridakis, Y.G. Stochastic optimization for an analytical model of saltwater intrusion in coastal aquifers. PLoS ONE 2016, 11, e0162783. [Google Scholar] [CrossRef] [PubMed]
- Zakynthinaki, M.; Barakat, R.; Martínez, C.C.; Molinuevo, J.S. Stochastic optimization for the detection of changes in maternal heart rate kinetics during pregnancy. Comput. Phys. Commun. 2011, 182, 683–691. [Google Scholar] [CrossRef]


| Reference | Error |
|---|---|
| Ours | |
| [2] | |
| [3] | |
| [7] | |
| [10] |
| Reference | (mm) | |
|---|---|---|
| Ours | ||
| [6] | ||
| [7] | - |
| Alignment Error | Rotational Error | Translational Error | ||
|---|---|---|---|---|
| Reference | Distortions 1–3 | Distortions 1–4 | Distortions 1–4 | |
| Ours | (mm) | |||
| [2] | - | - | - | |
| [3] | - | - | - | |
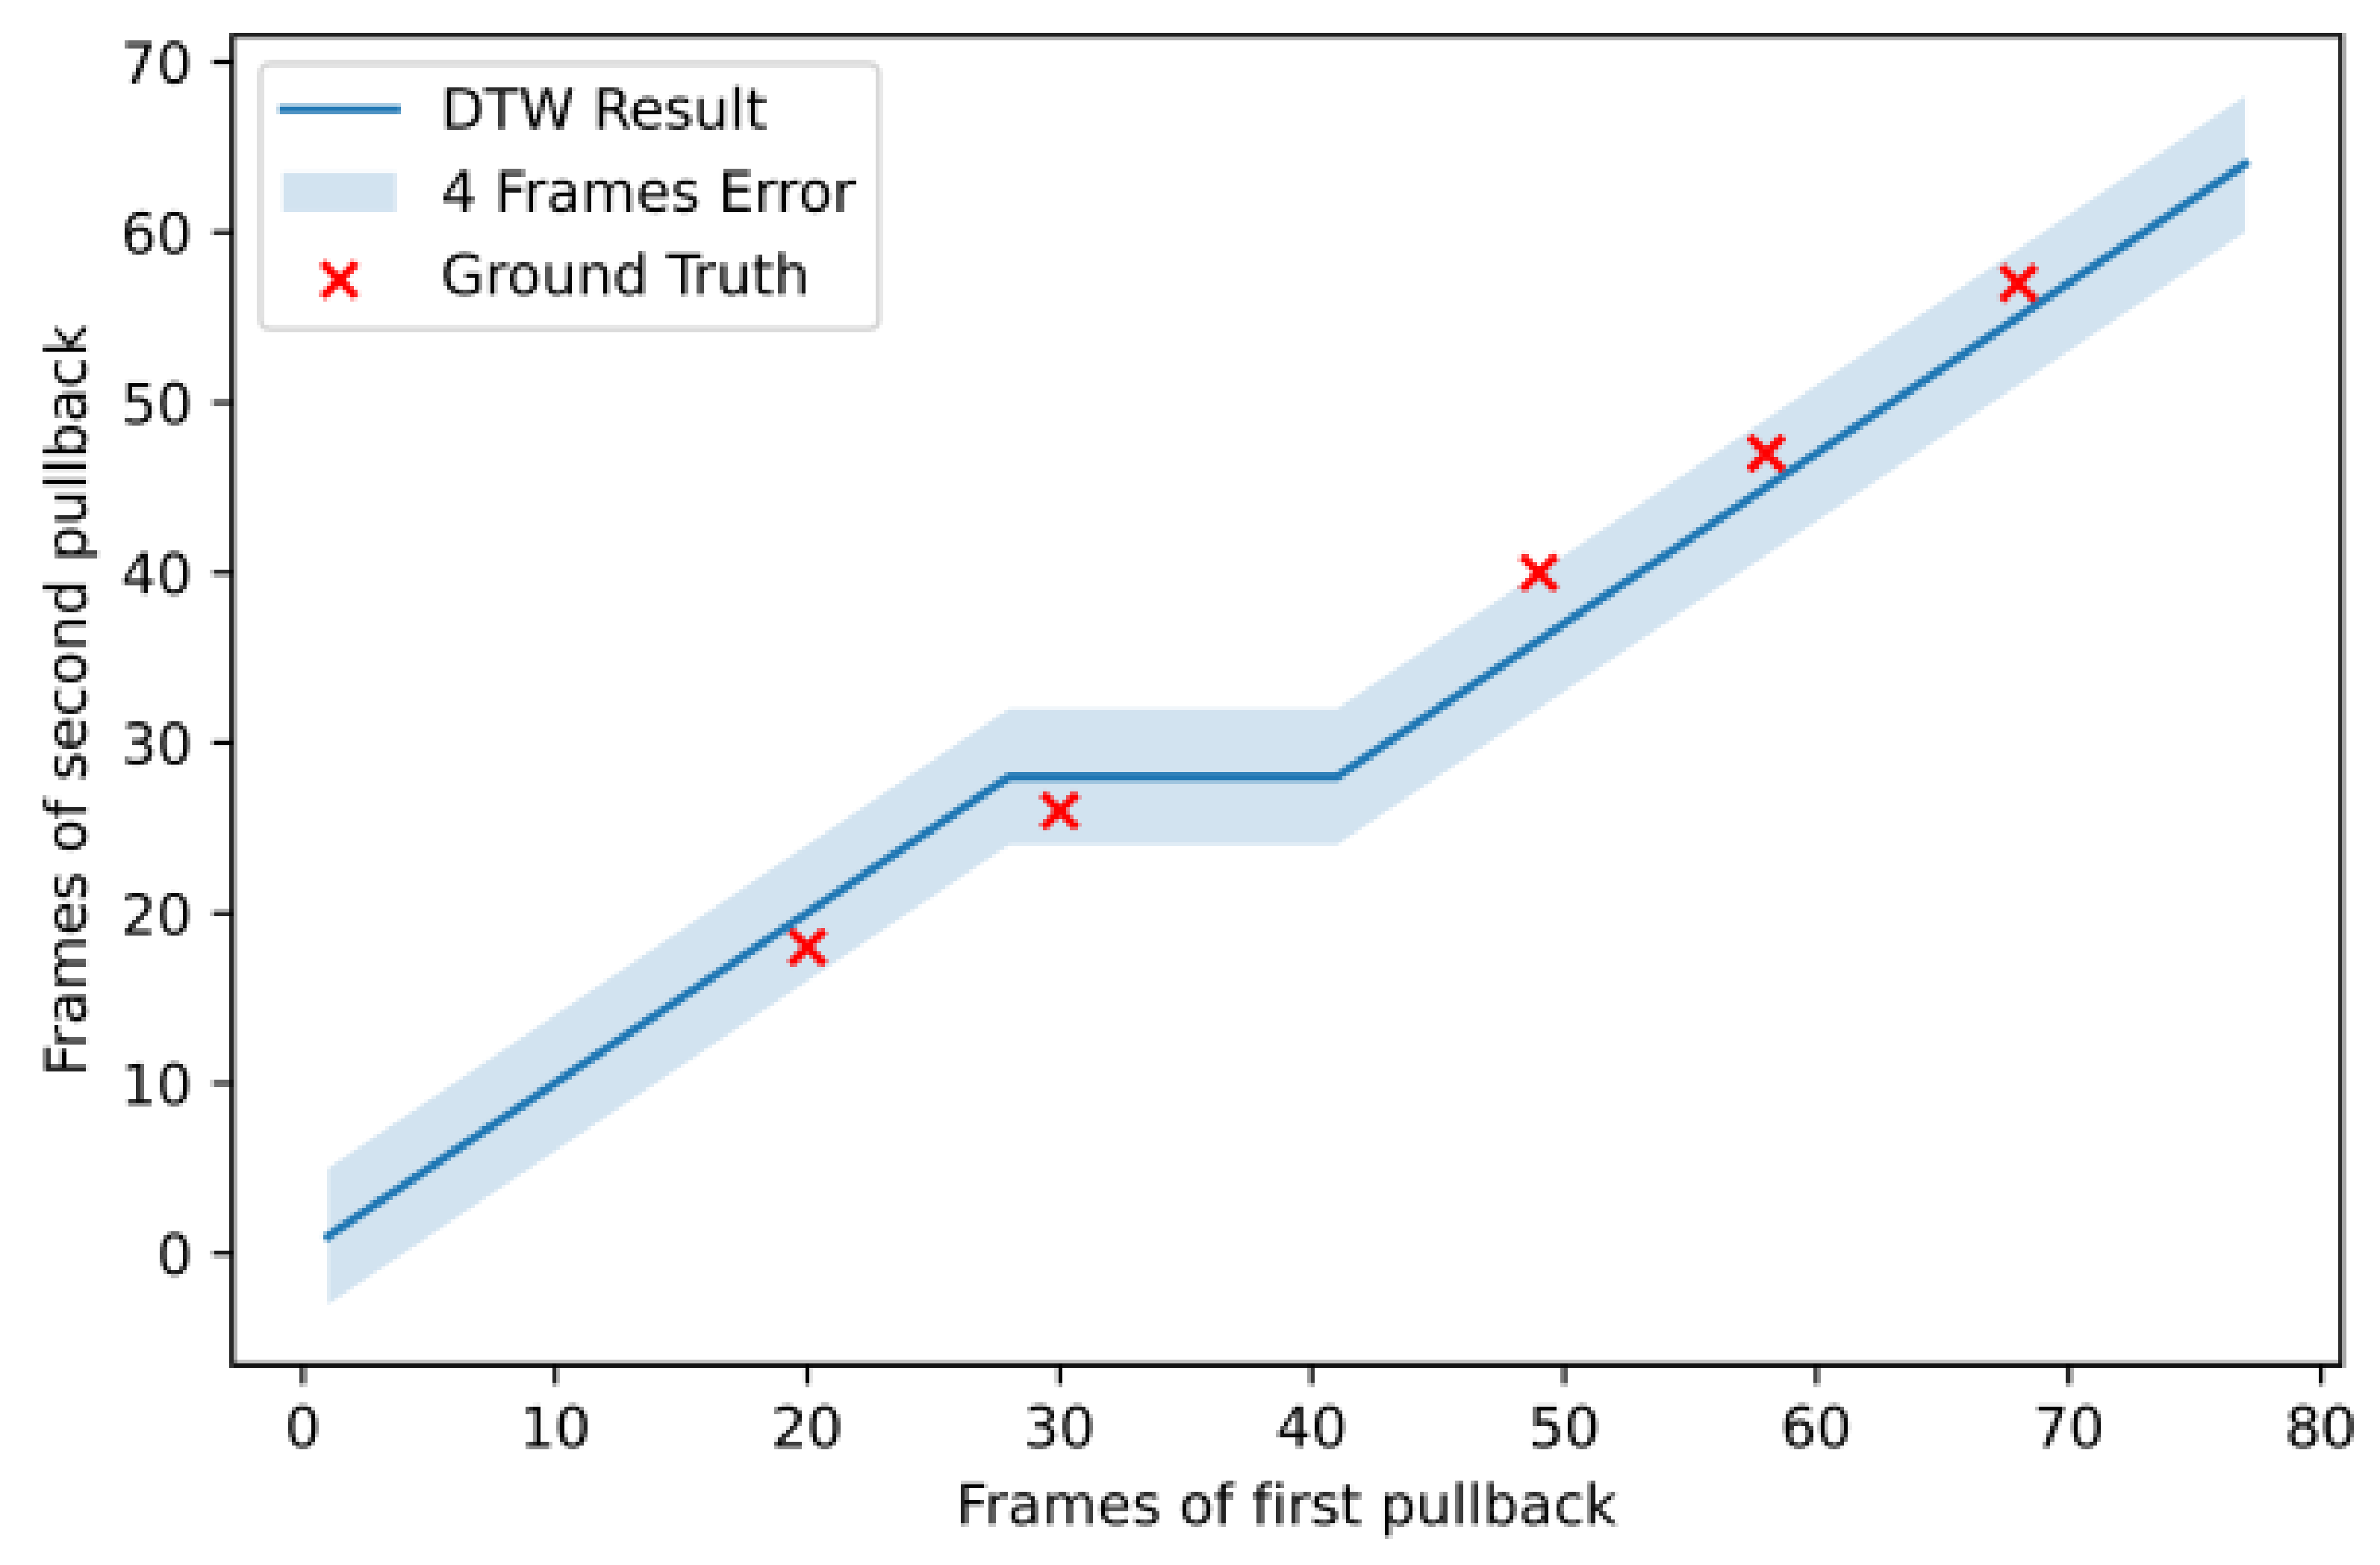
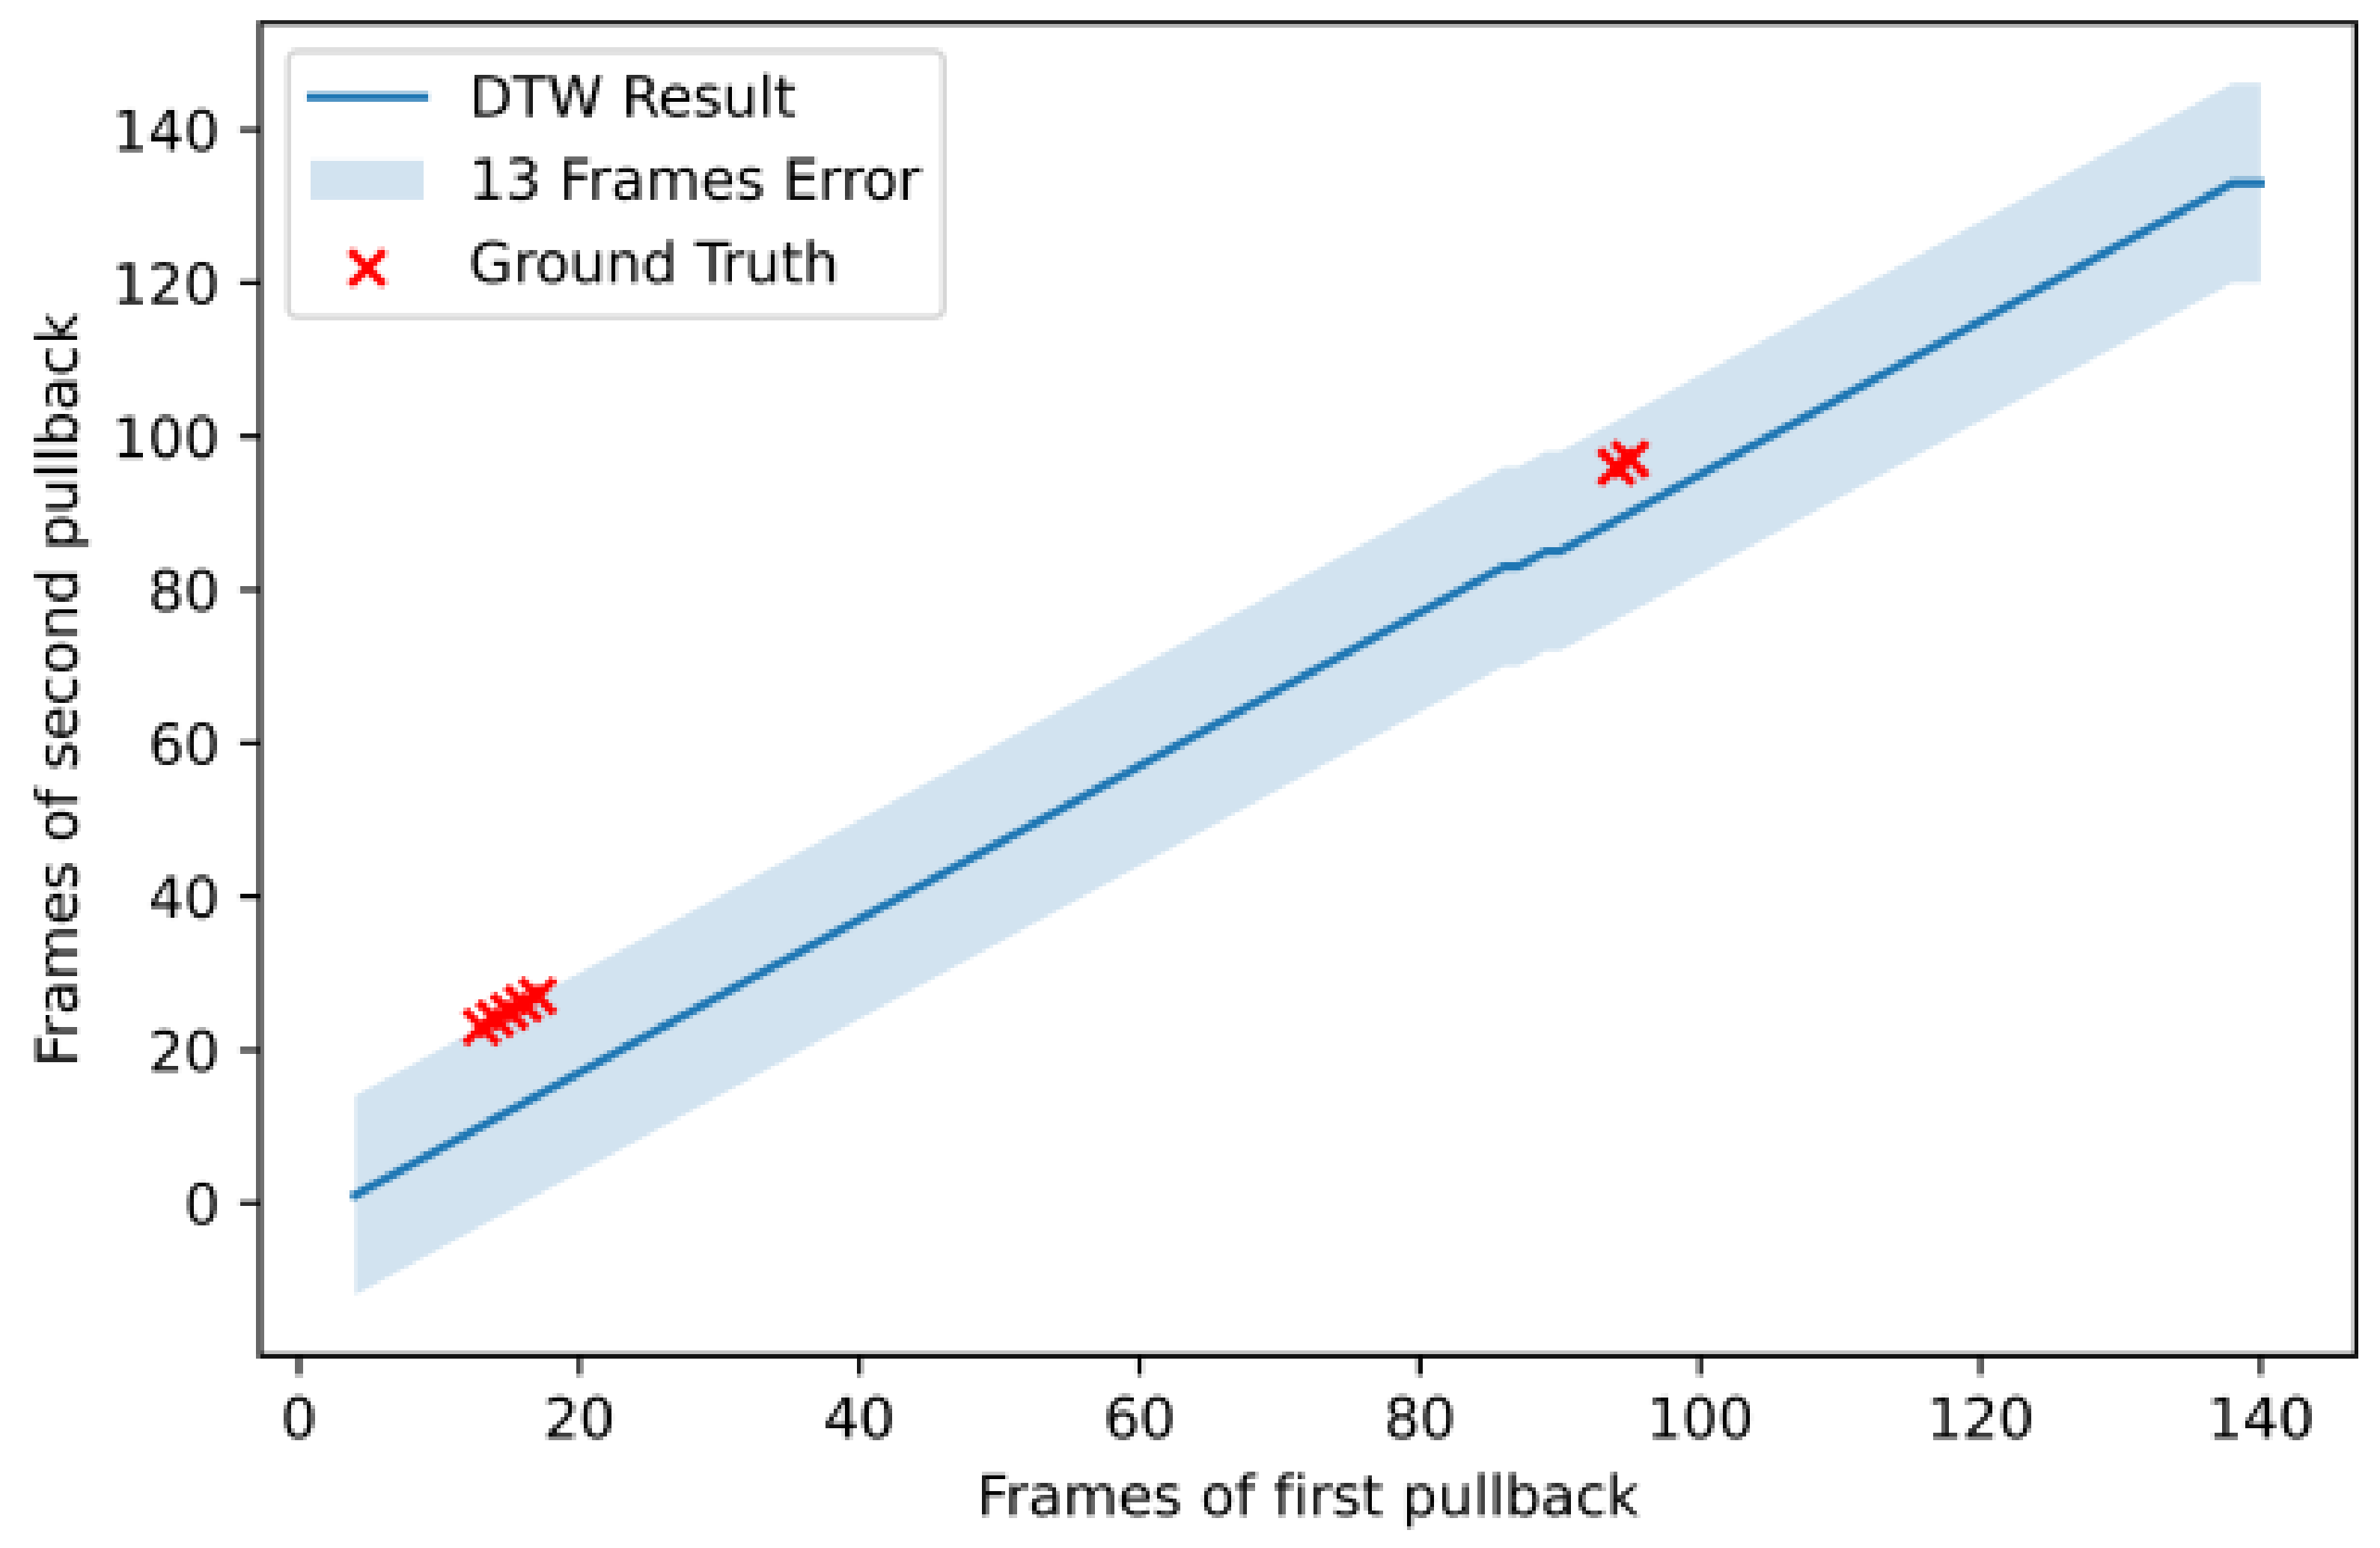
| Patient | # of Frames Pullback 1 | # of Frames Pullback 2 | # of Registered Frames | # of Landmarks | Error (Frames) | Normalized Error |
|---|---|---|---|---|---|---|
| 1 | 155 | 118 | 118 | 5 | 0.063 | |
| 2 | 27 | 36 | 30 | 3 | 0.1 | |
| 3 | 84 | 49 | 59 | 5 | 0.166 | |
| 4 | 133 | 113 | 115 | 6 | 0.009 | |
| 5 | 100 | 82 | 84 | 6 | 0.036 | |
| 6 | 77 | 64 | 77 | 5 | 0.031 | |
| 7 | 149 | 152 | 151 | 5 | 0.017 | |
| 8 | 142 | 154 | 140 | 6 | 0.026 | |
| 9 | 83 | 95 | 91 | 9 | 0.032 | |
| 10 | 107 | 93 | 98 | 7 | 0.016 | |
| 11 | 117 | 122 | 117 | 5 | 0.019 | |
| 12 | 98 | 104 | 100 | 6 | 0.01 | |
| 13 | 169 | 186 | 169 | 7 | 0.047 | |
| 14 | 115 | 111 | 116 | 5 | 0.014 | |
| 15 | 173 | 144 | 146 | 7 | 0.058 | |
| 16 | 161 | 170 | 139 | 6 | 0 | |
| 17 | 212 | 127 | 127 | 5 | 0.079 | |
| 18 | 143 | 133 | 137 | 7 | 0.082 | |
| 19 | 95 | 121 | 95 | 0 | - | - |
| 20 | 67 | 124 | 84 | 5 | 0.014 | |
| 21 | 140 | 108 | 76 | 5 | 0.053 |
| Patient | (mm) | |
|---|---|---|
| 1 | ||
| 2 | ||
| 3 | ||
| 4 | ||
| 5 | ||
| 6 | ||
| 7 | ||
| 8 | ||
| 9 | ||
| 10 | ||
| 11 | ||
| 12 | ||
| 13 | ||
| 14 | ||
| 15 | ||
| 16 | ||
| 17 | ||
| 18 | ||
| 19 | No landmarks | |
| 20 | ||
| 21 | ||
| Ref | Dataset | Task | Ground Truth | Synthetic Data | Morphological Feature Extraction | Stent |
|---|---|---|---|---|---|---|
| Ours | 21 IVUS-IVUS | Longitudinal and Axial Registration | Yes | Yes | No | Yes |
| [2] | 13 IVUS-IVUS | Longitudinal Registration | Yes | Yes | Yes | Yes |
| [3] | 21 IVUS-IVUS | Longitudinal Registration | Yes | Yes | Yes | Yes |
| [4] | 14 IVUS-Histology | Axial Registration | Yes | No | Yes | No |
| [6] | 29 VH IVUS-VH IVUS | Longitudinal and Axial Registration | Yes | No | Yes | No |
| [7] | 12 VH IVUS-OCT | Longitudinal and Axial Registration | Yes | No | Yes | No |
| [8] | 31 IVUS-IVUS | Longitudinal and Axial Registration | No | No | Yes | No |
| [10] | 28 IVUS-IVUS | Longitudinal and Axial Registration | Yes | No | Yes | Yes |
Publisher’s Note: MDPI stays neutral with regard to jurisdictional claims in published maps and institutional affiliations. |
© 2021 by the authors. Licensee MDPI, Basel, Switzerland. This article is an open access article distributed under the terms and conditions of the Creative Commons Attribution (CC BY) license (https://creativecommons.org/licenses/by/4.0/).
Share and Cite
Tsiknakis, N.; Spanakis, C.; Tsompou, P.; Karanasiou, G.; Karanasiou, G.; Sakellarios, A.; Rigas, G.; Kyriakidis, S.; Papafaklis, M.; Nikopoulos, S.; et al. IVUS Longitudinal and Axial Registration for Atherosclerosis Progression Evaluation. Diagnostics 2021, 11, 1513. https://doi.org/10.3390/diagnostics11081513
Tsiknakis N, Spanakis C, Tsompou P, Karanasiou G, Karanasiou G, Sakellarios A, Rigas G, Kyriakidis S, Papafaklis M, Nikopoulos S, et al. IVUS Longitudinal and Axial Registration for Atherosclerosis Progression Evaluation. Diagnostics. 2021; 11(8):1513. https://doi.org/10.3390/diagnostics11081513
Chicago/Turabian StyleTsiknakis, Nikos, Constantinos Spanakis, Panagiota Tsompou, Georgia Karanasiou, Gianna Karanasiou, Antonis Sakellarios, George Rigas, Savvas Kyriakidis, Michael Papafaklis, Sotirios Nikopoulos, and et al. 2021. "IVUS Longitudinal and Axial Registration for Atherosclerosis Progression Evaluation" Diagnostics 11, no. 8: 1513. https://doi.org/10.3390/diagnostics11081513