
Lung Radiomics Features Selection for COPD Stage Classification Based on Auto-Metric Graph Neural Network

 ,
,  ,
,
Abstract
:1. Introduction
2. Materials and Methods
2.1. Materials
2.2. Methods
2.2.1. Lung Parenchyma Segmentation and Radiomics Feature Extraction
2.2.2. Radiomics Feature Combination
2.2.3. COPD Stage Classification Based on AMGNN
3. Experiments and Results
3.1. Experiments
3.2. Results
3.2.1. COPD Stage Classification Based on Different ML Classifiers
3.2.2. COPD Stage Classification Based on the AMGNN Classifier
4. Discussion
5. Conclusions
6. Patents
Supplementary Materials
Author Contributions
Funding
Institutional Review Board Statement
Informed Consent Statement
Data Availability Statement
Acknowledgments
Conflicts of Interest
References
- Singh, D.; Agusti, A.; Anzueto, A.; Barnes, P.J.; Bourbeau, J.; Celli, B.R.; Criner, G.J.; Frith, P.; Halpin, D.M.G.; Han, M.; et al. Global strategy for the diagnosis, management, and prevention of chronic obstructive lung disease: The GOLD science committee report 2019. Eur. Respir. J. 2019, 53, 1900164. [Google Scholar] [CrossRef] [PubMed]
- Washko, G.R.; Coxson, H.O.; Donnell, D.E.O.; Aaron, S.D. CT imaging of chronic obstructive pulmonary disease: Insights, disappointments, and promise. Lancet Respir. Med. 2017, 5, 903–908. [Google Scholar] [CrossRef]
- Yang, Y.; Li, W.; Guo, Y.; Liu, Y.; Li, Q.; Yang, K.; Wang, S.; Zeng, N.; Duan, W.; Chen, Z.; et al. Early COPD Risk Decision for Adults Aged From 40 to 79 Years Based on Lung Radiomics Features. Front. Med. 2022, 9, 845286. [Google Scholar] [CrossRef] [PubMed]
- Fortis, S.; Comellas, A.; Make, B.J.; Hersh, C.P.; Bodduluri, S.; Georgopoulos, D.; Kim, V.; Criner, G.J.; Dransfield, M.T.; Bhatt, S.P.; et al. Combined forced expiratory volume in 1 second and forced vital capacity bronchodilator response, exacerbations, and mortality in chronic obstructive pulmonary disease. Ann. Am. Thorac. Soc. 2019, 16, 826–835. [Google Scholar] [CrossRef]
- Jones, P.W. Health status measurement in chronic obstructive pulmonary disease. Thorax 2001, 56, 880–887. [Google Scholar] [CrossRef]
- Brown, C.D.; Benditt, J.O.; Sciurba, F.C.; Lee, S.M.; Criner, G.J.; Mosenifar, Z.; Shade, D.M.; Slivka, W.A.; Wise, R.A.; National emphysema Treatment Trial Research Group. Exercise Testing in Severe Emphysema: Association with Quality of Life and Lung Function. J. Chronic Obstr. Pulm. Dis. 2008, 5, 117–124. [Google Scholar] [CrossRef]
- Flesch, J.D.; Dine, C.J. Lung volumes: Measurement, clinical use, and coding. Chest 2012, 142, 506–510. [Google Scholar] [CrossRef]
- Fan, L.; Xia, Y.; Guan, Y.; Zhang, T.F.; Liu, S.Y. Characteristic features of pulmonary function test, CT volume analysis and MR perfusion imaging in COPD patients with different HRCT phenotypes. Clin. Respir. J. 2014, 8, 45–54. [Google Scholar] [CrossRef]
- Lynch, D.A.; Austin, J.H.; Hogg, J.C.; Grenier, P.A.; Kauczor, H.U.; Bankier, A.A.; Barr, R.G.; Colby, T.V.; Galvin, J.R.; Gevenois, P.A.; et al. CT-Definable Subtypes of Chronic Obstructive Pulmonary Disease: A Statement of the Fleischner Society. Radiology 2015, 277, 192–205. [Google Scholar] [CrossRef]
- Lynch, D.A. Progress in Imaging COPD, 2004–2014. Chronic Obstr. Pulm. Dis. J. COPD Found. 2014, 1, 73. [Google Scholar] [CrossRef] [Green Version]
- Castaldi, P.J.; San José Estépar, R.; Mendoza, C.S.; Hersh, C.P.; Laird, N.; Crapo, J.D.; Lynch, D.A.; Silverman, E.K.; Washko, G.R. Distinct quantitative computed tomography emphysema patterns are associated with physiology and function in smokers. Am. J. Respir. Crit. Care Med. 2013, 188, 1083–1090. [Google Scholar] [CrossRef]
- Barbosa, E.M., Jr.; Song, G.; Tustison, N.; Kreider, M.; Gee, J.C.; Gefter, W.B.; Torigian, D.A. Computational analysis of thoracic multidetector row HRCT for segmentation and quantification of small airway air trapping and emphysema in obstructive pulmonary disease. Acad. Radiol. 2011, 18, 1258–1269. [Google Scholar] [CrossRef]
- O’Donnell, R.A.; Peebles, C.; Ward, J.A.; Daraker, A.; Angco, G.; Broberg, P.; Pierrou, S.; Lund, J.; Holgate, S.T.; Davies, D.E.; et al. Relationship between peripheral airway dysfunction, airway obstruction, and neutrophilic inflammation in COPD. Thorax 2004, 59, 837–842. [Google Scholar] [CrossRef]
- Pompe, E.; Galbán, C.J.; Ross, B.D.; Koenderman, L.; Ten Hacken, N.H.; Postma, D.S.; van den Berge, M.; de Jong, P.A.; Lammers, J.J.; Mohamed Hoesein, F.A. Parametric response mapping on chest computed tomography associates with clinical and functional parameters in chronic obstructive pulmonary disease. Respir. Med. 2017, 123, 48–55. [Google Scholar] [CrossRef]
- Frix, A.-N.; Cousin, F.; Refaee, T.; Bottari, F.; Vaidyanathan, A.; Desir, C.; Vos, W.; Walsh, S.; Occhipinti, M.; Lovinfosse, P.; et al. Radiomics in lung diseases imaging: State-of-the-art for clinicians. J. Pers. Med. 2021, 11, 602. [Google Scholar] [CrossRef]
- Refaee, T.; Wu, G.; Ibrahim, A.; Halilaj, I.; Leijenaar, R.T.H.; Rogers, W.; Gietema, H.A.; Hendriks, L.E.L.; Lambin, P.; Woodruff, H.C. The Emerging Role of Radiomics in COPD and Lung Cancer. Respiration 2020, 99, 99–107. [Google Scholar] [CrossRef]
- Yang, K.; Yang, Y.; Kang, Y.; Liang, Z.; Wang, F.; Li, Q.; Xu, J.; Tang, G.; Chen, R. The value of radiomic features in chronic obstructive pulmonary disease assessment: A prospective study. Clin. Radiol. 2022, 77, e466–e472. [Google Scholar] [CrossRef]
- Eapen, M.S.; Myers, S.; Walters, E.H.; Sohal, S.S. Airway inflammation in chronic pulmonary disease (COPD): A ture paradox. Expert Rev. Reapiratory Med. 2017, 11, 827–839. [Google Scholar] [CrossRef]
- Wright, J.L.; Churg, A. Advances in the pathology of COPD. Histopathology 2006, 49, 1–9. [Google Scholar] [CrossRef]
- Peinado, V.I.; Pizarro, S.; Barbera, J.A. Pulmonary vascular involvement in COPD. Chest 2008, 134, 808–814. [Google Scholar] [CrossRef]
- Cho, Y.H.; Seo, J.B.; Lee, S.M.; Kim, N.; Yun, J.; Hwang, J.E.; Lee, J.S.; Oh, Y.M.; Do Lee, S.; Loh, L.C.; et al. Radiomics approach for survival prediction in chronic obstructive pulmonary disease. Eur. Radiol. 2021, 31, 7316–7324. [Google Scholar] [CrossRef]
- Yun, J.; Cho, Y.H.; Lee, S.M.; Hwang, J.; Lee, J.S.; Oh, Y.M.; Lee, S.D.; Loh, L.C.; Ong, C.K.; Seo, J.B.; et al. Deep radiomics-based survival prediction in patients with chronic obstructive pulmonary disease. Sci. Rep. 2021, 11, 15144. [Google Scholar] [CrossRef]
- Occhipinti, M.; Paoletti, M.; Bartholmai, B.J.; Rajagopalan, S.; Karwoski, R.A.; Nardi, C.; Inchingolo, R.; Larici, A.R.; Camiciottoli, G.; Lavorini, F.; et al. Spirometric assessment of emphysema presence and severity as measured by quantitative CT and CT-based radiomics in COPD. Respir. Res. 2019, 20, 1–11. [Google Scholar] [CrossRef]
- Liang, C.; Xu, J.; Wang, F.; Chen, H.; Tang, J.; Chen, D.; Li, Q.; Jian, W.; Tang, G.; Zheng, J.; et al. Development of a radiomics model for predicting COPD exacerbations based on complementary visual information. Am. Thorac. Soc. 2021, 203, A2296. [Google Scholar]
- Yang, Y.; Li, W.; Guo, Y.; Zeng, N.; Wang, S.; Chen, Z.; Liu, Y.; Chen, H.; Duan, W.; Li, X.; et al. Lung radiomics features for characterizing and classifying COPD stage based on feature combination strategy and multi-layer perceptron classifier. Math. Biosci. Eng. 2022, 19, 7826–7855. [Google Scholar] [CrossRef]
- Li, Z.; Liu, L.; Zhang, Z.; Yang, X.; Li, X.; Gao, Y.; Huang, K. A Novel CT-Based Radiomics Features Analysis for Identification and Severity Staging of COPD. Acad. Radiol. 2022, 29, 663–673. [Google Scholar] [CrossRef]
- Makimoto, K.; Au, R.; Moslemi, A.; Hogg, J.C.; Bourbeau, J.; Tan, W.C.; Kirby, M. Comparison of Feature Selection Methods and Machine Learning Classifiers for Predicting Chronic Obstructive Pulmonary Disease Using Texture-Based CT Lung Radiomic Features. Acad. Radiol. 2022, 1–11. [Google Scholar] [CrossRef]
- Au, R.C.; Tan, W.C.; Bourbeau, J.; Hogg, J.C.; Kirby, M. Radiomics Analysis to Predict Presence of Chronic Obstructive Pulmonary Disease and Symptoms Using Machine Learning. TP121 COPD: From Cells to The Clinic. Am. Thorac. Soc. 2021, 203, A4568. [Google Scholar]
- Yang, Y.; Li, W.; Kang, Y.; Guo, Y.; Yang, K.; Li, Q.; Liu, Y.; Yang, C.; Chen, R.; Chen, H.; et al. A novel lung radiomics feature for characterizing resting heart rate and COPD stage evolution based on radiomics feature combination strategy. Math. Biosci. Eng. 2022, 19, 4145–4165. [Google Scholar] [CrossRef]
- Gori, M.; Monfardini, G.; Scarselli, F. A new model for learning in graph domains. In Proceedings of the 2005 IEEE International Joint Conference on Neural Networks, Montreal, QC, Canada, 31 July–4 August 2005; pp. 729–734. [Google Scholar]
- Kazi, A.; Shekarforoush, S.; Arvind Krishna, S.; Burwinkel, H.; Vivar, G.; Kortüm, K.; Ahmadi, S.; Albarqouni, S.; Navab, N. InceptionGCN: Receptive field aware graph convolutional network for disease prediction. In Proceedings of the International Conference on Information Processing in Medical Imaging, Hong Kong, China, 2–6 June 2019; pp. 73–85. [Google Scholar]
- Song, X.; Mao, M.; Qian, X. Auto-Metric Graph Neural Network Based on a Meta-Learning Strategy for the Diagnosis of Alzheimer’s Disease. IEEE J. Biomed. Health Inform. 2021, 25, 3141–3152. [Google Scholar] [CrossRef]
- McCombe, N.; Bamrah, J.; Sanchez-Bornot, J.M.; Finn, D.P.; McClean, P.L.; Wong-Lin, K.; Alzheimer’s Disease Neuroimaging Initiative (ADNI). Alzheimer’s Disease Classification Using Cluster-based Labelling for Graph Neural Network on Tau PET Imaging and Heterogeneous Data. medRxiv 2022, 3, 22271873. [Google Scholar]
- Xu, C.; Qi, S.; Feng, J.; Xia, S.; Kang, Y.; Yao, Y.; Qian, W. DCT-MIL: Deep CNN transferred multiple instance learning for COPD identification using CT images. Phys. Med. Biol. 2020, 65, 145011. [Google Scholar] [CrossRef] [PubMed]
- Sun, J.; Liao, X.; Yan, Y.; Zhang, X.; Sun, J.; Tan, W.; Liu, B.; Wu, J.; Guo, Q.; Gao, S.; et al. Detection and staging of chronic obstructive pulmonary disease using a computed tomography–based weakly supervised deep learning approach. Eur. Radiol. 2022, 32, 1–11. [Google Scholar]
- Zhou, Y.; Bruijnzeel, P.; Mccrae, C.; Zheng, J.; Nihlen, U.; Zhou, R.; Van Geest, M.; Nilsson, A.; Hadzovic, S.; Huhn, M.; et al. Study on risk factors and phenotypes of acute exacerbations of chronic obstructive pulmonary disease in Guangzhou, China-design and baseline characteristics. J. Thorac. Dis. 2015, 7, 720–733. [Google Scholar]
- Hofmanninger, J.; Prayer, F.; Pan, J.; Rohrich, S.; Prosch, H.; Langs, G. Automatic lung segmentation in routine imaging is a data diversity problem, not a methodology problem. Eur. Radiol. Exp. 2020, 4, 1–13. [Google Scholar] [CrossRef]
- Yang, Y.; Li, Q.; Guo, Y.; Liu, Y.; Li, X.; Guo, J.; Li, W.; Cheng, L.; Chen, H.; Kang, Y. Lung parenchyma parameters measure of rats from pulmonary window computed tomography images based on ResU-Net model for medical respiratory researches. Math. Biosci. Eng. 2021, 18, 4193–4211. [Google Scholar] [CrossRef]
- Yang, Y.; Guo, Y.; Guo, J.; Gao, Y.; Kang, Y. A method of abstracting single pulmonary lobe from computed tomography pulmonary images for locating COPD. In Proceedings of the Fourth International Conference on Biological Information and Biomedical Engineering, Chengdu, China, 21–23 July 2020; pp. 1–6. [Google Scholar]
- Van Griethuysen, J.J.M.; Fedorov, A.; Parmar, C.; Hosny, A.; Aucoin, N.; Narayan, V.; Beets-Tan RG, H.; Fillon-Robin, J.C.; Pieper, S.; Aerts, H.J.W.L. Computational Radiomics System to Decode the Radiographic Phenotype. Cancer Res. 2017, 77, e104–e107. [Google Scholar] [CrossRef]
- Chen, S.; Ma, K.; Zheng, Y. Med3d: Transfer learning for 3d medical image analysis. arXiv 2019, arXiv:1904.00625. [Google Scholar]
- Jakkula, V. Tutorial on Support Vector Machine (svm); School of EECS, Washington State University: Pullman, WA, USA, 2006; Volume 37, p. 3. [Google Scholar]
- Wan, S.; Liang, Y.; Zhang, Y.; Guizani, M. Deep multi-layer perceptron classifier for behavior analysis to estimate Parkinsons disease severity using smartphones. IEEE Access 2018, 6, 36825–36833. [Google Scholar] [CrossRef]
- Qi, Y. Random Forest for bioinformatics. In Ensemble Machine Learning; Springer: Boston, MA, USA, 2012; pp. 307–323. [Google Scholar]
- LaValley, M.P. Logistic regression. Circulation 2008, 117, 2395–2399. [Google Scholar] [CrossRef]
- Ayyadevara, V.K. Gradient boosting machine. In Pro Machine Learning Algorithms; Apress: Berkeley, CA, USA, 2018; pp. 117–134. [Google Scholar]
- Balakrishnama, S.; Ganapathiraju, A. Linear discriminant analysis-a brief tutorial. Inst. Signal Inf. Process. 1998, 18, 1–8. [Google Scholar]
- Sun, Q.; Liu, Y.; Chua, T.S.; Schiele, B. Meta-transfer learning for few-shot learning. In Proceedings of the IEEE/CVF Conference on Computer Vision and Pattern Recognition, Long Beach, CA, USA, 15–20 June 2019; pp. 403–412. [Google Scholar]
- Spina, G.; Casale, P.; Albert, P.S.; Alison, J.; Garcia-Aymerich, J.; Clarenbach, C.F.; Costello, R.W.; Hernandes, N.A.; Leuppi, J.D.; Mesquita, R.; et al. Nighttime features derived from topic models for classification of patients with COPD. Comput. Biol. Med. 2021, 132, 104322. [Google Scholar] [CrossRef]
- Bairagi, V.K.; Kanwade, A.B. Classification of Chronic Obstructive Pulmonary Disease (COPD) Using Electromyography. Sādhanā 2020, 45, 1–17. [Google Scholar] [CrossRef]
- Meng, Z.; Zhao, F.; Liang, M. SS-MLP: A Novel Spectral-Spatial MLP Architecture for Hyperspectral Image Classification. Remote Sens. 2021, 13, 4060. [Google Scholar] [CrossRef]
- Hospedales, T.M.; Antoniou, A.; Micaelli, P.; Strokey, A. Meta-learning in neural networks: A survey. IEEE Trans. Pattern Anal. Mach. Intell. 2021, 44, 5149–5169. [Google Scholar] [CrossRef]


| ML Classifier | ML Classifier Model Definition in Python 3.6 |
|---|---|
| SVM | SVM sklearn.svm.SVC(kernel=‘rbf’,probability=True) |
| MLP | sklearn.neural_network. MLPClassifier (hidden_layer_sizes=(400, 100), alpha=0.01, max_iter=10,000) |
| RF | sklearn.ensemble.RandomForestClassifier(n_estimators=200) |
| LR | sklearn.linear_model.logisticRegressionCV(max_iter=100,000, solver=“liblinear”) |
| GB | sklearn.ensemble.GradientBoostingClassifier() |
| LDA | sklearn.discriminant_analysis.() |
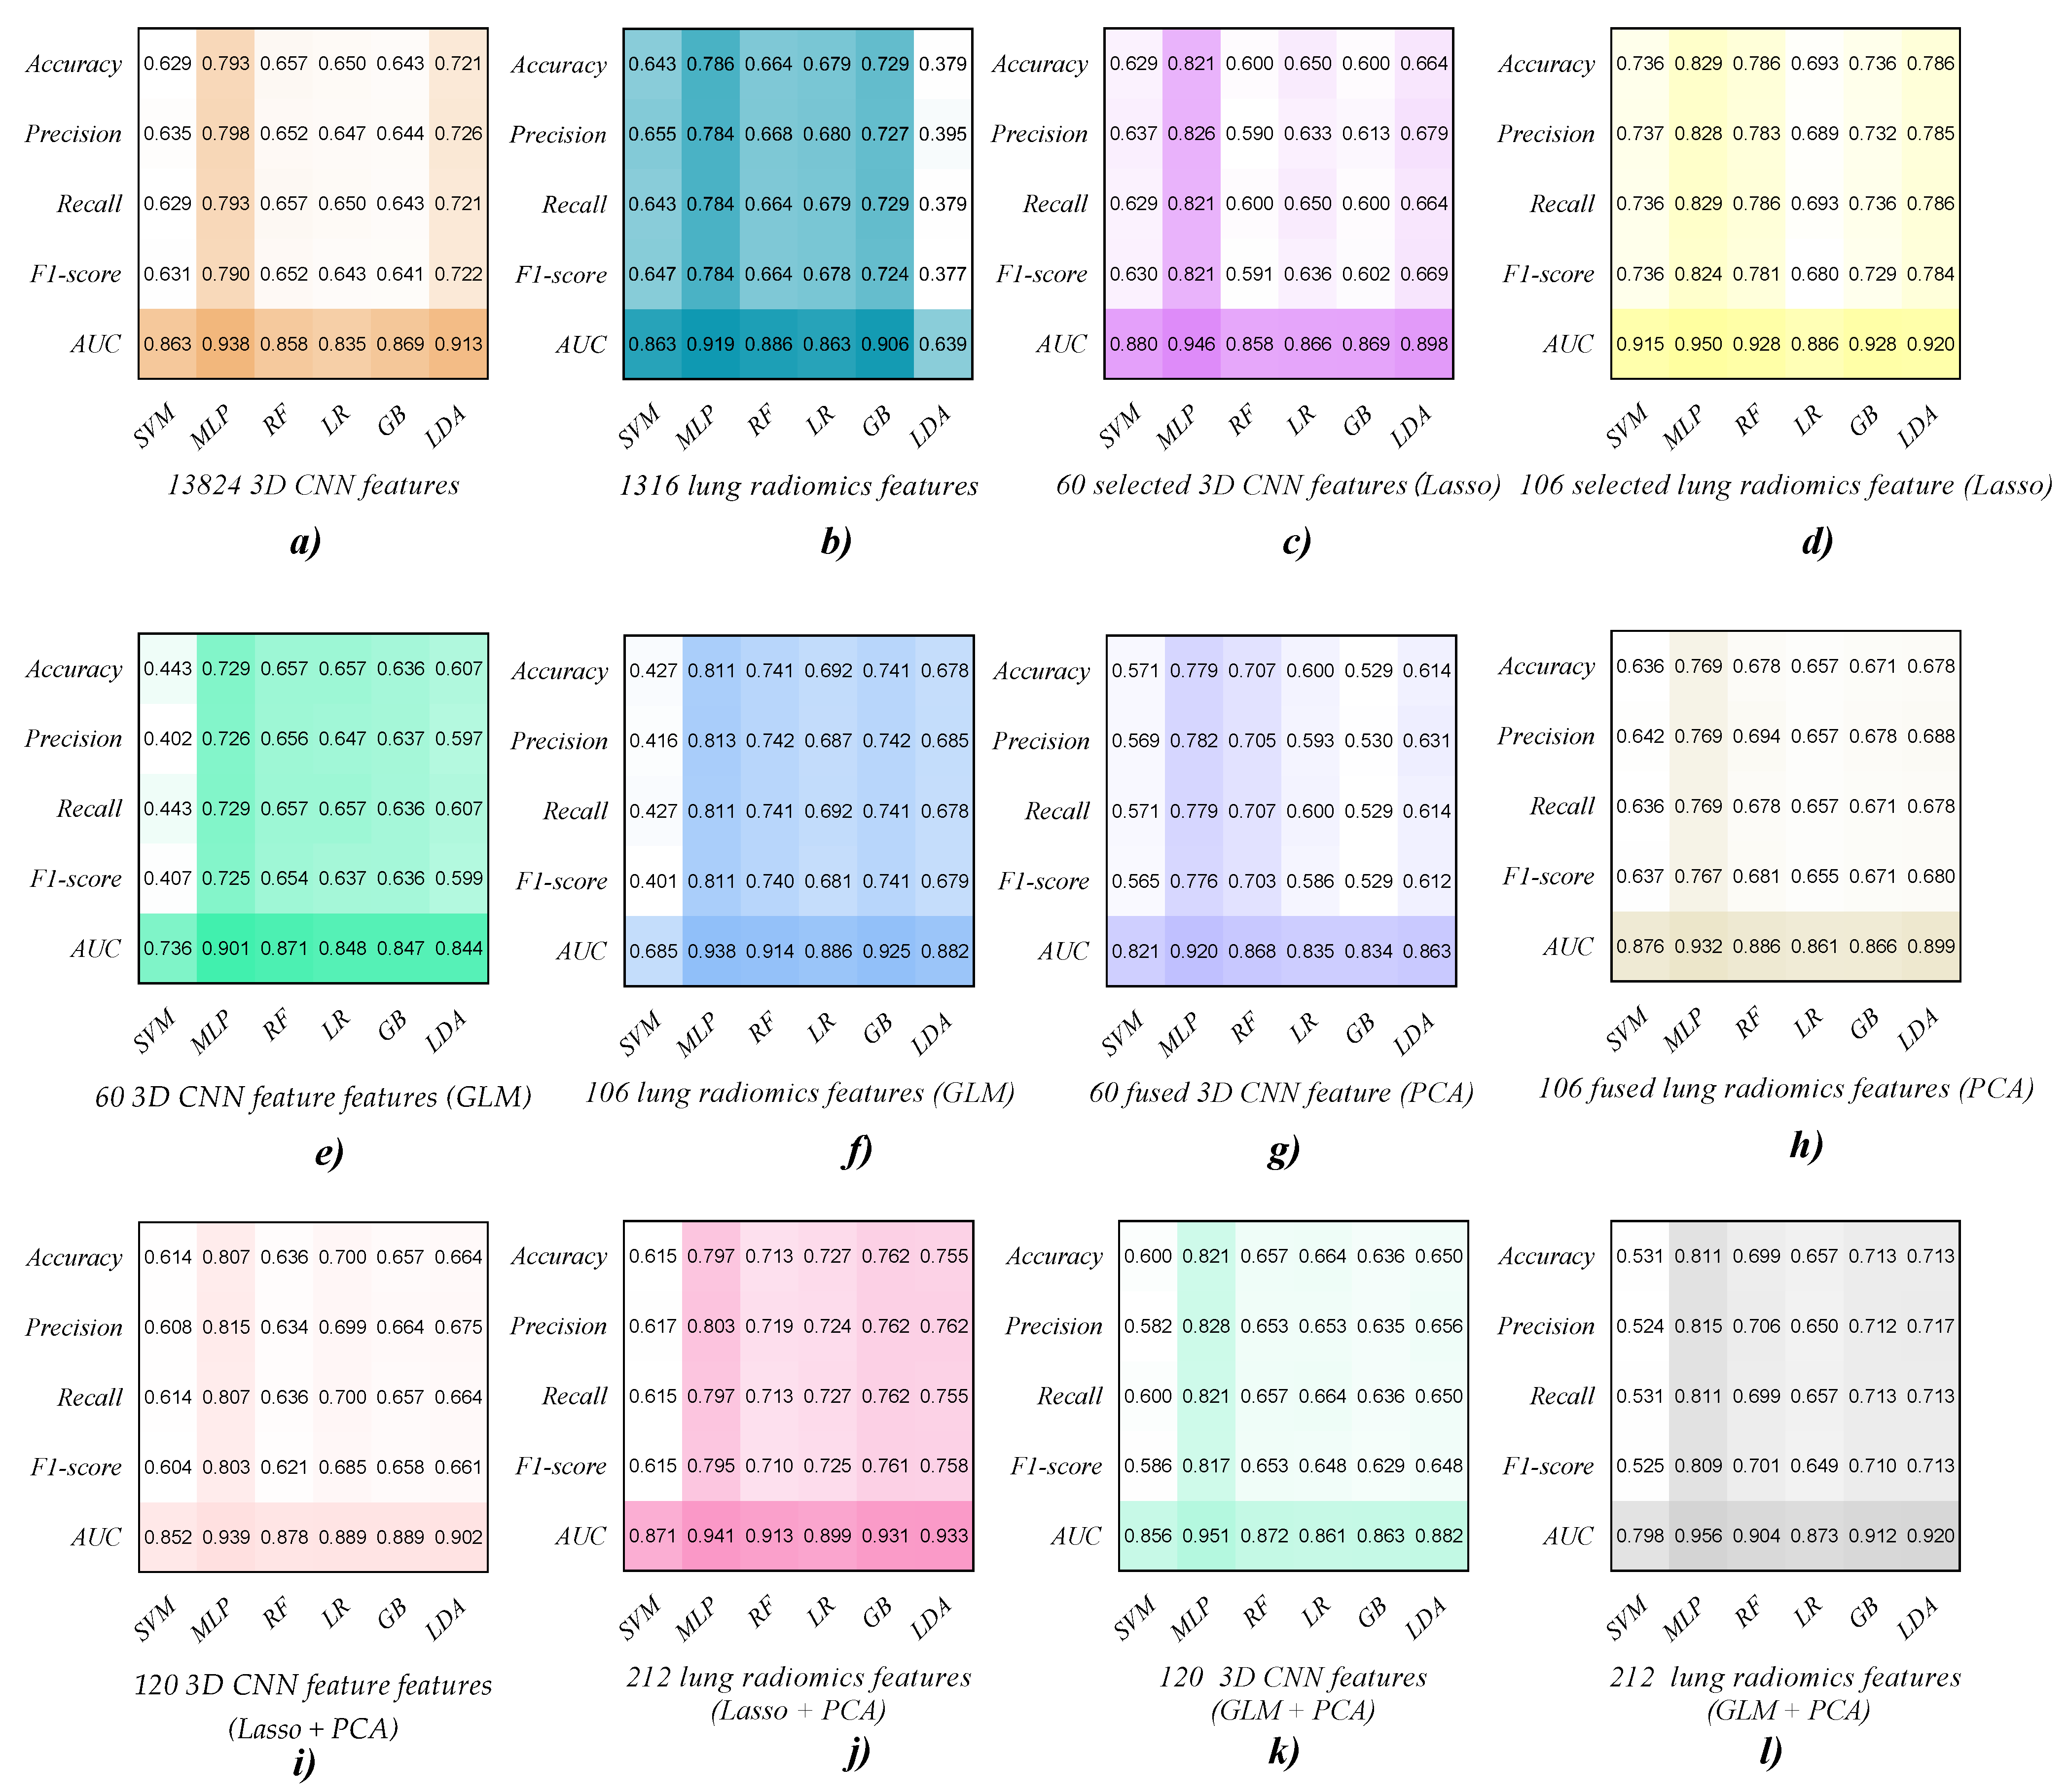
| Features | Classifier | Accuracy | Precision | Recall | F1-Score | AUC |
|---|---|---|---|---|---|---|
| 3D CNN feature (13,824)/ Lung radiomics feature (1316) | SVM | 0.629/0.643 | 0.635/0.655 | 0.629/0.643 | 0.631/0.647 | 0.863/0.863 |
| MLP | 0.793/0.786 | 0.798/0.784 | 0.793/0.784 | 0.790/0.784 | 0.938/0.919 | |
| RF | 0.657/0.664 | 0.652/0.668 | 0.657/0.664 | 0.652/0.664 | 0.858/0.886 | |
| LR | 0.650/0.679 | 0.647/0.680 | 0.650/0.679 | 0.643/0.678 | 0.835/0.863 | |
| GB | 0.643/0.729 | 0.644/0.727 | 0.643/0.729 | 0.641/0.724 | 0.869/0.906 | |
| LDA | 0.721/0.379 | 0.726/0.395 | 0.721/0.379 | 0.722/0.377 | 0.913/0.639 |
| Features | Classifier | Accuracy | Precision | Recall | F1-Score | AUC |
|---|---|---|---|---|---|---|
| Selected 3D CNN feature (60)/ Selected lung radiomics feature (106) | SVM | 0.629/0.736 | 0.637/0.737 | 0.629/0.736 | 0.630/0.736 | 0.880/0.915 |
| MLP | 0.821/0.829 | 0.826/0.828 | 0.821/0.829 | 0.821/0.824 | 0.946/0.950 | |
| RF | 0.600/0.786 | 0.590/0.783 | 0.600/0.786 | 0.591/0.781 | 0.858/0.928 | |
| LR | 0.650/0.693 | 0.633/0.689 | 0.650/0.693 | 0.636/0.680 | 0.866/0.886 | |
| GB | 0.600/0.736 | 0.613/0.732 | 0.600/0.736 | 0.602/0.729 | 0.869/0.928 | |
| LDA | 0.664/0.786 | 0.679/0.785 | 0.664/0.786 | 0.669/0.784 | 0.898/0.920 |
| Features | Classifier | Accuracy | Precision | Recall | F1-Score | AUC |
|---|---|---|---|---|---|---|
| Selected 3D CNN feature (60)/ Selected lung radiomics feature (106) | SVM | 0.443/0.427 | 0.402/0.416 | 0.443/0.427 | 0.407/0.401 | 0.736/0.685 |
| MLP | 0.729/0.811 | 0.726/0.813 | 0.729/0.811 | 0.725/0.811 | 0.901/0.938 | |
| RF | 0.657/0.741 | 0.656/0.742 | 0.657/0.741 | 0.654/0.740 | 0.871/0.914 | |
| LR | 0.657/0.692 | 0.647/0.687 | 0.657/0.692 | 0.637/0.681 | 0.848/0.886 | |
| GB | 0.636/0.741 | 0.637/0.742 | 0.636/0.741 | 0.636/0.741 | 0.847/0.925 | |
| LDA | 0.607/0.678 | 0.597/0.685 | 0.607/0.678 | 0.599/0.679 | 0.844/0.882 |
| Features | Classifier | Accuracy | Precision | Recall | F1-Score | AUC |
|---|---|---|---|---|---|---|
| Selected 3D CNN feature (60)/ Selected lung radiomics feature (106) | SVM | 0.571/0.636 | 0.569/0.642 | 0.571/0.636 | 0.565/0.637 | 0.821/0.876 |
| MLP | 0.779/0.769 | 0.782/0.769 | 0.779/0.769 | 0.776/0.767 | 0.920/0.932 | |
| RF | 0.707/0.678 | 0.705/0.694 | 0.707/0.678 | 0.703/0.681 | 0.868/0.886 | |
| LR | 0.600/0.657 | 0.593/0.657 | 0.600/0.657 | 0.586/0.655 | 0.835/0.861 | |
| GB | 0.529/0.671 | 0.530/0.678 | 0.529/0.671 | 0.529/0.671 | 0.834/0.866 | |
| LDA | 0.614/0.678 | 0.631/0.688 | 0.614/0.678 | 0.612/0.680 | 0.863/0.899 |
| Features | Classifier | Accuracy | Precision | Recall | F1-Score | AUC |
|---|---|---|---|---|---|---|
| CNN combination vector (Lasso+PCA/GLM+ PCA) | SVM | 0.614/0.600 | 0.608/0.582 | 0.614/0.600 | 0.604/0.586 | 0.852/0.856 |
| MLP | 0.807/0.821 | 0.815/0.828 | 0.807/0.821 | 0.803/0.817 | 0.939/0.951 | |
| RF | 0.636/0.657 | 0.634/0.653 | 0.636/0.657 | 0.621/0.653 | 0.878/0.872 | |
| LR | 0.700/0.664 | 0.699/0.653 | 0.700/0.664 | 0.685/0.648 | 0.889/0.861 | |
| GB | 0.657/0.636 | 0.664/0.635 | 0.657/0.636 | 0.658/0.629 | 0.889/0.863 | |
| LDA | 0.664/0.650 | 0.675/0.656 | 0.664/0.650 | 0.661/0.648 | 0.902/0.882 |
| Features | Classifier | Accuracy | Precision | Recall | F1-Score | AUC |
|---|---|---|---|---|---|---|
| Lung radiomics combination vector (Lasso+PCA/GLM+ PCA) | SVM | 0.615/0.531 | 0.617/0.524 | 0.615/0.531 | 0.615/0.525 | 0.871/0.798 |
| MLP | 0.797/0.811 | 0.803/0.815 | 0.797/0.811 | 0.795/0.809 | 0.941/0.956 | |
| RF | 0.713/0.699 | 0.719/0.706 | 0.713/0.699 | 0.710/0.701 | 0.913/0.904 | |
| LR | 0.727/0.657 | 0.724/0.650 | 0.727/0.657 | 0.725/0.649 | 0.899/0.873 | |
| GB | 0.762/0.713 | 0.762/0.712 | 0.762/0.713 | 0.761/0.710 | 0.931/0.912 | |
| LDA | 0.755/0.713 | 0.762/0.717 | 0.755/0.713 | 0.758/0.713 | 0.933/0.920 |
| Features | Classifier | Accuracy | Precision | Recall | F1-Score | AUC |
|---|---|---|---|---|---|---|
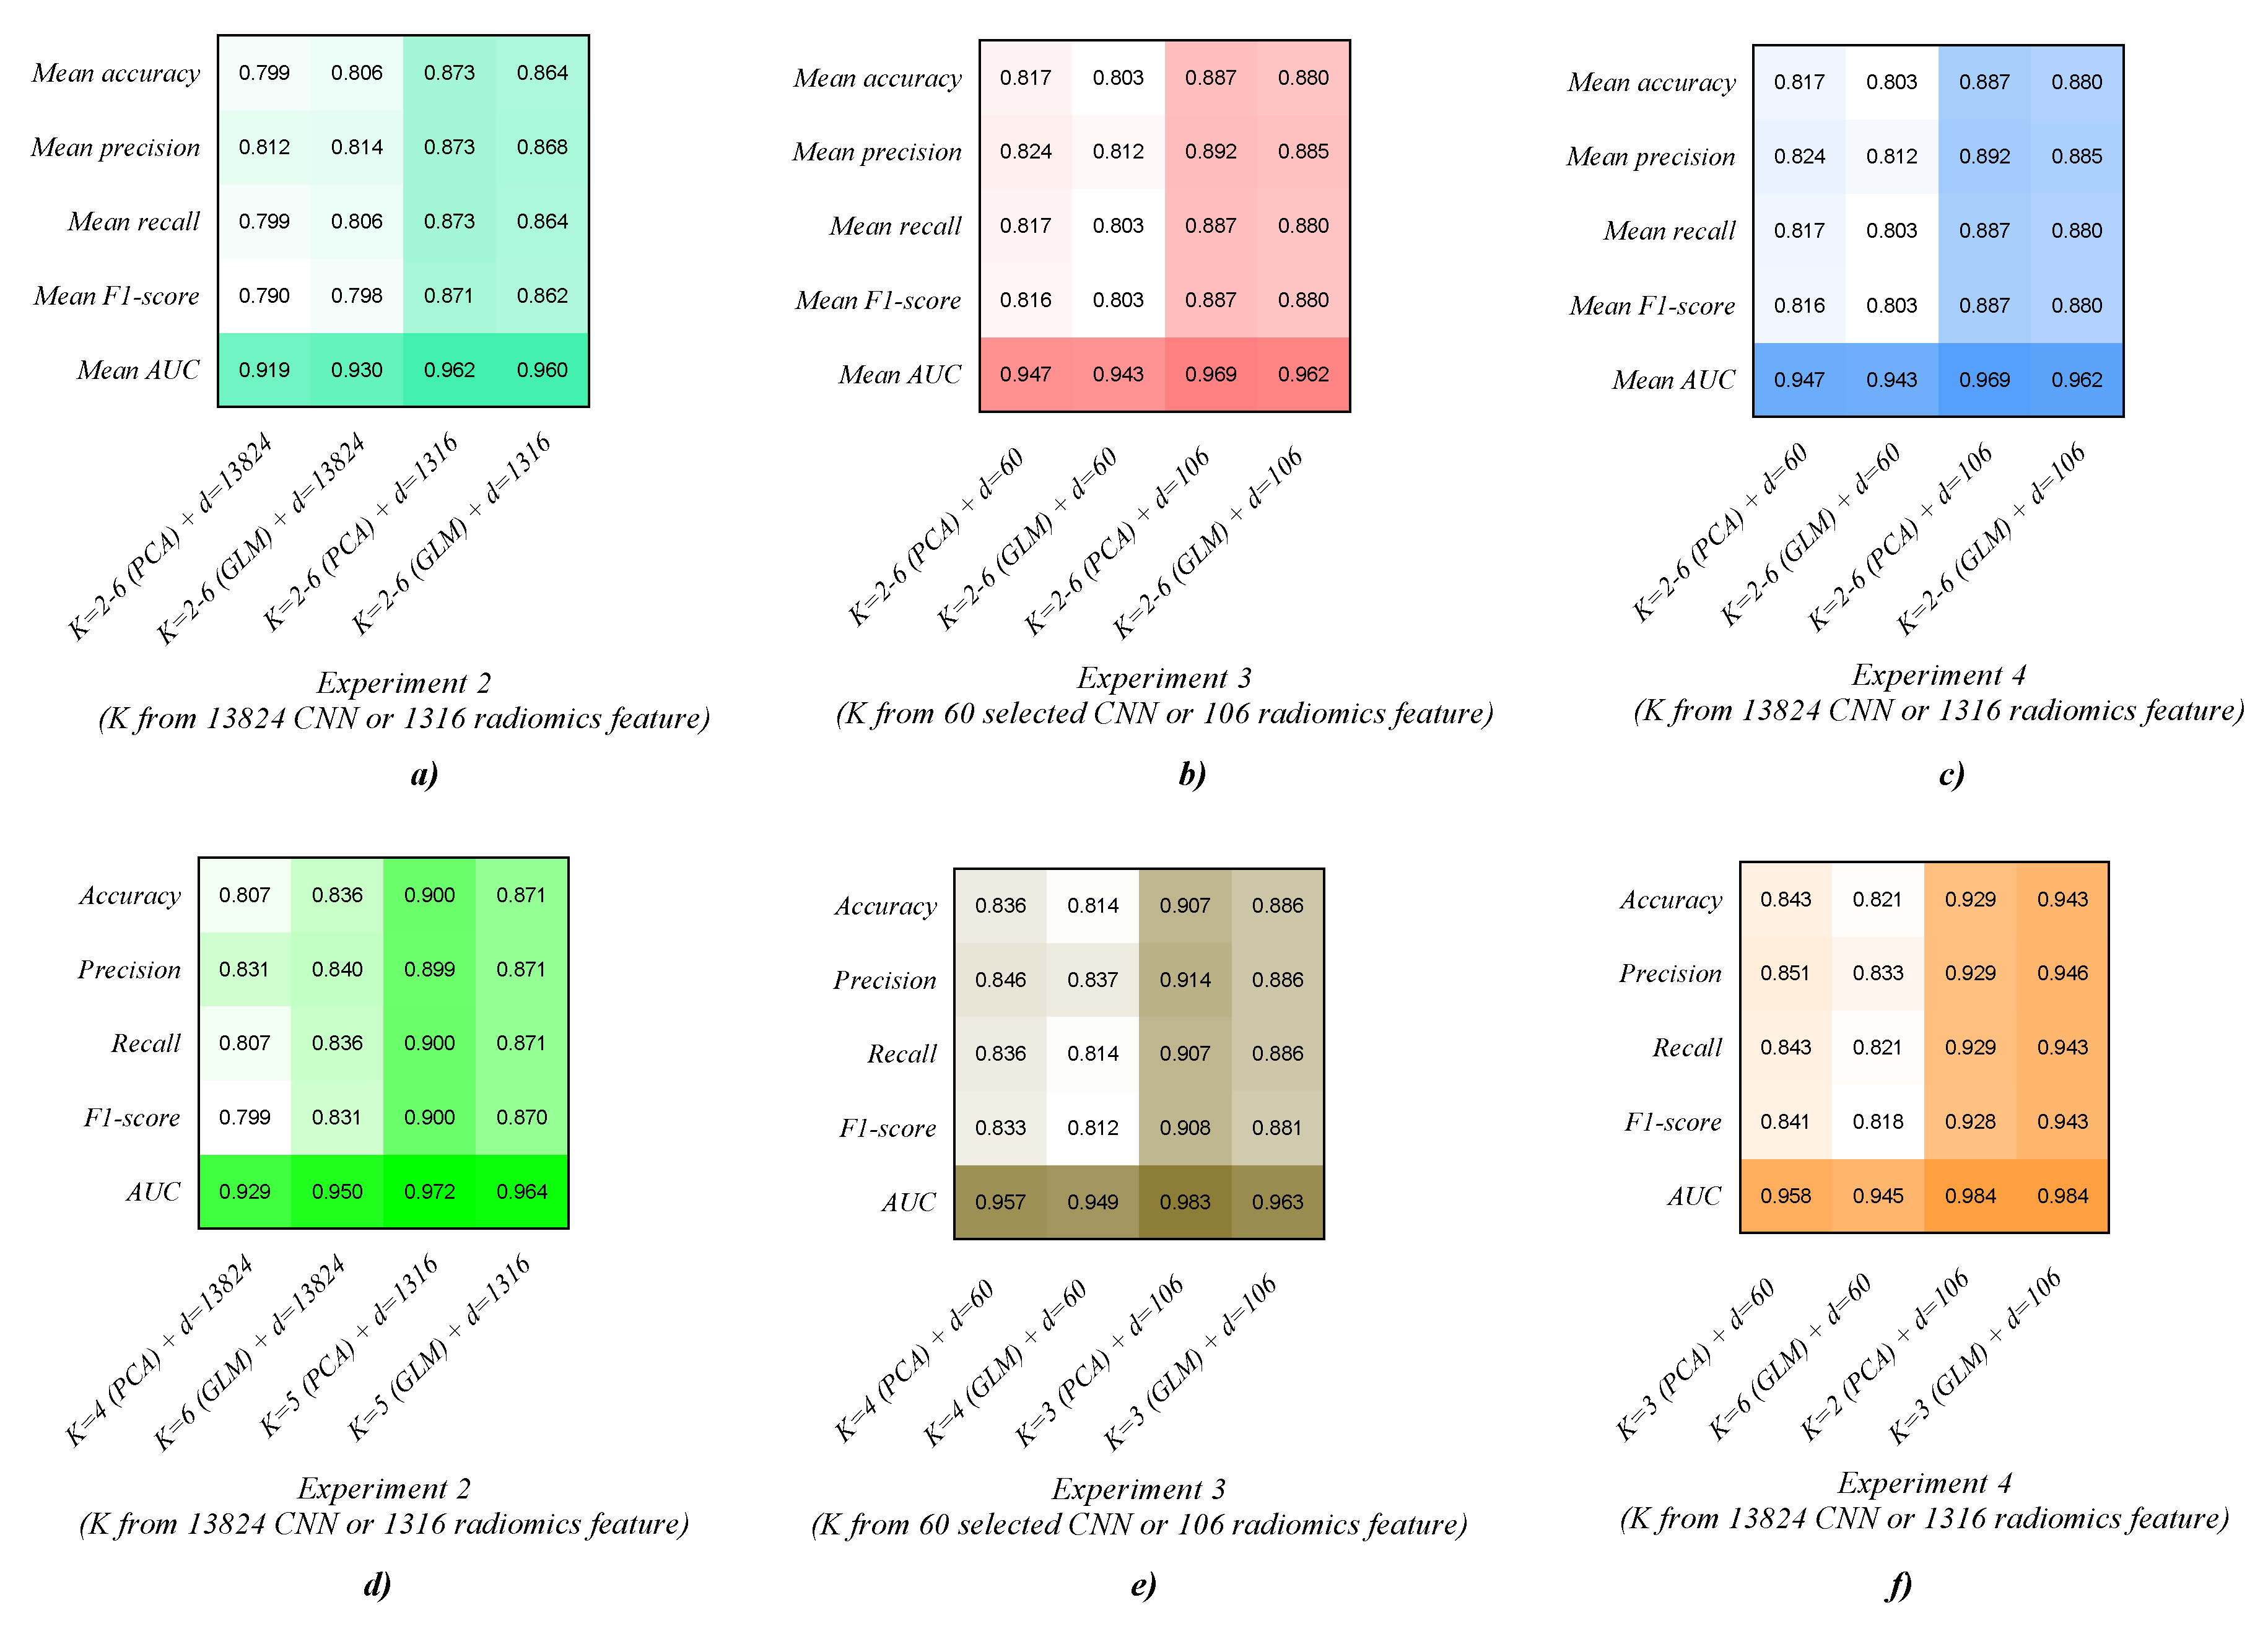
| 3D CNN feature (13,824) (K = 2–6 (PCA) + d = 13,824) | AMGNN (K = 2) | 0.793 | 0.789 | 0.793 | 0.774 | 0.933 |
| AMGNN (K = 3) | 0.786 | 0.803 | 0.786 | 0.780 | 0.884 | |
| AMGNN (K = 4) | 0.807 | 0.831 | 0.807 | 0.799 | 0.929 | |
| AMGNN (K = 5) | 0.807 | 0.811 | 0.807 | 0.804 | 0.924 | |
| AMGNN (K = 6) | 0.800 | 0.825 | 0.800 | 0.795 | 0.927 | |
| Mean | 0.799 | 0.812 | 0.799 | 0.790 | 0.919 | |
| 3D CNN feature (13,824) (K = 2–6 (GLM) + d = 13,824) | AMGNN (K = 2) | 0.779 | 0.798 | 0.779 | 0.762 | 0.917 |
| AMGNN (K = 3) | 0.821 | 0.824 | 0.821 | 0.811 | 0.929 | |
| AMGNN (K = 4) | 0.786 | 0.787 | 0.786 | 0.776 | 0.913 | |
| AMGNN (K = 5) | 0.807 | 0.819 | 0.807 | 0.808 | 0.941 | |
| AMGNN (K = 6) | 0.836 | 0.840 | 0.836 | 0.831 | 0.950 | |
| Mean | 0.806 | 0.814 | 0.806 | 0.798 | 0.930 | |
| Lung radiomics feature (1316) (K = 2–6 (PCA) + d = 1316) | AMGNN (K = 2) | 0.864 | 0.864 | 0.864 | 0.862 | 0.966 |
| AMGNN (K = 3) | 0.879 | 0.880 | 0.879 | 0.878 | 0.972 | |
| AMGNN (K = 4) | 0.850 | 0.851 | 0.850 | 0.850 | 0.952 | |
| AMGNN (K = 5) | 0.900 | 0.899 | 0.900 | 0.900 | 0.972 | |
| AMGNN (K = 6) | 0.871 | 0.872 | 0.871 | 0.865 | 0.948 | |
| Mean | 0.873 | 0.873 | 0.873 | 0.871 | 0.962 | |
| Lung radiomics feature (1316) (K = 2–6 (GLM) + d = 1316) | AMGNN (K = 2) | 0.864 | 0.880 | 0.864 | 0.861 | 0.948 |
| AMGNN (K = 3) | 0.857 | 0.858 | 0.857 | 0.857 | 0.971 | |
| AMGNN (K = 4) | 0.864 | 0.869 | 0.864 | 0.862 | 0.943 | |
| AMGNN (K = 5) | 0.871 | 0.871 | 0.871 | 0.870 | 0.964 | |
| AMGNN (K = 6) | 0.864 | 0.864 | 0.864 | 0.862 | 0.973 | |
| Mean | 0.864 | 0.868 | 0.864 | 0.862 | 0.960 |
| Features | Classifier | Accuracy | Precision | Recall | F1-Score | AUC |
|---|---|---|---|---|---|---|
| Selected 3D CNN feature (60) (K = 2–6 (PCA) + d = 60) | AMGNN (K = 2) | 0.800 | 0.816 | 0.800 | 0.801 | 0.927 |
| AMGNN (K = 3) | 0.814 | 0.812 | 0.814 | 0.809 | 0.947 | |
| AMGNN (K = 4) | 0.836 | 0.846 | 0.836 | 0.833 | 0.957 | |
| AMGNN (K = 5) | 0.829 | 0.829 | 0.829 | 0.827 | 0.962 | |
| AMGNN (K = 6) | 0.807 | 0.818 | 0.807 | 0.809 | 0.943 | |
| Mean | 0.817 | 0.824 | 0.817 | 0.816 | 0.947 | |
| Selected 3D CNN feature (60) (K = 2–6 (GLM) + d = 60) | AMGNN (K = 2) | 0.800 | 0.797 | 0.800 | 0.797 | 0.941 |
| AMGNN (K = 3) | 0.800 | 0.806 | 0.800 | 0.802 | 0.940 | |
| AMGNN (K = 4) | 0.814 | 0.837 | 0.814 | 0.812 | 0.949 | |
| AMGNN (K = 5) | 0.807 | 0.822 | 0.807 | 0.810 | 0.944 | |
| AMGNN (K = 6) | 0.793 | 0.798 | 0.793 | 0.793 | 0.939 | |
| Mean | 0.803 | 0.812 | 0.803 | 0.803 | 0.943 | |
| Selected lung radiomics feature (106) (K = 2–6 (PCA) + d = 106) | AMGNN (K = 2) | 0.900 | 0.910 | 0.900 | 0.900 | 0.981 |
| AMGNN (K = 3) | 0.907 | 0.914 | 0.907 | 0.908 | 0.983 | |
| AMGNN (K = 4) | 0.879 | 0.884 | 0.879 | 0.879 | 0.963 | |
| AMGNN (K = 5) | 0.879 | 0.879 | 0.879 | 0.878 | 0.954 | |
| AMGNN (K = 6) | 0.871 | 0.872 | 0.871 | 0.868 | 0.962 | |
| Mean | 0.887 | 0.892 | 0.887 | 0.887 | 0.969 | |
| Selected lung radiomics feature (106) (K = 2–6 (GLM) + d = 106) | AMGNN (K = 2) | 0.879 | 0.889 | 0.879 | 0.879 | 0.951 |
| AMGNN (K = 3) | 0.886 | 0.887 | 0.886 | 0.886 | 0.956 | |
| AMGNN (K = 4) | 0.871 | 0.882 | 0.871 | 0.875 | 0.969 | |
| AMGNN (K = 5) | 0.879 | 0.881 | 0.879 | 0.878 | 0.971 | |
| AMGNN (K = 6) | 0.886 | 0.886 | 0.886 | 0.881 | 0.963 | |
| Mean | 0.880 | 0.885 | 0.880 | 0.880 | 0.962 |
| Features | Classifier | Accuracy | Precision | Recall | F1-Score | AUC |
|---|---|---|---|---|---|---|
| 3D CNN feature (13,824) (K = 2–6 (PCA) + d = 60) | AMGNN (K = 2) | 0.793 | 0.793 | 0.793 | 0.791 | 0.933 |
| AMGNN (K = 3) | 0.843 | 0.851 | 0.843 | 0.841 | 0.958 | |
| AMGNN (K = 4) | 0.800 | 0.801 | 0.800 | 0.798 | 0.941 | |
| AMGNN (K = 5) | 0.836 | 0.843 | 0.836 | 0.835 | 0.963 | |
| AMGNN (K = 6) | 0.793 | 0.798 | 0.793 | 0.794 | 0.847 | |
| Mean | 0.813 | 0.817 | 0.813 | 0.812 | 0.928 | |
| 3D CNN feature (13,824) (K = 2–6 (GLM) + d = 60) | AMGNN (K = 2) | 0.800 | 0.797 | 0.800 | 0.797 | 0.941 |
| AMGNN (K = 3) | 0.800 | 0.806 | 0.800 | 0.802 | 0.940 | |
| AMGNN (K = 4) | 0.807 | 0.821 | 0.807 | 0.807 | 0.955 | |
| AMGNN (K = 5) | 0.814 | 0.832 | 0.814 | 0.819 | 0.958 | |
| AMGNN (K = 6) | 0.821 | 0.833 | 0.821 | 0.818 | 0.945 | |
| Mean | 0.808 | 0.818 | 0.808 | 0.809 | 0.948 | |
| Lung radiomics feature (1316) (K = 2–6 (PCA) + d = 106) | AMGNN (K = 2) | 0.929 | 0.929 | 0.929 | 0.928 | 0.984 |
| AMGNN (K = 3) | 0.893 | 0.912 | 0.893 | 0.895 | 0.979 | |
| AMGNN (K = 4) | 0.893 | 0.894 | 0.893 | 0.892 | 0.979 | |
| AMGNN (K = 5) | 0.871 | 0.886 | 0.871 | 0.876 | 0.971 | |
| AMGNN (K = 6) | 0.893 | 0.908 | 0.893 | 0.889 | 0.984 | |
| Mean | 0.896 | 0.906 | 0.896 | 0.896 | 0.979 | |
| Lung radiomics feature (1316) (K = 2–6 (GLM) + d = 106) | AMGNN (K = 2) | 0.886 | 0.885 | 0.886 | 0.884 | 0.984 |
| AMGNN (K = 3) | 0.943 | 0.946 | 0.943 | 0.943 | 0.984 | |
| AMGNN (K = 4) | 0.871 | 0.889 | 0.871 | 0.874 | 0.947 | |
| AMGNN (K = 5) | 0.879 | 0.886 | 0.879 | 0.879 | 0.979 | |
| AMGNN (K = 6) | 0.893 | 0.891 | 0.893 | 0.891 | 0.969 | |
| Mean | 0.894 | 0.899 | 0.894 | 0.894 | 0.973 |
| Reference | Method | Feature | Accuracy | Precision | Recall (Sensitivity) | F1-Score | AUC | Specificity |
|---|---|---|---|---|---|---|---|---|
| Yang, Yingjian, et al. [25] | Lasso + MLP | CT-Based Radiomics | 0.830 | 0.830 | 0.830 | 0.820 | 0.950 | - |
| Spina, Gabriele, et al. [49] | Text representation + LDA | Multimodal Sleep Data | - | - | 0.78 | - | - | - |
| V K BAIRAGI, et al. [50] | CWT | Electromyography | 0.859 | 0.849 | 0.882 | - | 0.865 | 0.855 |
| Li, Zongli, et al. [26] | Variance threshold + Select K Best + Lasso + SVM | CT-Based Radiomics | 0.759 | 0.834 | 0.723 | 0.771 | 0.799 | 0.805 |
| Li, Zongli, et al. [26] | Variance threshold + Select K Best + Lasso + LR | CT-Based Radiomics | 0.763 | 0.820 | 0.758 | 0.778 | 0.797 | 0.766 |
| Our method | GLM + Lasso + AMGNN | CT-Based Radiomics | 0.943 | 0.946 | 0.943 | 0.943 | 0.984 | 0.982 |
Publisher’s Note: MDPI stays neutral with regard to jurisdictional claims in published maps and institutional affiliations. |
© 2022 by the authors. Licensee MDPI, Basel, Switzerland. This article is an open access article distributed under the terms and conditions of the Creative Commons Attribution (CC BY) license (https://creativecommons.org/licenses/by/4.0/).
Share and Cite
Yang, Y.; Wang, S.; Zeng, N.; Duan, W.; Chen, Z.; Liu, Y.; Li, W.; Guo, Y.; Chen, H.; Li, X.; et al. Lung Radiomics Features Selection for COPD Stage Classification Based on Auto-Metric Graph Neural Network. Diagnostics 2022, 12, 2274. https://doi.org/10.3390/diagnostics12102274
Yang Y, Wang S, Zeng N, Duan W, Chen Z, Liu Y, Li W, Guo Y, Chen H, Li X, et al. Lung Radiomics Features Selection for COPD Stage Classification Based on Auto-Metric Graph Neural Network. Diagnostics. 2022; 12(10):2274. https://doi.org/10.3390/diagnostics12102274
Chicago/Turabian StyleYang, Yingjian, Shicong Wang, Nanrong Zeng, Wenxin Duan, Ziran Chen, Yang Liu, Wei Li, Yingwei Guo, Huai Chen, Xian Li, and et al. 2022. "Lung Radiomics Features Selection for COPD Stage Classification Based on Auto-Metric Graph Neural Network" Diagnostics 12, no. 10: 2274. https://doi.org/10.3390/diagnostics12102274