

Analytical Performance of a Novel Latex Turbidimetric Immunoassay, “Nanopia TARC”, for TARC/CCL17 Measurement: A Retrospective Observational Study
 , , ,
, , ,
Abstract
:1. Introduction
2. Materials and Methods
2.1. Subject Specimens and Study Design
2.2. The Novel Latex Turbidimetric Immunoassay “Nanopia TARC”
2.3. “HISCL TARC” Based on the CLEIA Using HISCL®-5000
2.4. Analytical Precision and Accuracy
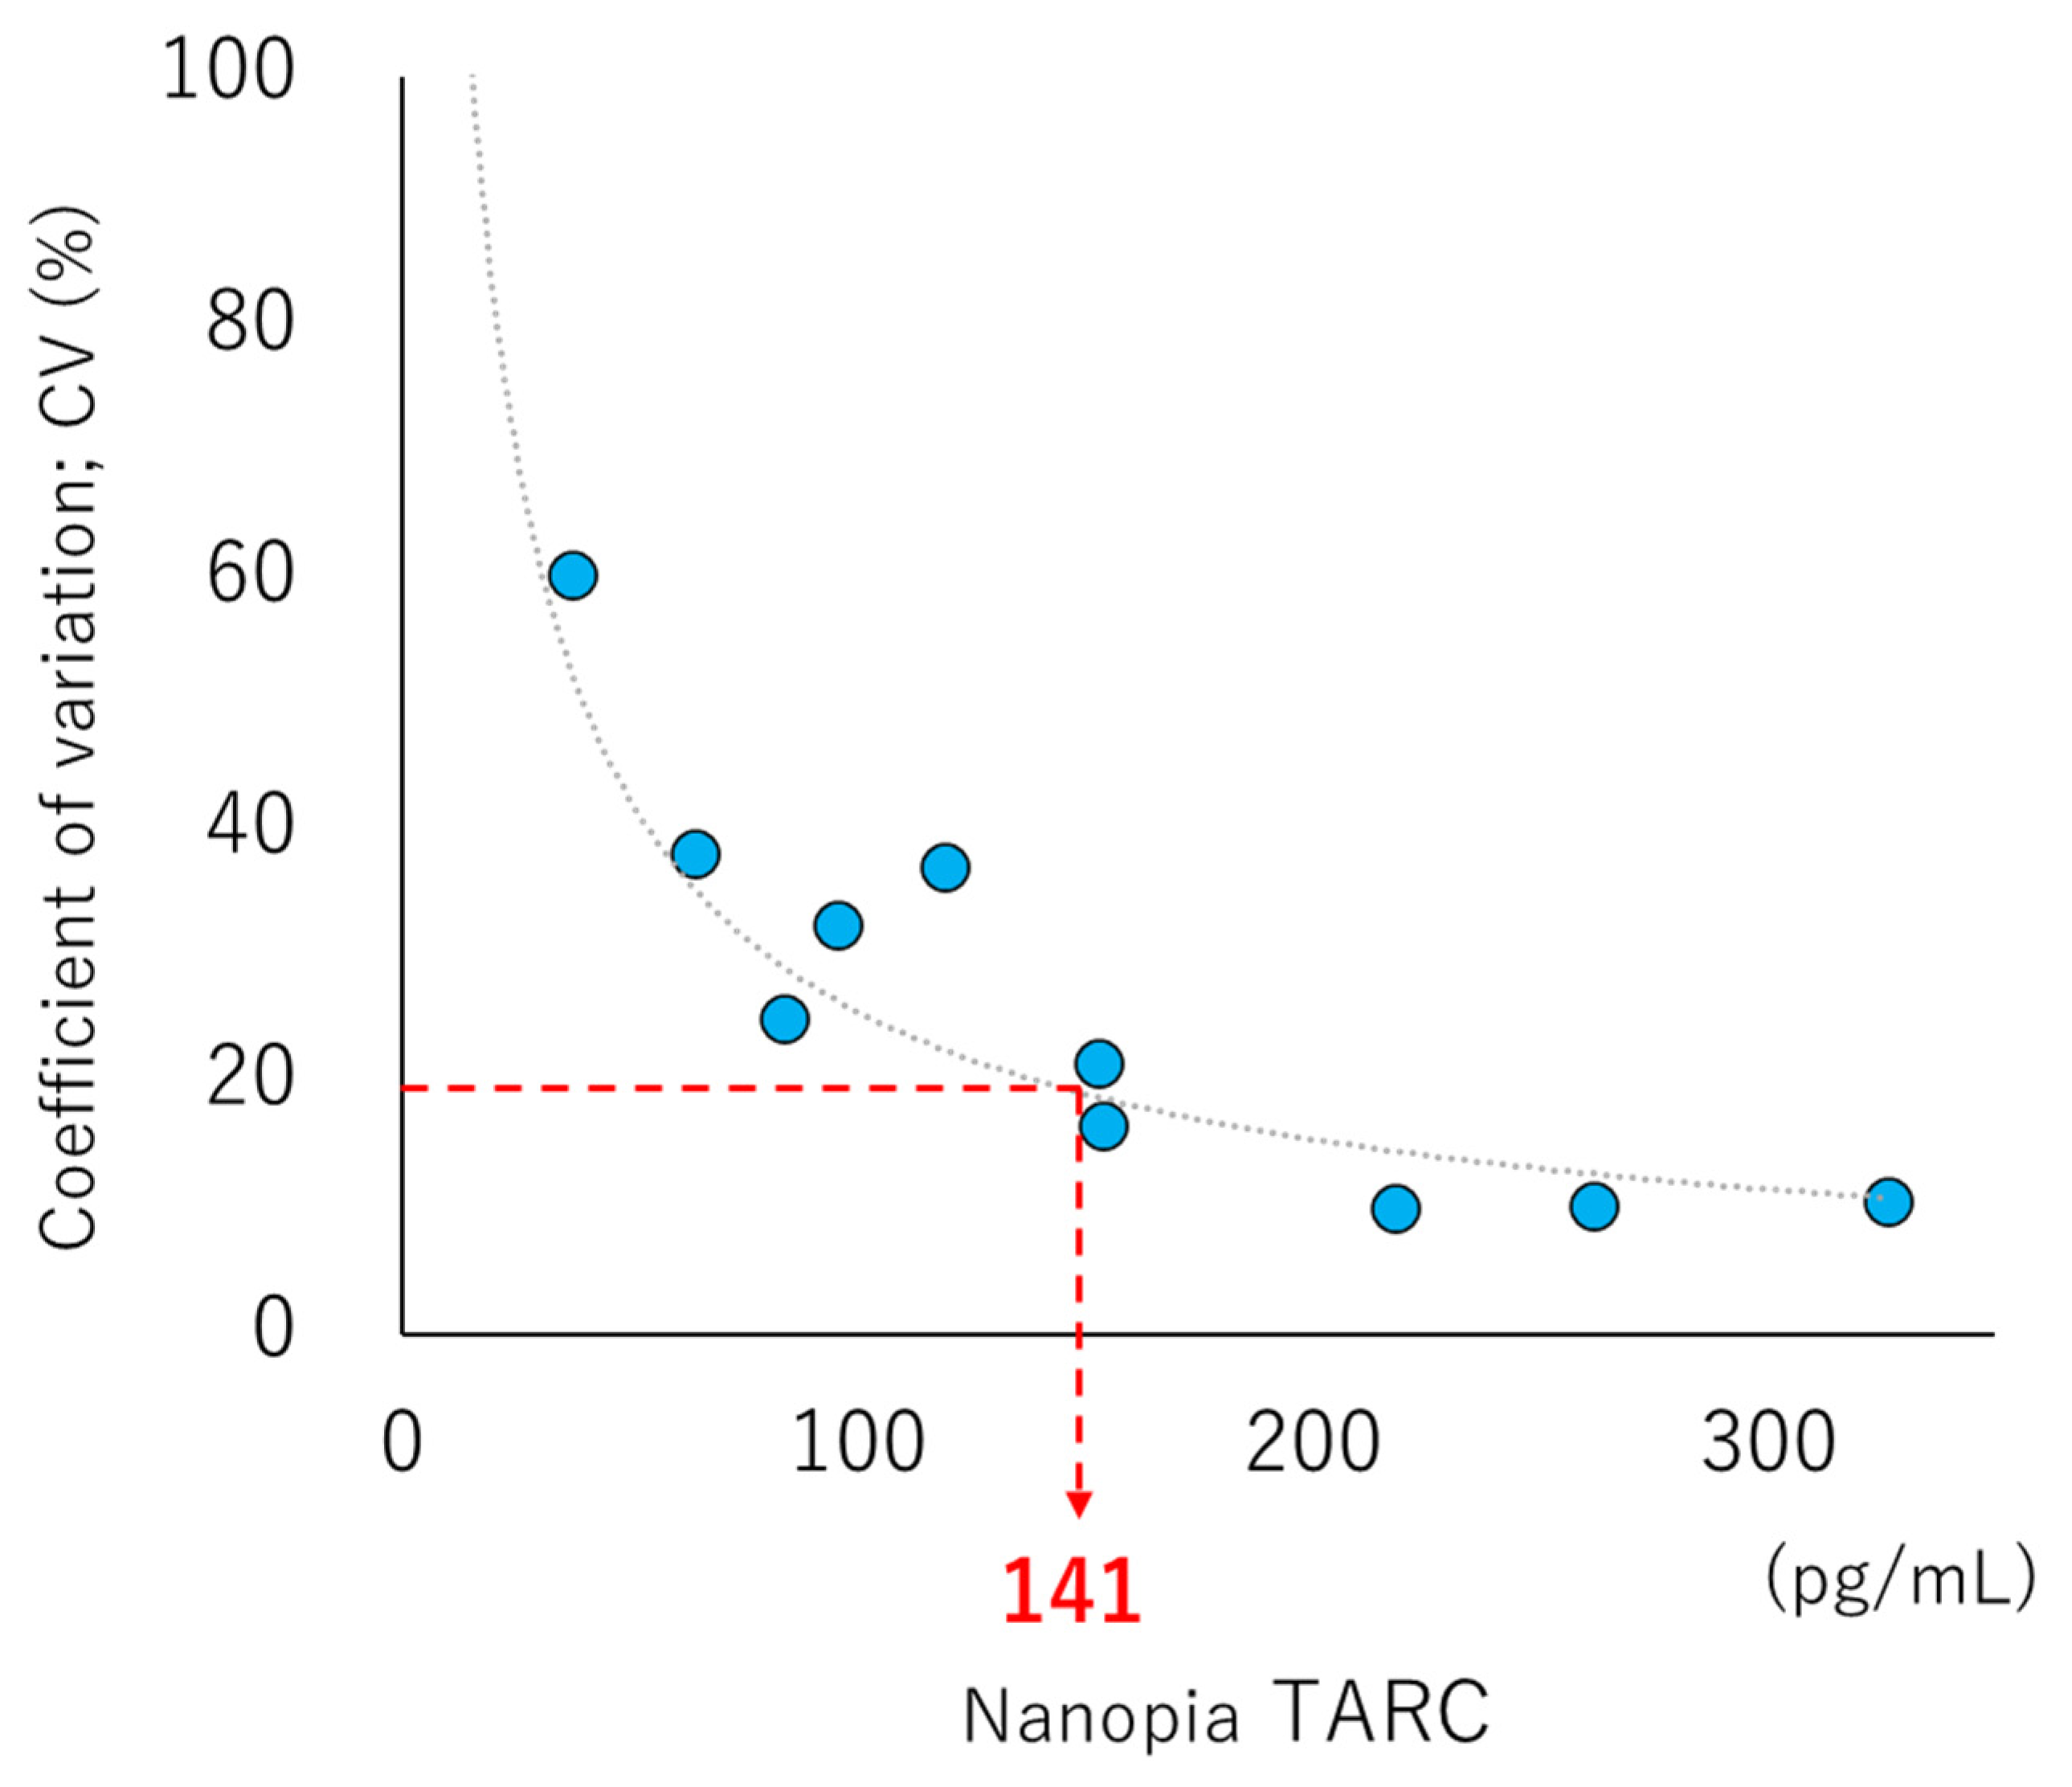
2.5. LOB, LOD, and LOQ
2.6. Linearity
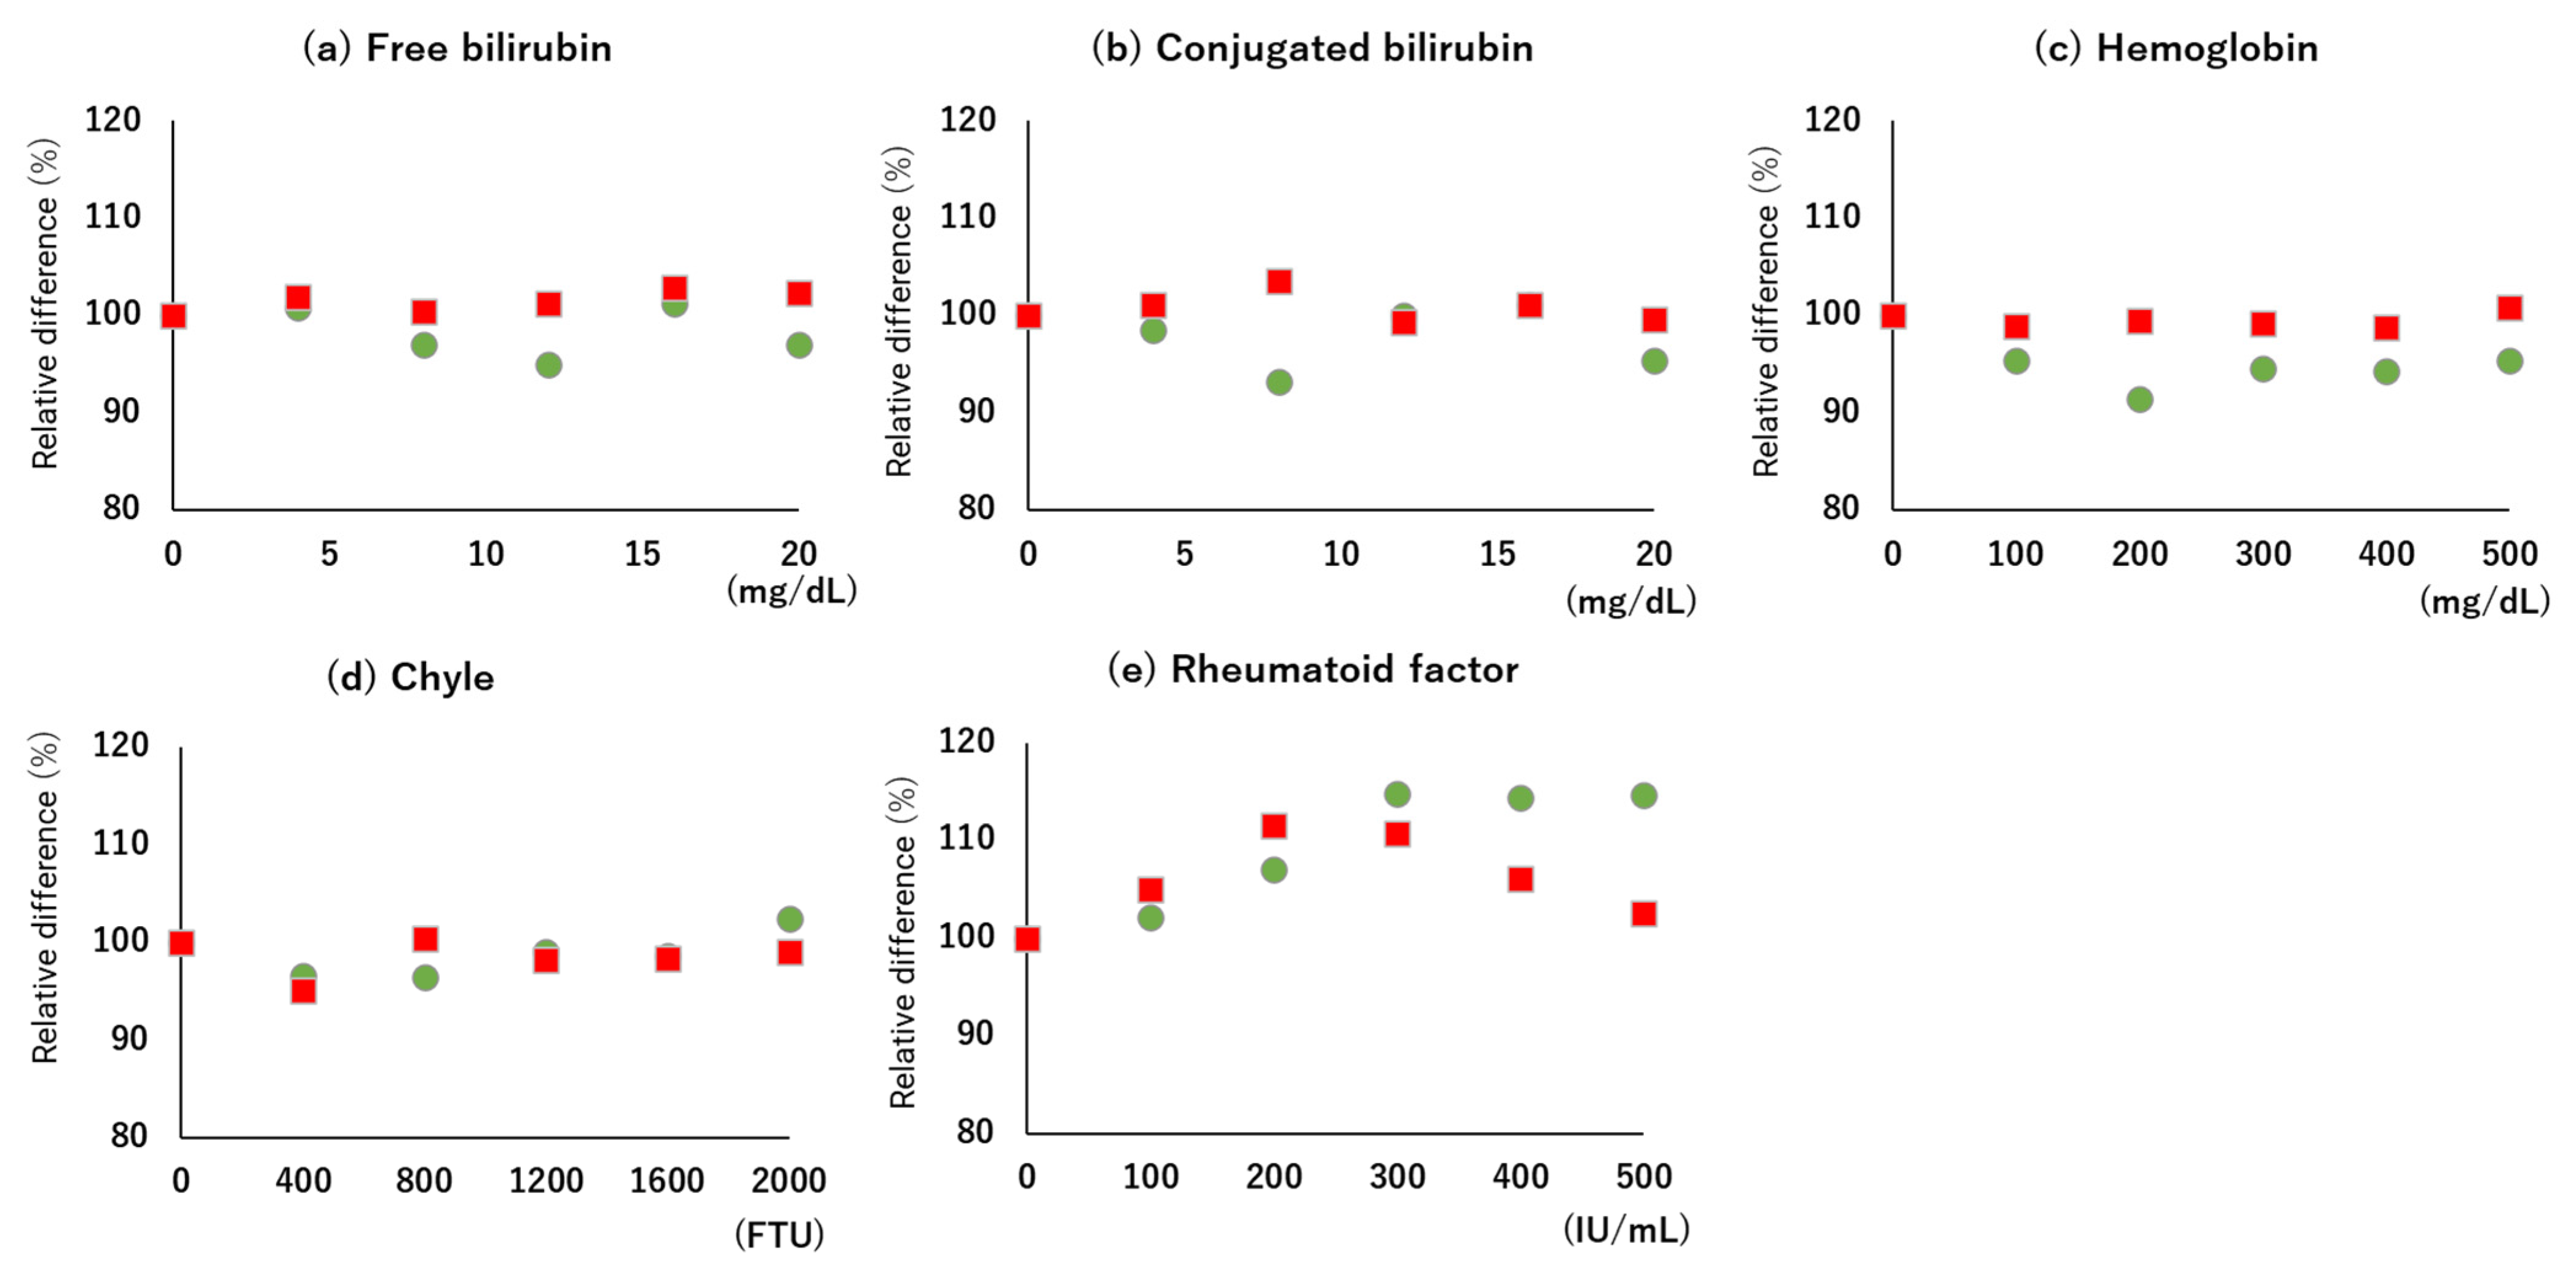
2.7. Interference
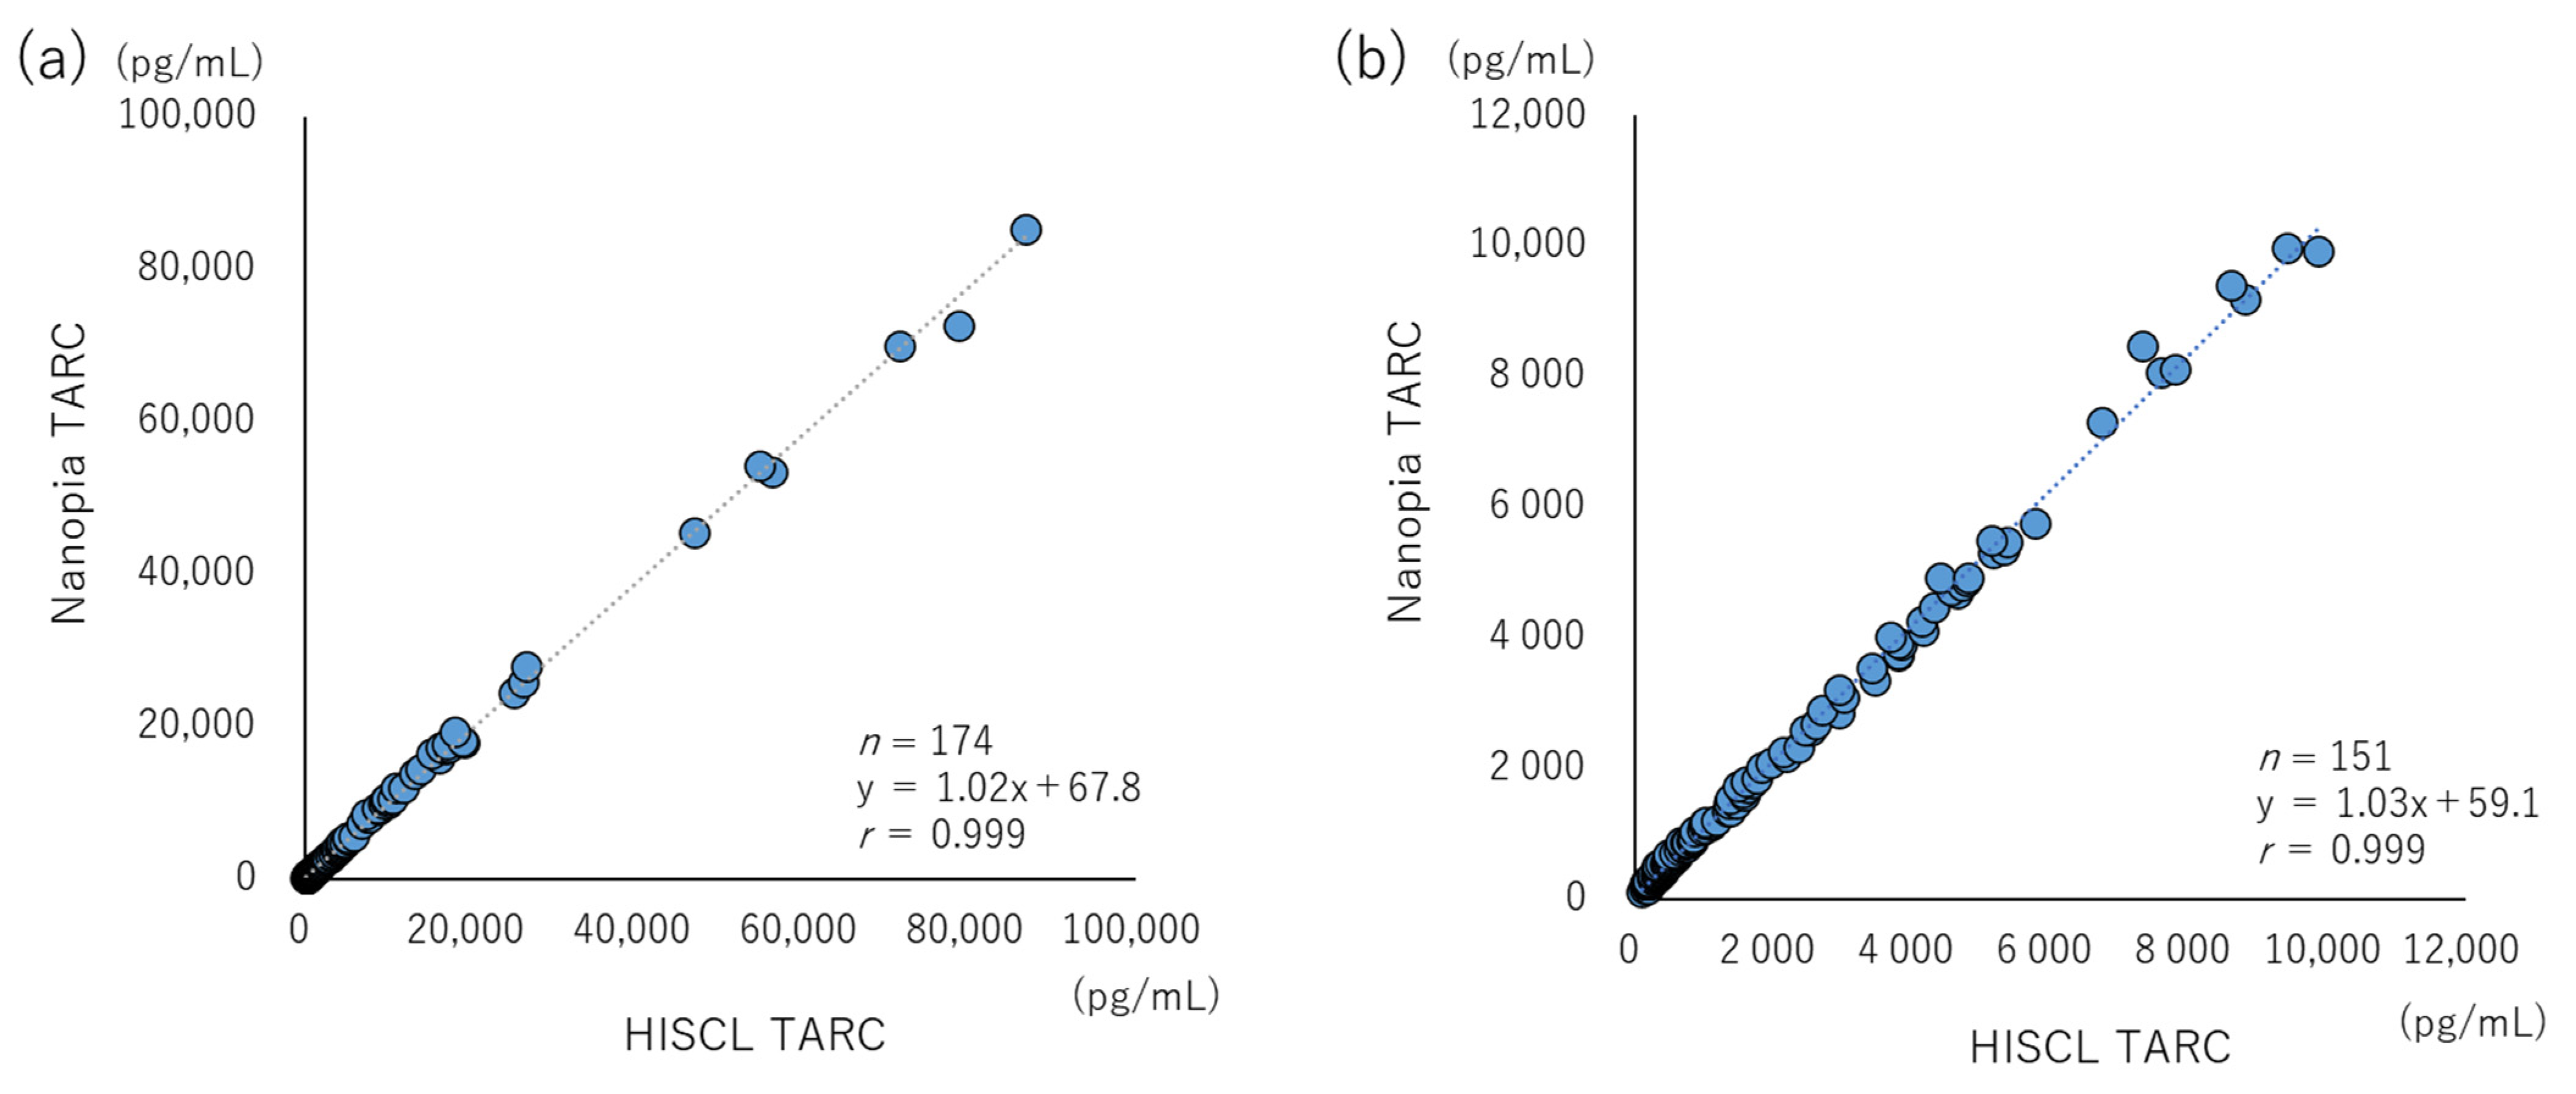
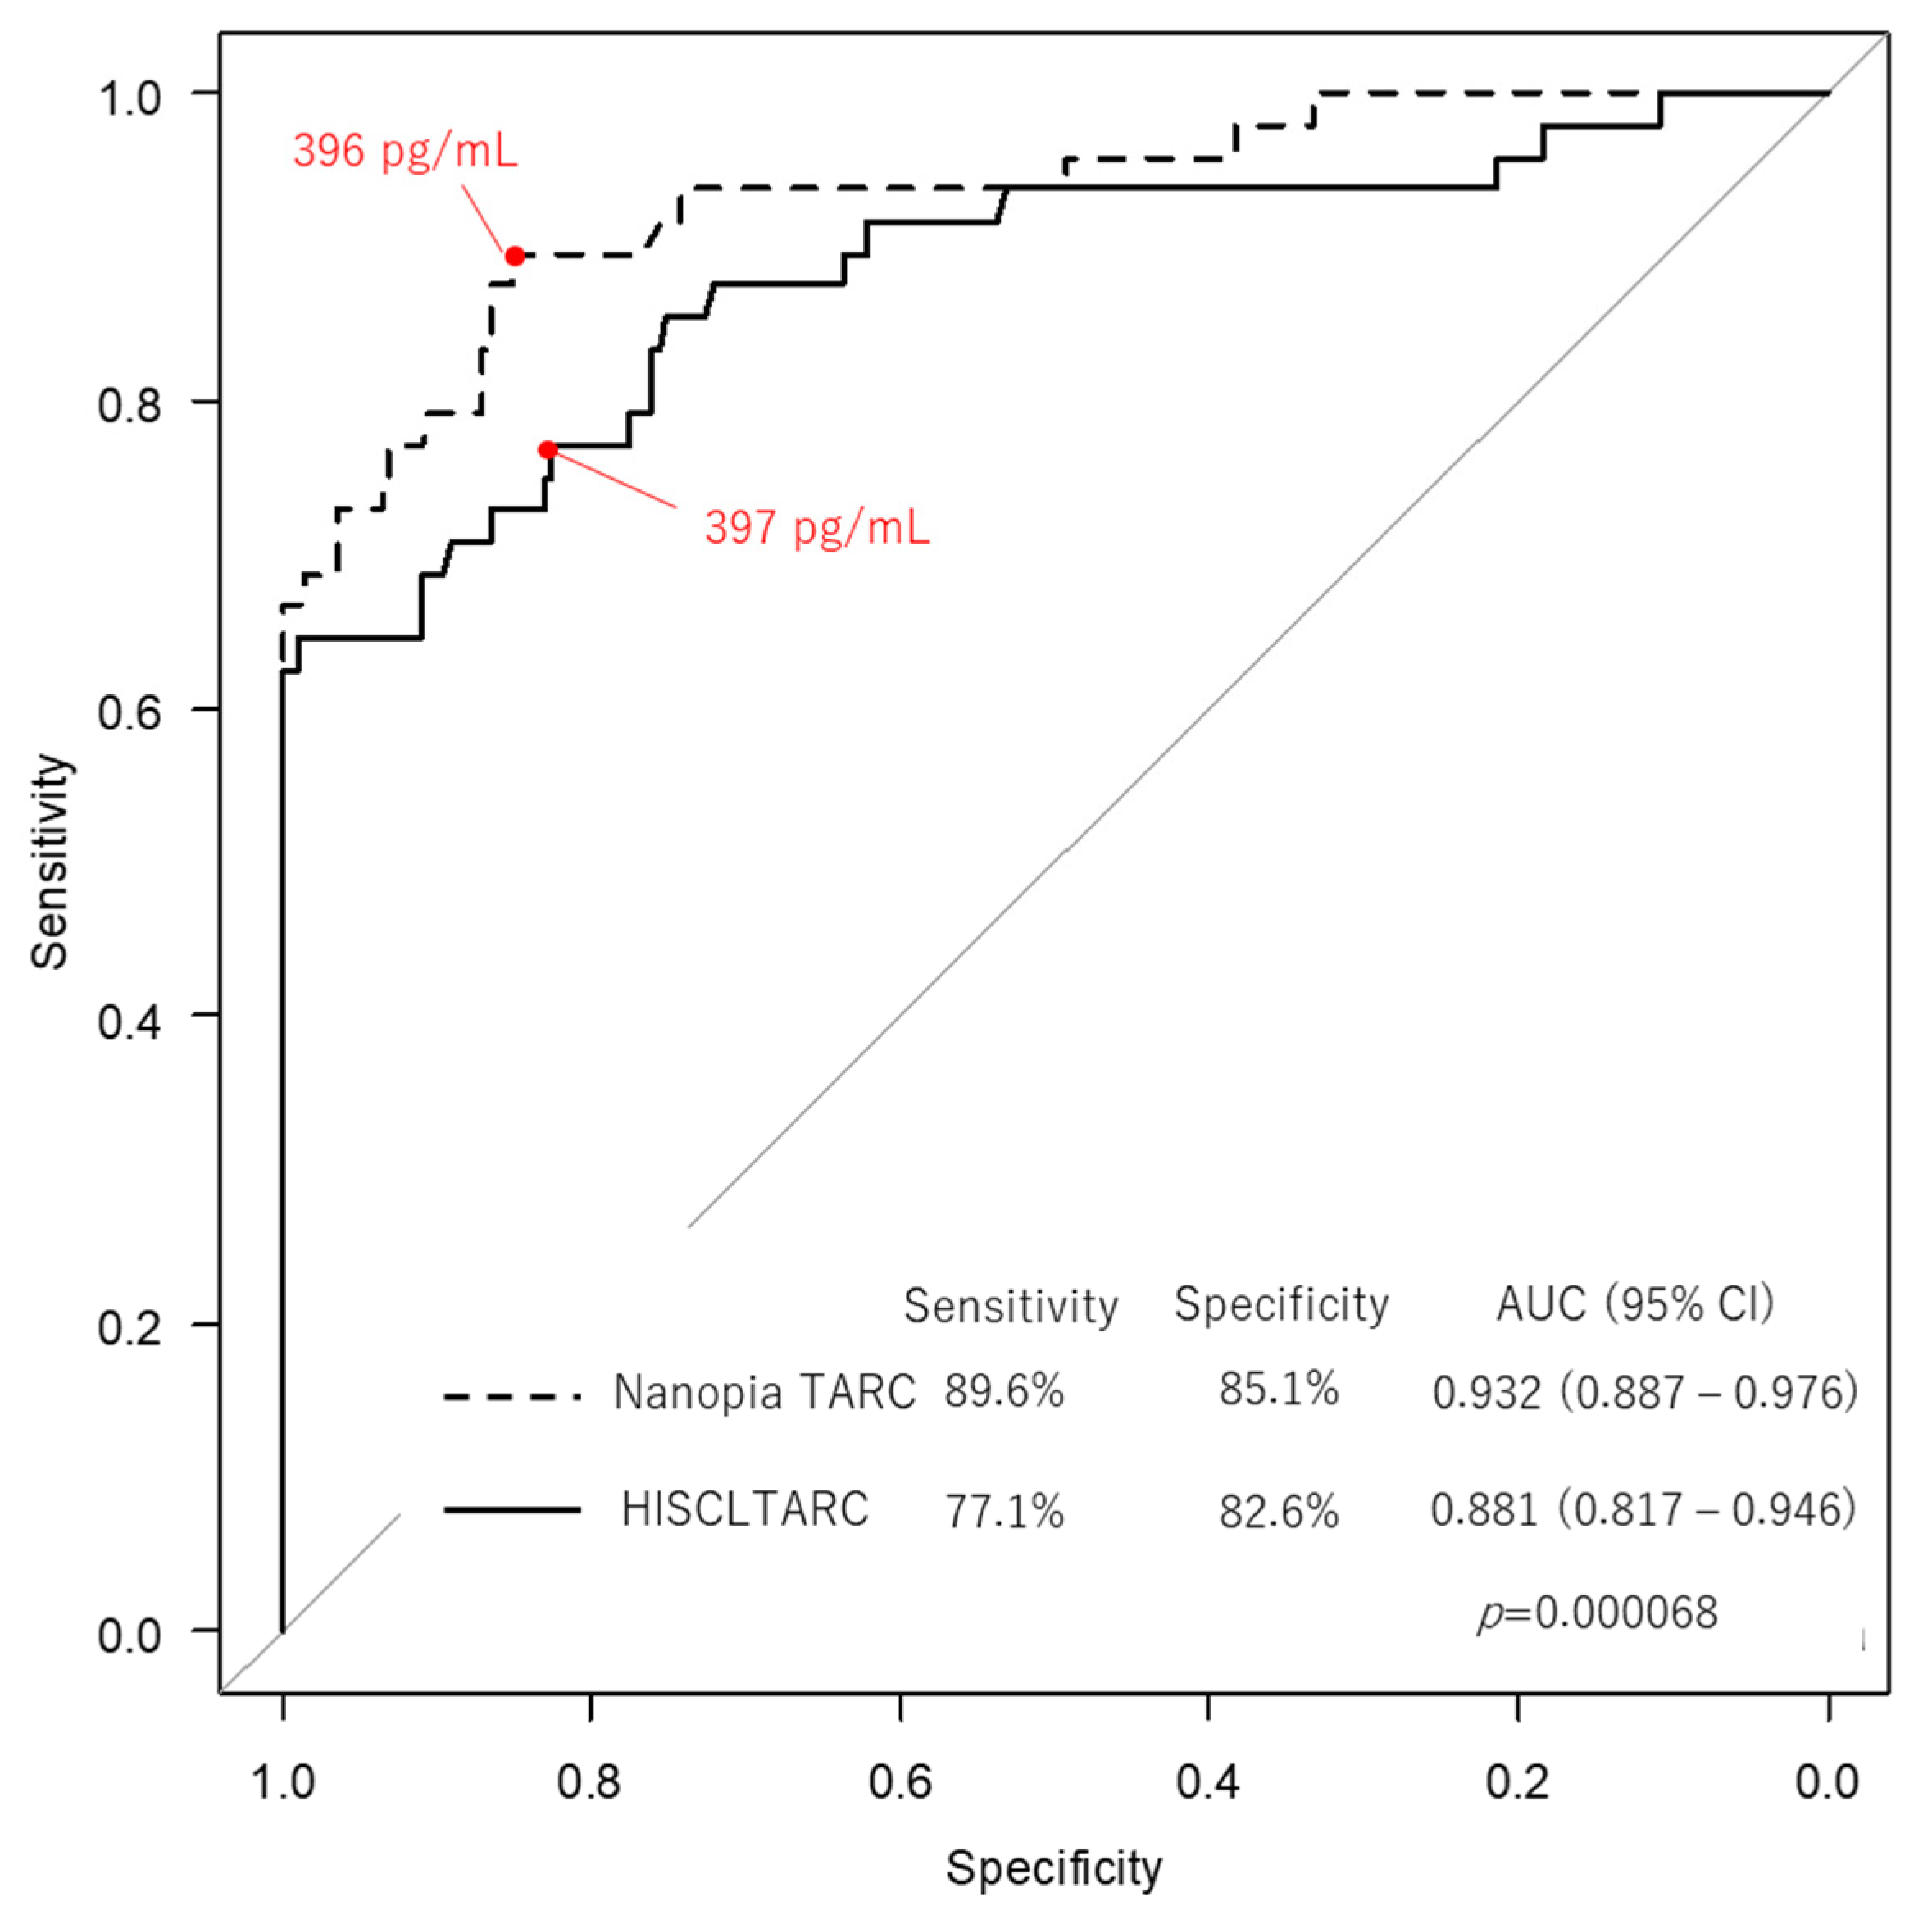
2.8. Commutability and Clinical Evaluation
2.9. Statistical Analysis
3. Results
3.1. Precision and Accuracy
3.2. LOB, LOD, LOQ, Linearity, and Interference
3.3. Commutability and Clinical Evaluation
4. Discussion
5. Limitations
6. Conclusions
Supplementary Materials
Author Contributions
Funding
Institutional Review Board Statement
Informed Consent Statement
Data Availability Statement
Acknowledgments
Conflicts of Interest
References
- Imai, T.; Yoshida, T.; Baba, M.; Nishimura, M.; Kakizaki, M.; Yoshie, O. Molecular Cloning of a Novel T cell-Directed CC Chemokine Expressed in Thymus by Signal Sequence Trap Using Epstein-Barr Virus Vector. J. Biol. Chem. 1996, 271, 21514–21521. [Google Scholar] [CrossRef] [PubMed]
- Islam, S.A.; Luster, A.D. T cell Homing to Epithelial Barriers in Allergic Disease. Nat. Med. 2012, 18, 705–715. [Google Scholar] [CrossRef] [PubMed]
- Catherine, J.; Roufosse, F. What Does Elevated TARC/CCL17 Expression Tell Us About Eosinophilic Disorders? Semin. Immunopathol. 2021, 43, 439–458. [Google Scholar] [CrossRef] [PubMed]
- Leung, T.F.; Wong, C.K.; Chan, I.H.S.; Ip, W.K.; Lam, C.W.K.; Wong, G.W.K. Plasma Concentration of Thymus and Activation-Regulated Chemokine is Elevated in Childhood Asthma. J. Allergy Clin. Immunol. 2002, 110, 404–409. [Google Scholar] [CrossRef]
- Van den Berg, A.; Visser, L.; Poppema, S. High Expression of the CC Chemokine TARC in Reed-Sternberg cells: A Possible Explanation for the Characteristic T-Cell Infiltrate in Hodgkin’s Lymphoma. Am. J. Pathol. 1999, 154, 1685–1691. [Google Scholar] [CrossRef]
- Yoshie, O.; Matsushima, K. CCR4 and its Ligands: From Bench to Bedside. Int. Immunol. 2015, 27, 11–20. [Google Scholar] [CrossRef]
- Kakinuma, T.; Sugaya, M.; Nakamura, K.; Kaneko, F.; Wakugawa, M.; Matsushima, K.; Tamaki, K. Thymus and Activation-Regulated Chemokine (TARC/CCL17) in Mycosis Fungoides: Serum TARC Levels Reflect the Disease activity of Mycosis Fungoides. J. Am. Acad. Dermatol. 2003, 48, 23–30. [Google Scholar] [CrossRef]
- Kuzumi, A.; Yoshizaki, A.; Ebata, S.; Fukasawa, T.; Yoshizaki-Ogawa, A.; Asano, Y.; Oba, K.; Sato, S.; Serum, T.A.R.C. Serum TARC Levels in Patients with Systemic Sclerosis: Clinical Association With Interstitial Lung Disease. J. Clin. Med. 2021, 10, 660. [Google Scholar] [CrossRef]
- Dallos, T.; Heiland, G.R.; Strehl, J.; Karonitsch, T.; Gross, W.L.; Moosig, F.; Holl-Ulrich, C.; Distler, J.H.; Manger, B.; Schett, G.; et al. CCL17/Thymus and Activation-Related Chemokine in Churg-Strauss Syndrome. Arthritis Rheum. 2010, 62, 3496–3503. [Google Scholar] [CrossRef]
- Kakinuma, T.; Nakamura, K.; Wakugawa, M.; Mitsui, H.; Tada, Y.; Saeki, H.; Torii, H.; Asahina, A.; Onai, N.; Matsushima, K.; et al. Thymus and Activation-Regulated Chemokine in Atopic Dermatitis: Serum Thymus and Activation-Regulated Chemokine Level is Closely Related With Disease Activity. J. Allergy Clin. Immunol. 2001, 107, 535–541. [Google Scholar] [CrossRef]
- Jahnz-Rozyk, K.; Targowski, T.; Paluchowska, E.; Owczarek, W.; Kucharczyk, A. Serum Thymus and Activation-Regulated Chemokine, Macrophage-Derived Chemokine and Eotaxin as Markers of Severity of Atopic Dermatitis. Allergy 2005, 60, 685–688. [Google Scholar] [CrossRef] [PubMed]
- Machura, E.; Rusek-Zychma, M.; Jachimowicz, M.; Wrzask, M.; Mazur, B.; Kasperska-Zajac, A. Serum TARC and CTACK Concentrations in Children With Atopic Dermatitis, Allergic Asthma, and Urticaria. Pediatr. Allergy Immunol. 2012, 23, 278–284. [Google Scholar] [CrossRef] [PubMed]
- Landheer, J.; de Bruin-Weller, M.; Boonacker, C.; Hijnen, D.; Bruijnzeel-Koomen, C.; Röckmann, H. Utility of Serum Thymus and Activation-Regulated Chemokine as a Biomarker for Monitoring of Atopic Dermatitis Severity. J. Am. Acad. Dermatol. 2014, 71, 1160–1166. [Google Scholar] [CrossRef] [PubMed]
- Jang, M.; Kim, H.; Kim, Y.; Choi, J.; Jeon, J.; Hwang, Y.; Kang, J.S.; Lee, W.J. The Crucial Role of IL-22 and Its Receptor in Thymus and Activation Regulated Chemokine Production and T-Cell Migration by House Dust Mite Extract. Exp. Dermatol. 2016, 25, 598–603. [Google Scholar] [CrossRef] [PubMed]
- Halling, A.S.; Rinnov, M.R.; Ruge, I.F.; Gerner, T.; Ravn, N.H.; Knudgaard, M.H.; Trautner, S.; Loft, N.; Skov, L.; Thomsen, S.F.; et al. Skin TARC/CCL17 Increase Precedes the Development of Childhood Atopic Dermatitis. J. Allergy Clin. Immunol. 2023, 151, 1550–1557.e6. [Google Scholar] [CrossRef] [PubMed]
- Yasukochi, Y.; Nakahara, T.; Abe, T.; Kido-Nakahara, M.; Kohda, F.; Takeuchi, S.; Hagihara, A.; Furue, M. Reduction of Serum TARC Levels in Atopic Dermatitis by Topical Anti-Inflammatory Treatments. Asian Pac. J. Allergy Immunol. 2014, 32, 240–245. [Google Scholar] [CrossRef]
- Saeki, H.; Ohya, Y.; Furuta, J.; Arakawa, H.; Ichiyama, S.; Katsunuma, T.; Katoh, N.; Tanaka, A.; Tsunemi, Y.; Nakahara, T.; et al. English Version of Clinical Practice Guidelines for the Management of Atopic Dermatitis 2021. J. Dermatol. 2022, 49, e315–e375. [Google Scholar] [CrossRef]
- Hirota, T.; Takahashi, A.; Kubo, M.; Tsunoda, T.; Tomita, K.; Sakashita, M.; Yamada, T.; Fujieda, S.; Tanaka, S.; Doi, S.; et al. Genome-Wide Association Study Identifies Eight New Susceptibility Loci for Atopic Dermatitis in the Japanese Population. Nat. Genet. 2012, 44, 1222–1226. [Google Scholar] [CrossRef]
- Wahlgren, C.F. Itch and Atopic Dermatitis: Clinical and Experimental Studies. Acta Derm. Venereol. Suppl. 1991, 165, 1–53. [Google Scholar]
- Williams, H.; Robertson, C.; Stewart, A.; Aït-Khaled, N.; Anabwani, G.; Anderson, R.; Asher, I.; Beasley, R.; Björkstén, B.; Burr, M.; et al. Worldwide Variations in the Prevalence of Symptoms of Atopic Eczema in the International Study of Asthma and Allergies in Childhood. J. Allergy Clin. Immunol. 1999, 103, 125–138. [Google Scholar] [CrossRef]
- Ilic, I.; Stojkovic, A.; Velickovic, V.; Zivanovic Macuzic, I.; Ilic, M. Atopic Dermatitis in Children Under 5: Prevalence Trends in Central, Eastern, and Western Europe. Children 2023, 10, 1275. [Google Scholar] [CrossRef] [PubMed]
- Eichenfield, L.F.; Tom, W.L.; Chamlin, S.L.; Feldman, S.R.; Hanifin, J.M.; Simpson, E.L.; Berger, T.G.; Bergman, J.N.; Cohen, D.E.; Cooper, K.D.; et al. Guidelines of Care For the Management of Atopic Dermatitis: Section 1. Diagnosis and Assessment of Atopic Dermatitis. J. Am. Acad. Dermatol. 2014, 70, 338–351. [Google Scholar] [CrossRef] [PubMed]
- Clinical Laboratories Standards Institute. Evaluation of Precision of Quantitative Measurement Procedures; Approved Guideline, 3rd ed.; CLSI Document ep05-A3; Clinical and Laboratory Standards Institute: Wayne, PA, USA, 2014. [Google Scholar]
- Clinical Laboratories Standards Institute. Evaluation of Total Analytical Error for Quantitative Medical Laboratory Measurement Procedures, 2nd ed.; CLSI Document ep21; Clinical and Laboratory Standards Institute: Wayne, PA, USA, 2016. [Google Scholar]
- Clinical Laboratories Standards Institute. Evaluation of Detection Capability for Clinical Laboratory Measurement Procedures, 2nd ed.; CLSI Document ep17-A2; Clinical and Laboratory Standards Institute: Wayne, PA, USA, 2016. [Google Scholar]
- Clinical Laboratories Standards Institute. Evaluation of Linearity of Quantitative Measurement Procedures, 2nd ed.; CLSI Document ep06; Clinical and Laboratory Standards Institute: Wayne, PA, USA, 2016. [Google Scholar]
- Clinical Laboratories Standards Institute. Interference Testing in Clinical Chemistry, 3rd ed.; CLSI Document ep07; Clinical and Laboratory Standards Institute: Wayne, PA, USA, 2018. [Google Scholar]
- Clinical Laboratories Standards Institute. Measurement Procedure Comparison and Bias Estimation Using Patient Samples, 3rd ed.; CLSI Document ep09c; Clinical and Laboratory Standards Institute: Wayne, PA, USA, 2018. [Google Scholar]
- Sugiyama, M.; Kinoshita, N.; Ide, S.; Nomoto, H.; Nakamoto, T.; Saito, S.; Ishikane, M.; Kutsuna, S.; Hayakawa, K.; Hashimoto, M.; et al. Serum CCL17 Level Becomes a Predictive Marker to Distinguish Between Mild/Moderate and Severe/Critical Disease in Patients With COVID-19. Gene 2021, 766, 145145. [Google Scholar] [CrossRef]
- Sekimoto, Y.; Sekiya, M.; Nojiri, S.; Hayakawa, E.; Masui, Y.; Tajima, M.; Nishino, K.; Nishizaki, Y.; Takahashi, K. IFN-λ3 and CCL17 as Predictors of Disease Progression in Patients With Mild to Moderate COVID-19: A Cohort Study in a Real-World Setting. Respir. Investig. 2023, 61, 153–156. [Google Scholar] [CrossRef] [PubMed]
- Westgard, Q.C. Desirable Specifications for Total Error, Imprecision, and Bias, Derived from Intra- and Inter-Individual Biologic Variation. Available online: http://www.westgard.com/biodatabase1.htm (accessed on 6 May 2023).
- Kataoka, Y. Thymus and Activation-Regulated Chemokine as a Clinical Biomarker in Atopic Dermatitis. J. Dermatol. 2014, 41, 221–229. [Google Scholar] [CrossRef]
- Renert-Yuval, Y.; Thyssen, J.P.; Bissonnette, R.; Bieber, T.; Kabashima, K.; Hijnen, D.; Guttman-Yassky, E. Biomarkers in Atopic Dermatitis—A Review on Behalf of the International Eczema Council. J. Allergy Clin. Immunol. 2021, 147, 1174–1190.e1. [Google Scholar] [CrossRef]
- Chen, F.-H.; Li, N.; Zhang, W.; Zhang, Q.-Y.; Wang, Y.; Ma, Y.-Y.; Li, X.-N.; Bai, J.; Jia, L.-L.; Liu, C.; et al. A Comparison Between China-Made Mindray BS-2000M Biochemical Analyzer and Roche cobas702 Automatic Biochemical Analyzer. Front. Lab. Med. 2017, 1, 98–103. [Google Scholar] [CrossRef]
- Dipalo, M.; Buonocore, R.; Gnocchi, C.; Picanza, A.; Aloe, R.; Lippi, G. Analytical Evaluation of Diazyme Procalcitonin (PCT) Latex-Enhanced Immunoturbidimetric Assay on Beckman Coulter AU5800. Clin. Chem. Lab. Med. 2015, 53, 593–597. [Google Scholar] [CrossRef]
- Yuan, S.; Zheng, N.; Zheng, W.; Jiang, Q.; Qiao, B.; Jing, H.; Li, Y.; Qi, X.; Cao, W.; Song, S. Analytical Evaluation of Reebio Procalcitonin Latex-Enhanced Immunoturbidimetric Assay on the Hitachi Labospect 008AS. Clin. Chem. Lab. Med. 2020, 59, e23–e26. [Google Scholar] [CrossRef]
- Ogawa, K.; Morito, H.; Hasegawa, A.; Daikoku, N.; Miyagawa, F.; Okazaki, A.; Fukumoto, T.; Kobayashi, N.; Kasai, T.; Watanabe, H.; et al. Identification of Thymus and Activation-Regulated Chemokine (TARC/CCL17) as a Potential Marker for Early Indication of Disease and Prediction of Disease Activity in Drug-Induced Hypersensitivity Syndrome (DIHS)/Drug Rash With Eosinophilia and Systemic Symptoms (DRESS). J. Dermatol. Sci. 2013, 69, 38–43. [Google Scholar] [CrossRef]
- Ogawa, K.; Morito, H.; Hasegawa, A.; Miyagawa, F.; Kobayashi, N.; Watanabe, H.; Sueki, H.; Tohyama, M.; Hashimoto, K.; Kano, Y.; et al. Elevated Serum Thymus and Activation-Regulated Chemokine (TARC/CCL17) Relates to Reactivation of Human Herpesvirus 6 in Drug Reaction with Eosinophilia and Systemic Symptoms (DRESS)/Drug-Induced Hypersensitivity Syndrome (DIHS). Br. J. Dermatol. 2014, 171, 425–427. [Google Scholar] [CrossRef] [PubMed]
- Komatsu-Fujii, T.; Chinuki, Y.; Niihara, H.; Hayashida, K.; Ohta, M.; Okazaki, R.; Kaneko, S.; Morita, E. The Thymus and Activation-Regulated Chemokine (TARC) Level in Serum at an Early Stage of a Drug Eruption is a Prognostic Biomarker of Severity of Systemic Inflammation. Allergol. Int. 2018, 67, 90–95. [Google Scholar] [CrossRef] [PubMed]
- Komatsu-Fujii, T.; Kaneko, S.; Chinuki, Y.; Suyama, Y.; Ohta, M.; Niihara, H.; Morita, E. Serum TARC Levels are Strongly Correlated with Blood Eosinophil Count in Patients with Drug Eruptions. Allergol. Int. 2017, 66, 116–122. [Google Scholar] [CrossRef] [PubMed]
- ISO 17511:2020; In Vitro Diagnostic Medical Devices-Requirements for Establishing Metrological Traceability of Values Assigned to Calibrators, Trueness Control Materials and Human Samples. ISO: Geneva, Switzerland, 2020.


| Characteristics | Patients (n = 174) | Healthy Control (n = 201) |
|---|---|---|
| Age *: median (IQR), years | 49 (48) | 54 (9) |
| Sex | ||
| Male | 100 | 84 |
| Female | 52 | 117 |
| Unknown | 22 | 0 |
| Disease | No. (%) | |
| Atopic dermatitis (AD) | 60 (34) | |
| Non-AD eczema | 4 (2) | |
| Non-AD prurigo | 12 (7) | |
| Allergic rhinitis, asthma, | 17 (10) | |
| and food allergy | ||
| Mycosis fungoides | 25 (14) | |
| Sézary syndrome | 2 (1) | |
| Adult T-cell lymphoma | 4 (2) | |
| Drug eruption | 3 (2) | |
| Shingles (herpes zoster) | 3 (2) | |
| Hives (urticaria) | 2 (1) | |
| Bullous pemphigoid | 3 (2) | |
| Psoriasis | 2 (1) | |
| Other ** | 16 (9) | |
| unknown | 22 (13) |
| n = 20 (pg/mL) | Control Samples | Pooled Sera | |||
|---|---|---|---|---|---|
| Low | Mid | High | Low | Mid | |
| Mean | 618 | 1821 | 9830 | 781 | 2045 |
| SDr (pg/mL) | 23 | 30 | 102 | 28 | 18 |
| CVr (%) | 3.8 | 1.7 | 1.0 | 3.6 | 0.9 |
| SDi (pg/mL) | 36 | 40 | - | - | - |
| CVi (%) | 5.4 | 2.1 | - | - | - |
| n = 5 (pg/mL) | Manufacture’s Reference Material | ||
|---|---|---|---|
| Low | Mid | High | |
| Target value | 693 | 1872 | 10,013 |
| Bias (pg/mL) | −56 | −40.2 | −96.6 |
| Bias (%) | −8.1 | −2.1 | −1.0 |
| CV (%) | 3.2 | 1.0 | 0.6 |
| Total error; TE (%) | 13.4 | 3.7 | 1.9 |
| Concordance Rate 92% | Nanopia TARC (Latex Turbidimetric Immunoassay) | ||
|---|---|---|---|
| <DC | ≥DC | ||
| HISCL TARC (chemiluminescent enzyme immunoassay) | <DC * | 16 | 5 |
| ≥DC | 0 | 38 | |
Disclaimer/Publisher’s Note: The statements, opinions and data contained in all publications are solely those of the individual author(s) and contributor(s) and not of MDPI and/or the editor(s). MDPI and/or the editor(s) disclaim responsibility for any injury to people or property resulting from any ideas, methods, instructions or products referred to in the content. |
© 2023 by the authors. Licensee MDPI, Basel, Switzerland. This article is an open access article distributed under the terms and conditions of the Creative Commons Attribution (CC BY) license (https://creativecommons.org/licenses/by/4.0/).
Share and Cite
Yamashita, K.; Takebayashi, S.; Murata, W.; Hirai, N.; Ito, Y.; Mitsui, M.; Saito, M.; Sato, K.; Terada, M.; Niizeki, N.; et al. Analytical Performance of a Novel Latex Turbidimetric Immunoassay, “Nanopia TARC”, for TARC/CCL17 Measurement: A Retrospective Observational Study. Diagnostics 2023, 13, 2935. https://doi.org/10.3390/diagnostics13182935
Yamashita K, Takebayashi S, Murata W, Hirai N, Ito Y, Mitsui M, Saito M, Sato K, Terada M, Niizeki N, et al. Analytical Performance of a Novel Latex Turbidimetric Immunoassay, “Nanopia TARC”, for TARC/CCL17 Measurement: A Retrospective Observational Study. Diagnostics. 2023; 13(18):2935. https://doi.org/10.3390/diagnostics13182935
Chicago/Turabian StyleYamashita, Keita, Shiori Takebayashi, Wataru Murata, Nao Hirai, Yui Ito, Mayuka Mitsui, Mina Saito, Kei Sato, Miyuki Terada, Noriyasu Niizeki, and et al. 2023. "Analytical Performance of a Novel Latex Turbidimetric Immunoassay, “Nanopia TARC”, for TARC/CCL17 Measurement: A Retrospective Observational Study" Diagnostics 13, no. 18: 2935. https://doi.org/10.3390/diagnostics13182935