

Detectability and Volumetric Accuracy of Pulmonary Nodules in Low-Dose Photon-Counting Detector Computed Tomography: An Anthropomorphic Phantom Study
 , , , , , and
Abstract
:1. Introduction
2. Materials and Methods
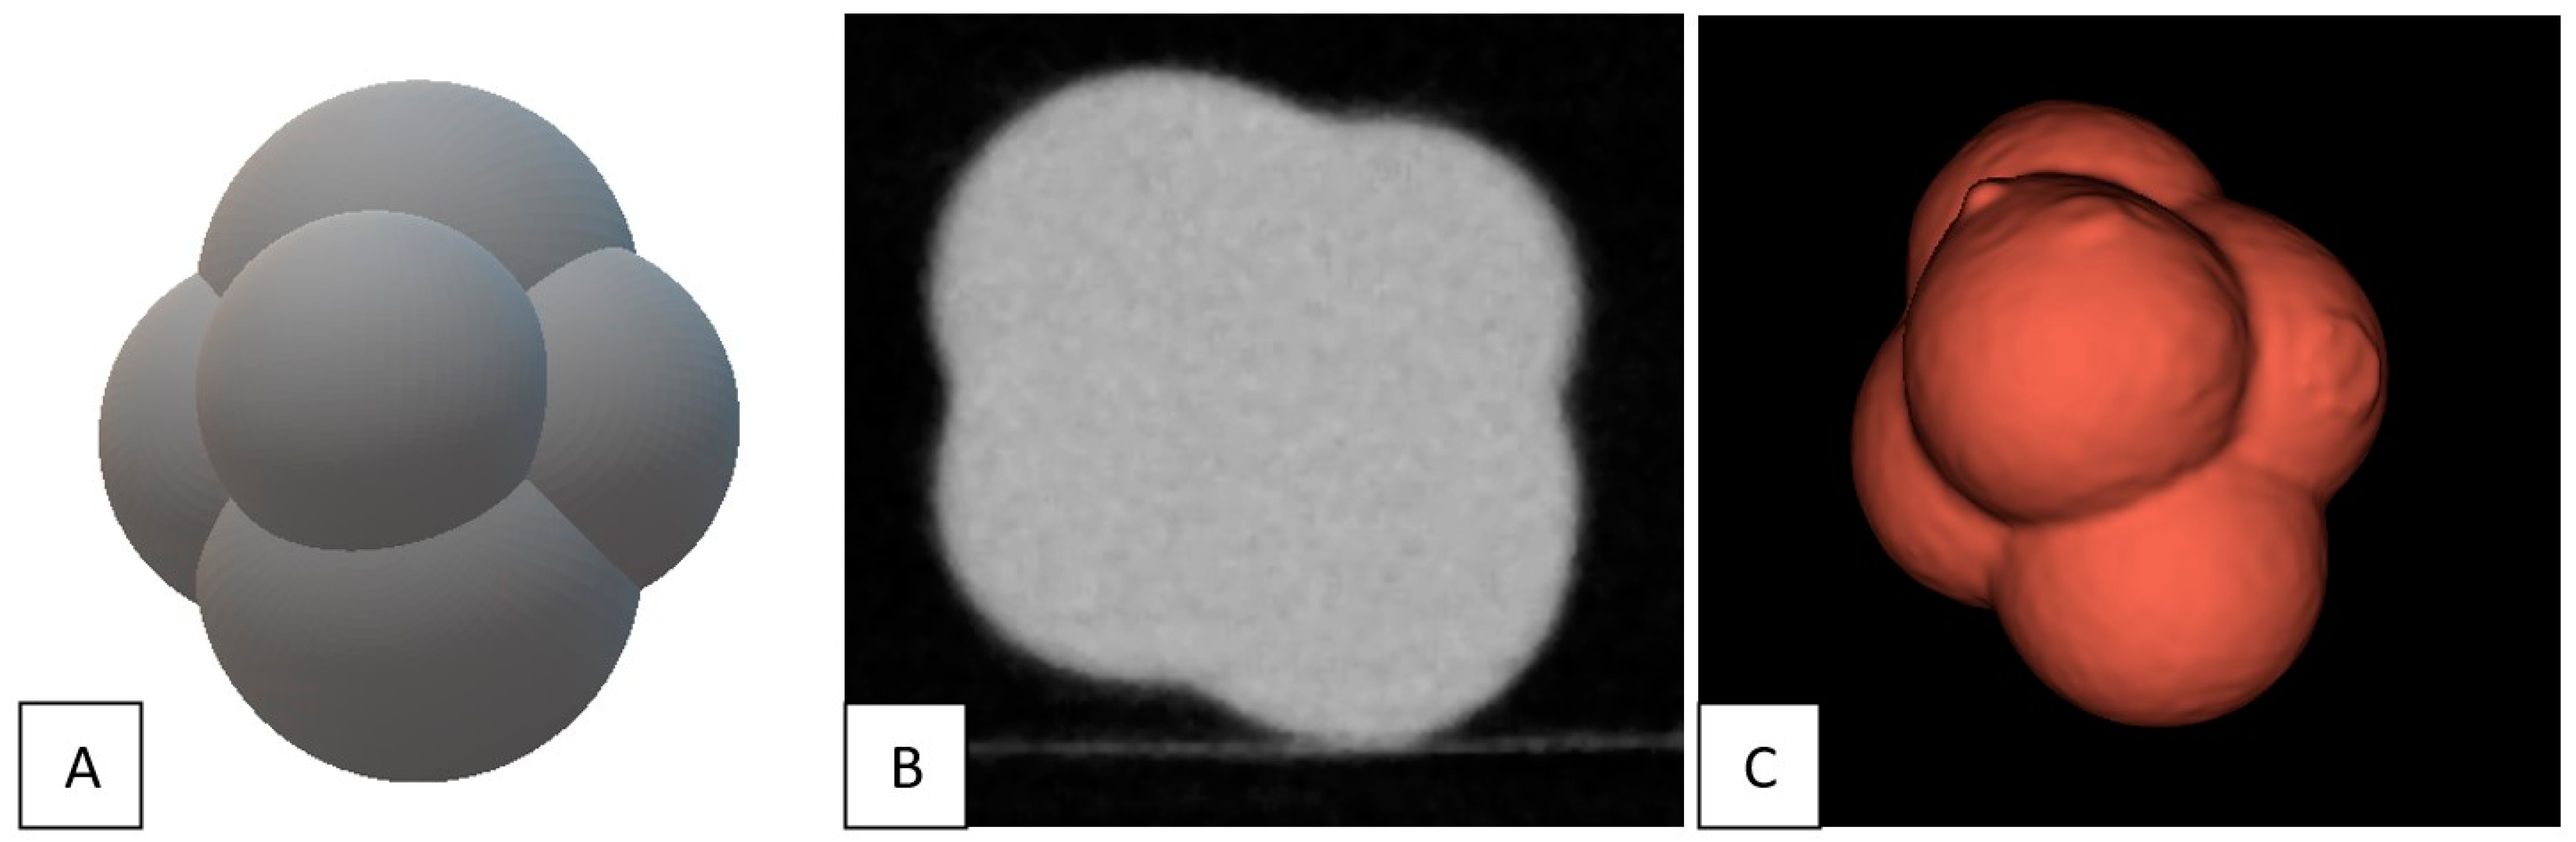
2.1. Phantom and Nodules
2.2. CT Systems and Protocols
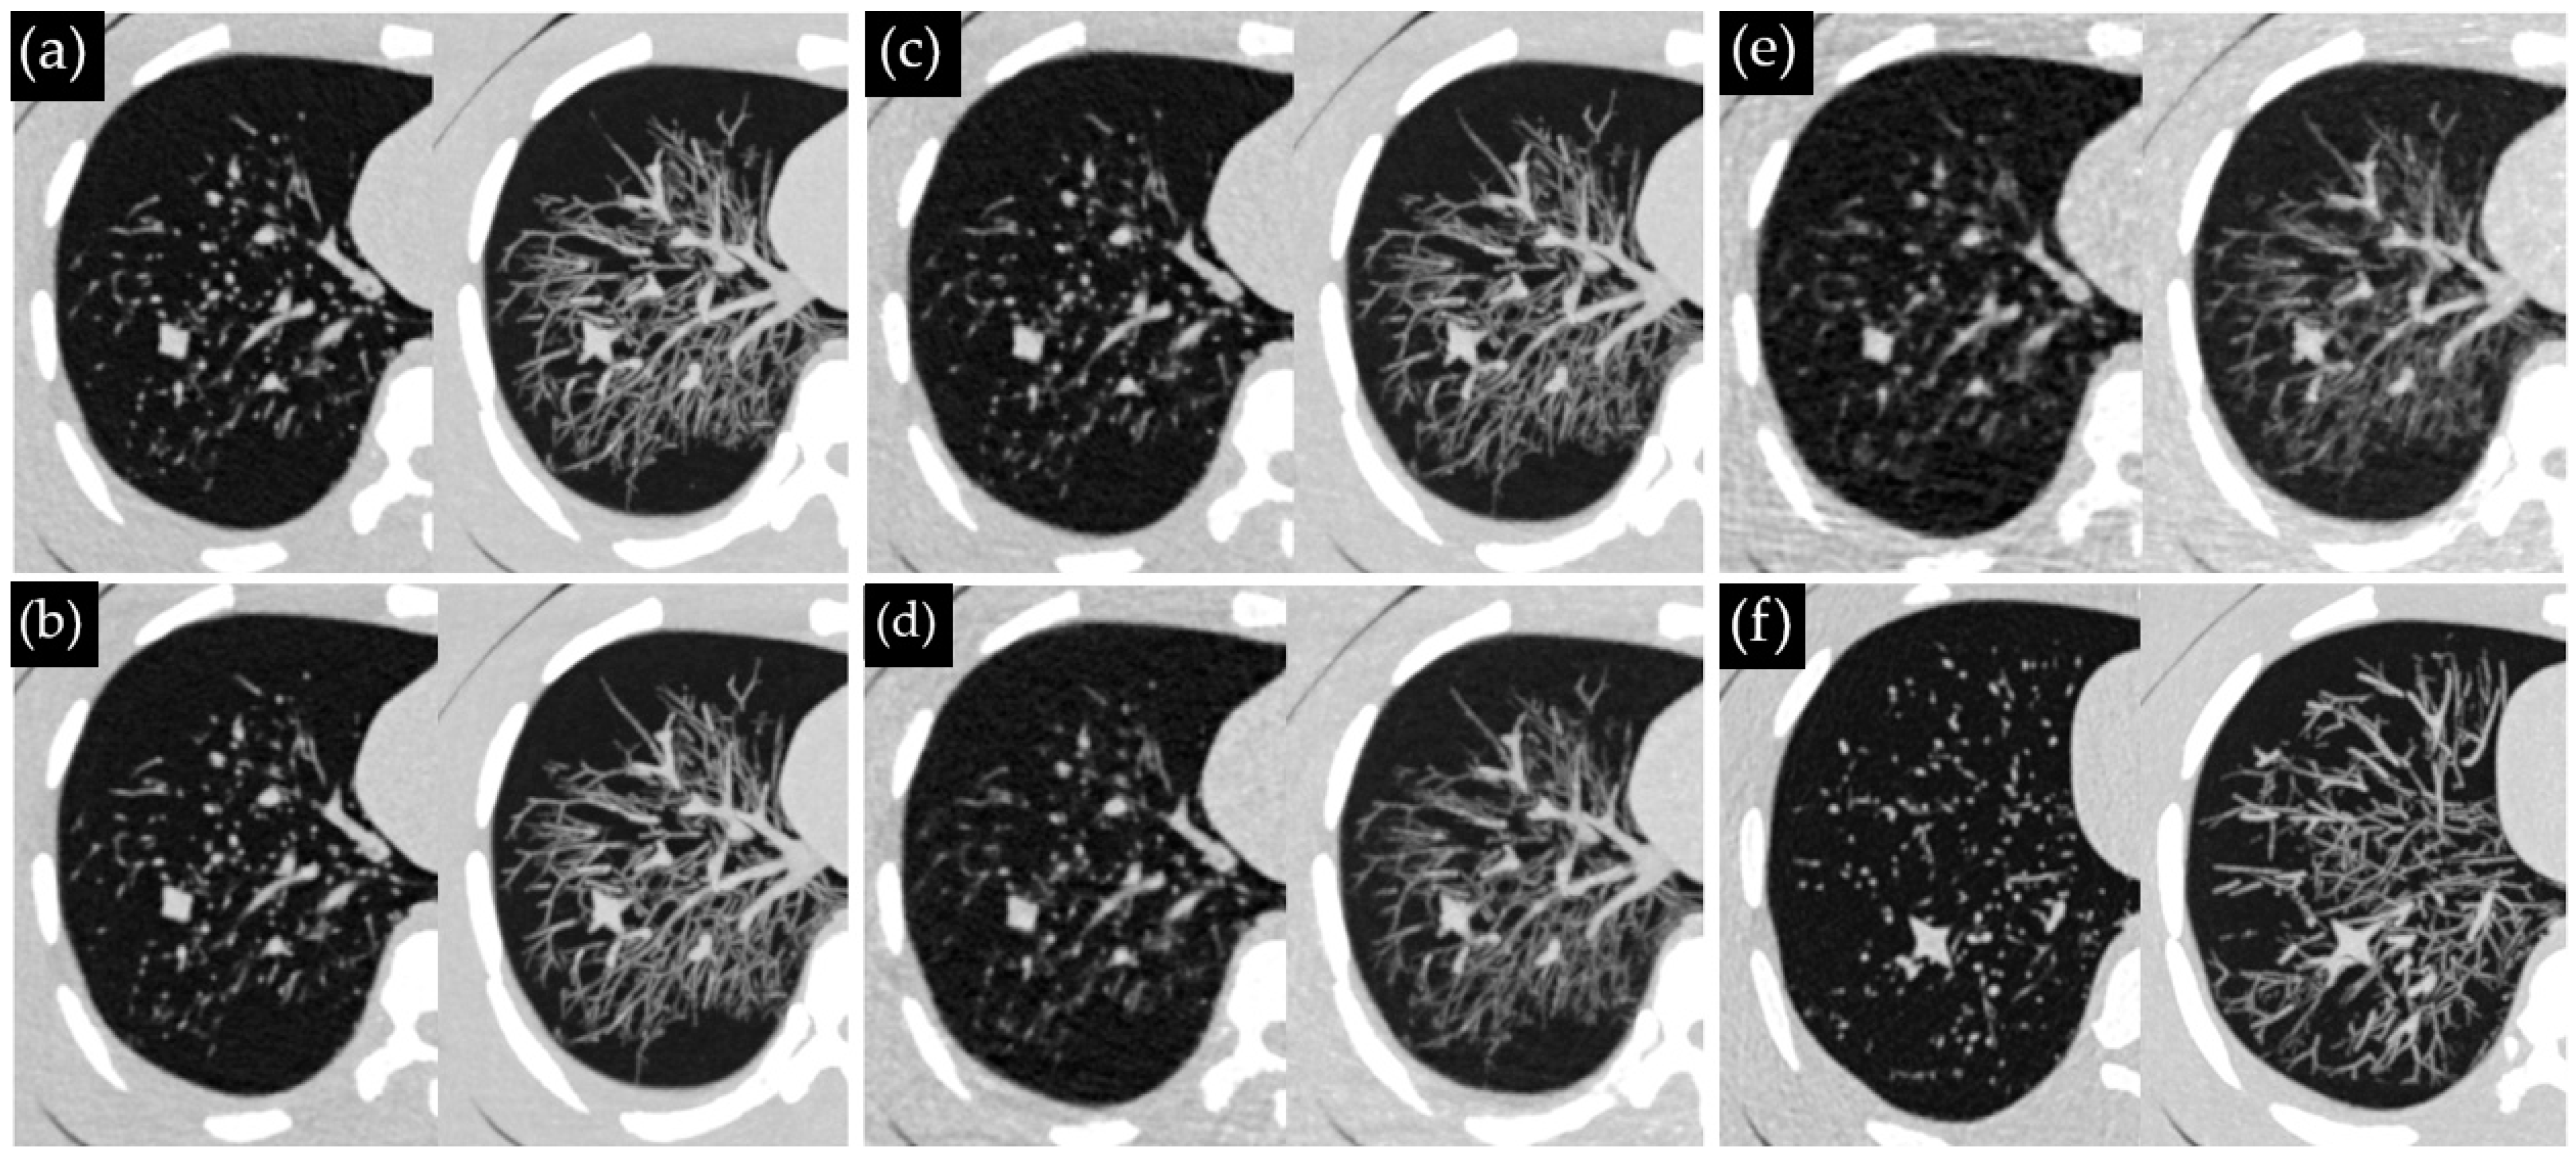
2.3. CT Acquisitions
2.4. Image Analysis
2.5. Statistical Analysis
3. Results
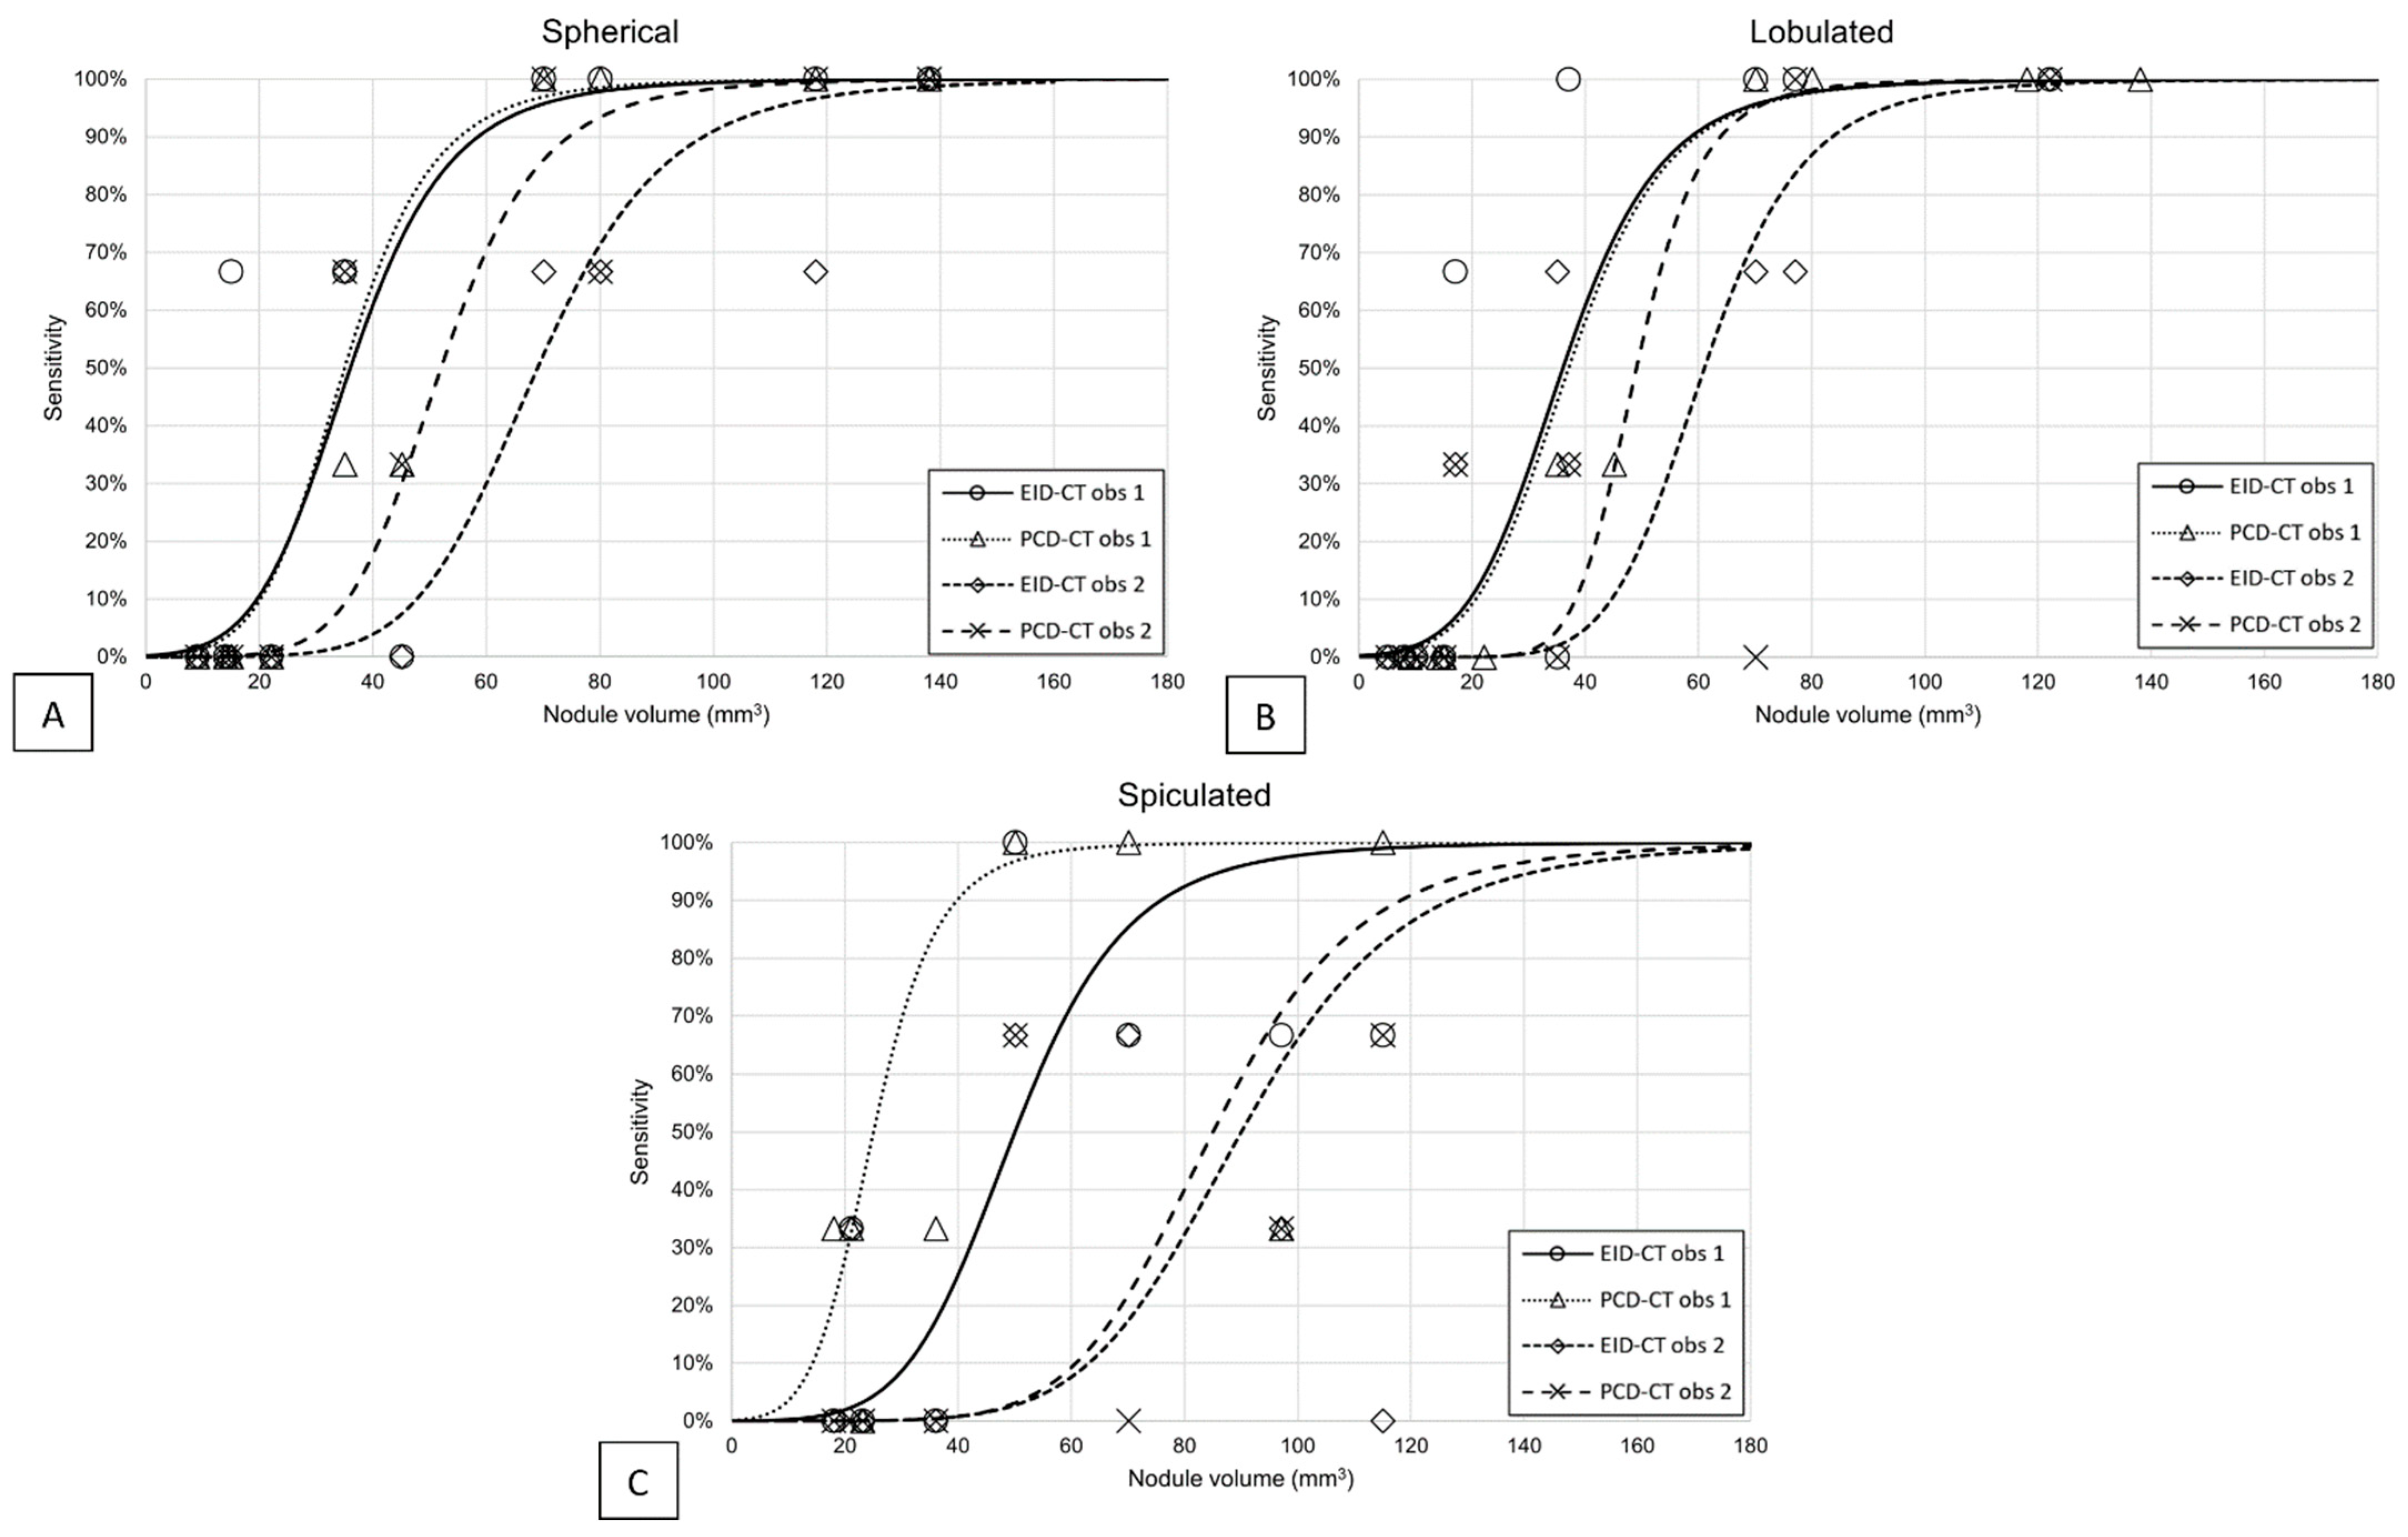
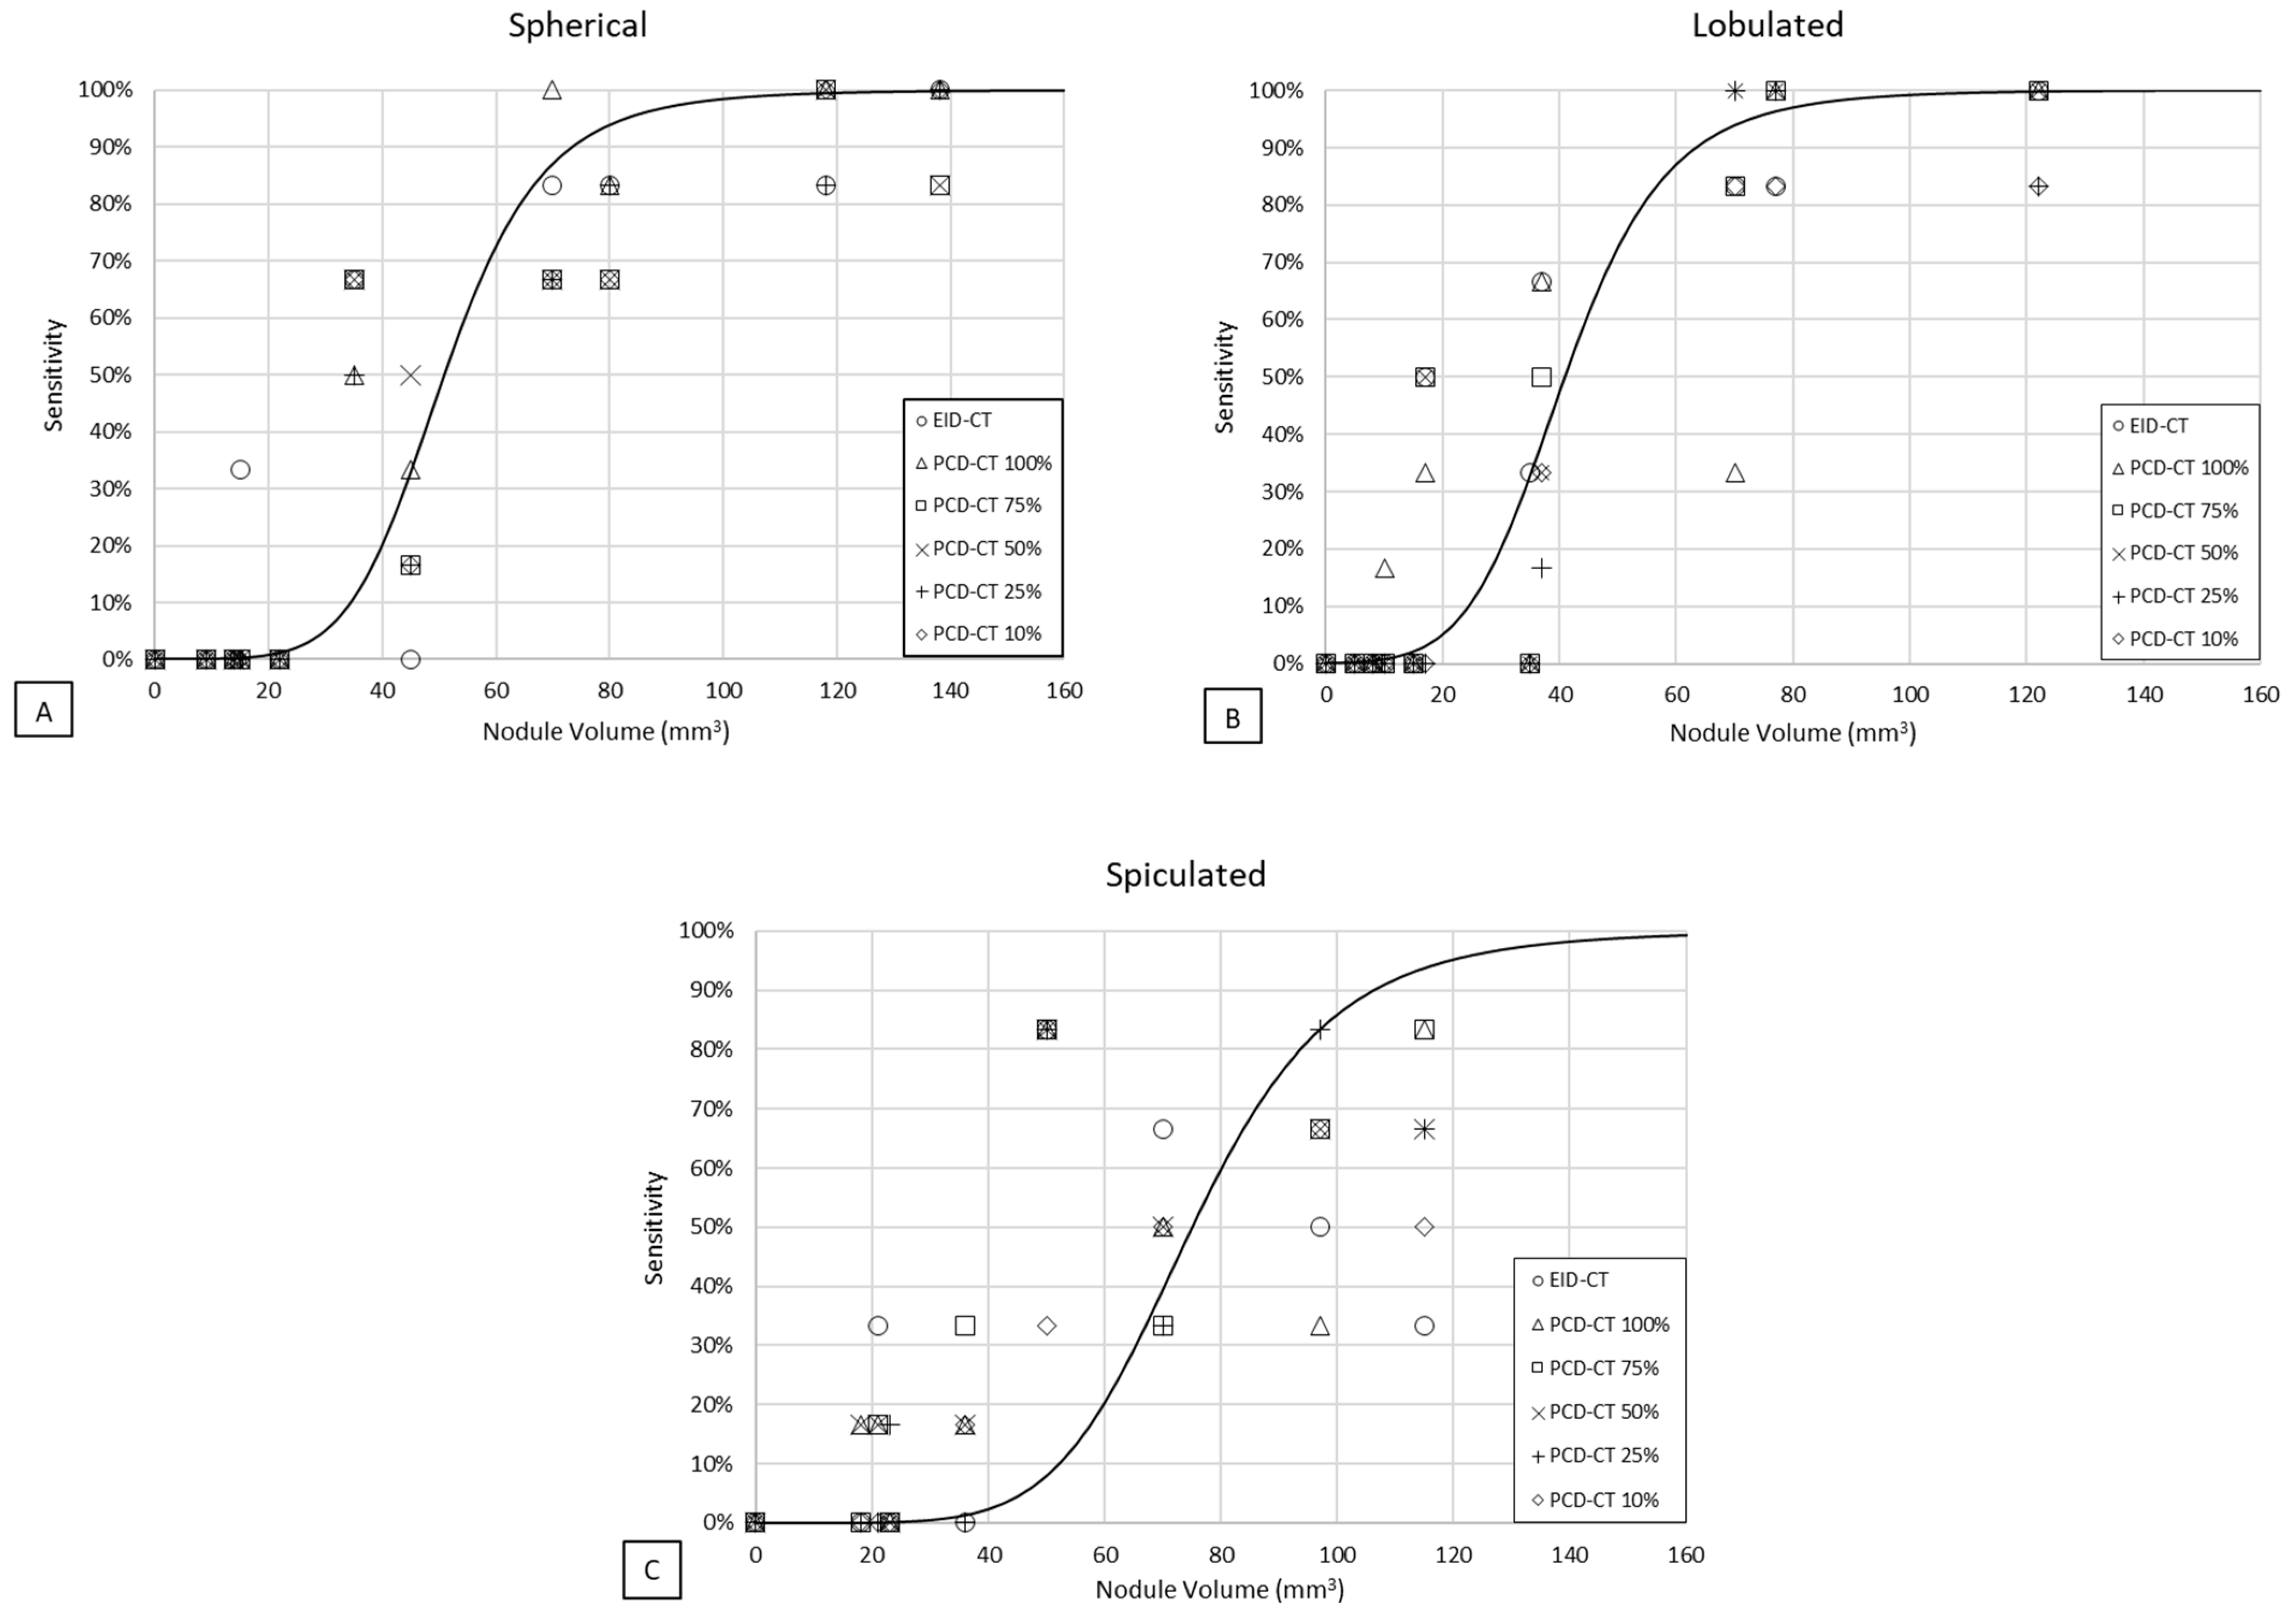
3.1. Detectability
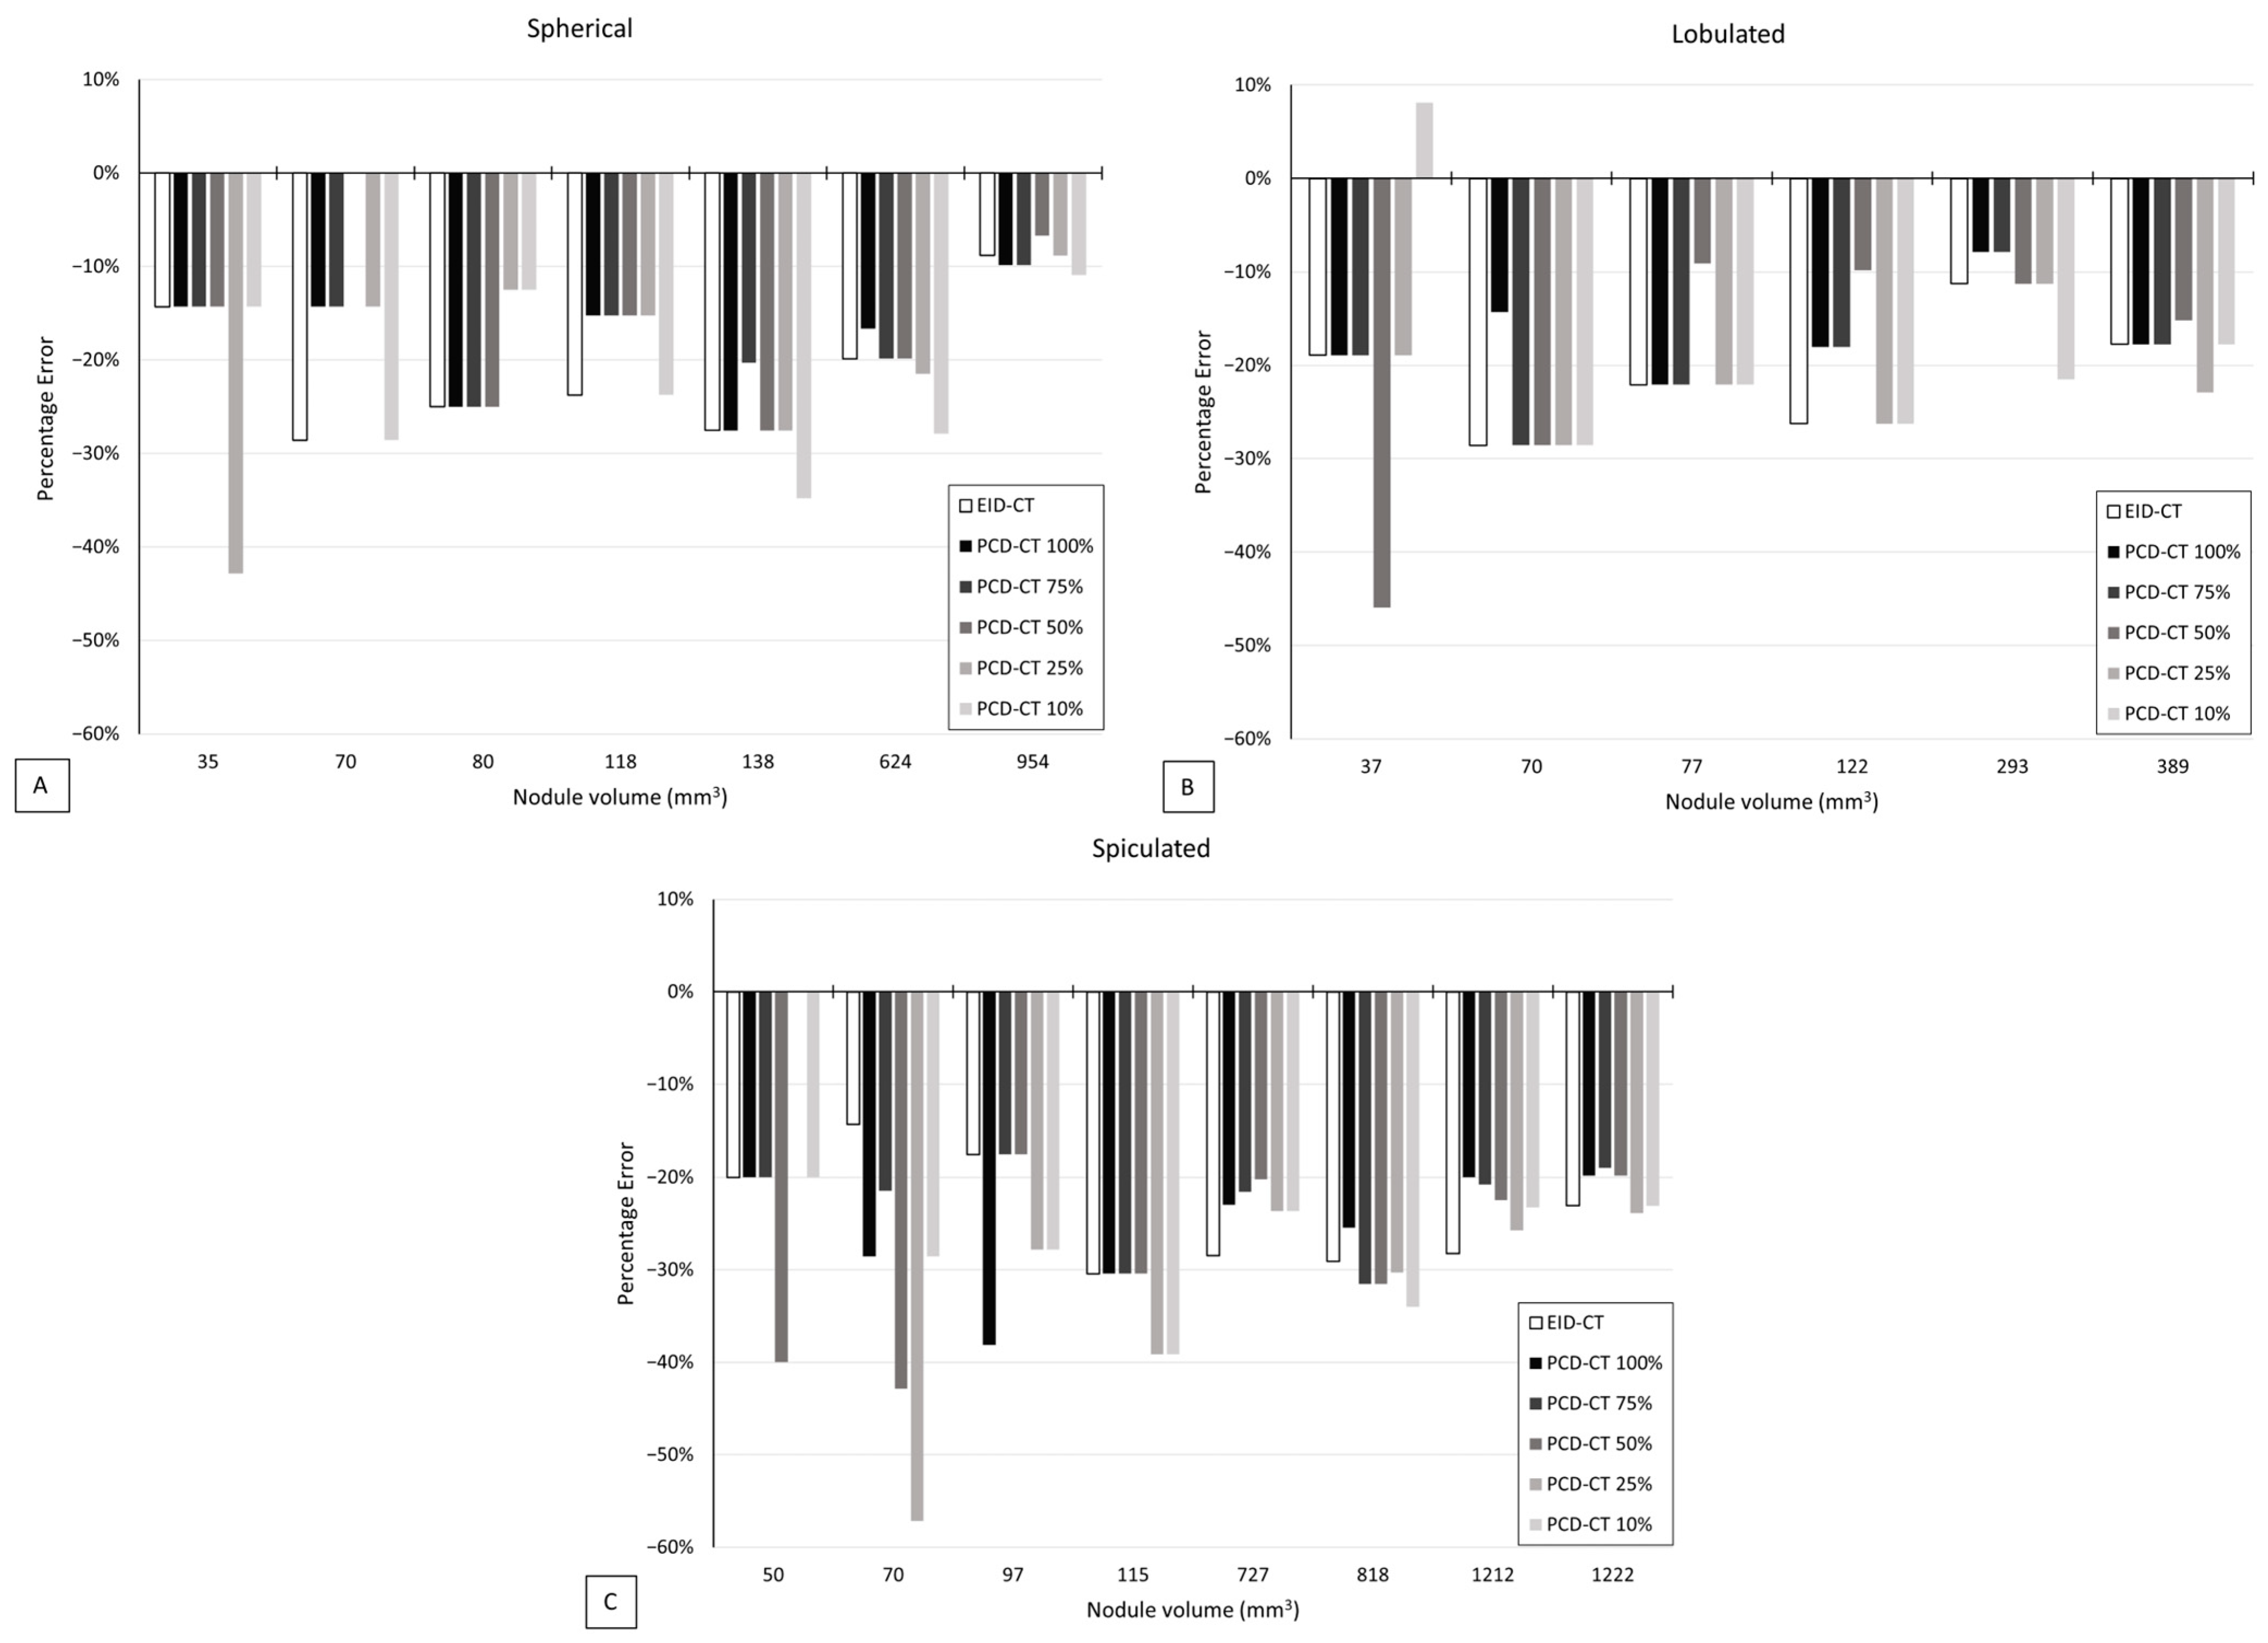
3.2. Volumetric Accuracy
4. Discussion
Author Contributions
Funding
Institutional Review Board Statement
Informed Consent Statement
Data Availability Statement
Acknowledgments
Conflicts of Interest
References
- Sung, H.; Ferlay, J.; Siegel, R.L.; Laversanne, M.; Soerjomataram, I.; Jemal, A.; Bray, F. Global Cancer Statistics 2020: GLOBOCAN Estimates of Incidence and Mortality Worldwide for 36 Cancers in 185 Countries. CA Cancer J. Clin. 2021, 71, 209–249. [Google Scholar] [CrossRef] [PubMed]
- Allemani, C.; Matsuda, T.; Di Carlo, V.; Harewood, R.; Matz, M.; Nikšić, M.; Bonaventure, A.; Valkov, M.; Johnson, C.J.; Estève, J.; et al. Global surveillance of trends in cancer survival 2000–14 (CONCORD-3): Analysis of individual records for 37,513,025 patients diagnosed with one of 18 cancers from 322 population-based registries in 71 countries. Lancet 2018, 391, 1023–1075. [Google Scholar] [CrossRef] [PubMed]
- Siegel, R.; Naishadham, D.; Jemal, A. Cancer statistics, 2012. CA Cancer J. Clin. 2012, 62, 10–29. [Google Scholar] [CrossRef]
- Manser, R.; Lethaby, A.; Irving, L.B.; Stone, C.; Byrnes, G.; Abramson, M.J.; Campbell, D. Screening for lung cancer. Cochrane Database Syst. Rev. 2013, 6, CD001991. [Google Scholar] [CrossRef] [PubMed]
- The National Lung Screening Trial Research Team. Reduced Lung-Cancer Mortality with Low-Dose Computed Tomographic Screening. N. Engl. J. Med. 2011, 365, 395–409. [Google Scholar] [CrossRef]
- de Koning, H.J.; van der Aalst, C.M.; de Jong, P.A.; Scholten, E.T.; Nackaerts, K.; Heuvelmans, M.A.; Lammers, J.-W.J.; Weenink, C.; Yousaf-Khan, U.; Horeweg, N.; et al. Reduced Lung-Cancer Mortality with Volume CT Screening in a Randomized Trial. N. Engl. J. Med. 2020, 382, 503–513. [Google Scholar] [CrossRef]
- The Lung Cancer Policy Network. 2023. Available online: https://www.lungcancerpolicynetwork.com (accessed on 25 September 2023).
- Kazerooni, E.A.; Armstrong, M.R.; Amorosa, J.K.; Hernandez, D.; Liebscher, L.A.; Nath, H.; McNitt-Gray, M.F.; Stern, E.J.; Wilcox, P.A. ACR CT Accreditation Program and the Lung Cancer Screening Program Designation. J. Am. Coll. Radiol. 2016, 13, 30–34. [Google Scholar] [CrossRef]
- Oudkerk, M.; Devaraj, A.; Vliegenthart, R.; Henzler, T.; Prosch, H.; Heussel, C.P.; Bastarrika, G.; Sverzellati, N.; Mascalchi, M.; Delorme, S.; et al. European position statement on lung cancer screening. Lancet Oncol. 2017, 18, 754–766. [Google Scholar] [CrossRef]
- ACR Lung-RADS v2022. 2022. Available online: https://www.acr.org/Clinical-Resources/Reporting-and-Data-Systems/Lung-Rads (accessed on 6 March 2023).
- Rampinelli, C.; De Marco, P.; Origgi, D.; Maisonneuve, P.; Casiraghi, M.; Veronesi, G.; Spaggiari, L.; Bellomi, M. Exposure to low dose computed tomography for lung cancer screening and risk of cancer: Secondary analysis of trial data and risk-benefit analysis. BMJ 2017, 356, j347. [Google Scholar] [CrossRef]
- AAPM Lung Cancer Screening Protocol: 2019 Update. 2019. Available online: https://www.aapm.org/pubs/ctprotocols/documents/lungcancerscreeningct.pdf (accessed on 23 November 2022).
- ESoTI. ESTI Chest CT for Lung Cancer Screening: Technical Standards. 2019. Available online: https://www.myesti.org/content-esti/uploads/ESTI-LCS-technical-standards_2019-06-14.pdf (accessed on 23 November 2022).
- Tortora, M.; Gemini, L.; D’iglio, I.; Ugga, L.; Spadarella, G.; Cuocolo, R. Spectral Photon-Counting Computed Tomography: A Review on Technical Principles and Clinical Applications. J. Imaging 2022, 8, 112. [Google Scholar] [CrossRef]
- Willemink, M.J.; Persson, M.; Pourmorteza, A.; Pelc, N.J.; Fleischmann, D. Photon-counting CT: Technical principles and clinical prospects. Radiology 2018, 289, 293–312. [Google Scholar] [CrossRef] [PubMed]
- Si-Mohamed, S.A.; Miailhes, J.; Rodesch, P.-A.; Boccalini, S.; Lacombe, H.; Leitman, V.; Cottin, V.; Boussel, L.; Douek, P. Spectral Photon-Counting CT Technology in Chest Imaging. J. Clin. Med. 2021, 10, 5757. [Google Scholar] [CrossRef] [PubMed]
- Pérez, S.R.; Marshall, N.W.; Struelens, L.; Bosmans, H. Characterization and validation of the thorax phantom Lungman for dose assessment in chest radiography optimization studies. J. Med. Imaging 2018, 5, 013504. [Google Scholar] [CrossRef]
- Yao, Y.; Guo, B.; Li, J.; Yang, Q.; Li, X.; Deng, L. The influence of a deep learning image reconstruction algorithm on the image quality and auto-analysis of pulmonary nodules at ultra-low dose chest CT: A phantom study. Quant. Imaging. Med. Surg. 2022, 12, 2777–2791. [Google Scholar] [CrossRef]
- Jungblut, L.; Blüthgen, C.; Polacin, M.; Messerli, M.; Schmidt, B.; Euler, A.; Alkadhi, H.M.; Frauenfelder, T.; Martini, K. First performance evaluation of an artificial intelligence-based computer-aided detection system for pulmonary nodule evaluation in dual-source photon-counting detector CT at different low-dose levels. Investig. Radiol. 2022, 57, 108–114. [Google Scholar] [CrossRef]
- Symons, R.; Cork, T.E.; Sahbaee, P.; Fuld, M.K.; Kappler, S.; Folio, L.R.; Bluemke, D.A.; Pourmorteza, A. Low Dose Lung Cancer Screening with Photon-Counting CT: A Feasibility Study. Phys. Med. Biol. 2017, 62, 202. [Google Scholar] [CrossRef]
- Woeltjen, M.M.; Niehoff, J.H.; Michael, A.E.; Horstmeier, S.; Moenninghoff, C.; Borggrefe, J.; Kroeger, J.R. Low-Dose High-Resolution Photon-Counting CT of the Lung: Radiation Dose and Image Quality in the Clinical Routine. Diagnostics 2022, 12, 1441. [Google Scholar] [CrossRef]
- Xie, X.; Willemink, M.J.; de Jong, P.A.; van Ooijen, P.M.A.; Oudkerk, M.; Vliegenthart, R.; Greuter, M.J.W. Small irregular pulmonary nodules in low-dose CT: Observer detection sensitivity and volumetry accuracy. AJR Am. J. Roentgenol. 2014, 202, W202–W209. [Google Scholar] [CrossRef]
- Greffier, J.; Pereira, F.; Hamard, A.; Addala, T.; Beregi, J.P.; Frandon, J. Effect of tin filter-based spectral shaping CT on image quality and radiation dose for routine use on ultralow-dose CT protocols: A phantom study. Diagn. Interv. Imaging 2020, 101, 373–381. [Google Scholar] [CrossRef]
- Brehm, M. Precision Matrix on SOMATOM Force Ease Your Workflow in High-Resolution CT Imaging. 2019. Available online: https://marketing.webassets.siemens-healthineers.com/1800000006548960/cf49726d8be5/shs-ct-news-Precision_Matrix_Whitepaper_1800000006548960.pdf (accessed on 15 December 2022).
- Sartoretti, T.; Racine, D.; Mergen, V.; Jungblut, L.; Monnin, P.; Flohr, T.G.; Martini, K.; Frauenfelder, T.; Alkadhi, H.; Euler, A. Quantum Iterative Reconstruction for Low-Dose Ultra-High-Resolution Photon-Counting Detector CT of the Lung. Diagnostics 2022, 12, 522. [Google Scholar] [CrossRef]
- Fedorov, A.; Beichel, R.; Kalpathy-Cramer, J.; Finet, J.; Fillion-Robin, J.-C.; Pujol, S.; Bauer, C.; Jennings, D.; Fennessy, F.; Sonka, M.; et al. 3D Slicer as an Image Computing Platform for the Quantitative Imaging Network. Magn. Reson. Imaging 2012, 30, 1323. [Google Scholar] [CrossRef] [PubMed]
- Landis, J.R.; Koch, G.G. The Measurement of Observer Agreement for Categorical Data. Biometrics 1977, 33, 159–174. [Google Scholar] [CrossRef]
- Messerli, M.; Kluckert, T.; Knitel, M.; Wälti, S.; Desbiolles, L.; Rengier, F.; Warschkow, R.; Bauer, R.W.; Alkadhi, H.; Leschka, S.; et al. Ultralow dose CT for pulmonary nodule detection with chest X-ray equivalent dose—A prospective intra-individual comparative study. Eur. Radiol. 2017, 27, 3290–3299. [Google Scholar] [CrossRef]
- Takahashi, E.A.; Koo, C.W.; White, D.B.; Lindell, R.M.; Sykes, A.-M.G.; Levin, D.L.; Kuzo, R.S.; Wolf, M.; Bogoni, L.; Carter, R.E.; et al. Prospective pilot evaluation of radiologists and computer-aided pulmonary nodule detection on ultra-low-dose CT with tin filtration. J. Thorac. Imaging 2018, 33, 396–401. [Google Scholar] [CrossRef]
- Milanese, G.; Ledda, R.E.; Sabia, F.; Ruggirello, M.; Sestini, S.; Silva, M.; Sverzellati, N.; Marchianò, A.V.; Pastorino, U. Ultra-low dose computed tomography protocols using spectral shaping for lung cancer screening: Comparison with low-dose for volumetric LungRADS classification. Eur. J. Radiol. 2023, 161, 110760. [Google Scholar] [CrossRef] [PubMed]
- Dunning, C.A.; Marsh, J.F.J.B.; Winfree, T.; Rajendran, K.; Leng, S.; Levin, D.L.; Johnson, T.F.; Fletcher, J.G.; McCollough, C.H.; Yu, L. Accuracy of Nodule Volume and Airway Wall Thickness Measurement Using Low-Dose Chest CT on a Photon-Counting Detector CT Scanner. Invest. Radiol. 2023, 58, 283–292. [Google Scholar] [CrossRef] [PubMed]
- Gierada, D.S.; Pilgram, T.K.; Ford, M.; Fagerstrom, R.M.; Church, T.R.; Nath, H.; Garg, K.; Strollo, D.C. Lung cancer: Interobserver agreement on interpretation of pulmonary findings at low-dose CT screening. Radiology 2008, 246, 265–272. [Google Scholar] [CrossRef]
- Vlahos, I.; Stefanidis, K.; Sheard, S.; Nair, A.; Sayer, C.; Moser, J. Lung cancer screening: Nodule identification and characterization. Transl. Lung Cancer Res. 2018, 7, 288–303. [Google Scholar] [CrossRef]
- Cellina, M.; Cacioppa, L.M.; Cè, M.; Chiarpenello, V.; Costa, M.; Vincenzo, Z.; Pais, D.; Bausano, M.V.; Rossini, N.; Bruno, A.; et al. Artificial Intelligence in Lung Cancer Screening: The Future Is Now. Cancers 2023, 15, 4334. [Google Scholar] [CrossRef]
- Inoue, A.; Johnson, T.F.; Walkoff, L.A.; Levin, D.L.; Hartman, T.E.; Burke, K.A.; Rajendran, K.; Yu, L.; McCollough, C.H.; Fletcher, J.G. Lung Cancer Screening Using Clinical Photon-Counting Detector Computed Tomography and Energy-Integrating-Detector Computed Tomography: A Prospective Patient Study. J. Comput. Assist. Tomogr. 2023, 47, 229–235. [Google Scholar] [CrossRef]
- QIBA. QIBA Profile: Small Lung Nodule Volume Assessment and Monitoring in Low Dose CT Screening. 2018. Available online: https://qibawiki.rsna.org/images/8/86/QIBA_CT_Vol_SmallLungNoduleAssessmentInCTScreening_2018.11.18-clean-4.pdf (accessed on 17 November 2022).
- Gheysens, G.; De Wever, W.; Cockmartin, L.; Bosmans, H.; Coudyzer, W.; De Vuysere, S.; Lefere, M. Detection of pulmonary nodules with scoutless fixed-dose ultra-low-dose CT: A prospective study. Eur. Radiol. 2022, 32, 4437–4445. [Google Scholar] [CrossRef] [PubMed]
- Blackhall, F.; Frese, K.K.; Simpson, K.; Kilgour, E.; Brady, G.; Dive, C. Will liquid biopsies improve outcomes for patients with small-cell lung cancer? Lancet Oncol. 2018, 19, 470–481. [Google Scholar] [CrossRef] [PubMed]
- Casagrande, G.M.S.; Silva, M.d.O.; Reis, R.M.; Leal, L.F. Liquid Biopsy for Lung Cancer: Up-to-Date and Perspectives for Screening Programs. Int. J. Mol. Sci. 2023, 24, 2505. [Google Scholar] [CrossRef] [PubMed]


| Protocol | EID-CT | PCD-CT |
|---|---|---|
| Scan mode | Spiral | Spiral |
| Tube voltage (kVp) | Sn100 (0.6 mm Sn) | Sn100 (0.4 mm Sn) |
| QRM/IQ level | 187 (QRM) | 1, 3, 6, 9, 12 (IQ) |
| CTDIvol (mGy) | 0.79 | 0.07, 0.20, 0.41, 0.61, 0.81 |
| Rotation time (s) | 0.5 | 0.5 |
| Pitch | 1.2 | 1.2 |
| Detector configuration | 192 × 0.6 mm | 144 × 0.4 mm |
| Slice thickness/increment (mm) | 1.0/0.7 | 1.0/0.7 |
| FOV (mm) | 300 | 300 |
| VMI reconstruction | - | 70 keV |
| Reconstruction kernel | Br40, Qr59 | Br40, Qr60 |
| Image matrix size | 512 × 512 | 512 × 512, 768 × 768 |
| Reconstruction algorithm and strength | ADMIRE-3 | QIR-3 |
| Dependent Variables | ||||
|---|---|---|---|---|
| Independent Variables | Sensitivity | Volumetric Accuracy | ||
| t-Value | p | t-Value | p | |
| Scanner type | 0.12 | 0.91 | 1.04 | 0.31 |
| PCD-CT dose | −0.93 | 0.35 | 1.52 | 0.13 |
| Observer | −3.49 | <0.001 | N/A | N/A |
| Physical volume | 14.82 | <0.001 | 2.03 | <0.05 |
| Shape (spiculated) | −2.51 | <0.05 | −2.18 | <0.05 |
| Density | 1.00 | 0.32 | 1.52 | 0.13 |
Disclaimer/Publisher’s Note: The statements, opinions and data contained in all publications are solely those of the individual author(s) and contributor(s) and not of MDPI and/or the editor(s). MDPI and/or the editor(s) disclaim responsibility for any injury to people or property resulting from any ideas, methods, instructions or products referred to in the content. |
© 2023 by the authors. Licensee MDPI, Basel, Switzerland. This article is an open access article distributed under the terms and conditions of the Creative Commons Attribution (CC BY) license (https://creativecommons.org/licenses/by/4.0/).
Share and Cite
Hop, J.F.; Walstra, A.N.H.; Pelgrim, G.-J.; Xie, X.; Panneman, N.A.; Schurink, N.W.; Faby, S.; van Straten, M.; de Bock, G.H.; Vliegenthart, R.; et al. Detectability and Volumetric Accuracy of Pulmonary Nodules in Low-Dose Photon-Counting Detector Computed Tomography: An Anthropomorphic Phantom Study. Diagnostics 2023, 13, 3448. https://doi.org/10.3390/diagnostics13223448
Hop JF, Walstra ANH, Pelgrim G-J, Xie X, Panneman NA, Schurink NW, Faby S, van Straten M, de Bock GH, Vliegenthart R, et al. Detectability and Volumetric Accuracy of Pulmonary Nodules in Low-Dose Photon-Counting Detector Computed Tomography: An Anthropomorphic Phantom Study. Diagnostics. 2023; 13(22):3448. https://doi.org/10.3390/diagnostics13223448
Chicago/Turabian StyleHop, Joost F., Anna N. H. Walstra, Gert-Jan Pelgrim, Xueqian Xie, Noor A. Panneman, Niels W. Schurink, Sebastian Faby, Marcel van Straten, Geertruida H. de Bock, Rozemarijn Vliegenthart, and et al. 2023. "Detectability and Volumetric Accuracy of Pulmonary Nodules in Low-Dose Photon-Counting Detector Computed Tomography: An Anthropomorphic Phantom Study" Diagnostics 13, no. 22: 3448. https://doi.org/10.3390/diagnostics13223448