1. Introduction
Portal hypertension (PH) is a major consequence of liver cirrhosis (LC) associated with its most grave complications including bleeding from EVs, ascites, and hepatic encephalopathy. Research shows that the presence of CSPH (defined as HVPG > 10 mmHg) is a strong predictor for death in patients with cACLD [
1]. Traditionally the “gold standard” for the estimation of PH has been the measurement of the hepatic venous pressure gradient (HVPG) [
2]. Though considered invaluable in clinical research settings, its usage in real clinical practice is generally narrowed by its invasiveness [
2]. For the establishment of CSPH, the most extensively utilized method is diagnostic UE to screen for the presence and severity of EVs. According to recent Baveno VII consensus guidelines on PH, in patients with cACLD, the emphasis should be set on the non-invasive evaluation of PH. It is postulated that the presence of CSPH is highly unlikely in patients with LSM < 15 kPa (measured through Transient elastography (TE)) and PLT > 150 × 10
9/L (sensitivity and negative predictive value (NPV) > 90%), therefore such patients could be followed annually by non-invasive techniques [
2]. In patients unfit for treatment with non-selective beta-blockers (NSBB) screening endoscopy is not mandatory as well, if LSM is <20 kPa and PLT > 150 × 10
9/L [
2]. Of note, the etiology of liver damage is also a factor, the guidelines being applicable mainly in viral, alcoholic liver disease, and non-alcoholic steatohepatitis (NASH) with BMI < 30 kg/m
2. Splenic stiffness measurement (SSM) is also used as a surrogate marker for PH, with cut-off values for ruling out and in CSPH being <21 kPa and >50 kPa respectively.
As already outlined, the main diagnostic modality to evaluate tissue stiffness is ultrasound elastography. Elasticity is the physical feature of substances to regain their original state after the force that caused their deformation has stopped [
3]. Recently, several elastographic methods for non-invasive assessment of liver fibrosis have been studied: transient elastography, point shear-wave elastography (pSWE), two-dimensional shear wave elastography (2D-SWE), and magnetic resonance elastography (MRE). In most recent Baveno VII guidelines the chief diagnostic modality utilized is TE. The guideline highlights the need to establish reference values for LS in other elastographic techniques, namely pSWE and 2D-SWE. The 2D-SWE technique has numerous theoretical advantages over other elastographic techniques particularly the large size of the explored area, the ability to simultaneously visualize the region of interest (ROI) in B-mode and to monitor and evaluate the quality of the measurements in real-time [
3,
4]. Nevertheless, 2D-SWE has not yet been extensively used in clinical routine, and data regarding its applicability for the evaluation of CSPH and EVs are scarce [
4].
In the current study, we evaluated the diagnostic potential of 2D-SWE for the non-invasive diagnosis of EVs. As a secondary endpoint, we studied the correlation of shear wave velocity values (SWV) with various factors including sex, presence of ascites, and liver enzymes. Eventually, cut-off values for the diagnosis of EVs and HREVs were estimated.
2. Materials and Methods
Study design: Prospective single-center comparative study. A total of 86 patients from among the patients admitted to University Hospital “Kaspela” for diagnosis and/or treatment of liver cirrhosis between January and November 2021 were included. Subjects were divided into two groups as follows: (1). Compensated liver cirrhosis, (2). Decompensated liver cirrhosis. The presence of either ascites, prior episode of variceal hemorrhage, hepatic encephalopathy, or jaundice were considered as criteria for inclusion in the dLC group, while the rest were selected for the cLC group. Patients with thrombosis of the portal venous system, prior endoscopic band ligation (EBL), obstructive jaundice, or verified malignant lesions in the liver we considered ineligible and were excluded from the analysis.
Each of the participants underwent a physical examination and biochemical testing including alanine aminotransferase (ALAT), aspartate aminotransferase (ASAT), alkaline phosphatase, gamma-glutamyl transferase, bilirubin, and platelet count. Each participant underwent conventional abdominal ultrasound in B-mode to assess the size, shape, and structure of the liver. Standard liver measurements were performed: the ventro-dorsal size of the liver (mm) on the right midclavicular line, portal vein size (mm), and portal blood flow velocity by Doppler US (m/sec). The presence of ascites and visible portosystemic anastomoses was also recorded.
LSM was performed by 2D-SWE using the QElaXto
® software, version F104513Q101701 of an Esaote MyLab™ 9 eXP (Genoa, Italy) ultrasound device. A convex C1-8IQ appleprobe transducer was used. Ten elastographic measurements were performed with a validation criterion-median interquartile range (IQR/M) <30% in accordance with current recommendations [
5].
LS was assessed elastographically by examining the right hepatic lobe of each patient through the intercostal space. Patients were in a supine position with their right arm at maximum abduction in compliance with the latest requirements for quality measurement [
6,
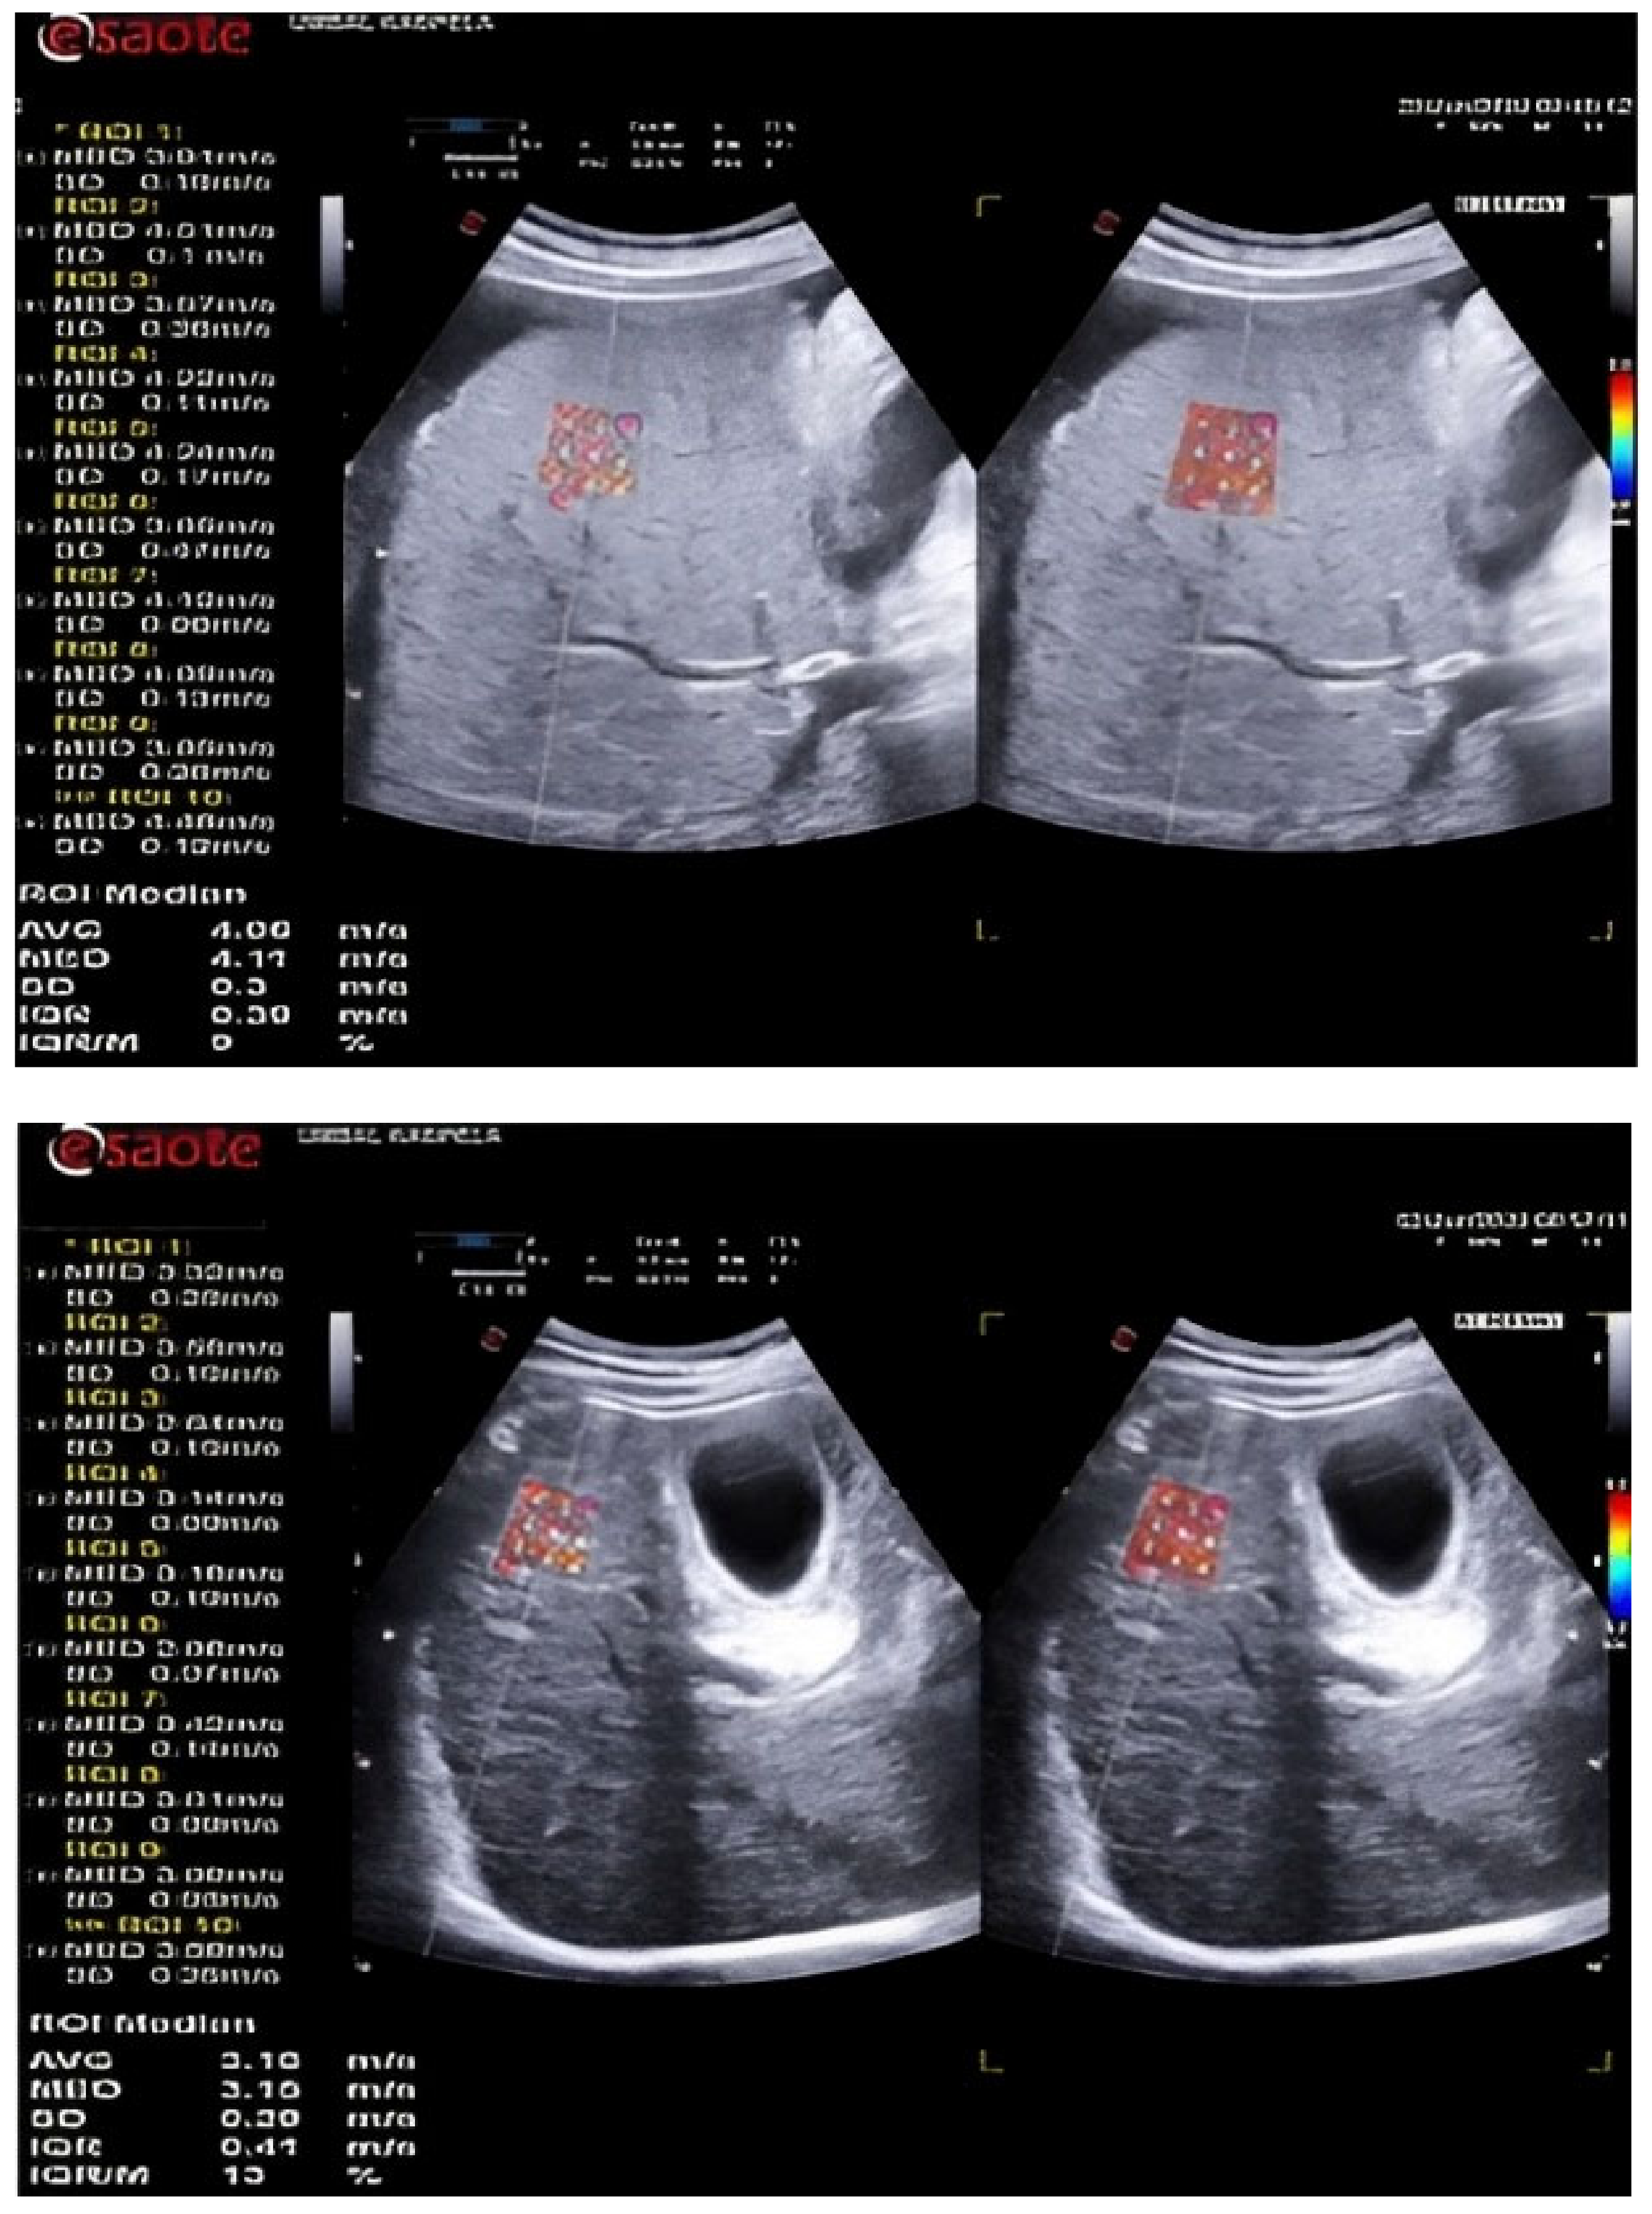
7]. During standard B-mode, an assessment area was selected with no large blood vessels. Location at a distance of at least 1.5 cm from the Glisson’s capsule was selected and the ROI size was fixed by the device. The patient was instructed to hold his breath while the values were calculated (
Figure 1). If the colour box was not filled by > 50% of its surface or if breathing was uncontrolled, the elastogram was discarded and a new acquisition was attempted. Ten LSMs were obtained, and the median value in m/s was used for analysis.
Upper endoscopy was utilized as a reference method to evaluate the presence and grade of EVs. An endoscopic processor Olympus Evis Exera III (Hamburg, Germany), coupled with the Olympus GIF-HQ190 (Hamburg Germany) therapeutic gastroscope, was used. Grading of EVs was performed in concordance with the Paquet classification (
Table 1) [
8]. Moderate insufflation was used. All procedures were performed by a single endoscopist to ensure adequate comparability.
3. Results
A total of 86 patients were examined and stratified into two groups in accordance with the outlined criteria: 32 with cLC and 54 with dLC. Demographic and lab data of the patients are presented in
Table 2The average age of the studied population was 63 ± 8.03 years with an age range between 48 and 81 years. Males were significantly prevalent with a relative share of 60.5% (N = 52) compared to women–39.5% (N = 34), p = 0.009. The sex distribution is similar in the two groups of patients: compensated cirrhosis—59.40% men; decompensated cirrhosis — 61% men, with no significant difference (p = 0.874). The average age of patients with compensated cirrhosis (65.50 ± 9.13 years) was higher than that of patients with decompensated cirrhosis (61.54 ± 6.97 years), p = 0.039.
Body mass index (BMI) for the whole group had an average value of 28.78 ± 2.69 kg/m2 with a minimum value of 22.60 kg/m2 and a maximum value of 35.30 kg/m2. In patients with decompensated cirrhosis, significantly higher BMI values were established (29.36 ± 2.64 kg/m2) compared to patients with compensated cirrhosis (27.80 ± 2.51 kg/m2), p = 0.009.
The biochemical tests ASAT, ALAT, and AP showed similar values in the whole group and in both subgroups with no significant difference (p > 0.05 for the three indicators). Significantly higher GGT values were observed in patients with compensated cirrhosis (136.22 ± 94.10 IU/L) compared to those with decompensated cirrhosis (87.80 ± 48.67 IU/L), p = 0.01. Of note though, in both groups, the values were much higher than the upper reference limit (30 IU/L).
UE established EVs in 47 of 86 patients (54.65%). Based on Paquet classification patients with EVs were distributed as follows: first grade—9 patients, second grade—9 patients, third grade—6 patients, and fourth grade—23 patients.
As anticipated in patients with dLC, consistently higher mean SWV values were found–2.41 ± 0.31 m/s compared to 2.24 ± 0.13 m/s for patients with cLC, p = 0.001.
With a cut-off value of 2.18m/s 2D-SWE showing an accuracy of 71.80% for the identification of EVs (irrespective of grade) (AUC = 0.718,
p < 0.001), with 68% sensitivity and 57% specificity. The second analysis, investigating the diagnostic value of 2D-SWE for the distinction between HREVs (grade 4) and the other three grades and patients with no EVs showed 100% accuracy (AUC = 1000,
p < 0.001). The cut-off value for the diagnosis of grade 4 varices was set at 2.49 m/s with 100% sensitivity and 100% specificity (
Table 3). Of note, the diagnostic accuracy of 2D-SWE was comparable between the investigated groups (
p = 0.360), which justified the calculation of a single cut-off value for both groups.
ROC curves depicting the performance of 2D-SWE for the diagnosis of EVs and HREVs are presented on
Figure 2.
As a secondary endpoint, the correlation of SWV values measured through 2D-SWE with certain factors was estimated. In both studied groups, sex was found to have no significant effect on SWV values. Men showed a higher average value (2.39 ± 0.30 m/s) than women (2.29 ± 0.22 m/s) but with a minimum difference of 0.10 m/s and no statistical significance, p = 0.08.
A similar comparative analysis was performed between patients with ascites (N = 27) and those without ascites (N = 59). In the group with ascites, a significantly higher value of SWV (2.48 ± 0.31 m/s) was found in comparison with the group without ascites (2.28 ± 0.23 m/s), p = 0.006.
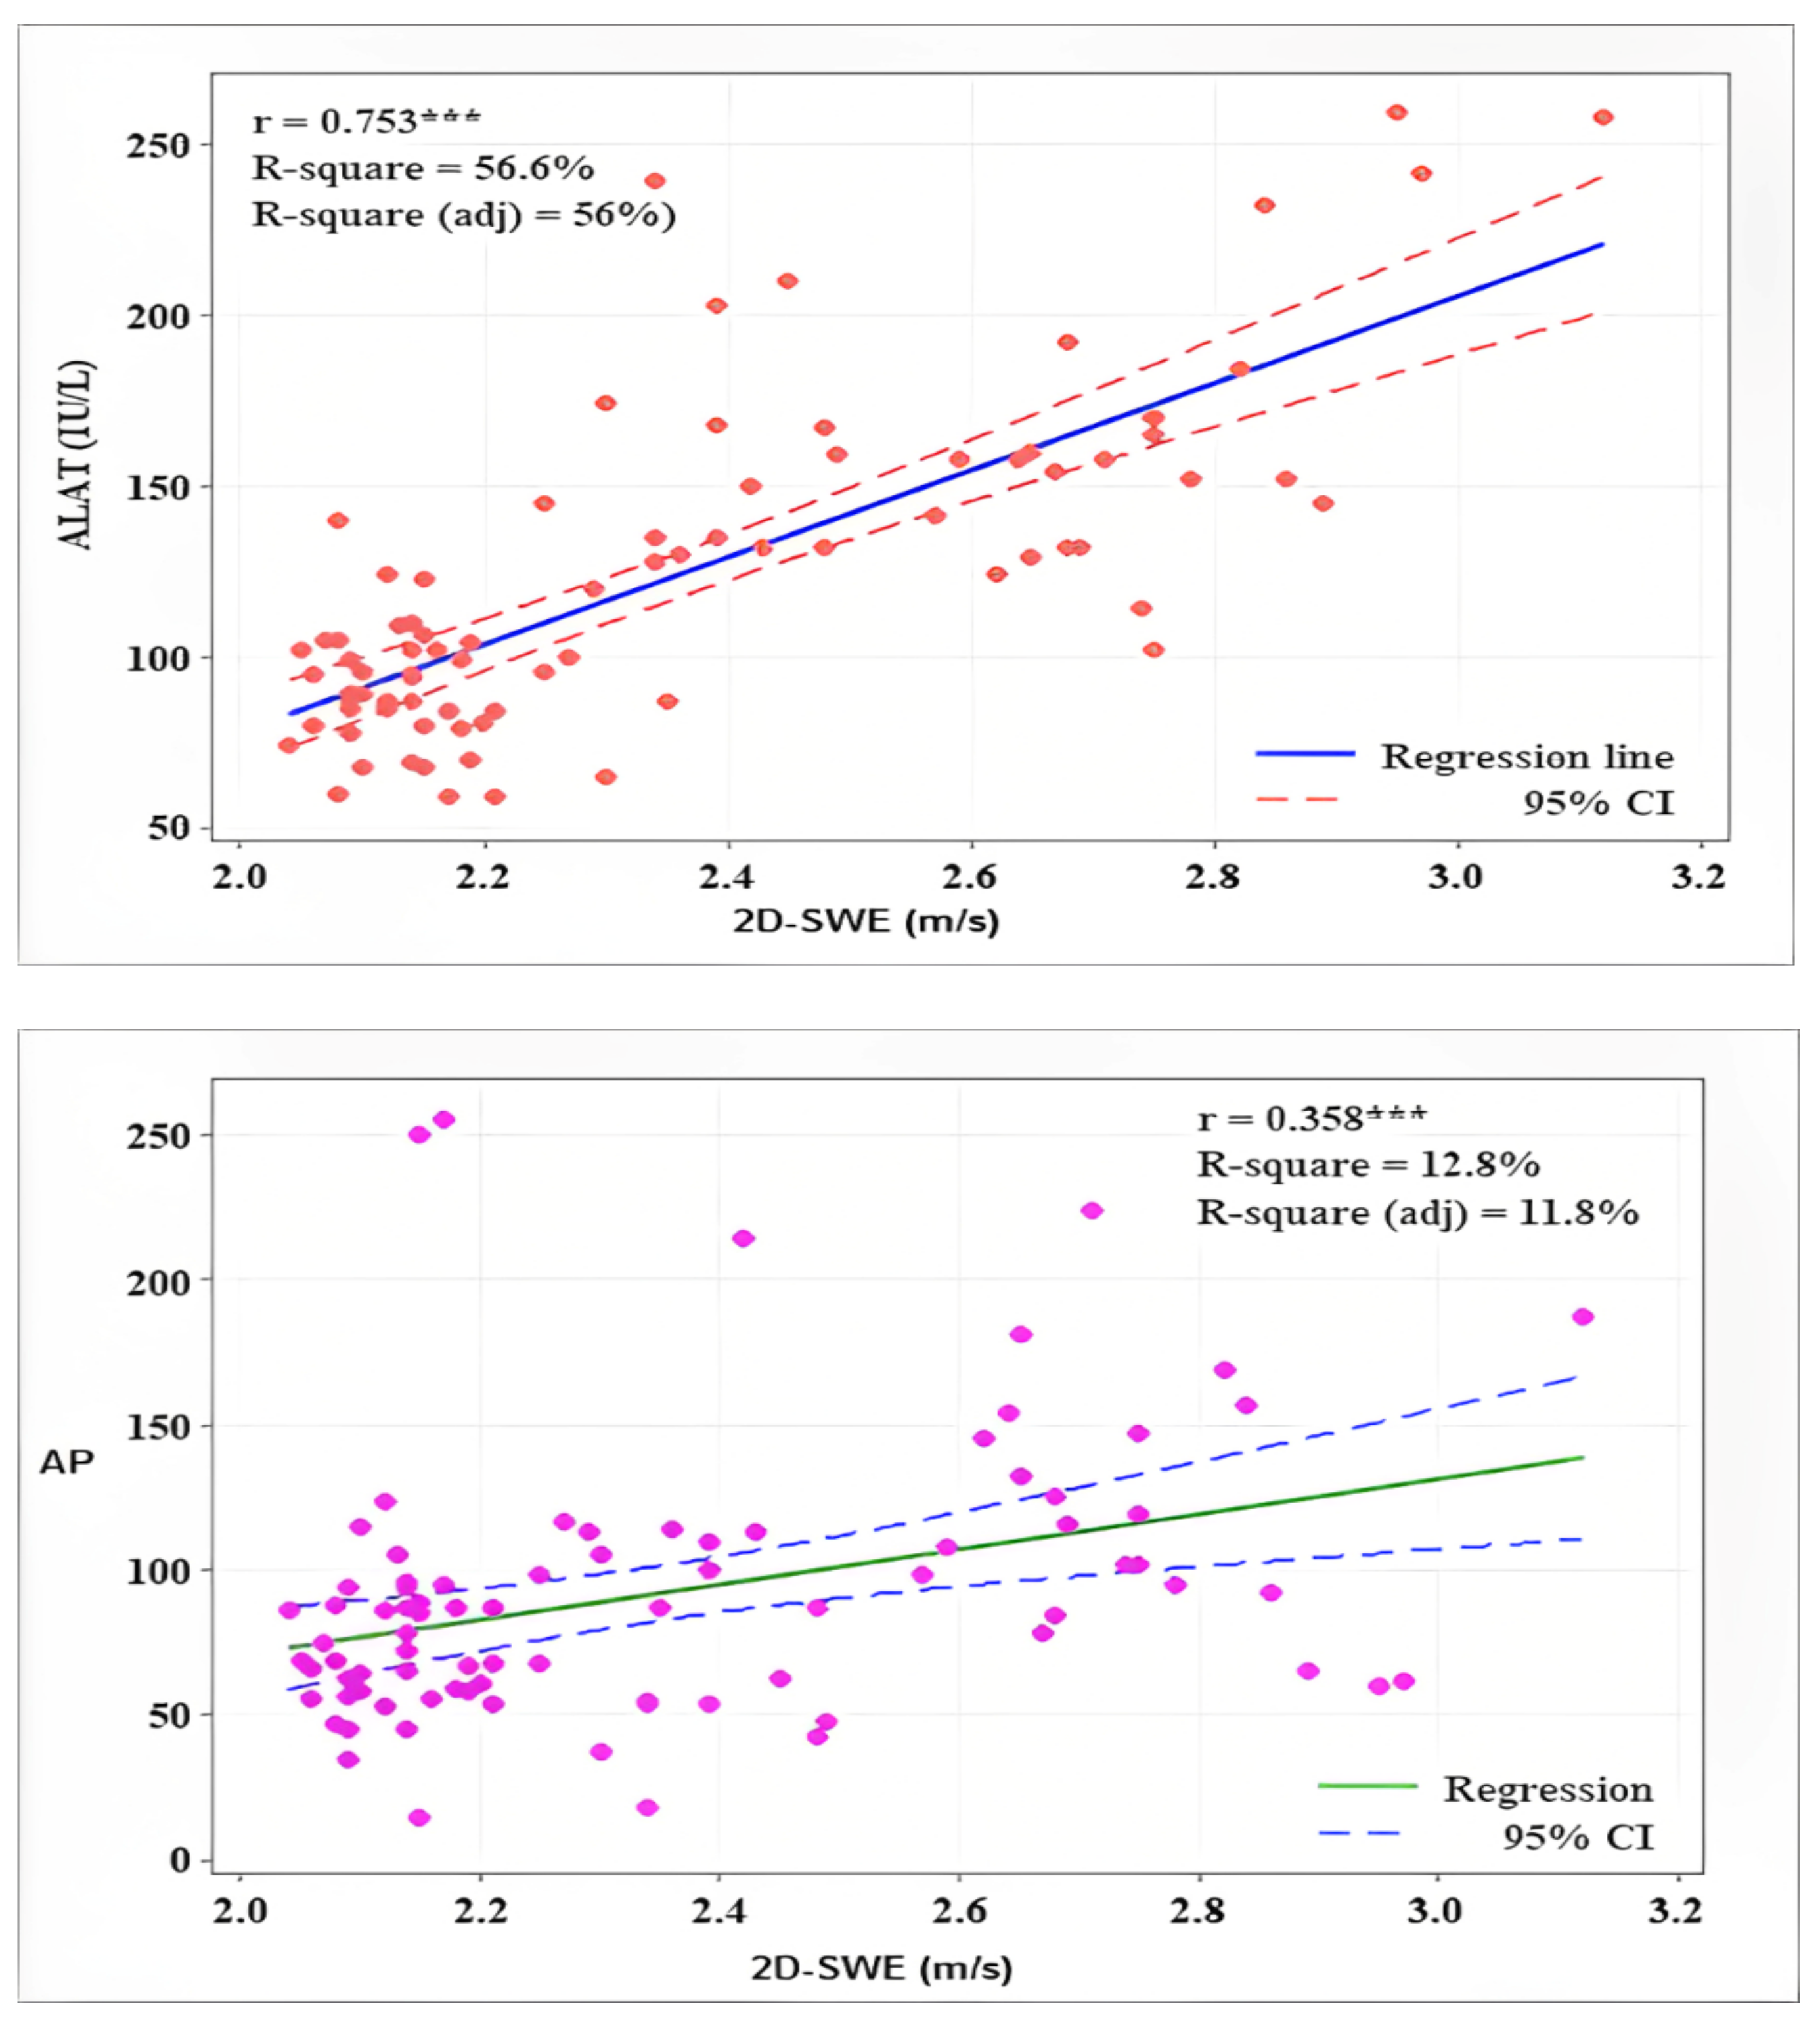
SWV showed a high positive correlation with lab parameters ASAT (r = 0.745,
p < 0.001), ALAT (r = 0.753,
p < 0.001), and a lower one with AP (r = 0.358,
p < 0.001) (
Figure 3).
4. Discussion
Non-invasive methods for the assessment of liver fibrosis and its complications have been subject to numerous studies in recent years. Cirrhotic transformation of the parenchyma regardless of its etiology is associated with structural and biochemical changes resulting in increased portal pressure [
9]. Those changes are related to alterations in vascular architecture, parenchymal fibrosis, and impaired clearance of endogenic vasodilators [
10].
The relevance of CSPH was already outlined, with its progression being positively associated with mortality rate [
11]. Classically, HVPG is considered the gold standard for the diagnosis of PH, as UE is for EVs, one of the main clinical manifestations of PH. Unfortunately, measurement of HVPG proves to be quite invasive and hardly applied outside clinical research settings, while the necessity for regular UE to monitor EVs, makes the procedure inconvenient and not cost-effective. Therefore, the development of non-endoscopic and non-invasive methods for the assessment of EVs is important both for periodic follow-ups well as for the identification of the candidates for interventional treatment [
12].
Numerous authors conduct studies to evaluate esophageal varices by noninvasive methods, including assessment of liver stiffness by various elastographic techniques, platelet count, platelet count/spleen size, or spleen stiffness [
13,
14,
15,
16].
Grgurevic et al. [
17] in a study of 87 patients with cirrhosis (predominantly chronic viral hepatitis C and alcoholic cirrhosis), established EVs in 54 of them. The criterion value for the presence of EVs was 19.7 kPa with a sensitivity of 83.3% and a specificity of 66.6%. Those findings are in conflict with our study which found that 2D-SWE performs suboptimally in identifying patients with low-grade EVs. With a cut-off value of 2.18m/s, the diagnostic accuracy of LSM was 71.8% with sensitivity and specificity of merely 57% and 68% respectively. In spite of those disappointing results, further assessment established that 2D-SWE has excellent performance (sensitivity and specificity of 100%) regarding the diagnosis of high-grade varices (high-risk esophageal varices). This finding is supported by a recent meta-analysis which found 80% sensitivity and 73.1% specificity of 2D-SWE for the diagnosis of HREVs [
18]. Research by Arun et al. finds that 2D-SWE has good diagnostic capabilities for all grades of EVs including HREVs in patients with cACLD [
19]. They also note that the accuracy of 2D-SWE is comparable to TE but superior to all other non-invasive methods.
It is our opinion that the discrepancy between our results and those cited in the literature is mainly derived from the heterogeneity of the population in our study including both patients with compensated and decompensated liver cirrhosis. Our data shows that the stage of liver cirrhosis has little influence on the predictive value of 2D-SWE for the diagnosis of HREV. This would suggest that 2D-SWE may be successfully utilized for the identification of patients with dLC and HREVs, who would benefit most from the performance of UE, as it would be both diagnostic and therapeutic. Such a hypothesis urges further research.
In current literature, the cut-off value for the presence of EVs, measured through pSWE, was set at 2.05 m/s with good sensitivity (83%), specificity (76%), positive predictive value (PPV) (78%), negative predictive value (NPV) (81%). For HREVs the cutt-off value is 2.39 m/s with sensitivity–81%, specificity–82%, PPV–69%, and NPV–89% [
20]. Although understandably not entirely applicable. Those results are largely similar to the ones obtained in our study.
When analyzing the acquired data, certain findings were encountered. Patients with decompensated cirrhosis were generally younger compared to those with compensated disease (
p = 0.039). Such observations might be at least partially explained by the gradual decrease of certain complications such as bleeding in the course of the disease [
21]. In subjects with decompensated liver disease consistently higher values of BMI and GGT levels were established. In our opinion, this finding reflects the tendency towards shifting the etiology of the disease from mainly viral to alcoholic and metabolic. This statement is supported by a large study that established a more than two-fold increase in obesity in cirrhotic patients between 2008 and 2018. In 2018 BMI > 40 kg/m
2 is measured in 27% of cirrhotic patients [
21].
The correlation of SWV values measured through 2D-SWE with certain factors was also investigated. In patients with ascites consistently higher SWV values were established.
Since both SWV and ascites are closely dependent on the severity of portal hypertension such a finding was largely anticipated. Transaminase levels also showed a positive correlation with SWV. This observation is repeatedly confirmed in other studies, but its clinical significance is yet to be determined [
22].
The presented research has a few weaknesses. First, it reviews patients with both cLC and dLC, which reflects on the final results. Secondly obtained data is presented in m/s, while most studies use kPa as a metric. Our decision was driven by the recent EFSUMB and WFUMB guidelines which regard tissue stiffness measurement in m/s to be more objective and precise [
6,
7]. Certain issues with comparability cannot be denied. On the other hand, we think that the inclusion of patients irrespective of stages of LC would expand the knowledge and raise the need for future research on 2D-SWE in patients with dLC. Our initial findings suggest that 2D-SWE may be a valuable tool for the identification of HREVs in subjects with dLC.
5. Conclusions
The 2D-SWE technique can be used as a non-invasive method in the diagnostic algorithm for patients with both compensated and decompensated liver cirrhosis to assess the presence of high-risk esophageal varices. It could be used as a tool to identify patients who would benefit the most from UE (UE with intent to treat). In fact, 2D-SWE might be valuable for the establishment of low-grade EVs as well, but future research is needed to support such a statement.
Author Contributions
Conceptualization, V.A.; methodology, E.T. and E.N.-G.; investigation, B.H. and E.N.-G.; resources, P.U. and G.K.; data curation V.A. and M.D.; writing—original draft preparation, B.H. and M.D.; writing—review and editing, S.V.; visualization, S.V.; supervision, D.D. and K.D.; funding acquisition, D.D. and K.D. All authors have read and agreed to the published version of the manuscript.
Funding
This research received no external funding.
Institutional Review Board Statement
The study was conducted in accordance with the Declaration of Helsinki, and approved by the Institutional Review Board of University hospital “Kaspela” (№ 02/070119 from 7 January 2019) for studies involving humans.
Informed Consent Statement
Informed consent was obtained from all subjects involved in the study.
Data Availability Statement
The data presented in this study are available in article.
Conflicts of Interest
The authors declare no conflict of interest.
Abbreviations
| 2D-SWE | 2 dimensional- shear wave elastography |
| cACLD | compensated advanced chronic liver disease |
| cLC | compensated liver cirrhosis |
| CSPH | clinically significant portal hypertension |
| dLC | decomensated liver cirrhosis |
| EBL | endoscopic band ligation |
| EVs | esophageal varices |
| HREVs | high-risk esophageal varices |
| HVPG | hepatic venous pressure gradient |
| LC | liver cirrhosis |
| LS | liver stiffness |
| LSM | liver stiffness measurement |
| MRE | magnetic resonance elastography |
| NASH | nonalcoholic steatohepatitis |
| NPV | negative predictive value |
| NSBB | non-selective beta blockers |
| PH | portal hypertension |
| PPV | positive predictive value |
| pSWE | point shear wave elastography |
| ROI | region of interest |
| SSM | spleen stiffness measurement |
| SWV | shear wave velocity |
| TE | transient elastography |
| UE | upper endoscopy |
References
- Zipprich, A.; Garcia-Tsao, G.; Rogowski, S.; Fleig, W.E.; Seufferlein, T.; Dollinger, M.M. Prognostic indicators of survival in patients with compensated and decompensated cirrhosis. Liver Int. 2012, 32, 1407–1414. [Google Scholar] [CrossRef] [PubMed] [Green Version]
- De Franchis, R.; Bosch, J.; Garcia-Tsao, G.; Reiberger, T.; Ripoll, C.; Abraldes, J.G.; Albillos, A.; Baiges, A.; Bajaj, J.; Bañares, R.; et al. Baveno VII—Renewing consensus in portal hypertension. J. Hepatol. 2022, 76, 959–974. [Google Scholar] [CrossRef] [PubMed]
- Friedrich-Rust, M.; Poynard, T.; Castera, L. Critical comparison of elastography methods to assess chronic liver disease. Nat. Rev. Gastroenterol. Hepatol. 2016, 13, 402–411. [Google Scholar] [CrossRef]
- Berzigotti, A. Non-invasive evaluation of portal hypertension using ultrasound elastography. J. Hepatol. 2017, 67, 399–411. [Google Scholar] [CrossRef] [PubMed]
- Ronot, M.; Ferraioli, G.; Müller, H.-P.; Friedrich-Rust, M.; Filice, C.; Vilgrain, V.; Cosgrove, D.; Lim, A.K. Comparison of liver stiffness measurements by a 2D-shear wave technique and transient elastography: Results from a European prospective multi-centre study. Eur. Radiol. 2021, 31, 1578–1587. [Google Scholar] [CrossRef] [PubMed]
- Ferraioli, G.; Filice, C.; Castera, L.; Choi, B.I.; Sporea, I.; Wilson, S.R.; Cosgrove, D.; Dietrich, C.F.; Amy, D.; Bamber, J.C.; et al. WFUMB guidelines and recommendations for clinical use of ultrasound elastography: Part 3 Liver. Ultrasound Med. Biol. 2015, 41, 1161–1179. [Google Scholar] [CrossRef] [Green Version]
- Dietrich, C.F.; Bamber, J.; Berzigotti, A.; Bota, S.; Cantisani, V.; Castera, L.; Cosgrove, D.; Ferraioli, G.; Friedrich-Rust, M.; Gilja, O.H.; et al. EFSUMB guidelines and recommendations on the clinical use of liver ultrasound elastography, update 2017 (long version). Ultraschall Med. 2017, 38, e48. [Google Scholar] [PubMed] [Green Version]
- Paquet, K.J. Prophylactic Endoscopic Sclerosing Treatment of the Esophageal Wall in Varices—A Prospective Controlled Randomized. Trial Endosc. 1982, 14, 4–5. [Google Scholar] [CrossRef]
- Pinzani, M.; Gentilini, P. Biology of hepatic stellate cells and their possible relevance in the pathogenesis of portal hypertension in cirrhosis. Semin. Liver Dis. 1999, 19, 397–410. [Google Scholar] [CrossRef]
- Wiest, R.; Groszmann, R.J. The paradox of nitric oxide in cirrhosis and portal hypertension: Too much, not enough. Hepatology 2002, 35, 478–491. [Google Scholar] [CrossRef]
- Yoo, J.-J.; Kim, S.G. HVPG as a Predictor of Mortality in Non-Critically-Ill Cirrhotic Patients. J. Korean Med. Sci. 2019, 34, e235. [Google Scholar] [CrossRef] [PubMed]
- Garcia-Tsao, G.; Sanyal, A.J.; Grace, N.D.; Carey, W.D. Prevention and management of gastro-esophageal varices and variceal hemorrhage in cirrhosis. Am. J. Gastroenterol. 2007, 102, 2086–2102. [Google Scholar] [CrossRef] [PubMed]
- Jamil, Z.; Malik, M.; Durrani, A.A. Platelet count to splenic diameter ratio and other noninvasive markers as predictors of esophageal varices in patients with liver cirrhosis. Turk. J. Gastroenterol. 2017, 28, 347–352. [Google Scholar] [CrossRef] [PubMed] [Green Version]
- Gonzalez-Ojeda, A.; Cervantes-Guevara, G.; Chavez-Sanchez, M. Platelet count/spleen diameter ratio to predict esophageal varices in Mexican patients with hepatic cirrhosis. World J. Gastroenterol. 2014, 20, 2079–2084. [Google Scholar] [CrossRef] [PubMed]
- Ozdil, K.; Ozturk, O.; Calık, E.S.; Akbas, E.S.; Kanat, E.; Calıskan, Z.; Demirdag, H.; Kahraman, R.; Bulur, A.; Bilgic, N.M.; et al. The relationship between the size of varices and platelet count/spleen size ratio in cirrhotic patients. North Clin. Istanb. 2016, 3, 46–52. [Google Scholar] [CrossRef] [PubMed] [Green Version]
- Karagiannakis, D.S.; Voulgaris, T.; Koureta, E.; Chloupi, E.; Papatheodoridis, G.V.; Vlachogiannakos, J. Role of Spleen Stiffness Measurement by 2D-Shear Wave Elastography in Ruling Out the Presence of High-Risk Varices in Cirrhotic Patients. Dig. Dis. Sci. 2019, 64, 2653–2660. [Google Scholar] [CrossRef]
- Grgurević, I.; Bokun, T.; Mustapić, S.; Trkulja, V.; Heinzl, R.; Banić, M.; Puljiz, Ž.; Lukšić, B.; Kujundžić, M. Real time two-dimensional shear wave ultrasound elastography of the liver is a reliable predictor of clinical outcomes and the presence of esophageal varices in patients with compensated liver cirrhosis. Croat. Med. J. 2015, 56, 470–481. [Google Scholar] [CrossRef] [Green Version]
- Liu, Y.; Tan, H.-Y.; Zhang, X.-G.; Zhen, Y.-H.; Gao, F.; Lu, X.-F. Prediction of high-risk esophageal varices in patients with chronic liver disease with point and 2D shear wave elastography: A systematic review and meta-analysis. Eur. Radiol. 2022, 32, 4616–4627. [Google Scholar] [CrossRef]
- Arun, P.; Madhu, D.; George, A.; Devadas, K.; Shanid, A. 2D-Shear Wave Elastography in Predicting Esophageal Varices in Patients with Compensated Liver Cirrhosis. J. Clin. Exp. Hepatol. 2022, 12, S36. [Google Scholar] [CrossRef]
- Morishita, N.; Hiramatsu, N.; Oze, T.; Harada, N.; Yamada, R.; Miyazaki, M.; Yakushijin, T.; Miyagi, T.; Yoshida, Y.; Tatsumi, T.; et al. Liver stiffness measurement by acoustic radiation force impulse is useful in predicting the presence of esophageal varices or high-risk esophageal varices among patients with HCV-related cirrhosis. J. Gastroenterol. 2013, 49, 1175–1182. [Google Scholar] [CrossRef]
- Gu, W.; Hortlik, H.; Erasmus, H.-P.; Schaaf, L.; Zeleke, Y.; Uschner, F.E.; Ferstl, P.; Schulz, M.; Peiffer, K.-H.; Queck, A.; et al. Trends and the course of liver cirrhosis and its complications in Germany: Nationwide population-based study (2005 to 2018). Lancet Reg. Health Eur. 2021, 12, 100240. [Google Scholar] [CrossRef] [PubMed]
- Cebula, M.; Gruszczyńska, K.; Hartleb, M.; Baron, J. Analysis of Point Shear Wave Elastography and Biochemical Markers for the Detection of Liver Fibrosis. Medicina 2021, 57, 40. [Google Scholar] [CrossRef] [PubMed]
| Disclaimer/Publisher’s Note: The statements, opinions and data contained in all publications are solely those of the individual author(s) and contributor(s) and not of MDPI and/or the editor(s). MDPI and/or the editor(s) disclaim responsibility for any injury to people or property resulting from any ideas, methods, instructions or products referred to in the content. |
© 2023 by the authors. Licensee MDPI, Basel, Switzerland. This article is an open access article distributed under the terms and conditions of the Creative Commons Attribution (CC BY) license (https://creativecommons.org/licenses/by/4.0/).


 ,
, 


