
Fusion Imaging of Non-Invasive and Invasive Cardiac Electroanatomic Mapping in Patients with Ventricular Ectopic Beats: A Feasibility Analysis in a Case Series
 , ,
, ,
Abstract
:1. Introduction
2. Case Presentation
2.1. Case N1
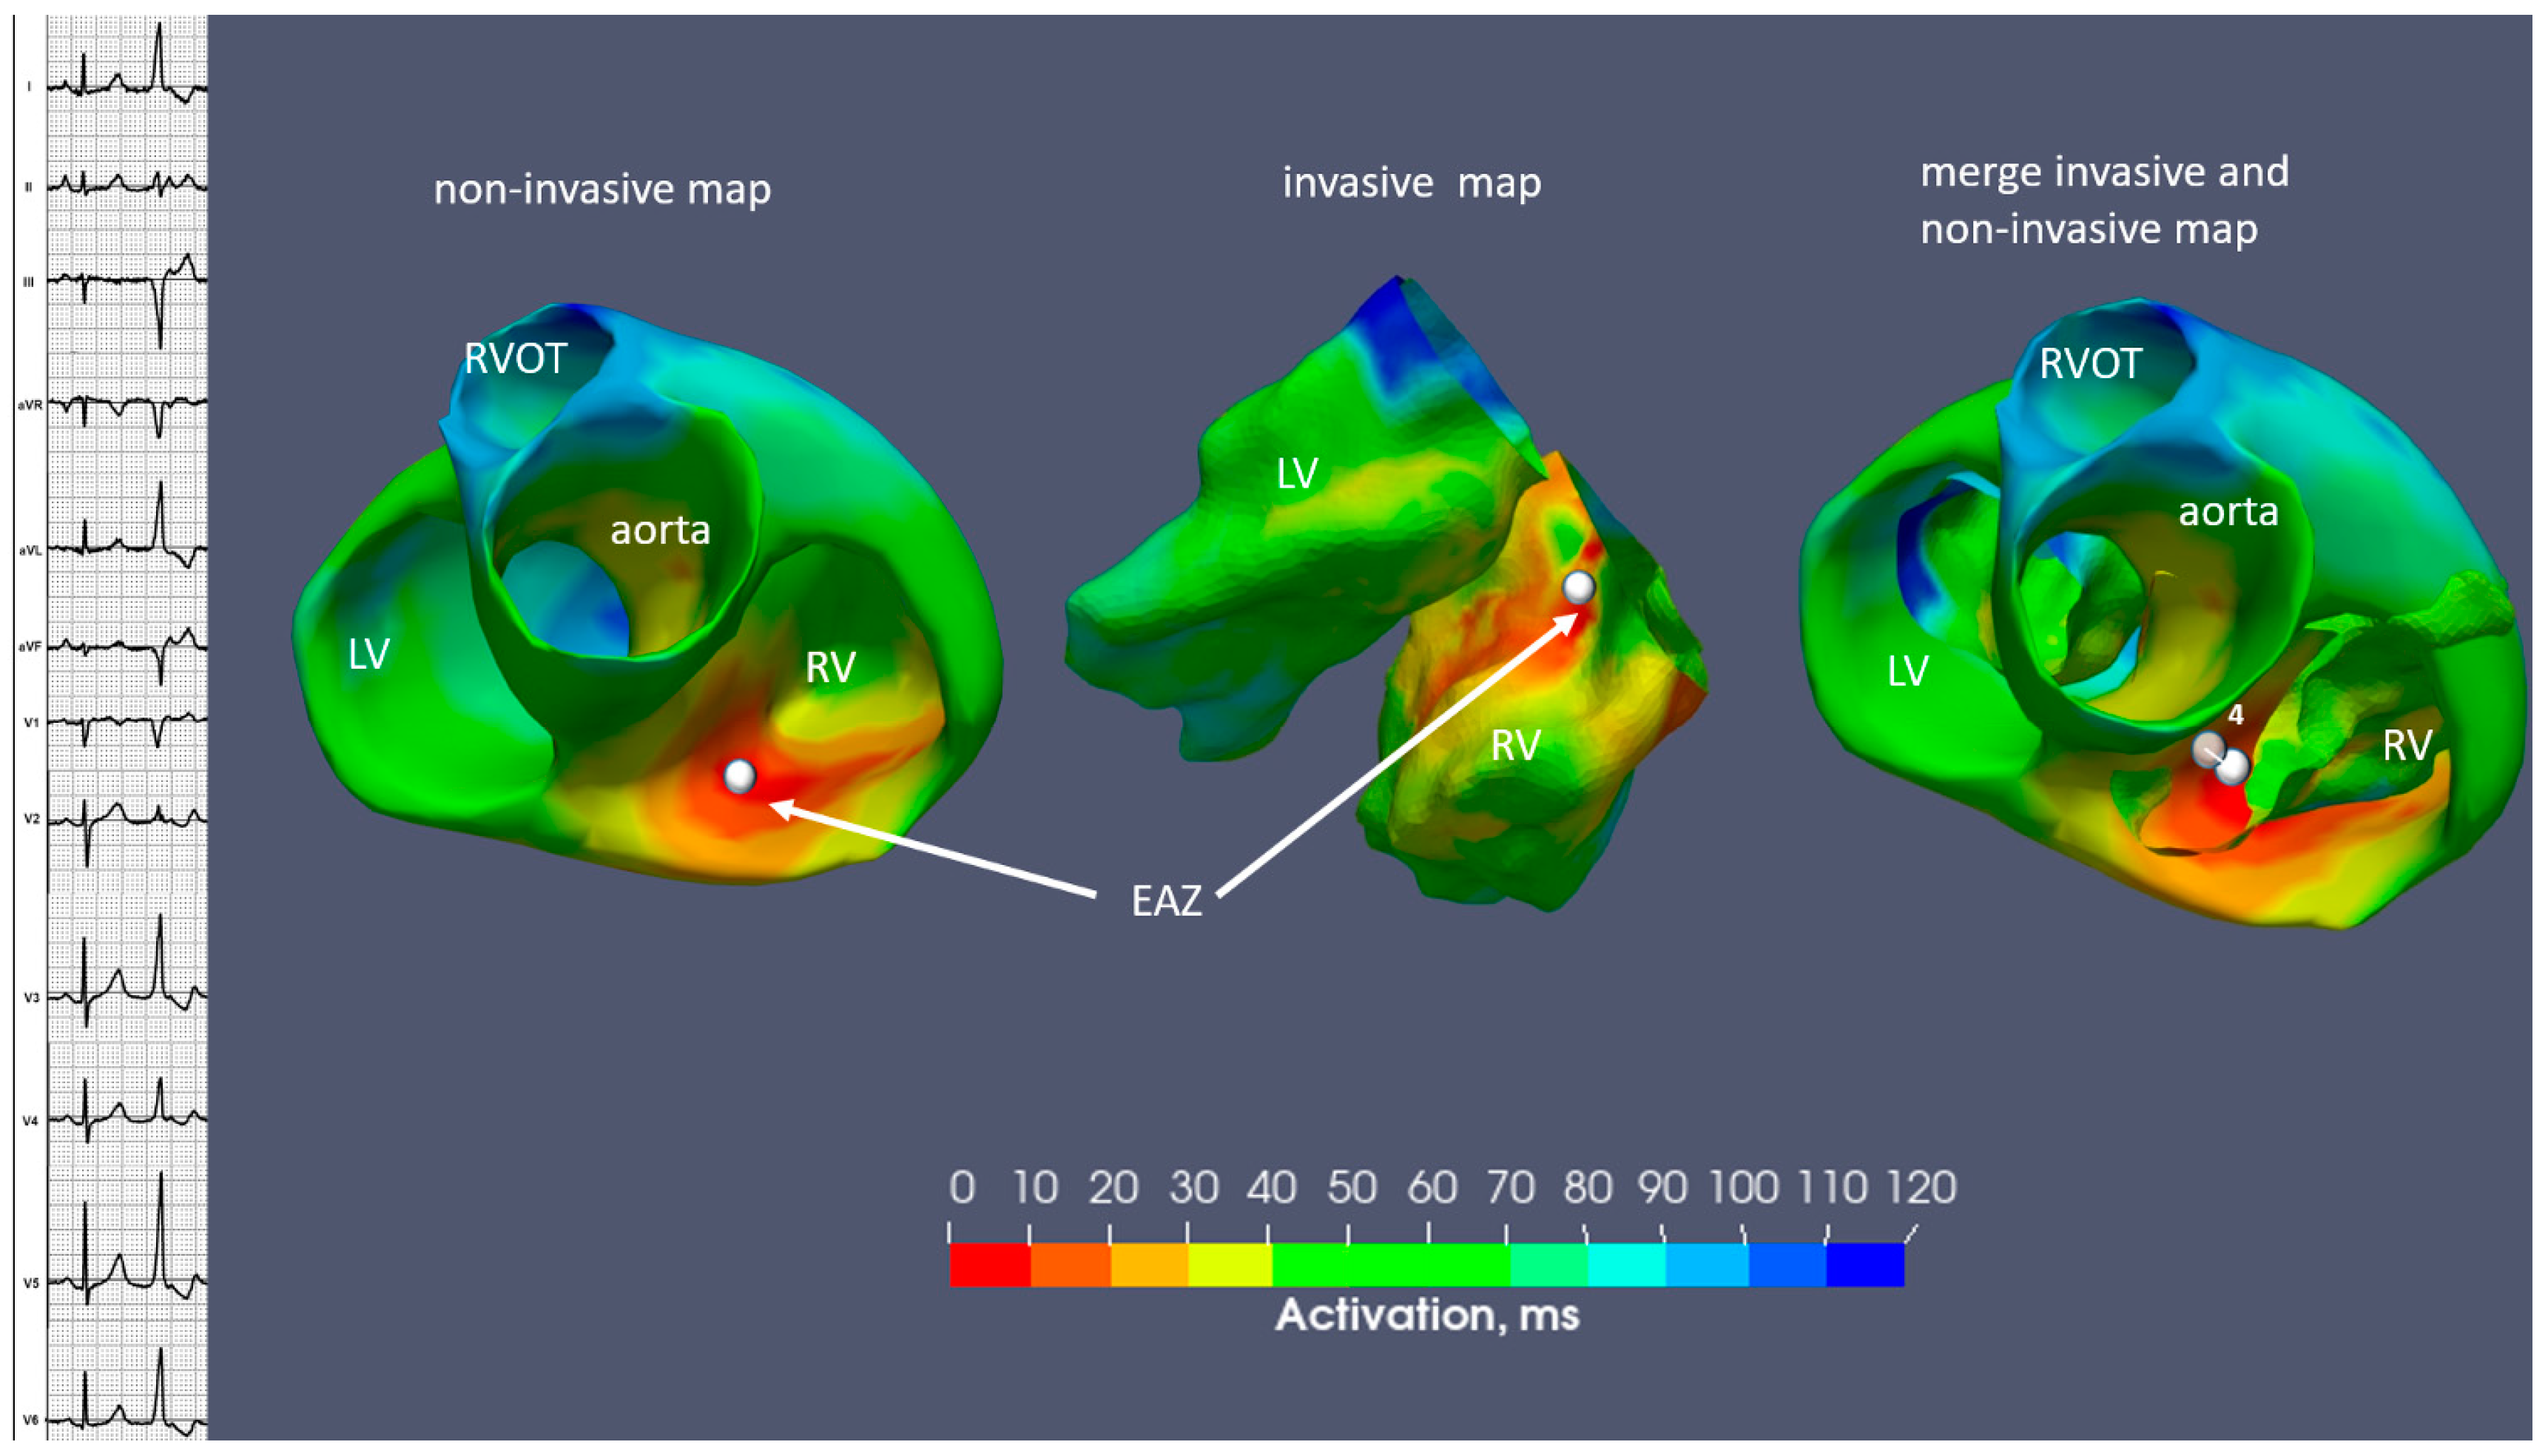
2.2. Case N2
2.3. Case N3
3. Discussion
4. Conclusions
Author Contributions
Funding
Institutional Review Board Statement
Informed Consent Statement
Data Availability Statement
Acknowledgments
Conflicts of Interest
Abbreviations
References
- Tanner, H.; Hindricks, G.; Schirdewahn, P.; Kobza, R.; Dorszewski, A.; Piorkowski, C.; Gerds-Li, J.-H.; Kottkamp, H. Outflow tract tachycardia with R/S transition in lead V3: Six different anatomic approaches for successful ablation. J. Am. Coll. Cardiol. 2005, 45, 418–423. [Google Scholar] [CrossRef]
- Chen, J.; Hoff, P.I.; Rossvoll, O.; De Bortoli, A.; Solheim, E.; Sun, L.; Schuster, P.; Larsen, T.; Ohm, O.-J. Ventricular arrhythmias originating from the aortomitral continuity: An uncommon variant of left ventricular outflow tract tachycardia. Europace 2011, 14, 388–395. [Google Scholar] [CrossRef] [PubMed]
- Zhou, X.; Fang, L.; Wang, Z.; Liu, H.; Mao, W. Comparative analysis of electrocardiographic imaging and ECG in predicting the origin of outflow tract ventricular arrhythmias. J. Int. Med. Res. 2020, 48, 300060520913132. [Google Scholar] [CrossRef] [PubMed]
- Ramanathan, C.; Ghanem, R.N.; Jia, P.; Ryu, K.; Rudy, Y. Noninvasive electrocardiographic imaging for cardiac electrophysiology and arrhythmia. Nat. Med. 2004, 10, 422–428. [Google Scholar] [CrossRef]
- Intini, A.; Goldstein, R.N.; Jia, P.; Ramanathan, C.; Ryu, K.; Giannattasio, B.; Gilkeson, R.; Stambler, B.S.; Brugada, P.; Stevenson, W.G.; et al. Electrocardiographic imaging (ECGI), a novel diagnostic modality used for mapping of focal left ventricular tachycardia in a young athlete. Heart Rhythm 2005, 2, 1250–1252. [Google Scholar] [CrossRef]
- Berger, T.; Pfeifer, B.; Hanser, F.F.; Hintringer, F.; Fischer, G.; Netzer, M.; Trieb, T.; Stuehlinger, M.; Dichtl, W.; Baumgartner, C.; et al. Single-Beat Noninvasive Imaging of Ventricular Endocardial and Epicardial Activation in Patients Undergoing CRT. PLoS ONE 2011, 6, e16255. [Google Scholar] [CrossRef] [PubMed]
- Revishvili, A.S.; Wissner, E.; Lebedev, D.S.; Lemes, C.; Deiss, S.; Metzner, A.; Kalinin, V.V.; Sopov, O.V.; Labartkava, E.Z.; Kalinin, A.V.; et al. Validation of the mapping accuracy of a novel non-invasive epicardial and endocardial electrophysiology system. Europace 2015, 17, 1282–1288. [Google Scholar] [CrossRef] [PubMed]
- Yu, L.; Jin, Q.; Zhou, Z.; Wu, L.; He, B. Three-Dimensional Noninvasive Imaging of Ventricular Arrhythmias in Patients with Premature Ventricular Contractions. IEEE Trans. Biomed. Eng. 2017, 65, 1495–1503. [Google Scholar] [CrossRef]
- Misra, S.; van Dam, P.; Chrispin, J.; Assis, F.; Keramati, A.; Kolandaivelu, A.; Berger, R.; Tandri, H. Initial validation of a novel ECGI system for localization of premature ventricular contractions and ventricular tachycardia in structurally normal and abnormal hearts. J. Electrocardiol. 2018, 51, 801–808. [Google Scholar] [CrossRef]
- Krummen, D.E.; Villongco, C.T.; Ho, G.; Schricker, A.A.; Field, M.E.; Sung, K.; Kacena, K.A.; Martinson, M.S.; Hoffmayer, K.S.; Hsu, J.C.; et al. Forward-Solution Noninvasive Computational Arrhythmia Mapping: The VMAP Study. Circ. Arrhythmia Electrophysiol. 2022, 15, 595–608. [Google Scholar] [CrossRef]
- Webber, M.; Joy, G.; Bennett, J.; Chan, F.; Falconer, D.; Shiwani, H.; Davies, R.H.; Krausz, G.; Tanackovic, S.; Guger, C.; et al. Technical development and feasibility of a reusable vest to integrate cardiovascular magnetic resonance with electrocardiographic imaging. J. Cardiovasc. Magn. Reson. 2023, 25, 73. [Google Scholar] [CrossRef]
- Potyagaylo, D.; Chmelevsky, M.; Budanova, M.; Zubarev, S.; Treshkur, T.; Lebedev, D. Combination of lead-field theory with cardiac vector direction: ECG imaging of septal ventricular activation. J. Electrocardiol. 2019, 57, S40–S44. [Google Scholar] [CrossRef]
- Potyagaylo, D.; Chmelevsky, M.; van Dam, P.; Budanova, M.; Zubarev, S.; Treshkur, T.; Lebedev, D. ECG Adapted Fastest Route Algorithm to Localize the Ectopic Excitation Origin in CRT Patients. Front. Physiol. 2019, 10, 183. [Google Scholar] [CrossRef]
- Wissner, E.; Saguner, A.M.; Metzner, A.; Chmelesky, M.; Tsyganov, A.; Deiss, S.; Maurer, T.; Kuck, K.-H. Radiofrequency ablation of premature ventricular contractions originating from the aortomitral continuity localized by use of a novel noninvasive epicardial and endocardial electrophysiology system. Heart Case Rep. 2016, 2, 255–257. [Google Scholar] [CrossRef] [PubMed]
- Namdar, M.; Chmelevsky, M.; Hachulla, A.-L.; Shah, D.C. Precise Noninvasive ECG Mapping Derived Localization of the Origin of an Epicardial Ventricular Tachycardia. Circ. Arrhythmia Electrophysiol. 2016, 9, e003949. [Google Scholar] [CrossRef] [PubMed]
- Wissner, E.; Revishvili, A.; Metzner, A.; Tsyganov, A.; Kalinin, V.; Lemes, C.; Saguner, A.M.; Maurer, T.; Deiss, S.; Sopov, O.; et al. Noninvasive epicardial and endocardial mapping of premature ventricular contractions. Europace 2016, 19, 843–849. [Google Scholar] [CrossRef] [PubMed]
- Parreira, L.; Carmo, P.; Adragão, P.; Marinheiro, R.; Budanova, M.; Cardim, N.; Gonçalves, P. Successful ablation of premature ventricular contractions exclusively guided by epicardial and endocardial non-invasive mapping (ECGI) and confirmed by substrate mapping. J. Electrocardiol. 2020, 62, 103–106. [Google Scholar] [CrossRef] [PubMed]
- Parreira, L.; Carmo, P.; Nunes, S.; Marinheiro, R.; Mesquita, D.; Zubarev, S.; Chmelevsky, M.; Hitchen, R.; Ferreira, A.; Pinho, J.; et al. Electrocardiographic imaging to guide ablation of ventricular arrhythmias and agreement between two different systems. J. Electrocardiol. 2023, 80, 143–150. [Google Scholar] [CrossRef] [PubMed]
- Zubarev, S.; Chmelevsky, M.; Potyagaylo, D.; Budanova, M.; Rud, S.; Ryzhkov, A.; Lebedev, D. Comparison of Left Ventricular Late Activation Zones Determined Using Noninvasive Electrocardiographic Imaging with Sequential Computed and Magnetic Resonance Tomography. In Proceedings of the 2018 Computing in Cardiology Conference (CinC), Maastricht, The Netherlands, 23–26 September 2018; pp. 1–4. [Google Scholar] [CrossRef]
- Jamil-Copley, S.; Bokan, R.; Kojodjojo, P.; Qureshi, N.; Koa-Wing, M.; Hayat, S.; Kyriacou, A.; Sandler, B.; Sohaib, A.; Wright, I.; et al. Noninvasive electrocardiographic mapping to guide ablation of outflow tract ventricular arrhythmias. Heart Rhythm 2014, 11, 587–594. [Google Scholar] [CrossRef]
- Erkapic, D.; Greiss, H.; Pajitnev, D.; Zaltsberg, S.; Deubner, N.; Berkowitsch, A.; Möllman, S.; Sperzel, J.; Rolf, A.; Schmitt, J.; et al. Clinical impact of a novel three-dimensional electrocardiographic imaging for non-invasive mapping of ventricular arrhythmias--a prospective randomized trial. Europace 2014, 17, 591–597. [Google Scholar] [CrossRef]
- Hocini, M.; Shah, A.J.; Neumann, T.; Kuniss, M.; Erkapic, D.; Chaumeil, A.; Copley, S.-J.; Lim, P.B.; Kanagaratnam, P.; Denis, A.; et al. Focal Arrhythmia Ablation Determined by High-Resolution Noninvasive Maps: Multicenter Feasibility Study. J. Cardiovasc. Electrophysiol. 2015, 26, 754–760. [Google Scholar] [CrossRef]
- van Dam, P.M.; Boyle, N.G.; Laks, M.M.; Tung, R. Localization of premature ventricular contractions from the papillary muscles using the standard 12-lead electrocardiogram: A feasibility study using a novel cardiac isochrone positioning system. Europace 2016, 18, S16–S22. [Google Scholar] [CrossRef]
- Cuculich, P.S.; Schill, M.R.; Kashani, R.; Mutic, S.; Lang, A.; Cooper, D.; Faddis, M.; Gleva, M.; Noheria, A.; Smith, T.W.; et al. Noninvasive Cardiac Radiation for Ablation of Ventricular Tachycardia. N. Engl. J. Med. 2017, 377, 2325–2336. [Google Scholar] [CrossRef]
- Tsyganov, A.; Wissner, E.; Metzner, A.; Mironovich, S.; Chaykovskaya, M.; Kalinin, V.; Chmelevsky, M.; Lemes, C.; Kuck, K.-H. Mapping of ventricular arrhythmias using a novel noninvasive epicardial and endocardial electrophysiology system. J. Electrocardiol. 2018, 51, 92–98. [Google Scholar] [CrossRef] [PubMed]
- Haïssaguerre, M.; Hocini, M.; Cheniti, G.; Duchateau, J.; Sacher, F.; Puyo, S.; Cochet, H.; Takigawa, M.; Denis, A.; Martin, R.; et al. Localized Structural Alterations Underlying a Subset of Unexplained Sudden Cardiac Death. Circ. Arrhythmia Electrophysiol. 2018, 11, e006120. [Google Scholar] [CrossRef]
- Duchateau, J.; Sacher, F.; Pambrun, T.; Derval, N.; Chamorro-Servent, J.; Denis, A.; Ploux, S.; Hocini, M.; Jaïs, P.; Bernus, O.; et al. Performance and limitations of noninvasive cardiac activation mapping. Heart Rhythm 2018, 16, 435–442. [Google Scholar] [CrossRef] [PubMed]
- Parreira, L.; Carmo, P.; Marinheiro, R.; Mesquita, D.; Chmelevsky, M.; Ferreira, A.; Marques, L.; Pinho, J.; Chambel, D.; Nunes, S.; et al. Assessment of wave front activation duration and speed across the right ventricular outflow tract using electrocardiographic imaging as predictors of the origin of the premature ventricular contractions: A validation study. J. Electrocardiol. 2022, 73, 68–75. [Google Scholar] [CrossRef]
- Graham, A.J.; Orini, M.; Zacur, E.; Dhillon, G.; Daw, H.; Srinivasan, N.T.; Martin, C.; Lane, J.; Mansell, J.S.; Cambridge, A.; et al. Evaluation of ECG Imaging to Map Hemodynamically Stable and Unstable Ventricular Arrhythmias. Circ. Arrhythmia Electrophysiol. 2020, 13, e007377. [Google Scholar] [CrossRef]
- Graham, A.J.; Orini, M.; Zacur, E.; Dhillon, G.; Daw, H.; Srinivasan, N.T.; Lane, J.D.; Cambridge, A.; Garcia, J.; O’reilly, N.J.; et al. Simultaneous Comparison of Electrocardiographic Imaging and Epicardial Contact Mapping in Structural Heart Disease. Circ. Arrhythmia Electrophysiol. 2019, 12, e007120. [Google Scholar] [CrossRef]
- Nguyen, D.; Jeudy, J.; Restrepo, A.J.; Dickfeld, T.-M. A Novel Use of Noninvasive Registered Electrocardiographic Imaging Map for Localization of VT and PVC. JACC Case Rep. 2021, 3, 591–593. [Google Scholar] [CrossRef]


| Case 1 | Case 2 | Case 3 | |
|---|---|---|---|
| Cardiac CT/MRI | cCT | cMRI | cCT |
| Structural cardiomyopathy | Ischaemic (previous inferior wall infarction) | None (aortic valve insufficiency) | None |
| EF LV (%) | 29 | 48 | 64 |
| PVCs burden % on a Holter monitors | 20–50 | 30 | 5 |
| PVCs morphology | Monomorphic | Monomorphic | Monomorphic |
| 12 lead ECG | Superior axis; RBBB-morphology; R/S transition in V5-V6 | Superior axis; RBBB-morphology; R/S transition in V1-V2; equiphasic complex in I lead | Discordance in QRS complex (positive in II, negative in III); positive in I; narrow QRS 120 ms |
| Antiarrhythmic therapy | Beta-blockers | Beta-blockers, Flecainid, Propafenone | Beta-blockers, Propafenone |
| Number of 8-Electrode ECG Stripes | Number of Unipolar Electrodes | Electrode Material | |
|---|---|---|---|
| Case 1 | 26 | 208 | Metal |
| Case 2 | 28 | 224 | Carbon |
| Case 3 | 21 | 168 | Metal |
| Case 1 | Case 2 | Case 3 | |
|---|---|---|---|
| Position of EAZ | |||
| Invasive | inferior wall LV | inferoseptal apical LV | inferoseptal basal RV |
| Non-invasive | inferior wall LV | inferoseptal apical LV | inferoseptal basal RV |
| Area of EAZ, cm2 | |||
| Invasive | 4.3 | 7.1 | 0.4 |
| Non-invasive | 4.5 | 7 | 0.6 |
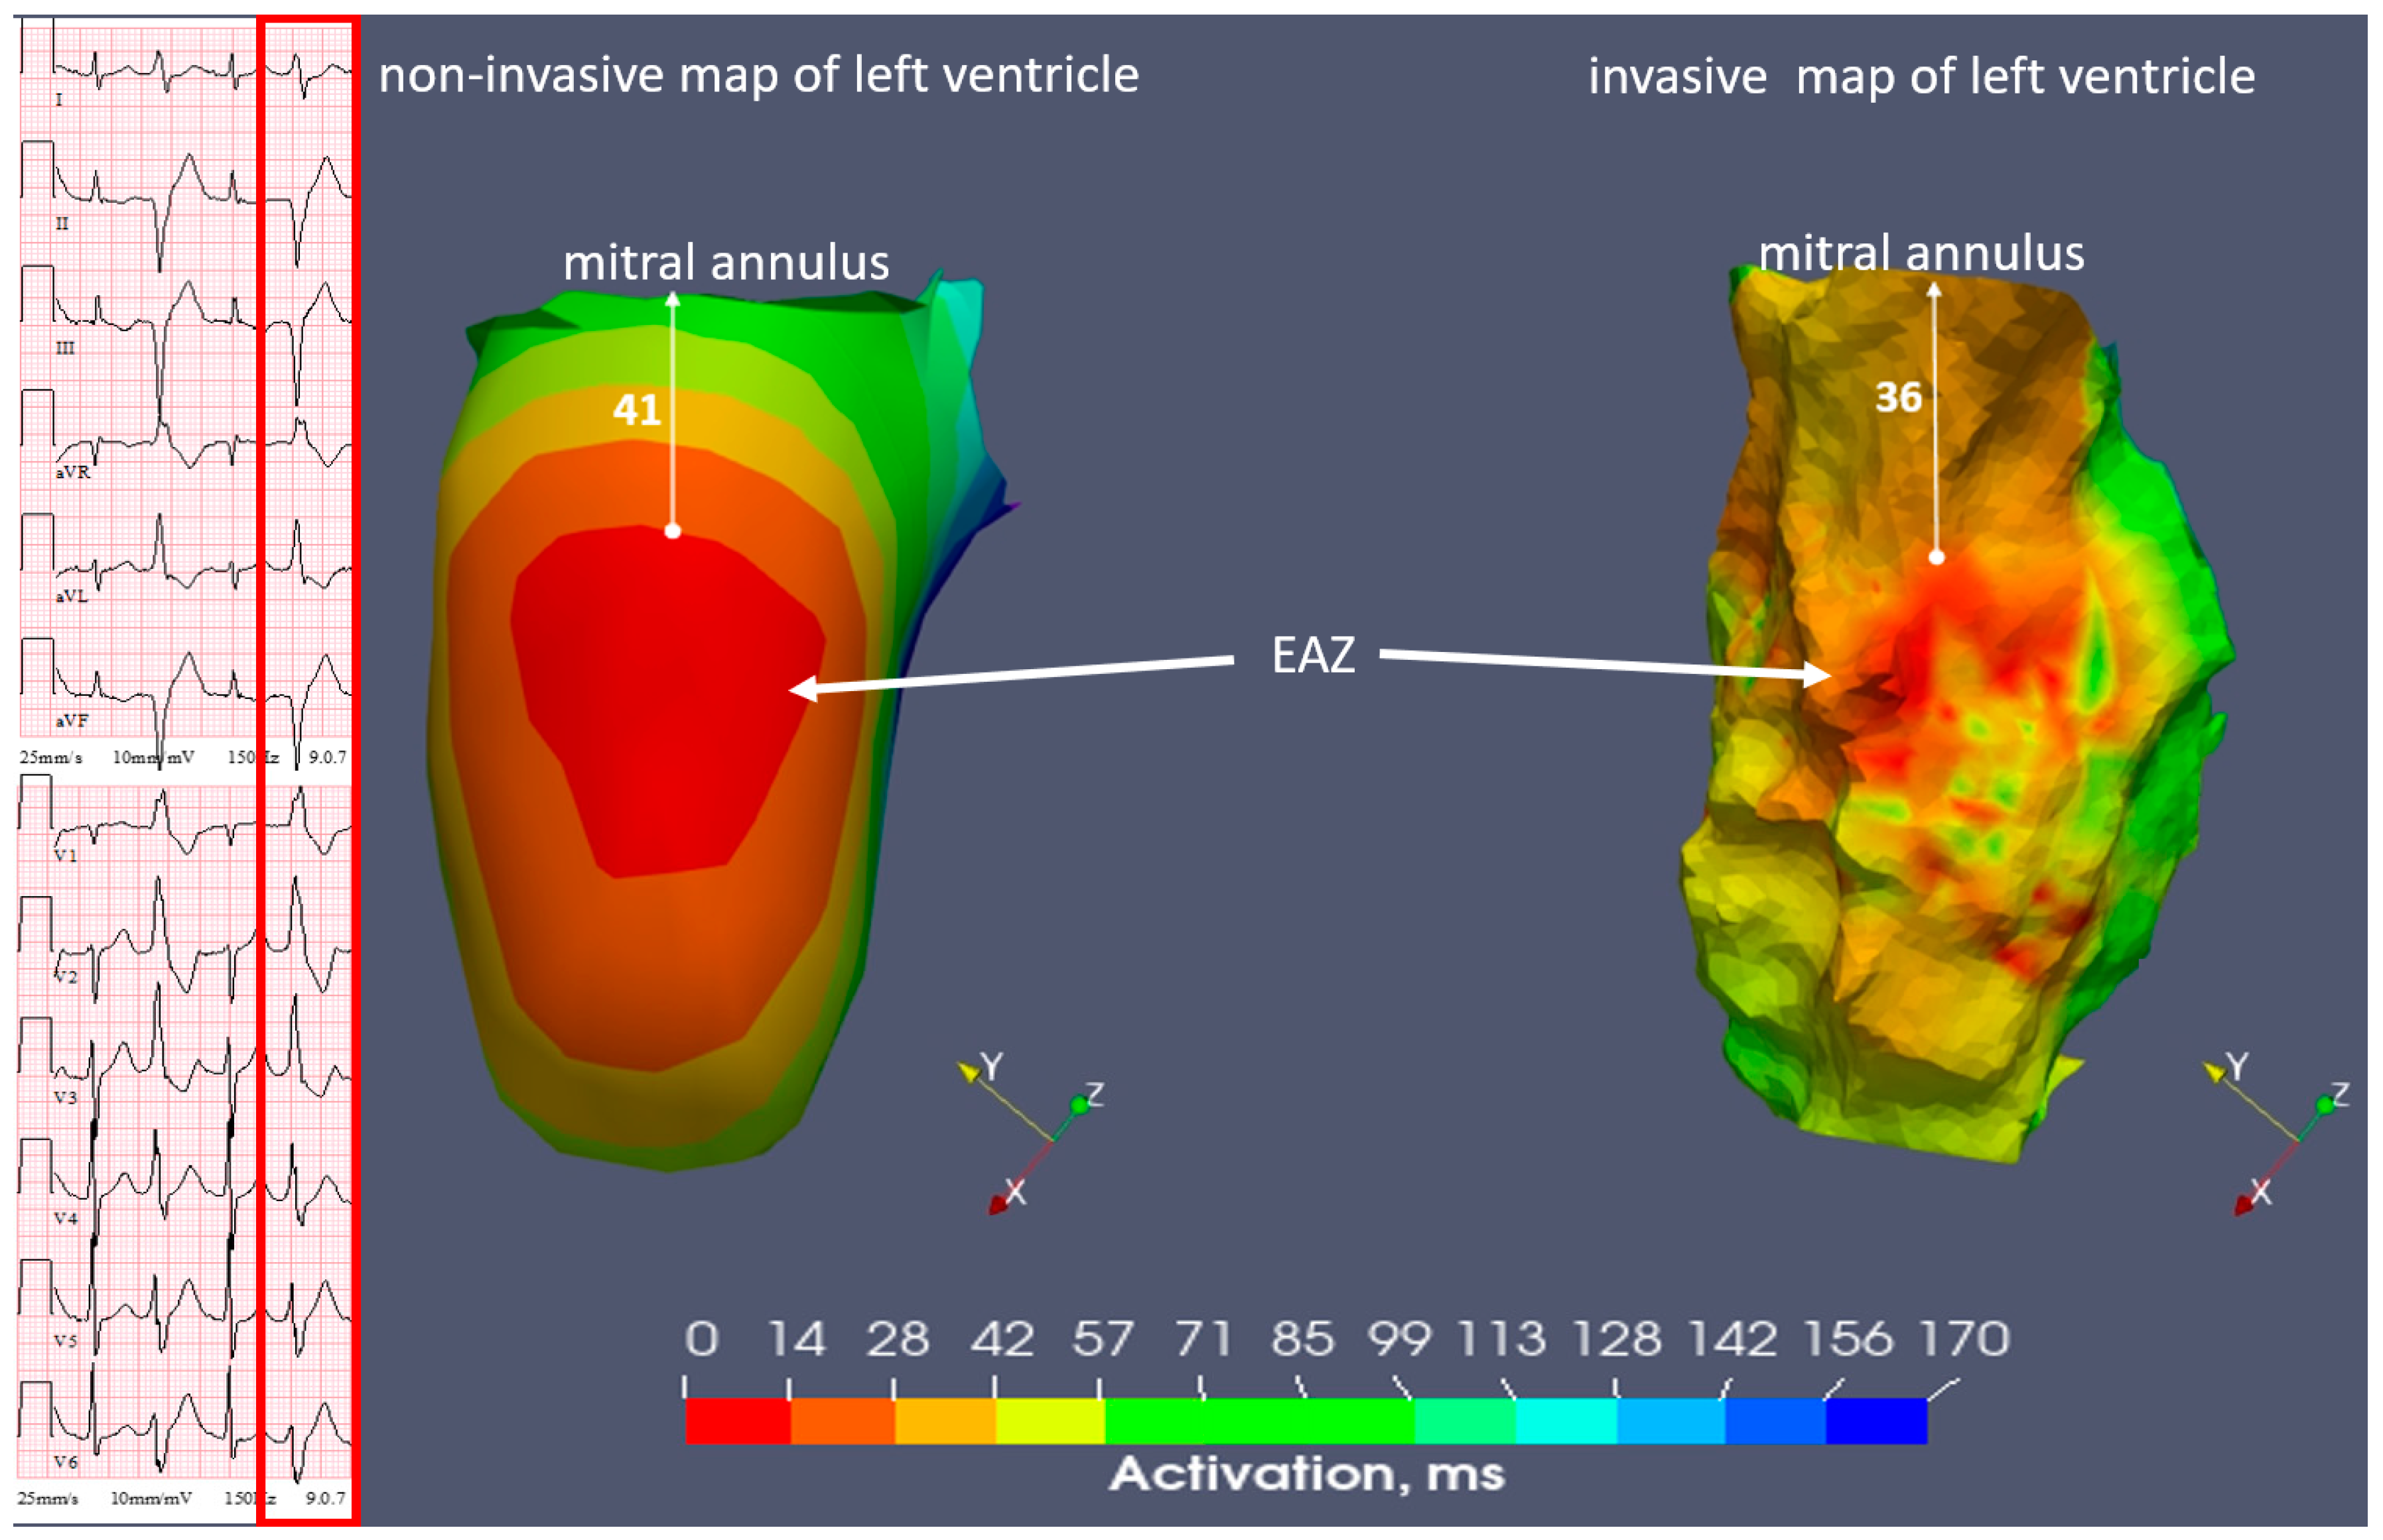
| Distance from EAZ to annulus, mm | |||
| Invasive | 36 | 73 | 9 |
| Non-invasive | 41 | 75 | 12 |
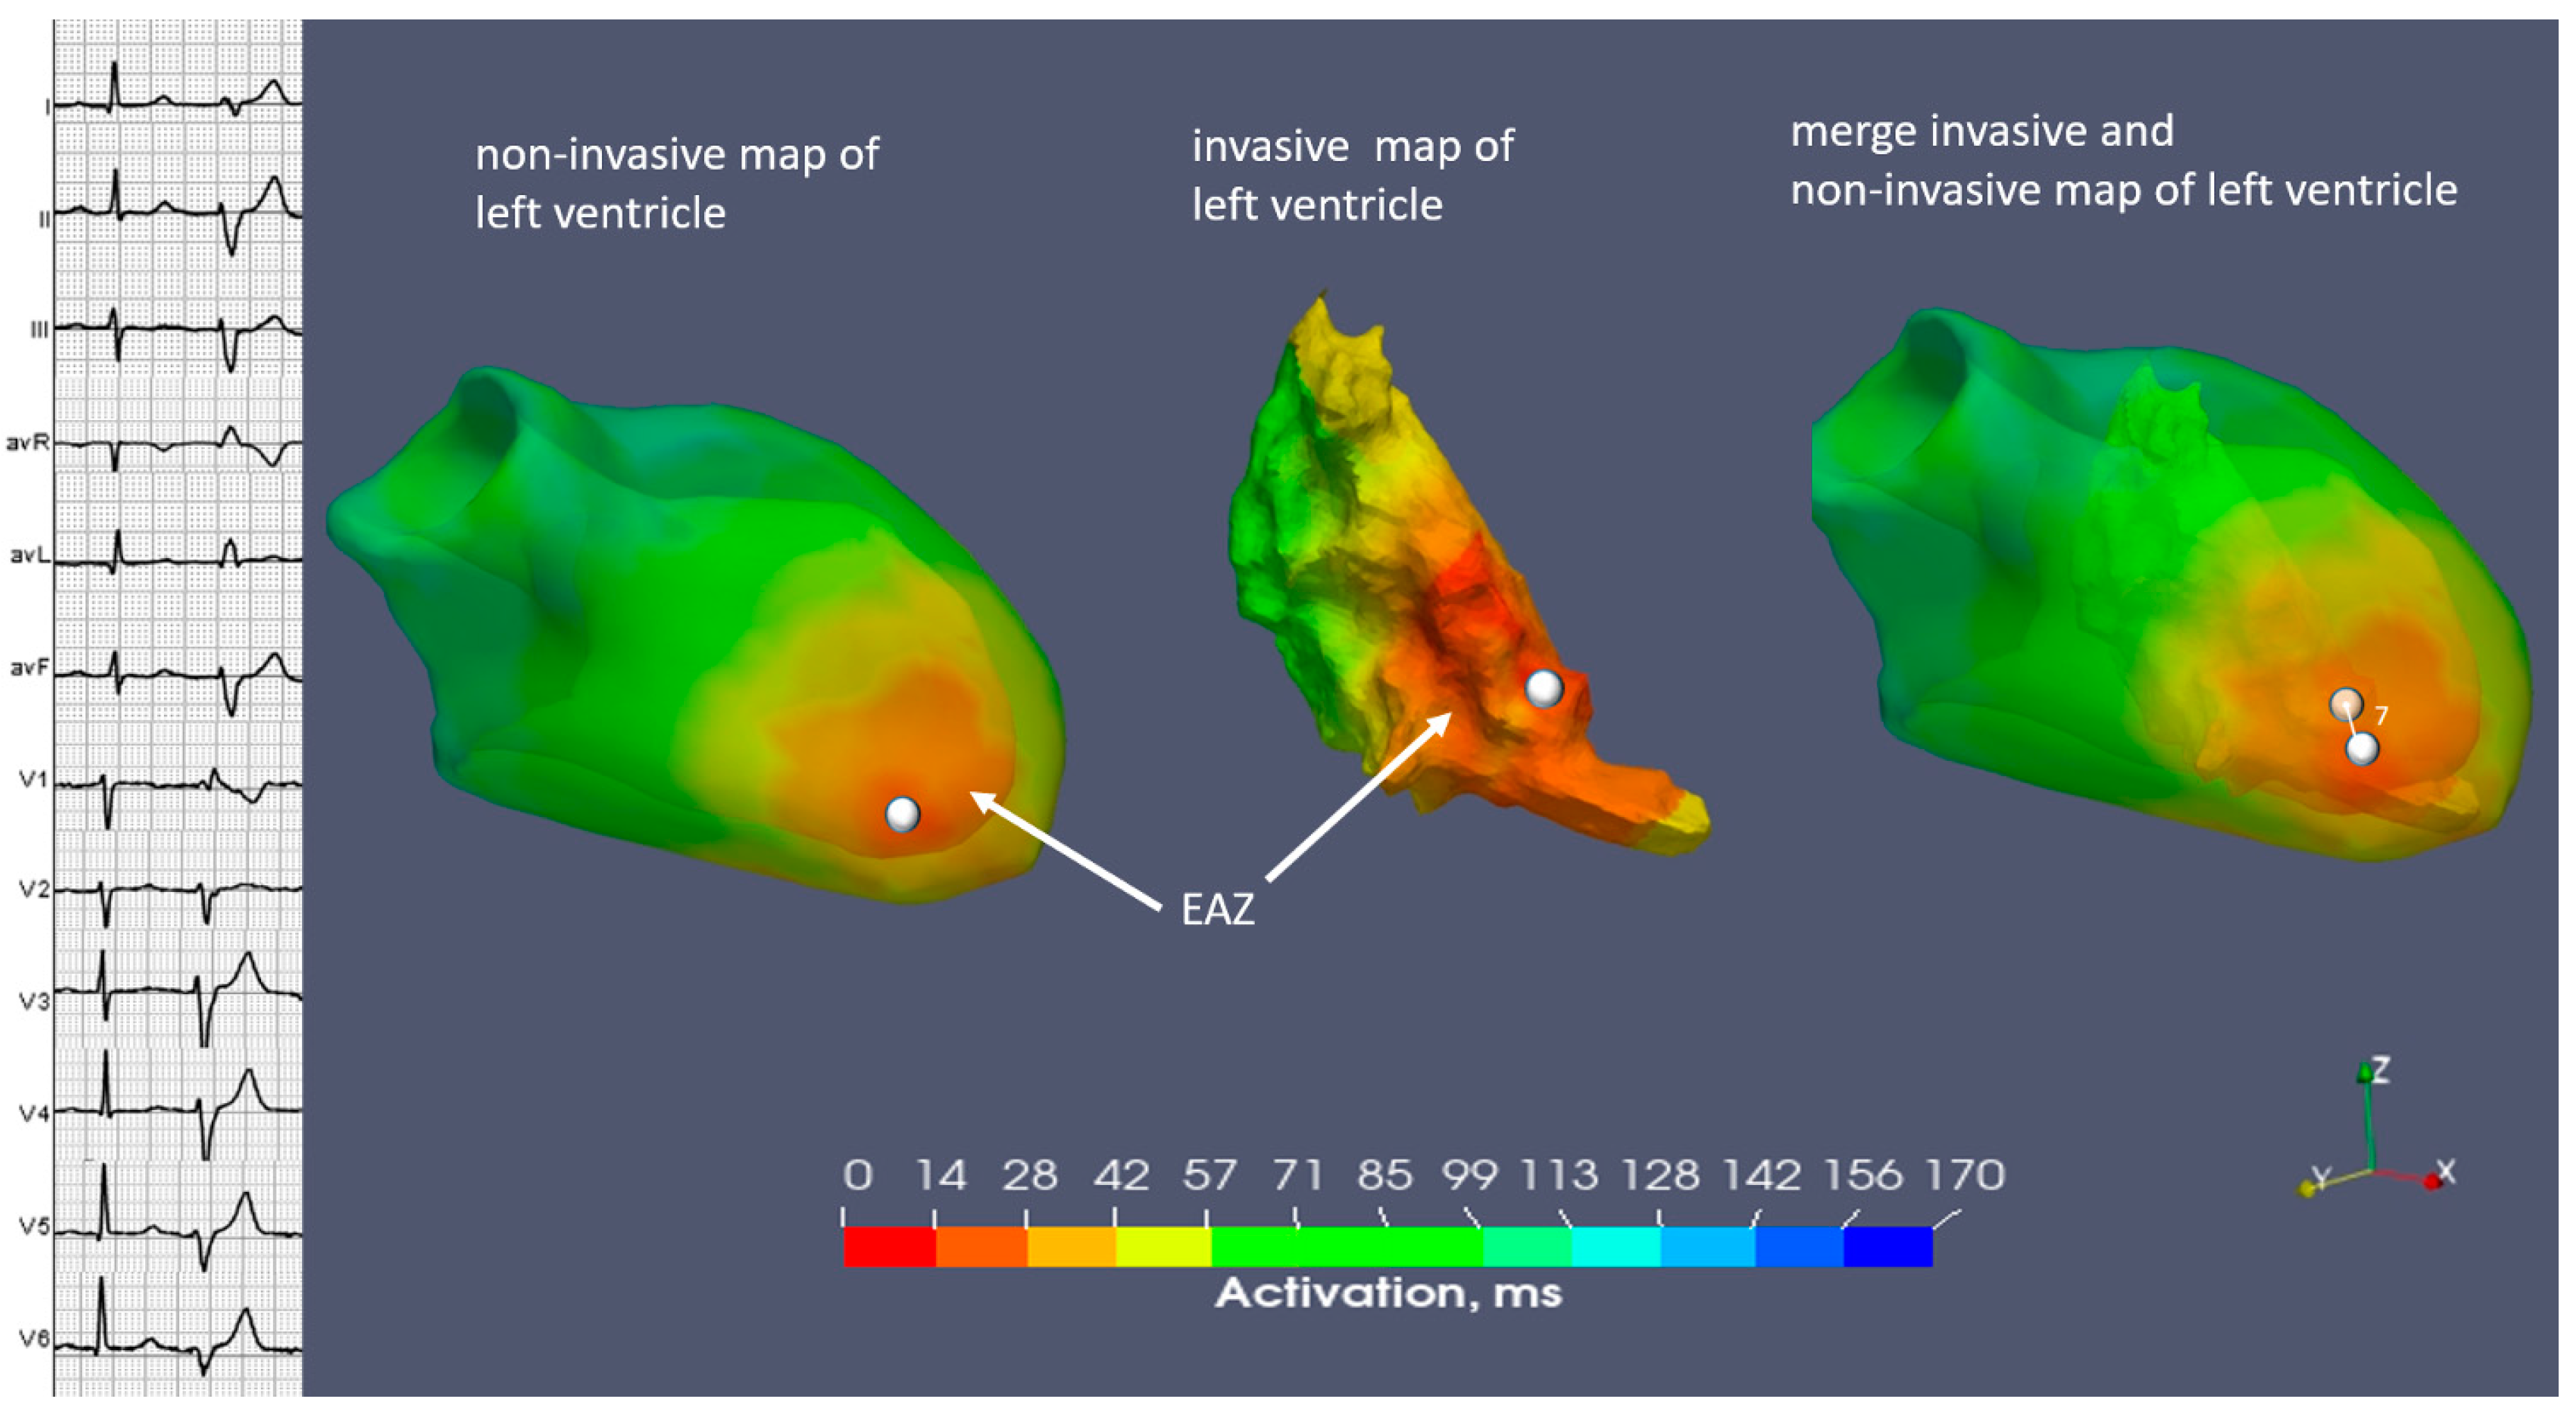
| Distance between the earliest activation site on invasive and non-invasive map, mm | 4 | 7 | 4 |
Disclaimer/Publisher’s Note: The statements, opinions and data contained in all publications are solely those of the individual author(s) and contributor(s) and not of MDPI and/or the editor(s). MDPI and/or the editor(s) disclaim responsibility for any injury to people or property resulting from any ideas, methods, instructions or products referred to in the content. |
© 2024 by the authors. Licensee MDPI, Basel, Switzerland. This article is an open access article distributed under the terms and conditions of the Creative Commons Attribution (CC BY) license (https://creativecommons.org/licenses/by/4.0/).
Share and Cite
Muça, M.; Zubarev, S.; Bastian, D.; Walaschek, J.; Buia, V.; Rittger, H.; Dokuchaev, A.; Bayer, T.; Vitali-Serdoz, L. Fusion Imaging of Non-Invasive and Invasive Cardiac Electroanatomic Mapping in Patients with Ventricular Ectopic Beats: A Feasibility Analysis in a Case Series. Diagnostics 2024, 14, 622. https://doi.org/10.3390/diagnostics14060622
Muça M, Zubarev S, Bastian D, Walaschek J, Buia V, Rittger H, Dokuchaev A, Bayer T, Vitali-Serdoz L. Fusion Imaging of Non-Invasive and Invasive Cardiac Electroanatomic Mapping in Patients with Ventricular Ectopic Beats: A Feasibility Analysis in a Case Series. Diagnostics. 2024; 14(6):622. https://doi.org/10.3390/diagnostics14060622
Chicago/Turabian StyleMuça, Matilda, Stepan Zubarev, Dirk Bastian, Janusch Walaschek, Veronica Buia, Harald Rittger, Arsenii Dokuchaev, Thomas Bayer, and Laura Vitali-Serdoz. 2024. "Fusion Imaging of Non-Invasive and Invasive Cardiac Electroanatomic Mapping in Patients with Ventricular Ectopic Beats: A Feasibility Analysis in a Case Series" Diagnostics 14, no. 6: 622. https://doi.org/10.3390/diagnostics14060622