
Integrating Patient-Based Real-Time Quality Control (PBRTQC) in a New Field: Inter-Comparison between Biochemical Instrumentations with LDL-C

Abstract
:1. Introduction
2. Methods
2.1. Data
2.2. Materials and Methodology
2.2.1. Materials
Patient Data Collection
Instruments and Reagents and Software Platform
Experimental Conditions
2.2.2. Methodology
Establishment
Comparison Program
Statistical Analysis Methods
Judgment Criteria
3. Results
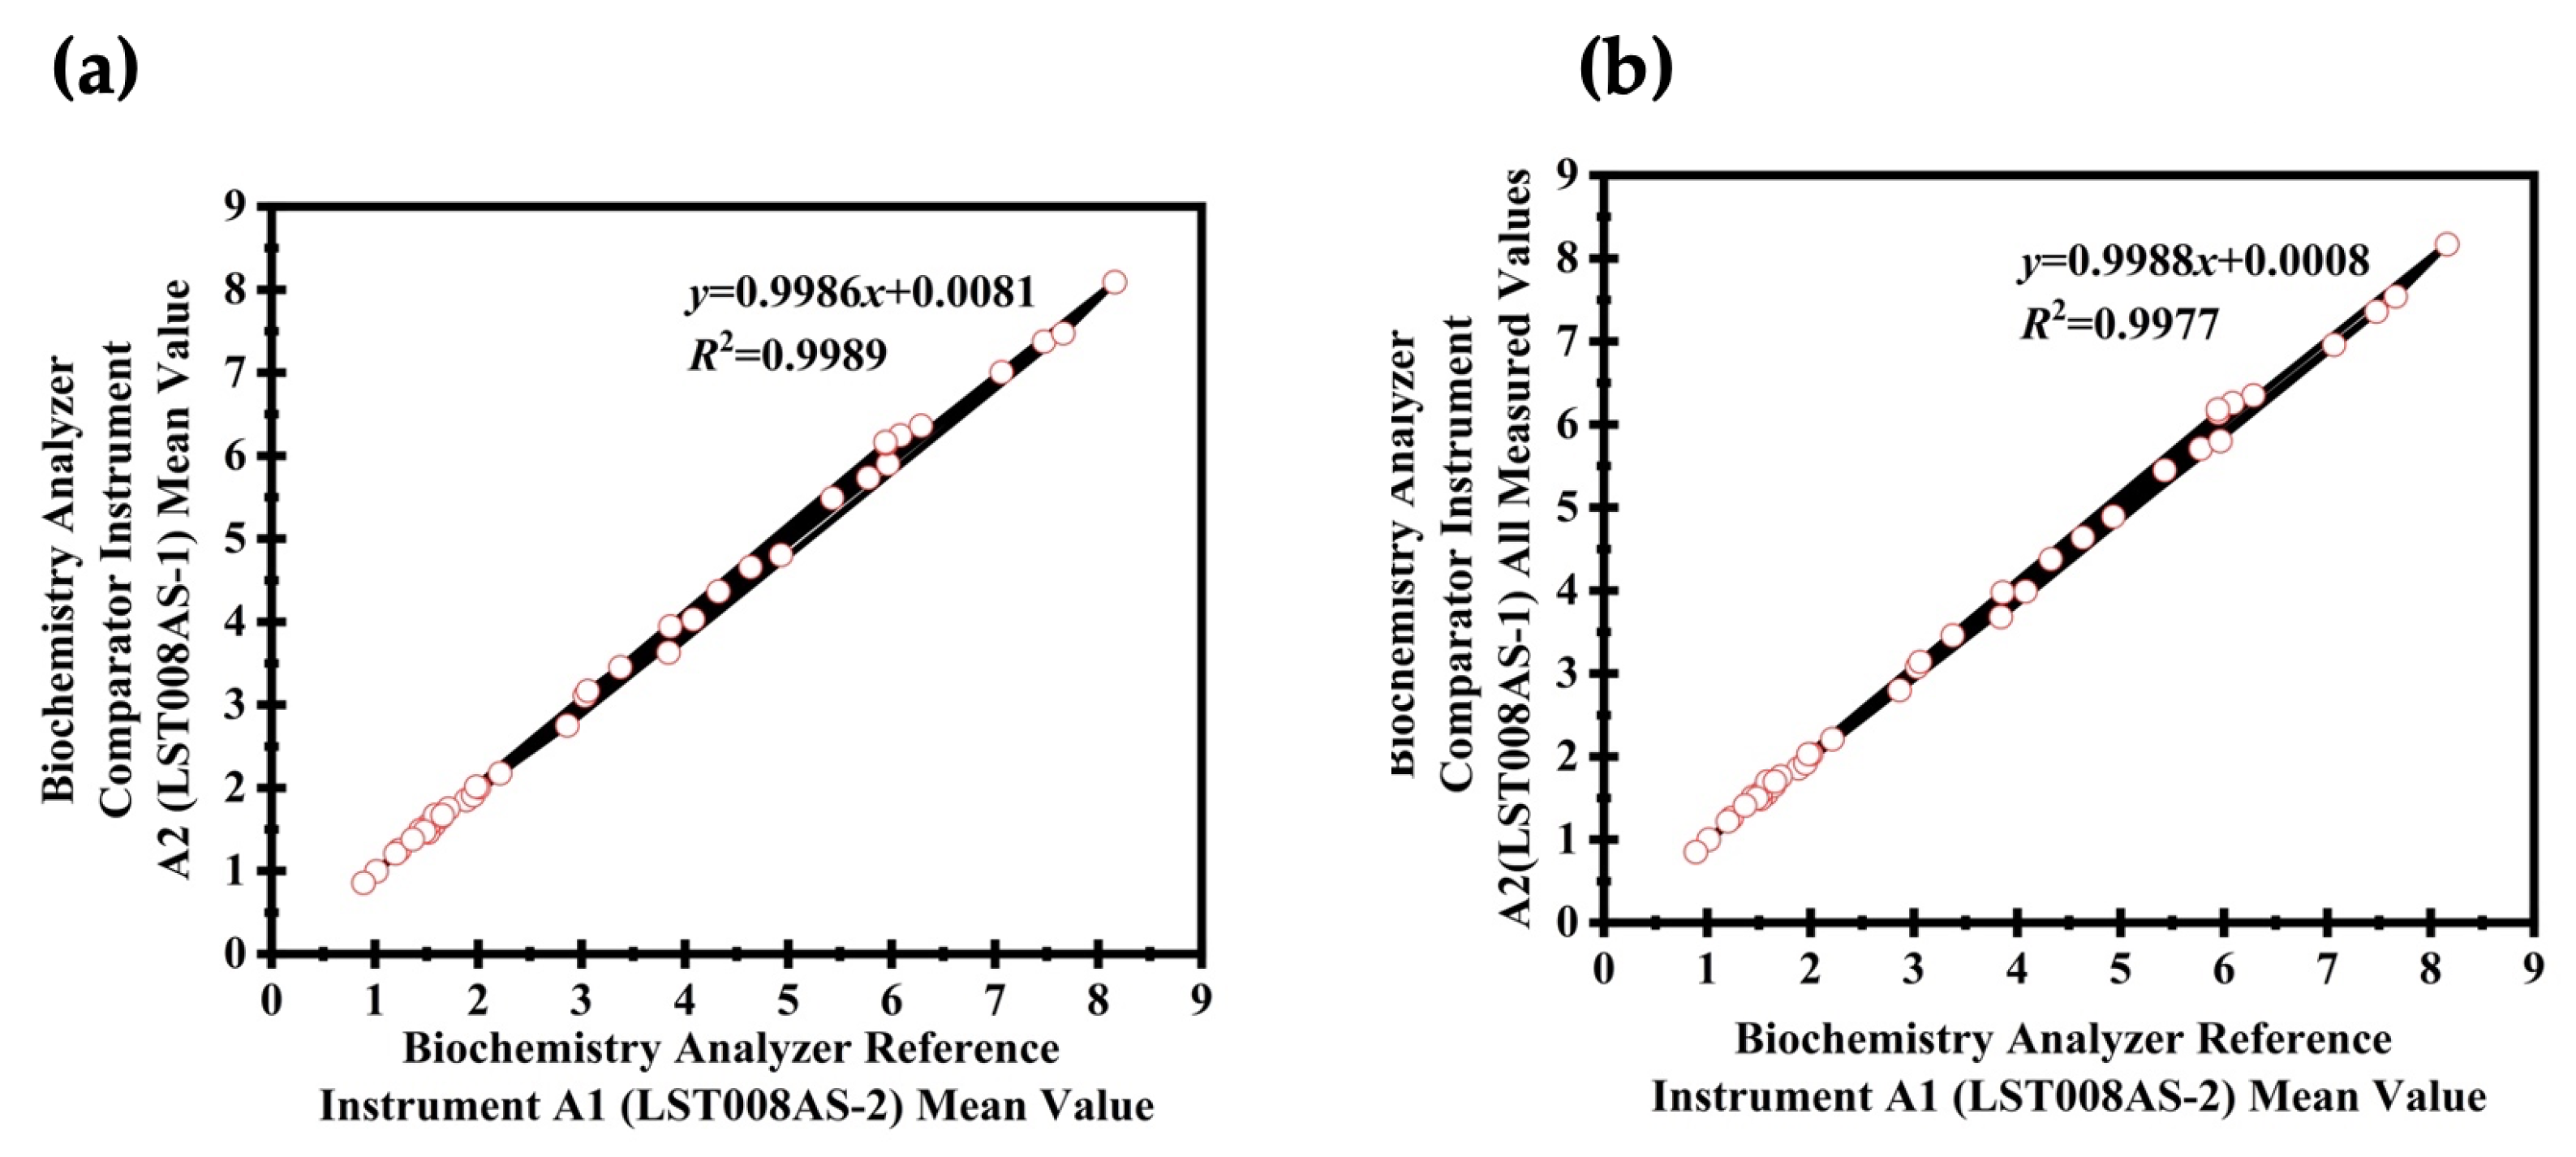
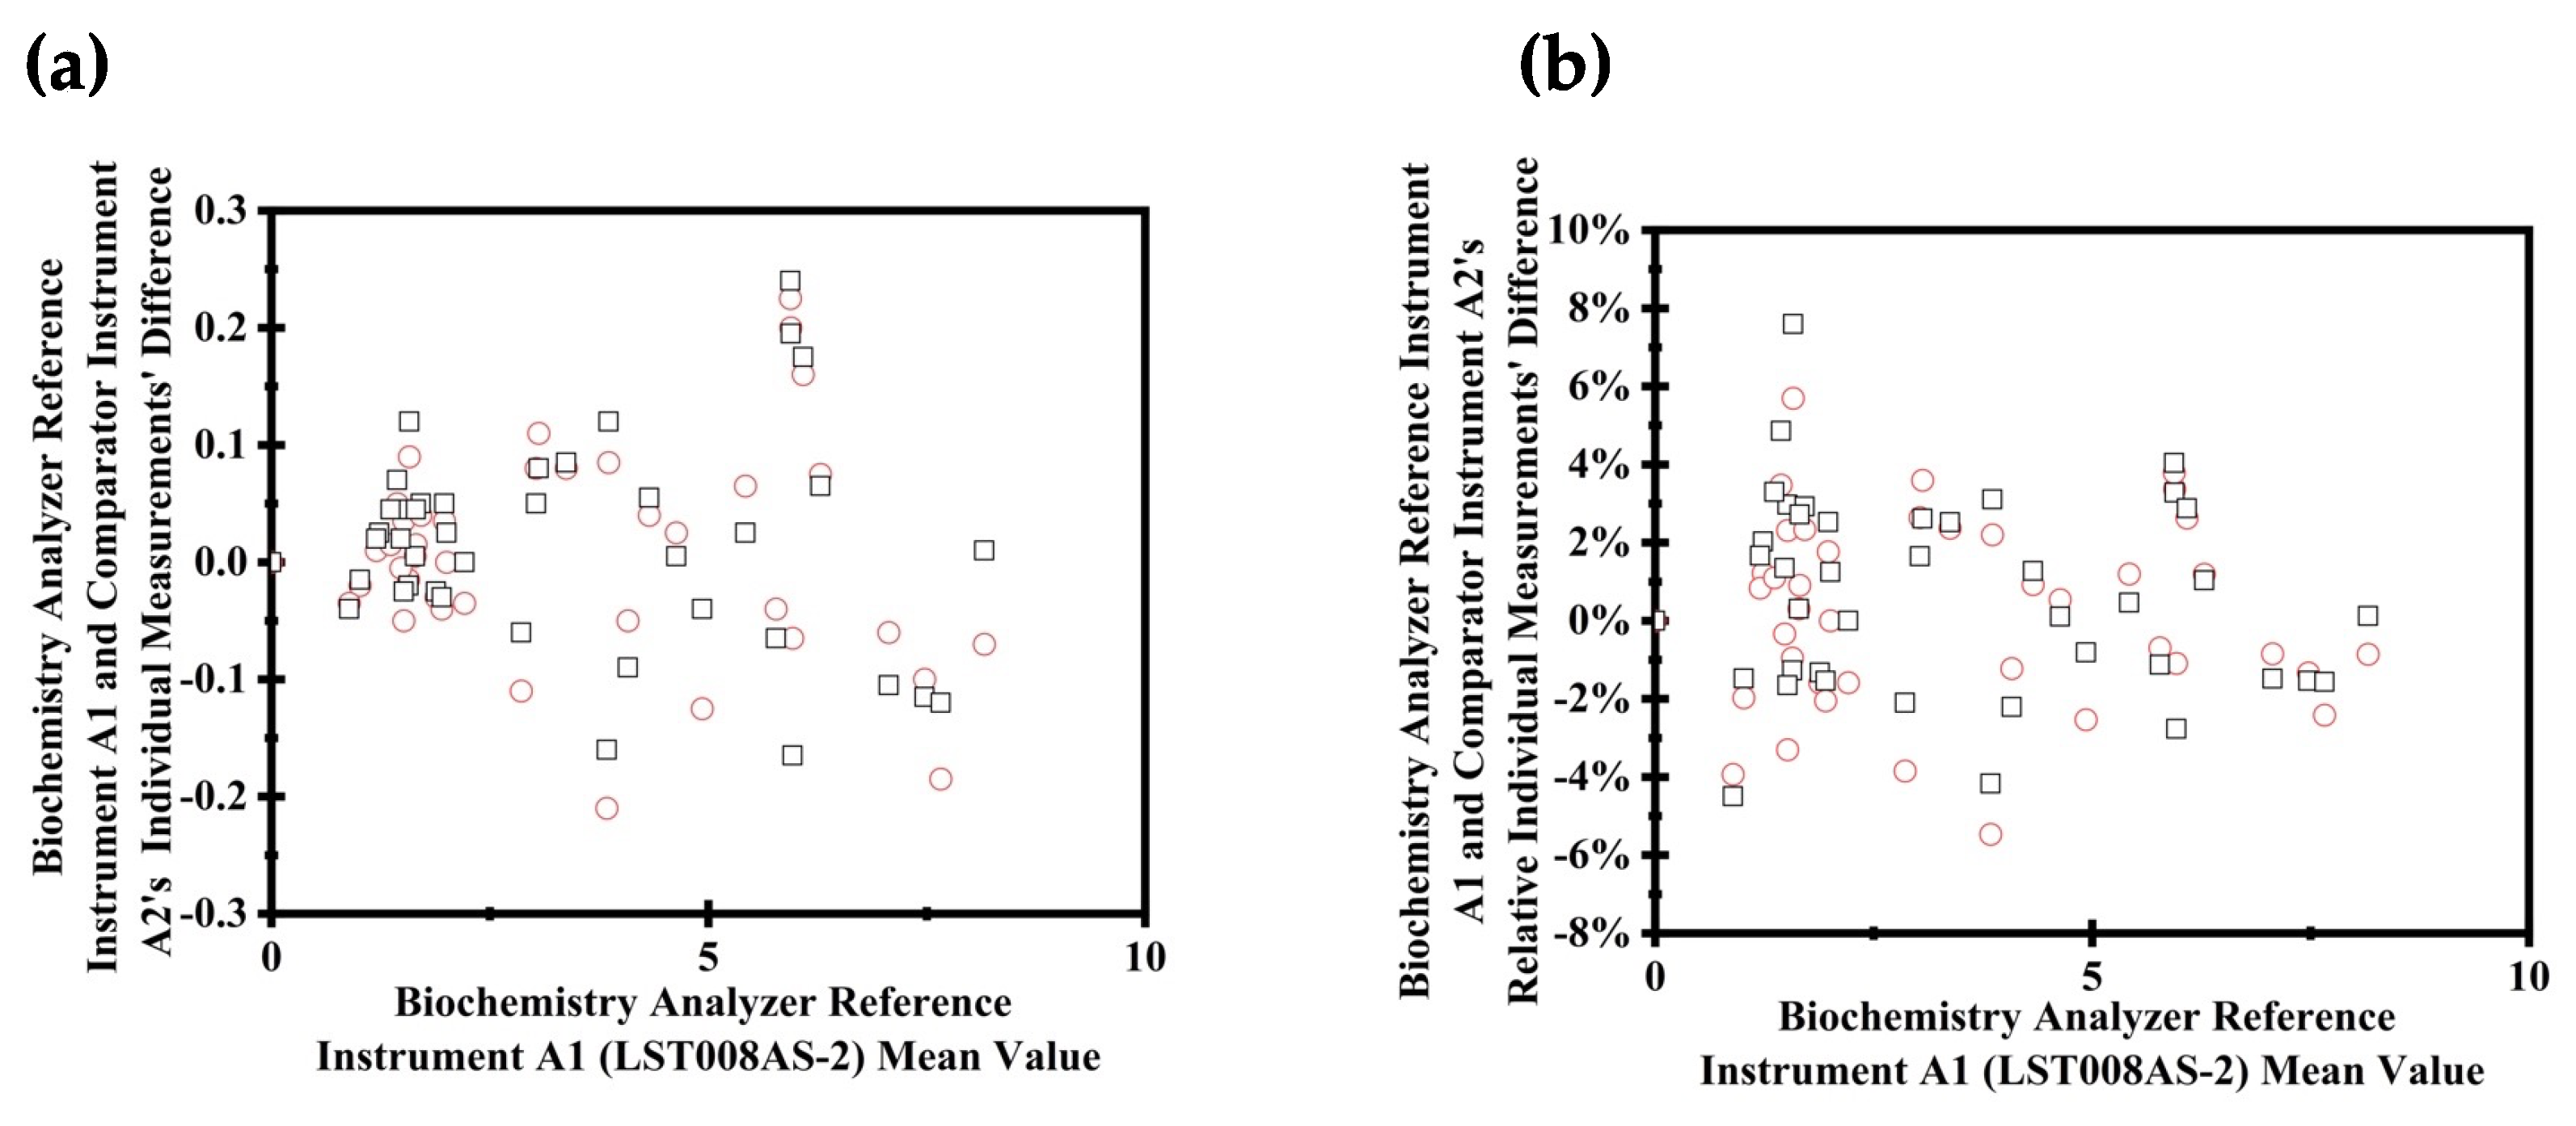
Comparison
4. Discussion
5. Conclusions
Author Contributions
Funding
Institutional Review Board Statement
Informed Consent Statement
Data Availability Statement
Acknowledgments
Conflicts of Interest
References
- Hoogeveen, R.C.; Ballantyne, C.M. Residual Cardiovascular Risk at Low LDL: Remnants, Lipoprotein(a), and Inflammation. Clin. Chem. 2021, 67, 143–153. [Google Scholar] [CrossRef] [PubMed]
- Carter, J.F.; Fry, B. Ensuring the reliability of stable isotope ratio data—Beyond the principle of identical treatment. Anal. Bioanal. Chem. 2013, 405, 2799–2814. [Google Scholar] [CrossRef] [PubMed]
- Stepman, H.C.M.; Tiikkainen, U.; Stöckl, D.; Vesper, H.W.; Edwards, S.H.; Laitinen, H.; Pelanti, J.; Thienpont, L.M. Measurements for 8 common analytes in native sera identify inadequate standardization among 6 routine laboratory assays. Clin. Chem. 2014, 60, 855–863. [Google Scholar] [CrossRef] [PubMed]
- Bayat, H.; Westgard, S.A.; Westgard, J.O. Multirule procedures vs moving average algorithms for IQC: An appropriate comparison reveals how best to combine their strengths. Clin. Biochem. 2022, 102, 50–55. [Google Scholar] [CrossRef] [PubMed]
- Duan, X.; Wang, B.; Zhu, J.; Shao, W.; Wang, H.; Shen, J.; Wu, W.; Jiang, W.; Yiu, K.L.; Pan, B.; et al. Assessment of patient-based real-time quality control algorithm performance on different types of analytical error. Clin. Chim. Acta 2020, 511, 329–335. [Google Scholar] [CrossRef] [PubMed]
- Ma, C.; Wang, X.; Wu, J.; Cheng, X.; Xia, L.; Xue, F.; Qiu, L. Real-world big-data studies in laboratory medicine: Current status, application, and future considerations. Clin. Biochem. 2020, 84, 21–30. [Google Scholar] [CrossRef] [PubMed]
- Loh, T.P.; Cervinski, M.A.; Katayev, A.; Bietenbeck, A.; van Rossum, H.; Badrick, T. Recommendations for laboratory informatics specifications needed for the application of patient-based real time quality control. Clin. Chim. Acta 2019, 495, 625–629. [Google Scholar] [CrossRef] [PubMed]
- Smith, J.D.; Badrick, T.; Bowling, F. A direct comparison of patient-based real-time quality control techniques: The importance of the analyte distribution. Ann. Clin. Biochem. Int. J. Biochem. Lab. Med. 2020, 57, 206–214. [Google Scholar] [CrossRef] [PubMed]
- Bietenbeck, A.; Cervinski, M.A.; Katayev, A.; Loh, T.P.; Van Rossum, H.H.; Badrick, T. Understanding Patient-Based Real-Time Quality Control Using Simulation Modeling. Clin. Chem. 2020, 66, 1072–1083. [Google Scholar] [CrossRef]
- Van Rossum, H.H.; Bietenbeck, A.; Cervinski, M.A.; Katayev, A.; Loh, T.P.; Badrick, T.C. Benefits, limitations and controversies on patient-based real-time quality control (PBRTQC) and the evidence behind the practice. Clin. Chem. Lab. Med. 2021, 59, 1213–1220. [Google Scholar] [CrossRef]
- Van Rossum, H.H. Technical quality assurance and quality control for medical laboratories: A review and proposal of a new concept to obtain integrated and validated QA/QC plans. Crit. Rev. Clin. Lab. Sci. 2022, 59, 586–600. [Google Scholar] [CrossRef]
- Van Rossum, H.H.; Broek, D.V.D. Ten-Month Evaluation of the Routine Application of Patient Moving Average for Real-Time Quality Control in a Hospital Setting. J. Appl. Lab. Med. 2020, 5, 1184–1193. [Google Scholar] [CrossRef]
- Zhou, R.; Liang, Y.-F.; Cheng, H.-L.; Padoan, A.; Wang, Z.; Feng, X.; Han, Z.-W.; Song, B.; Wang, W.; Plebani, M.; et al. A multi-model fusion algorithm as a real-time quality control tool for small shift detection. Comput. Biol. Med. 2022, 148, 105866. [Google Scholar] [CrossRef]
- Wilson, A.; Roberts, W.L.; Pavlov, I.; Fontenot, J.; Jackson, B. Patient result median monitoring for clinical laboratory quality control. Clin. Chim. Acta 2011, 412, 1441–1446. [Google Scholar] [CrossRef]
- Van Rossum, H.H. Moving average quality control: Principles, practical application and future perspectives. Clin. Chem. Lab. Med. 2019, 57, 773–782. [Google Scholar] [CrossRef]
- Topcu, D.I.; Çubukçu, H.C. Optimization of patient-based real-time quality control based on the Youden index. Clin. Chim. Acta 2022, 534, 50–56. [Google Scholar] [CrossRef]
- Song, C.; Zhou, J.; Xia, J.; Ye, D.; Chen, Q.; Li, W. Optimization and validation of patient-based real-time quality control procedure using moving average and average of normals with multi-rules for TT3, TT4, FT3, FT3, and TSH on three analyzers. J. Clin. Lab. Anal. 2020, 34, e23314. [Google Scholar] [CrossRef]
- CNAS-CL02:2012; Accreditation Criteria for the Quality and Competence of Medical Laboratories (2nd Revision) [ISO 15189:2012, IDT]. China National Accreditation Service for Conformity Assessment: Beijing, China, 2019.
- ISO 15189:2012; Medical Laboratories—Requirements for Quality and Competence. International Organization for Standardization: Geneva, Switzerland, 2012.
- Badrick, T.; Loh, T.P. Developing an evidence-based approach to quality control. Clin. Biochem. 2023, 114, 39–42. [Google Scholar] [CrossRef]
- Ricós, C.; Fernandez-Calle, P.; Perich, C.; Westgard, J.O. Internal quality control—Past, present and future trends. Adv. Lab. Med. 2022, 3, 243–252. [Google Scholar] [CrossRef]
- Loh, T.P.; Bietenbeck, A.; Cervinski, M.A.; van Rossum, H.H.; Katayev, A.; Badrick, T.; Null, N. Recommendation for performance verification of patient-based real-time quality control. Clin. Chem. Lab. Med. 2020, 58, 1205–1213. [Google Scholar] [CrossRef]
- Brown, A.S.; Badrick, T. The next wave of innovation in laboratory automation: Systems for auto-verification, quality control and specimen quality assurance. Clin. Chem. Lab. Med. 2023, 61, 37–43. [Google Scholar] [CrossRef] [PubMed]
- Westgard, J.O.; Cervera, J. Intelligent Quality Management 2 with IntraSpect™ technology for quality control of GEM® Premier™ 5000 blood gas analyzers—A novel application of the patient sample as its own control. Pract. Lab. Med. 2022, 30, e00273. [Google Scholar] [CrossRef] [PubMed]
- Li, T.; Li, J.; Cao, S.; Wang, Y.; Wang, H.; Zhang, C.; Ke, P.; Huang, X. Patient-based real-time quality control for quantitative hepatitis B virus DNA test using moving rate of positive and negative patient results. Clin. Chem. Lab. Med. 2022, 60, 1577–1585. [Google Scholar] [CrossRef]


| Test Name | Patient Group Concentration Range (mmoL/L) | Judgment Criteria ½ Total Error (15%) | Fresh Specimen Results | |||||||
|---|---|---|---|---|---|---|---|---|---|---|
| EP15A2 (Quality Target 15%) | EP9A2 (Quality Target 15%) | |||||||||
| Medical Decision Level 1 | Medical Decision Level 2 | Medical Decision Level 3 | Mean Bias % of Fresh Specimens | |||||||
| 3.4 mmoL/L | 4.1 mmoL/L | 4.9 mmoL/L | ||||||||
| Mean Bias % of Fresh Specimens | Lower 95% Confidence Interval | Upper 95% Confidence Interval | Lower 95% Confidence Interval | Upper 95% Confidence Interval | Lower 95% Confidence Interval | Upper 95% Confidence Interval | ||||
| EP15A2 | EP9-A2 | EP9-A2 | EP9-A2 | EP9-A2 | EP9-A2 | EP9-A2 | EP9-A2 | |||
| LDL (Total) | 0.81–3.76 | Bias | 0.76% | −0.51% | 0.83% | −0.49% | 0.66% | −0.53% | 0.57% | 0.21% |
| Conclusion | * | * | * | * | * | * | * | * | ||
| LDL (First Day) | 1.2–6.4 | Bias | 0.47% | −5.09% | 1.09% | −0.34% | 1.11% | −0.22% | 1.18% | −0.13% |
| Conclusion | * | * | * | * | * | * | * | * | ||
| LDL (Second Day) | 1.2–7.5 | Bias | 0.29% | −2.19% | −0.01% | −2.01% | −0.21% | −1.93% | −0.30% | −1.17% |
| Conclusion | * | * | * | * | * | * | * | * | ||
| LDL (Third Day) | 1.4–8.5 | Bias | −4.30% | −3.84% | −1.34% | −3.37% | −1.39% | −3.08% | −1.34% | −2.50% |
| Conclusion | * | * | * | * | * | * | * | * | ||
| LDL (Fourth Day) | 1.5–6.2 | Bias | −1.43% | 2.37% | 3.94% | 2.33% | 3.96% | 2.24% | 4.03% | 3.22% |
| Conclusion | * | * | * | * | * | * | * | * | ||
| LDL (Fifth Day) | 1.4–6.2 | Bias | 1.19% | 1.40% | 2.93% | 1.74% | 3.10% | 1.93% | 3.31% | 1.62% |
| Conclusion | * | * | * | * | * | * | * | * | ||
| Test Name | Patient Group Concentration Range (mmoL/L) | Judgment Criteria ½ Total Error (15%) | PBRTQC | QC Comparison Bias (15%) | Calibrator Comparison Bias (15%) | ||
|---|---|---|---|---|---|---|---|
| MM (Quality Target 15%) | EWMA (Quality Target 15%) | ||||||
| Level 2 | Level 3 | Calibrator Bias% | |||||
| Bias % | Bias % | Average Bias % | Average Bias % | ||||
| MM | EWMA | QC 2 | QC 3 | Calibrator | |||
| LDL (Total) | 0.81–3.76 | Bias | 2.55% | 0.62% | 0.44% | 0.07% | 0.92% |
| Conclusion | * | * | * | * | * | ||
| LDL (First Day) | 1.2–6.4 | Bias | 1.26% | −2.04% | 0.16% | −0.10% | 0.33% |
| Conclusion | * | * | * | * | * | ||
| LDL (Second Day) | 1.2–7.5 | Bias | 2.03% | 2.94% | 0.00% | −0.98% | −1.14% |
| Conclusion | * | * | * | * | * | ||
| LDL (Third Day) | 1.4–8.5 | Bias | 14.01% | 3.01% | −3.75% | −0.79% | −1.56% |
| Conclusion | * | * | * | * | * | ||
| LDL (Fourth Day) | 1.5–6.2 | Bias | −24.66% | −1.08% | 3.85% | 1.91% | 4.96% |
| Conclusion | Incomparable | * | * | * | * | ||
| LDL (Fifth Day) | 1.4–6.2 | Bias | 6.75% | 1.25% | 1.97% | 0.30% | 2.03% |
| Conclusion | * | * | * | * | * | ||
Disclaimer/Publisher’s Note: The statements, opinions and data contained in all publications are solely those of the individual author(s) and contributor(s) and not of MDPI and/or the editor(s). MDPI and/or the editor(s) disclaim responsibility for any injury to people or property resulting from any ideas, methods, instructions or products referred to in the content. |
© 2024 by the authors. Licensee MDPI, Basel, Switzerland. This article is an open access article distributed under the terms and conditions of the Creative Commons Attribution (CC BY) license (https://creativecommons.org/licenses/by/4.0/).
Share and Cite
Wang, J.; Zhao, C.; Fan, L.; Wang, X. Integrating Patient-Based Real-Time Quality Control (PBRTQC) in a New Field: Inter-Comparison between Biochemical Instrumentations with LDL-C. Diagnostics 2024, 14, 872. https://doi.org/10.3390/diagnostics14090872
Wang J, Zhao C, Fan L, Wang X. Integrating Patient-Based Real-Time Quality Control (PBRTQC) in a New Field: Inter-Comparison between Biochemical Instrumentations with LDL-C. Diagnostics. 2024; 14(9):872. https://doi.org/10.3390/diagnostics14090872
Chicago/Turabian StyleWang, Jingyuan, Chedong Zhao, Linlin Fan, and Xiaoqin Wang. 2024. "Integrating Patient-Based Real-Time Quality Control (PBRTQC) in a New Field: Inter-Comparison between Biochemical Instrumentations with LDL-C" Diagnostics 14, no. 9: 872. https://doi.org/10.3390/diagnostics14090872