When Medicine Meets Engineering—Paradigm Shifts in Diagnostics and Therapeutics

Abstract
:List of Abbreviations
| cDNA | Complementary DNA |
| CE | Capillary Electrophoresis |
| DMF | Digital Microfluidics |
| DTPAs | DNA to Protein Arrays |
| ERK1/2 | Extracellular Signal-Regulated Protein Kinases 1 and 2 |
| ESI | Electrospray Ionization |
| EWOD | Electrowetting on Dielectrics |
| FCS | Fluorescent Cross-correlation Spectroscopy |
| FDA | US Food and Drug Administration |
| FRET | Fluorescent Resonance Energy Transfer |
| FSC | Feedback Systems Control |
| GAPDH | Glyceraldehyde 3-phosphate Dehydrogenase |
| GC | Gas Chromatography |
| HIV | Human Immunodeficiency Virus |
| HMG-CoA | 3-hydroxy-3-methylglutaryl-coenzyme A |
| HSV-1 | Herpes Virus Simplex 1 |
| ITT | In Vitro Transcription/Translation |
| LC | Liquid Chromatography |
| LOC | Lab-on-a-Chip |
| LOD | Limit of Detection |
| MALDI | Matrix-assisted Laser Desorption/Ionization |
| MEMS | Micro-Electro-Mechanical Systems |
| MITOMI | Mechanically Induced Trapping of Molecular Interactions |
| mRNA | Messenger RNA |
| MS | Mass Spectrometry |
| PBMCs | Peripheral Blood Mononuclear Cells |
| PCR | Polymerase Chain Reaction |
| POC | Point-of-Care |
| PTMs | Post Translational Modification |
| siRNA | Small Interference RNA |
| SNP | Single Nucleotide Polymorphism |
| SPR | Surface Plasmon Resonance |
| ssDNA | Single-Stranded DNA |
| STM | Scanning Tunneling Microscope |
| TGS | Third Generation Sequencing |
1. Introduction
1.1. Engineering System vs. Bio-Complex System
1.2. Novel Engineering Systems for Diagnostics and Therapeutics
2. Progresses in Diagnostic Systems
2.1. Lab-on-a-Chip (LOC) Based Point-of-Care Diagnosis
2.2. High Throughput Sensor Systems
2.2.1. Genomics

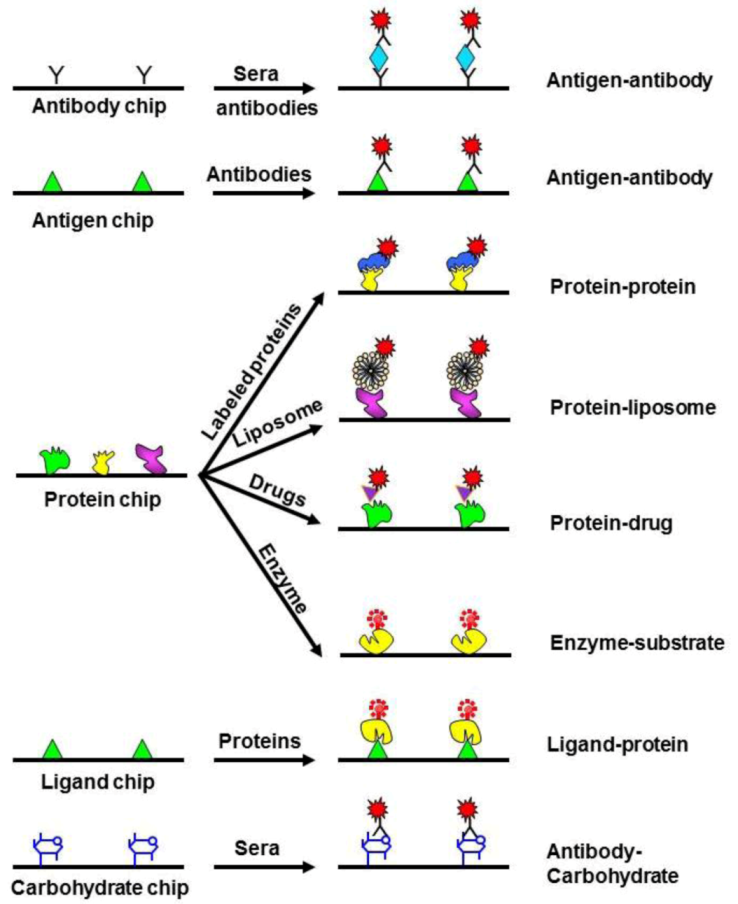
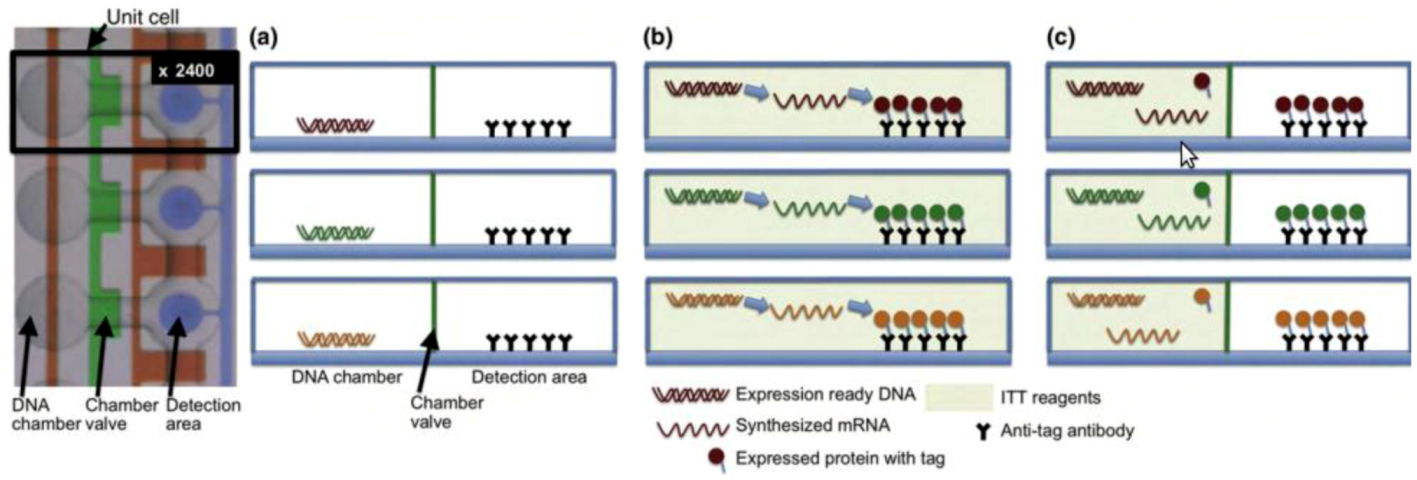
2.2.2. Proteomics
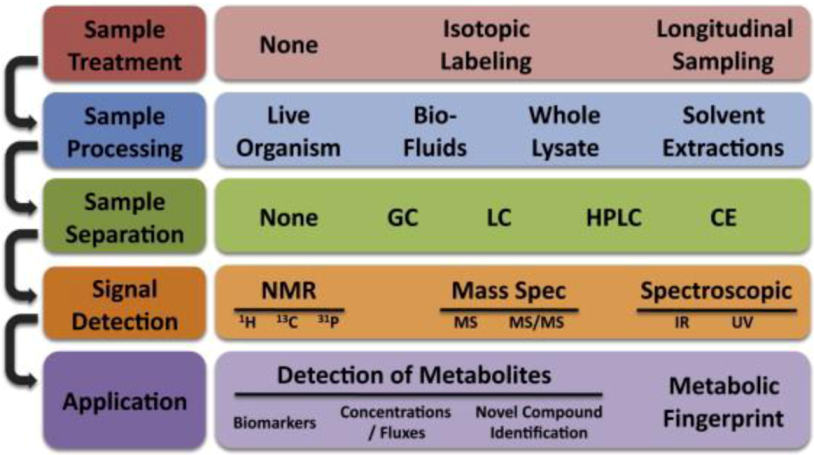
2.2.3. Metabolomics
2.2.4. Single Cell Diagnostics
3. Directing a Bio Complex System toward desired Fate for Therapeutic Purpose
3.1. Bottom-Up Approach of Drug Discovery
3.1.1. Targeted Therapy and Rational Design of Drugs
3.1.2. Network Medicine—A Bottom-Up Approach
3.2. Top-Down Goal Oriented Approach of Combinatorial Drug Optimization
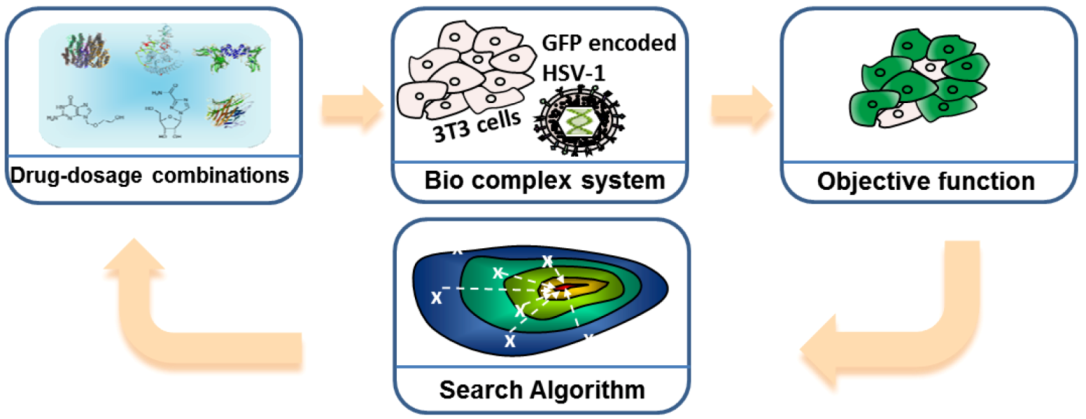
3.2.1. Feedback System Control (FSC) Based Combinatorial Drug Optimization
3.3. Microfluidic Based Instrumentations for Analyzing Cellular Systems
3.3.1. Micro Fluorescence-Activated Cell Sorting (FACS) for Sample Preparation

3.3.2. Dissecting Network Responses through Phosphorylated Protein Analysis
4. Conclusions
Acknowledgments
References
- Ho, C.M. Micro-Nano Technology Systems for Biomedical Applications: Microfluids, Optics & Surface Chemistry; Oxford University Press Inc.: New York, NY, USA, 2010. [Google Scholar]
- Ottino, J.M. Complex systems. AIChE J. 2004, 49, 292–299. [Google Scholar] [CrossRef]
- Parrish, J.K.; Edelstein-Keshet, L. Complexity, pattern, and evolutionary trade-offs in animal aggregation. Science 1999, 284, 99–101. [Google Scholar] [CrossRef]
- Weng, G.; Bhalla, U.S.; Iyengar, R. Complexity in biological signaling systems. Science 1999, 284, 92–96. [Google Scholar] [CrossRef]
- Misteli, T. The concept of self-organization in cellular architecture. J. Cell Biol. 2001, 155, 181–186. [Google Scholar] [CrossRef]
- Loscalzo, J. Systems biology and personalized medicine a network approach to human disease. Proc. Am. Thorac. Soc. 2011, 8, 196–198. [Google Scholar] [CrossRef]
- Loscalzo, J.; Barabasi, A.L. Systems biology and the future of medicine. WIREs Syst. Biol. Med. 2011, 3, 619–627. [Google Scholar] [CrossRef]
- Manz, A.; Graber, N.; Widmer, H. Miniaturized total chemical analysis systems: A novel concept for chemical sensing. Sens. Actuator. B Chem. 1990, 1, 244–248. [Google Scholar] [CrossRef]
- Liu, J.; Tai, Y.C.; Pong, K.C.; Ho, C.M. Micromachined Channel/Pressure Sensor Systems for Micro Flow Studies. In Proceedings of the 7th International Conference on Solid-State Sensors and Actuators (Transducers '93), Yokohama, Japan, 7–10 June 1993; pp. 995–997.
- Brenner, S.; Johnson, M.; Bridgham, J.; Golda, G.; Lloyd, D.H.; Johnson, D.; Luo, S.; McCurdy, S.; Foy, M.; Ewan, M. Gene expression analysis by massively parallel signature sequencing (mpss) on microbead arrays. Nat. Biotechnol. 2000, 18, 630–634. [Google Scholar] [CrossRef] [PubMed]
- Grody, W.W.; Nakamura, R.M.; Kiechle, F.L. Molecular Diagnostics: Techniques and Applications for the Clinical Laboratory; Academic Press: London, UK, 2010. [Google Scholar]
- Pushkarev, D.; Neff, N.F.; Quake, S.R. Single-molecule sequencing of an individual human genome. Nat. Biotechnol. 2009, 27, 847–850. [Google Scholar] [CrossRef]
- Patani, G.A.; LaVoie, E.J. Bioisosterism: A rational approach in drug design. Chem. Rev. 1996, 96, 3147–3176. [Google Scholar] [CrossRef]
- Nolan, G.P. What’s wrong with drug screening today. Nat. Chem. Biol. 2007, 3, 187–191. [Google Scholar] [CrossRef]
- Barabási, A.L. Network medicine—From obesity to the “diseasome”. NEJM 2007, 357, 404–407. [Google Scholar] [CrossRef]
- Barabási, A.L.; Gulbahce, N.; Loscalzo, J. Network medicine: A network-based approach to human disease. Nat. Rev. Genet. 2011, 12, 56–68. [Google Scholar] [CrossRef]
- Pawson, T.; Linding, R. Network medicine. FEBS Lett. 2008, 582, 1266–1270. [Google Scholar] [CrossRef]
- Del Sol, A.; Balling, R.; Hood, L.; Galas, D. Diseases as network perturbations. Curr. Opin. Biotechnol. 2010, 21, 566–571. [Google Scholar] [CrossRef]
- Hood, L.; Heath, J.R.; Phelps, M.E.; Lin, B. Systems biology and new technologies enable predictive and preventative medicine. Science 2004, 306, 640–643. [Google Scholar] [CrossRef]
- Weston, A.D.; Hood, L. Systems biology, proteomics, and the future of health care: Toward predictive, preventative, and personalized medicine. J. Proteome Res. 2004, 3, 179–196. [Google Scholar] [CrossRef]
- Ho, D.; Ho, C.M. System control-mediated drug delivery towards complex systems via nanodiamond carriers. IJSNM 2010, 1, 69–81. [Google Scholar]
- Al-Shyoukh, I.; Yu, F.; Feng, J.; Yan, K.; Dubinett, S.; Ho, C.M.; Shamma, J.S.; Sun, R. Systematic quantitative characterization of cellular responses induced by multiple signals. BMC Syst. Biol. 2011, 5. [Google Scholar] [CrossRef]
- Wong, P.K.; Yu, F.; Shahangian, A.; Cheng, G.; Sun, R.; Ho, C.M. Closed-loop control of cellular functions using combinatory drugs guided by a stochastic search algorithm. Proc. Natl. Acad. Sci. USA 2008, 105, 5105–5110. [Google Scholar] [CrossRef] [PubMed]
- Ding, X.; Sanchez, D.J.; Shahangian, A.; Al-Shyoukh, I.; Cheng, G.; Ho, C.M. Cascade search for hsv-1 combinatorial drugs with high antiviral efficacy and low toxicity. Int. J. Nanomedicine 2012, 7, 2281–2292. [Google Scholar] [PubMed]
- Tsutsui, H.; Valamehr, B.; Hindoyan, A.; Qiao, R.; Ding, X.; Guo, S.; Witte, O.N.; Liu, X.; Ho, C.M.; Wu, H. An optimized small molecule inhibitor cocktail supports long-term maintenance of human embryonic stem cells. Nat. Commun. 2011, 2. [Google Scholar] [CrossRef]
- Whitesides, G.M. The origins and the future of microfluidics. Nature 2006, 442, 368–373. [Google Scholar] [CrossRef]
- Squires, T.M.; Quake, S.R. Microfluidics: Fluid physics at the nanoliter scale. Rev. Mod. Phys. 2005, 77, 977–1026. [Google Scholar] [CrossRef]
- Beebe, D.J.; Mensing, G.A.; Walker, G.M. Physics and applications of microfluidics in biology. Annu. Rev. Biomed. Eng. 2002, 4, 261–286. [Google Scholar] [CrossRef]
- El-Ali, J.; Sorger, P.K.; Jensen, K.F. Cells on chips. Nature 2006, 442, 403–411. [Google Scholar] [CrossRef]
- Yeo, L.Y.; Chang, H.C.; Chan, P.P.Y.; Friend, J.R. Microfluidic devices for bioapplications. Small 2011, 7, 12–48. [Google Scholar] [CrossRef]
- Ho, C.M. Fluidics—The Link between Micro and Nano Sciences and Technologies. In Proceedings of the 14th IEEE International Conference on Micro Electro Mechanical Systems, (MEMS 2001), Interlaken, Switzerland, 21–25 January 2001; pp. 375–384.
- Ho, C.M.; Tai, Y.C. Micro-electro-mechanical-systems (MEMS) and fluid flows. Annu. Rev. Fluid Mech. 1998, 30, 579–612. [Google Scholar] [CrossRef]
- Haeberle, S.; Roth, G.; von Stetten, F.; Zengerle, R. Microfluidic lab-on-a-chip platforms: Requirements, characteristics and applications. Chem. Soc. Rev. 2010, 39, 1153–1182. [Google Scholar] [CrossRef] [PubMed]
- Stone, H.A.; Stroock, A.D.; Ajdari, A. Engineering flows in small devices. Annu. Rev. Fluid Mech. 2004, 36, 381–411. [Google Scholar] [CrossRef]
- Oh, K.W.; Ahn, C.H. A review of microvalves. J. Micromech. Microeng. 2006, 16, R13–R39. [Google Scholar] [CrossRef]
- Kovacs, G.T.A. Micromachined Transducers Sourcebook; WCB/McGraw-Hill: New York, NY, USA, 1998. [Google Scholar]
- Duffy, D.C.; McDonald, J.C.; Schueller, O.J.A.; Whitesides, G.M. Rapid prototyping of microfluidic systems in poly (dimethylsiloxane). Anal. Chem. 1998, 70, 4974–4984. [Google Scholar] [CrossRef]
- Laser, D.; Santiago, J. A review of micropumps. J. Micromech. Microeng. 2004, 14, R35–R64. [Google Scholar] [CrossRef]
- Fox, M.; Esveld, D.; Valero, A.; Luttge, R.; Mastwijk, H.; Bartels, P.; van den Berg, A.; Boom, R. Electroporation of cells in microfluidic devices: A review. Anal. Bioanal. Chem. 2006, 385, 474–485. [Google Scholar] [CrossRef]
- Wilson, S.A.; Jourdain, R.P.J.; Zhang, Q.; Dorey, R.A.; Bowen, C.R.; Willander, M.; Wahab, Q.U.; Al-hilli, S.M.; Nur, O.; Quandt, E. New materials for micro-scale sensors and actuators: An engineering review. Mater. Sci. Eng. R Rep. 2007, 56, 1–129. [Google Scholar] [CrossRef]
- Anderson, J.R.; Chiu, D.T.; Wu, H.; Schueller, O.J.A.; Whitesides, G.M. Fabrication of microfluidic systems in poly (dimethylsiloxane). Electrophoresis 2000, 21, 27–40. [Google Scholar] [CrossRef]
- Nguyen, N.T.; Wu, Z. Micromixers—A review. J. Micromech. Microeng. 2004, 15, R1–R16. [Google Scholar] [CrossRef]
- Kuswandi, B.; Huskens, J.; Verboom, W. Optical sensing systems for microfluidic devices: A review. Anal. Chim. Acta 2007, 601, 141–155. [Google Scholar] [CrossRef]
- Melin, J.; Quake, S.R. Microfluidic large-scale integration: The evolution of design rules for biological automation. Annu. Rev. Biophys. Biomol. Struct. 2007, 36, 213–231. [Google Scholar] [CrossRef]
- De Jong, J.; Lammertink, R.; Wessling, M. Membranes and microfluidics: A review. Lab Chip 2006, 6, 1125–1139. [Google Scholar] [CrossRef]
- Congreve, M.; Murray, C.W.; Blundell, T.L. Keynote review: Structural biology and drug discovery. Drug Discov. Today 2005, 10, 895–907. [Google Scholar] [CrossRef]
- Debouck, C.; Goodfellow, P.N. DNA microarrays in drug discovery and development. Nat. Genet. 1999, 21, 48–50. [Google Scholar] [CrossRef]
- Drews, J. Drug discovery: A historical perspective. Science 2000, 287, 1960–1964. [Google Scholar] [CrossRef]
- Schreiber, S.L. Target-oriented and diversity-oriented organic synthesis in drug discovery. Science 2000, 287, 1964–1969. [Google Scholar] [CrossRef]
- Butcher, E.C.; Berg, E.L.; Kunkel, E.J. Systems biology in drug discovery. Nat. Biotechnol. 2004, 22, 1253–1259. [Google Scholar] [CrossRef]
- Wong, T.S.; Brough, B.; Ho, C.M. Creation of functional micro/nano systems through top-down and bottom-up approaches. Mol. Cell. Biomech. (MCB) 2009, 6, 1–55. [Google Scholar]
- Xia, Y.; Whitesides, G.M. Soft lithography. Annu. Rev. Mater. Sci. 1998, 28, 153–184. [Google Scholar] [CrossRef]
- Wei, F.; Lillehoj, P.B.; Ho, C.M. DNA diagnostics: Nanotechnology-enhanced electrochemical detection of nucleic acids. Pediat. Res. 2010, 67, 458–468. [Google Scholar] [CrossRef]
- Wei, F.; Liao, W.; Xu, Z.; Yang, Y.; Wong, D.T.; Ho, C.M. Bio/abiotic interface constructed from nanoscale DNA dendrimer and conducting polymer for ultrasensitive biomolecular diagnosis. Small 2009, 5, 1784–1790. [Google Scholar] [CrossRef]
- Liu, X.; Tan, W. A fiber-optic evanescent wave DNA biosensor based on novel molecular beacons. Anal. Chem. 1999, 71, 5054–5059. [Google Scholar] [CrossRef]
- Sekar, R.B.; Periasamy, A. Fluorescence resonance energy transfer (fret) microscopy imaging of live cell protein localizations. J. Cell Biol. 2003, 160, 629–633. [Google Scholar] [CrossRef]
- Trelles, O.; Prins, P.; Snir, M.; Jansen, R.C. Big data, but are we ready? Nat. Rev. Genet. 2011, 12, 224–224. [Google Scholar] [CrossRef]
- Thorsen, T.; Maerkl, S.J.; Quake, S.R. Microfluidic large-scale integration. Science 2002, 298, 580–584. [Google Scholar] [CrossRef]
- Schadt, E.E.; Turner, S.; Kasarskis, A. A window into third-generation sequencing. Hum. Mol. Genet. 2010, 19, R227–R240. [Google Scholar] [CrossRef]
- Chen, C.H.; Lu, Y.; Sin, M.L.Y.; Mach, K.E.; Zhang, D.D.; Gau, V.; Liao, J.C.; Wong, P.K. Antimicrobial susceptibility testing using high surface-to-volume ratio microchannels. Anal. Chem. 2010, 82, 1012–1019. [Google Scholar] [CrossRef] [PubMed]
- Szita, N.; Polizzi, K.; Jaccard, N.; Baganz, F. Microfluidic approaches for systems and synthetic biology. Curr. Opin. Biotechnology 2010, 21, 517–523. [Google Scholar] [CrossRef]
- Lander, E.S.; Linton, L.M.; Birren, B.; Nusbaum, C.; Zody, M.C.; Baldwin, J.; Devon, K.; Dewar, K.; Doyle, M.; FitzHugh, W. Initial sequencing and analysis of the human genome. Nature 2001, 409, 860–921. [Google Scholar] [CrossRef]
- Collins, F.S.; McKusick, V.A. Implications of the human genome project for medical science. JAMA 2001, 285, 540–544. [Google Scholar] [CrossRef]
- Bras, J.; Guerreiro, R.; Hardy, J. Use of next-generation sequencing and other whole-genome strategies to dissect neurological disease. Nat. Rev. Neurosci. 2012, 13, 453–464. [Google Scholar] [CrossRef]
- Cirulli, E.T.; Goldstein, D.B. Uncovering the roles of rare variants in common disease through whole-genome sequencing. Nat. Rev. Genet. 2010, 11, 415–425. [Google Scholar] [CrossRef]
- Metzker, M.L. Sequencing technologies—The next generation. Nat. Rev. Genet. 2009, 11, 31–46. [Google Scholar] [CrossRef]
- Mardis, E.R. A decade’s perspective on DNA sequencing technology. Nature 2011, 470, 198–203. [Google Scholar] [CrossRef]
- Branton, D.; Deamer, D.W.; Marziali, A.; Bayley, H.; Benner, S.A.; Butler, T.; Di Ventra, M.; Garaj, S.; Hibbs, A.; Huang, X. The potential and challenges of nanopore sequencing. Nat. Biotechnol. 2008, 26, 1146–1153. [Google Scholar] [CrossRef] [PubMed]
- Carlson, B. SNPs—A Shortcut to Personalized Medicine. Available online: http://www.genengnews.com/gen-articles/snps-a-shortcut-to-personalized-medicine/2507/ (accessed on 10 December 2012).
- Syvanen, A. Accessing genetic variation: Genotyping single nucleotide polymorphisms. Nature Rev. Genet. 2001, 2, 930–942. [Google Scholar] [CrossRef]
- Sochol, R.; Mahajerin, A.; Casavant, B.; Singh, P.; Dueck, M.; Lee, L.; Lin, L. Bead-Immobilized Molecular Beacons for High Throughput Snp Genotyping via a Microfluidic System. In Proceedings of IEEE 22nd International Conference on Micro Electro Mechanical Systems (MEMS 2009), Sorrento, Italy, 25–29 January 2009; pp. 304–307.
- Cheng, I.F.; Senapati, S.; Cheng, X.; Basuray, S.; Chang, H.C. A rapid field-use assay for mismatch number and location of hybridized dnas. Lab Chip 2010, 10, 828–831. [Google Scholar] [CrossRef]
- Altshuler, D.M.; Lander, E.S.; Ambrogio, L.; Bloom, T.; Cibulskis, K.; Fennell, T.J.; Gabriel, S.B.; Jaffe, D.B.; Shefler, E.; Sougnez, C.L. A map of human genome variation from population scale sequencing. Nature 2010, 467, 1061–1073. [Google Scholar] [CrossRef] [Green Version]
- Wheeler, D.A.; Srinivasan, M.; Egholm, M.; Shen, Y.; Chen, L.; McGuire, A.; He, W.; Chen, Y.J.; Makhijani, V.; Roth, G.T. The complete genome of an individual by massively parallel DNA sequencing. Nature 2008, 452, 872–876. [Google Scholar] [CrossRef]
- Mill, J.; Tang, T.; Kaminsky, Z.; Khare, T.; Yazdanpanah, S.; Bouchard, L.; Jia, P.; Assadzadeh, A.; Flanagan, J.; Schumacher, A. Epigenomic profiling reveals DNA-methylation changes associated with major psychosis. Am. J. Hum. Genet. 2008, 82, 696–711. [Google Scholar] [CrossRef]
- Esteller, M.; Herman, J.G. Cancer as an epigenetic disease: DNA methylation and chromatin alterations in human tumours. J. Pathol. 2001, 196, 1–7. [Google Scholar] [CrossRef]
- Wang, C.; Hsu, K.; Chou, C.; Lee, G. Enzyme Digestion-Based Microfluidic System for DNA Methylation Assay. In Proceedings of IEEE 25th International Conference on Micro Electro Mechanical Systems (MEMS 2012), Paris, France, 29 January–2 February 2012; pp. 985–988.
- Cerf, A.; Cipriany, B.R.; Benítez, J.J.; Craighead, H.G. Single DNA molecule patterning for high-throughput epigenetic mapping. Anal. Chem. 2011, 83, 8073–8077. [Google Scholar] [CrossRef]
- Beane, J.; Vick, J.; Schembri, F.; Anderlind, C.; Gower, A.; Campbell, J.; Luo, L.; Zhang, X.H.; Xiao, J.; Alekseyev, Y.O. Characterizing the impact of smoking and lung cancer on the airway transcriptome using RNA-seq. Cancer Prev. Res. 2011, 4, 803–817. [Google Scholar] [CrossRef]
- Yeoh, E.J.; Ross, M.E.; Shurtleff, S.A.; Williams, W.K.; Patel, D.; Mahfouz, R.; Behm, F.G.; Raimondi, S.C.; Relling, M.V.; Patel, A. Classification, subtype discovery, and prediction of outcome in pediatric acute lymphoblastic leukemia by gene expression profiling. Cancer Cell. 2002, 1, 133–144. [Google Scholar] [CrossRef]
- Van’t Veer, L.J.; Dai, H.; van de Vijver, M.J.; He, Y.D.; Hart, A.A.M.; Mao, M.; Peterse, H.L.; van der Kooy, K.; Marton, M.J.; Witteveen, A.T. Gene expression profiling predicts clinical outcome of breast cancer. Nature 2002, 415, 530–536. [Google Scholar] [CrossRef] [PubMed]
- Moore, D.F.; Li, H.; Jeffries, N.; Wright, V.; Cooper, R.A., Jr.; Elkahloun, A.; Gelderman, M.P.; Zudaire, E.; Blevins, G.; Yu, H. Using peripheral blood mononuclear cells to determine a gene expression profile of acute ischemic stroke. Circulation 2005, 111, 212–221. [Google Scholar] [CrossRef]
- Wang, Z.; Gerstein, M.; Snyder, M. RNA-seq: A revolutionary tool for transcriptomics. Nature Rev. Genet. 2009, 10, 57–63. [Google Scholar] [CrossRef]
- Marioni, J.C.; Mason, C.E.; Mane, S.M.; Stephens, M.; Gilad, Y. RNA-seq: An assessment of technical reproducibility and comparison with gene expression arrays. Genome Res. 2008, 18, 1509–1517. [Google Scholar] [CrossRef]
- Sachidanandam, R.; Weissman, D.; Schmidt, S.C.; Kakol, J.M.; Stein, L.D.; Marth, G.; Sherry, S.; Mullikin, J.C.; Mortimore, B.J.; Willey, D.L. A map of human genome sequence variation containing 1.42 million single nucleotide polymorphisms. Nature 2001, 409, 928–933. [Google Scholar] [CrossRef] [PubMed]
- Jimenez-Sanchez, G.; Childs, B.; Valle, D. Human disease genes. Nature 2001, 409, 853–855. [Google Scholar] [CrossRef]
- Hirschhorn, J.N.; Daly, M.J. Genome-wide association studies for common diseases and complex traits. Nat. Rev. Genet. 2005, 6, 95–108. [Google Scholar] [CrossRef]
- Goh, K.I.; Cusick, M.E.; Valle, D.; Childs, B.; Vidal, M.; Barabási, A.L. The human disease network. Proc. Natl. Acad. Sci. USA 2007, 104, 8685–8690. [Google Scholar] [CrossRef] [PubMed]
- Liu, P.; Mathies, R.A. Integrated microfluidic systems for high-performance genetic analysis. Trends Biotech. 2009, 27, 572–581. [Google Scholar] [CrossRef]
- Collins, F.; Galas, D. A New Five-Year Plan for the US Human Genome Project. Available online: http://ww.esp.org/misc/genome/goals.pdf (accessed on 10 December 2012).
- Bentley, D.R. The human genome project—An overview. Med. Res. Rev. 2000, 20, 189–196. [Google Scholar] [CrossRef]
- Shendure, J.; Ji, H. Next-generation DNA sequencing. Nat. Biotechnol. 2008, 26, 1135–1145. [Google Scholar] [CrossRef]
- Eid, J.; Fehr, A.; Gray, J.; Luong, K.; Lyle, J.; Otto, G.; Peluso, P.; Rank, D.; Baybayan, P.; Bettman, B. Real-time DNA sequencing from single polymerase molecules. Science 2009, 323, 133–138. [Google Scholar] [CrossRef] [PubMed]
- Schneider, G.F.; Dekker, C. DNA sequencing with nanopores. Nat. Biotechnol. 2012, 30, 326–328. [Google Scholar] [CrossRef]
- Venkatesan, B.M.; Bashir, R. Nanopore sensors for nucleic acid analysis. Nat. Nanotechnol. 2011, 6, 615–624. [Google Scholar] [CrossRef] [PubMed]
- Church, G.; Deamer, D.W.; Branton, D.; Baldarelli, R.; Kasianowicz, J. Characterization of Individual Polymer Molecules Based on Monomer-Interface Interactions. U.S. Patent 5,795,782, August 1998. [Google Scholar]
- Dekker, C. Solid-state nanopores. Nat. Nanotechnol. 2007, 2, 209–215. [Google Scholar] [CrossRef]
- Rhee, M.; Burns, M.A. Nanopore sequencing technology: Research trends and applications. Trends Biotech. 2006, 24, 580–586. [Google Scholar] [CrossRef]
- Levene, M.J.; Korlach, J.; Turner, S.W.; Foquet, M.; Craighead, H.G.; Webb, W.W. Zero-mode waveguides for single-molecule analysis at high concentrations. Science 2003, 299, 682–686. [Google Scholar] [CrossRef]
- Flusberg, B.A.; Webster, D.R.; Lee, J.H.; Travers, K.J.; Olivares, E.C.; Clark, T.A.; Korlach, J.; Turner, S.W. Direct detection of DNA methylation during single-molecule, real-time sequencing. Nat. Methods 2010, 7, 461–465. [Google Scholar] [CrossRef]
- Forrest, A.R.R.; Carninci, P. Whole genome transcriptome analysis. RNA Biol. 2009, 6, 107–112. [Google Scholar] [CrossRef]
- Ingolia, N.T.; Ghaemmaghami, S.; Newman, J.R.S.; Weissman, J.S. Genome-wide analysis in vivo of translation with nucleotide resolution using ribosome profiling. Science 2009, 324, 218–223. [Google Scholar] [CrossRef]
- Heller, M.J. DNA microarray technology: Devices, systems, and applications. Annu. Rev. Biomed. Eng. 2002, 4, 129–153. [Google Scholar] [CrossRef]
- Wang, L.; Li, P.C.H. Microfluidic DNA microarray analysis: A review. Anal. Chim. Acta 2011, 687, 12–27. [Google Scholar] [CrossRef]
- Senapati, S.; Mahon, A.R.; Gordon, J.; Nowak, C.; Sengupta, S.; Powell, T.H.Q.; Feder, J.; Lodge, D.M.; Chang, H.C. Rapid on-chip genetic detection microfluidic platform for real world applications. Biomicrofluidics 2009, 3. [Google Scholar] [CrossRef]
- Martins, S.; Prazeres, D.; Fonseca, L.; Monteiro, G. Application of central composite design for DNA hybridization onto magnetic microparticles. Anal. Biochem. 2009, 391, 17–23. [Google Scholar] [CrossRef]
- Gabig-Ciminska, M.; Holmgren, A.; Andresen, H.; Bundvig Barken, K.; Wümpelmann, M.; Albers, J.; Hintsche, R.; Breitenstein, A.; Neubauer, P.; Los, M. Electric chips for rapid detection and quantification of nucleic acids. Biosens. Bioelectron. 2004, 19, 537–546. [Google Scholar] [CrossRef]
- Chang, H.C. Nanobead electrokinetics: The enabling microfluidic platform for rapid multi-target pathogen detection. AICHE J. 2007, 53, 2486–2492. [Google Scholar] [CrossRef]
- Anderson, N.L.; Anderson, N.G. The human plasma proteome history, character, and diagnostic prospects. Mol. Cell. Proteomics 2002, 1, 845–867. [Google Scholar] [CrossRef]
- Gygi, S.P.; Rochon, Y.; Franza, B.R.; Aebersold, R. Correlation between protein and mrna abundance in yeast. Mol. Cell. Biol. 1999, 19, 1720–1730. [Google Scholar] [CrossRef] [PubMed]
- Jiang, Y.; Wang, P.C.; Locascio, L.E.; Lee, C.S. Integrated plastic microfluidic devices with ESI-MS for drug screening and residue analysis. Anal. Chem. 2001, 73, 2048–2053. [Google Scholar] [CrossRef]
- Wheeler, A.R.; Moon, H.; Bird, C.A.; Loo, R.R.O.; Kim, C.J.; Loo, J.A.; Garrell, R.L. Digital microfluidics with in-line sample purification for proteomics analyses with MALDI-MS. Anal. Chem. 2005, 77, 534–540. [Google Scholar] [CrossRef] [PubMed]
- Wheeler, A.R.; Moon, H.; Kim, C.J.; Loo, J.A.; Garrell, R.L. Electrowetting-based microfluidics for analysis of peptides and proteins by matrix-assisted laser desorption/ionization mass spectrometry. Anal. Chem. 2004, 76, 4833–4838. [Google Scholar] [CrossRef] [PubMed]
- Luk, V.N.; Fiddes, L.K.; Luk, V.M.; Kumacheva, E.; Wheeler, A.R. Digital microfluidic hydrogel microreactors for proteomics. Proteomics 2012, 12, 1310–1318. [Google Scholar] [CrossRef]
- Lee, J.; Soper, S.A.; Murray, K.K. Microfluidic chips for mass spectrometry-based proteomics. J. Mass Spectrom. 2009, 44, 579–593. [Google Scholar] [CrossRef] [PubMed]
- Biemann, K. Mass spectrometry of peptides and proteins. Annu. Rev. Biochem. 1992, 61, 977–1010. [Google Scholar] [CrossRef]
- Zhu, H.; Snyder, M. Protein chip technology. Curr. Opin. Chem. Biol. 2003, 7, 55–63. [Google Scholar] [CrossRef]
- Phizicky, E.; Bastiaens, P.I.H.; Zhu, H.; Snyder, M.; Fields, S. Protein analysis on a proteomic scale. Nature 2003, 422, 208–215. [Google Scholar] [CrossRef] [PubMed]
- He, M.; Stoevesandt, O.; Taussig, M.J. In situ synthesis of protein arrays. Curr. Opin. Biotechnol. 2008, 19, 4–9. [Google Scholar] [CrossRef] [PubMed]
- Gerber, D.; Maerkl, S.J.; Quake, S.R. An in vitro microfluidic approach to generating protein-interaction networks. Nat. Methods 2008, 6, 71–74. [Google Scholar] [CrossRef]
- Maerkl, S.J.; Quake, S.R. Experimental determination of the evolvability of a transcription factor. Proc. Natl. Acad. Sci. USA 2009, 106, 18650–18655. [Google Scholar] [CrossRef]
- Hartmann, M.; Roeraade, J.; Stoll, D.; Templin, M.F.; Joos, T.O. Protein microarrays for diagnostic assays. Anal. Bioanal. Chem. 2009, 393, 1407–1416. [Google Scholar] [CrossRef]
- Maerkl, S.J. Next generation microfluidic platforms for high-throughput protein biochemistry. Curr. Opin. Biotechnol. 2011, 22, 59–65. [Google Scholar] [CrossRef] [Green Version]
- Spratlin, J.L.; Serkova, N.J.; Eckhardt, S.G. Clinical applications of metabolomics in oncology: A review. Clin. Cancer Res. 2009, 15, 431–440. [Google Scholar] [CrossRef]
- Sreekumar, A.; Poisson, L.M.; Rajendiran, T.M.; Khan, A.P.; Cao, Q.; Yu, J.; Laxman, B.; Mehra, R.; Lonigro, R.J.; Li, Y. Metabolomic profiles delineate potential role for sarcosine in prostate cancer progression. Nature 2009, 457, 910–914. [Google Scholar] [CrossRef] [PubMed]
- Rubakhin, S.S.; Romanova, E.V.; Nemes, P.; Sweedler, J.V. Profiling metabolites and peptides in single cells. Nat. Methods 2011, 8, S20–S29. [Google Scholar] [CrossRef]
- Kraly, J.R.; Holcomb, R.E.; Guan, Q.; Henry, C.S. Review: Microfluidic applications in metabolomics and metabolic profiling. Anal. Chim. Acta 2009, 653, 23–35. [Google Scholar] [CrossRef]
- Kafsack, B.F.C.; Llinás, M. Eating at the table of another: Metabolomics of host-parasite interactions. Cell Host & Microbe 2010, 7, 90–99. [Google Scholar] [CrossRef]
- Wang, D.; Bodovitz, S. Single cell analysis: The new frontier in “omics”. Trends Biotech. 2010, 28, 281–290. [Google Scholar] [CrossRef]
- Toriello, N.M.; Douglas, E.S.; Thaitrong, N.; Hsiao, S.C.; Francis, M.B.; Bertozzi, C.R.; Mathies, R.A. Integrated microfluidic bioprocessor for single-cell gene expression analysis. Proc. Natl. Acad. Sci. USA 2008, 105, 20173–20178. [Google Scholar] [CrossRef] [PubMed]
- Gerlinger, M.; Rowan, A.J.; Horswell, S.; Larkin, J.; Endesfelder, D.; Gronroos, E.; Martinez, P.; Matthews, N.; Stewart, A.; Tarpey, P. Intratumor heterogeneity and branched evolution revealed by multiregion sequencing. NEJM 2012, 366, 883–892. [Google Scholar] [CrossRef]
- Bajorath, J. Integration of virtual and high-throughput screening. Nat. Rev. Drug Discov. 2002, 1, 882–894. [Google Scholar] [CrossRef]
- Barabási, A.L.; Gulbahce, N.; Loscalzo, J. Network medicine: A network-based approach to human disease. Nat. Rev. Genet. 2011, 12, 56–68. [Google Scholar] [CrossRef]
- Laurent, C.; Kouanfack, C.; Koulla-Shiro, S.; Nkoué, N.; Bourgeois, A.; Calmy, A.; Lactuock, B.; Nzeusseu, V.; Mougnutou, R.; Peytavin, G. Effectiveness and safety of a generic fixed-dose combination of nevirapine, stavudine, and lamivudine in HIV-1-infected adults in cameroon: Open-label multicentre trial. Lancet 2004, 364, 29–34. [Google Scholar] [CrossRef] [PubMed]
- Fitzgerald, J.B.; Schoeberl, B.; Nielsen, U.B.; Sorger, P.K. Systems biology and combination therapy in the quest for clinical efficacy. Nat. Chem. Biol. 2006, 2, 458–466. [Google Scholar] [CrossRef]
- Ibrahim, S.; van den Engh, G. Flow cytometry and cell sorting. Cell Separation 2007, 106, 19–39. [Google Scholar] [CrossRef]
- Wu, T.H.; Chen, Y.; Park, S.Y.; Hong, J.; Teslaa, T.; Zhong, J.F.; Di Carlo, D.; Teitell, M.A.; Chiou, P.Y. Pulsed laser triggered high speed microfluidic fluorescence activated cell sorter. Lab Chip 2012, 12, 1378–1383. [Google Scholar] [CrossRef]
- Perez, O.D.; Nolan, G.P. Phospho-proteomic immune analysis by flow cytometry: From mechanism to translational medicine at the single-cell level. Immunol. Rev. 2006, 210, 208–228. [Google Scholar] [CrossRef]
- Krutzik, P.O.; Trejo, A.; Schulz, K.R.; Nolan, G.P. Phospho flow cytometry methods for the analysis of kinase signaling in cell lines and primary human blood samples. Methods Mol. Biol. 2011, 699, 179–202. [Google Scholar] [PubMed]
- Perez, O.D. Using phosphoflow™ to study signaling events of subpopulations resistant to current therapies. Targeted Therapies 2011, 95–112. [Google Scholar] [CrossRef]
- Krutzik, P.O.; Irish, J.M.; Nolan, G.P.; Perez, O.D. Analysis of protein phosphorylation and cellular signaling events by flow cytometry: Techniques and clinical applications. Clin. Immunol. 2004, 110, 206–221. [Google Scholar] [CrossRef]
- De Rosa, S.C.; Herzenberg, L.A.; Roederer, M. 11-color, 13-parameter flow cytometry: Identification of human naive T cells by phenotype, function, and T-cell receptor diversity. Nat. Med. 2001, 7, 245–248. [Google Scholar] [CrossRef]
- Shachaf, C.M.; Perez, O.D.; Youssef, S.; Fan, A.C.; Elchuri, S.; Goldstein, M.J.; Shirer, A.E.; Sharpe, O.; Chen, J.; Mitchell, D.J. Inhibition of hmgcoa reductase by atorvastatin prevents and reverses myc-induced lymphomagenesis. Blood 2007, 110, 2674–2684. [Google Scholar] [CrossRef]
- Galligan, C.L.; Siebert, J.C.; Siminovitch, K.A.; Keystone, E.C.; Bykerk, V.; Perez, O.D.; Fish, E.N. Multiparameter phospho-flow analysis of lymphocytes in early rheumatoid arthritis: Implications for diagnosis and monitoring drug therapy. PloS ONE 2009, 4. [Google Scholar] [CrossRef]
© 2013 by the authors; licensee MDPI, Basel, Switzerland. This article is an open access article distributed under the terms and conditions of the Creative Commons Attribution license (http://creativecommons.org/licenses/by/3.0/).
Share and Cite
Wang, H.; Silva, A.; Ho, C.-M. When Medicine Meets Engineering—Paradigm Shifts in Diagnostics and Therapeutics. Diagnostics 2013, 3, 126-154. https://doi.org/10.3390/diagnostics3010126
Wang H, Silva A, Ho C-M. When Medicine Meets Engineering—Paradigm Shifts in Diagnostics and Therapeutics. Diagnostics. 2013; 3(1):126-154. https://doi.org/10.3390/diagnostics3010126
Chicago/Turabian StyleWang, Hann, Aleidy Silva, and Chih-Ming Ho. 2013. "When Medicine Meets Engineering—Paradigm Shifts in Diagnostics and Therapeutics" Diagnostics 3, no. 1: 126-154. https://doi.org/10.3390/diagnostics3010126