Relationships among Height, Weight, Body Mass Index, and Age in Taiwanese Children with Different Types of Mucopolysaccharidoses

 ,
,  ,
,
Abstract
:1. Introduction
2. Materials and Methods
2.1. Ethics Approval and Consent to Participate
2.2. Study Population
2.3. Statistical Analysis
3. Results
4. Discussion
4.1. MPS I
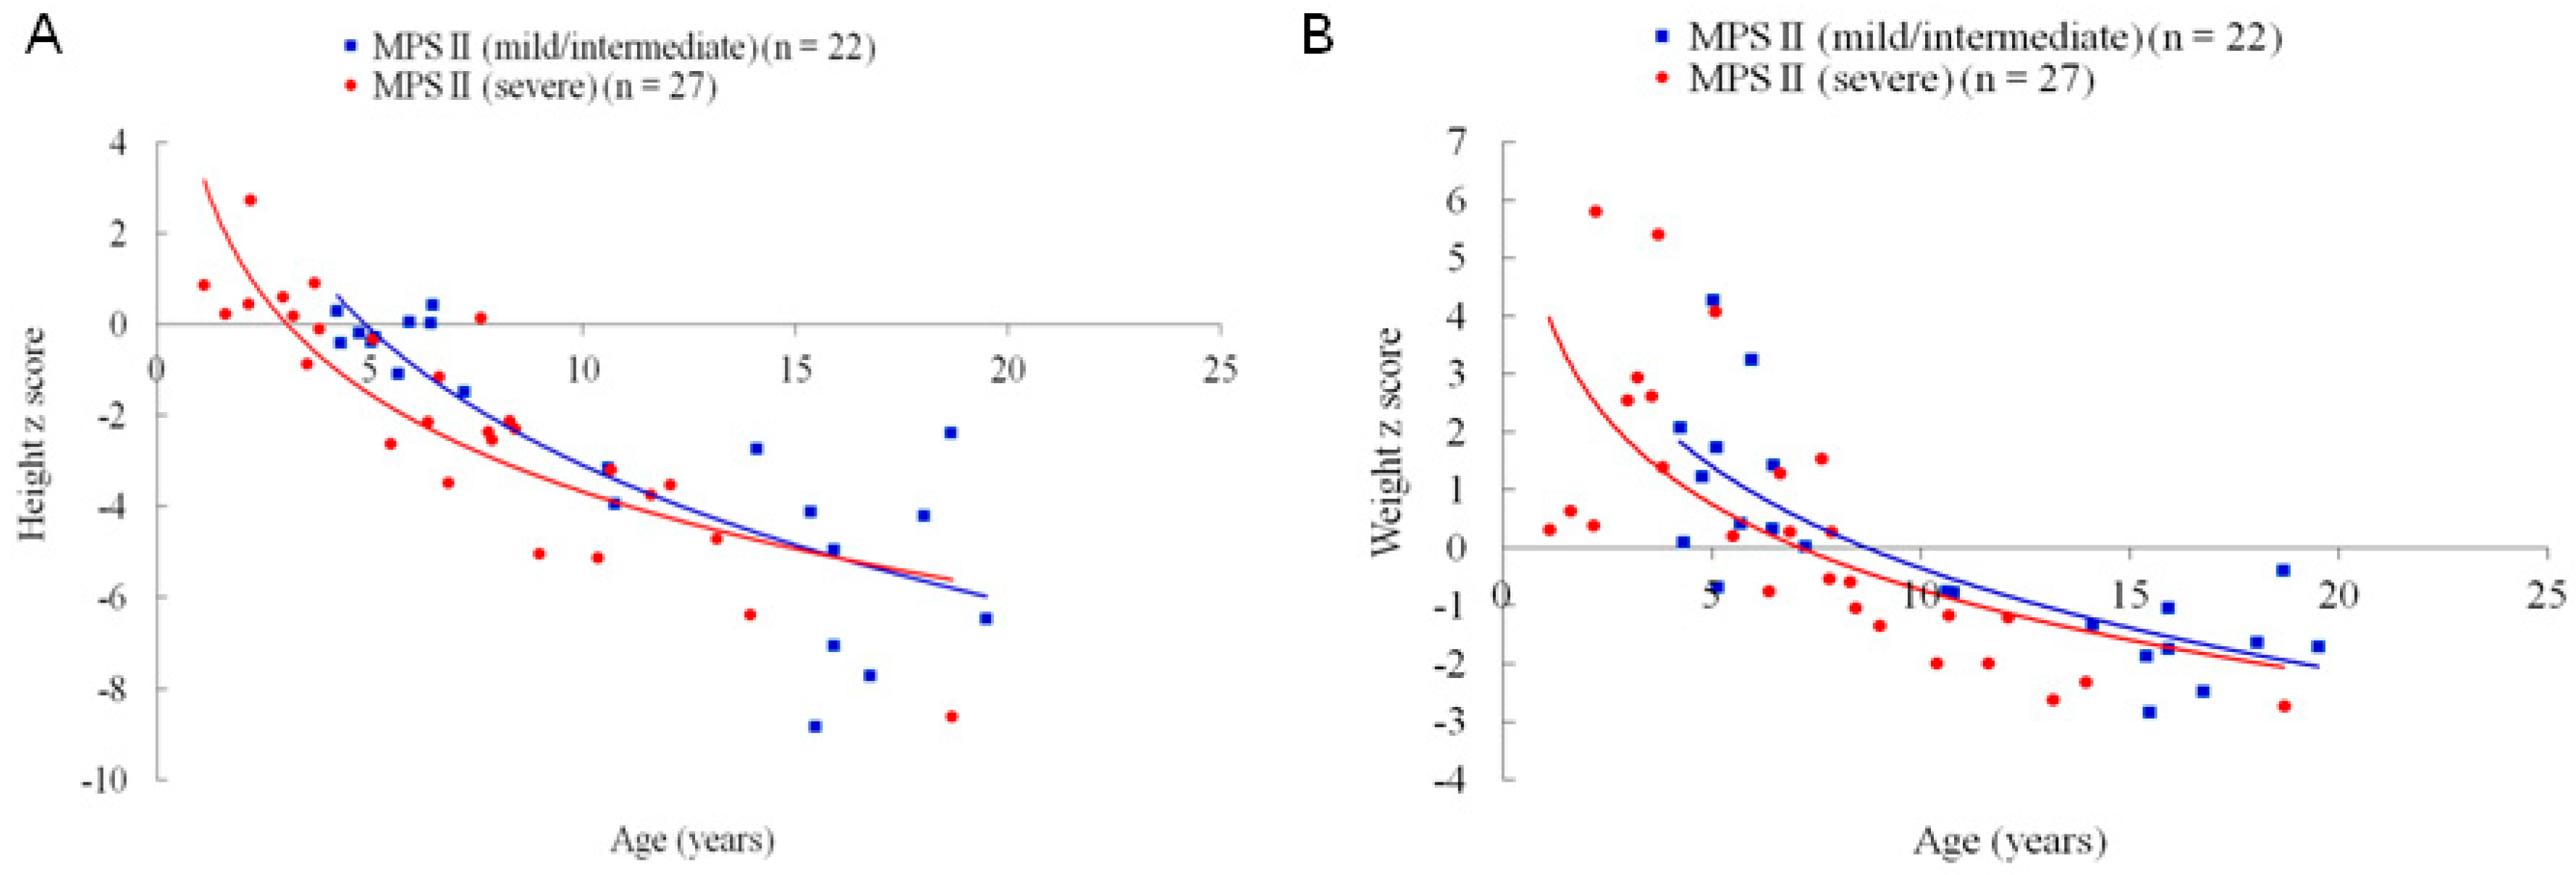
4.2. MPS II
4.3. MPS III
4.4. MPS IVA
4.5. MPS VI
4.6. Limitations
5. Conclusions
Author Contributions
Funding
Acknowledgments
Conflicts of Interest
Abbreviations
| MPS | mucopolysaccharidosis |
| GAGs | glycosaminoglycans |
| DS | dermatan sulfate |
| HS | heparan sulfate |
| KS | keratan sulfate |
| CS | chondroitin sulfate |
| ERT | enzyme replacement therapy |
| BMI | body mass index |
| z score | standard deviation score |
References
- Neufield, E.F.; Muenzer, J. The mucopolysaccharidoses. In The Metabolic and Molecular Bases of Inherited Disease; Scriver, C., Beaudet, A.L., Valle, D., Sly, W.S., Eds.; McGraw-Hill: New York, NY, USA, 2001; Volume 136, pp. 3421–3452. [Google Scholar]
- Muenzer, J. The mucopolysaccharidoses: A heterogeneous group of disorders with variable pediatric presentations. J. Pediatr. 2004, 144, S27–S34. [Google Scholar] [CrossRef]
- Muenzer, J. Overview of the mucopolysaccharidoses. Rheumatology 2011, 50, v4–v12. [Google Scholar] [CrossRef] [PubMed] [Green Version]
- Chuang, C.K.; Lin, S.P. Neurochemical changes and therapeutical approaches in mucopolysaccharidoses. In Neurochemistry of Metabolic Diseases-Lysosomal Storage Diseases, Phenylketouria and Canavan Disease; Sankar, S., Ed.; Nova Science: New York, NY, USA, 2007. [Google Scholar]
- Tomatsu, S.; Montaño, A.M.; Oikawa, H.; Giugliani, R.; Harmatz, P.; Smith, M.; Suzuki, Y.; Orii, T. Impairment of body growth in mucopolysaccharidoses. In Handbook of Growth and Growth Monitoring in Health and Disease; Springer: New York, NY, USA, 2012; pp. 2091–2117. [Google Scholar]
- Giugliani, R.; Federhen, A.; Vairo, F.; Vanzella, C.; Pasqualim, G.; da Silva, L.M.; Giugliani, L.; de Boer, A.P.; de Souza, C.F.; Matte, U.; et al. Emerging drugs for the treatment of mucopolysaccharidoses. Expert. Opin. Emerg. Drugs 2016, 21, 9–26. [Google Scholar] [CrossRef] [PubMed]
- Różdżyńska-Świątkowska, A.; Jurecka, A.; Cieślik, J.; Tylki-Szymańska, A. Growth patterns in children with mucopolysaccharidosis, I.; II. World J. Pediatr. 2015, 11, 226–231. [Google Scholar] [CrossRef]
- Gardner, C.J.; Robinson, N.; Meadows, T.; Wynn, R.; Will, A.; Mercer, J.; Church, H.J.; Tylee, K.; Wraith, J.E.; Clayton, P.E. Growth, final height and endocrine sequelae in a UK population of patients with Hurler syndrome (MPS1H). J. Inherit. Metab. Dis. 2011, 34, 489–497. [Google Scholar] [CrossRef]
- D’Aco, K.; Underhill, L.; Rangachari, L.; Arn, P.; Cox, G.F.; Giugliani, R.; Okuyama, T.; Wijburg, F.; Kaplan, P. Diagnosis and treatment trends in mucopolysaccharidosis I: Findings from the MPS I Registry. Eur. J. Pediatr. 2012, 171, 911–919. [Google Scholar] [CrossRef] [PubMed]
- Rozdzynska, A.; Tylki-Szymanska, A.; Jurecka, A.; Cieslik, J. Growth pattern growth prediction of body height in children with mucopolysaccharidosis type, I.I. Acta Paediatr. 2011, 100, 456–460. [Google Scholar] [CrossRef]
- Patel, P.; Suzuki, Y.; Maeda, M.; Yasuda, E.; Shimada, T.; Orii, K.E.; Orii, T.; Tomatsu, S. Growth charts for patients with Hunter syndrome. Mol. Genet. Metab. Rep. 2014, 1, 5–18. [Google Scholar] [CrossRef]
- Parini, R.; Jones, S.A.; Harmatz, P.R.; Giugliani, R.; Mendelsohn, N.J. The natural history of growth in patients with Hunter syndrome: Data from the Hunter Outcome Survey (HOS). Mol. Genet. Metab. 2016, 117, 438–446. [Google Scholar] [CrossRef]
- Cho, S.Y.; Huh, R.; Chang, M.S.; Lee, J.; Kwun, Y.; Maeng, S.H.; Kim, S.J.; Sohn, Y.B.; Park, S.W.; Kwon, E.K.; et al. Impact of enzyme replacement therapy on linear growth in Korean patients with mucopolysaccharidosis type II (Hunter syndrome). J. Korean Med. Sci. 2014, 29, 254–260. [Google Scholar] [CrossRef]
- Żuber, Z.; Różdżyńska-Świątkowska, A.; Jurecka, A.; Tylki-Szymańska, A. The effect of recombinant human iduronate-2-sulfatase (Idursulfase) on growth in young patients with mucopolysaccharidosis type II. PLoS ONE 2014, 9, e85074. [Google Scholar] [CrossRef]
- Jones, S.A.; Parini, R.; Harmatz, P.; Giugliani, R.; Fang, J.; Mendelsohn, N.J. HOS Natural History Working Group on behalf of HOS Investigators: The effect of idursulfase on growth in patients with Hunter syndrome: Data from the Hunter Outcome Survey (HOS). Mol. Genet. Metab. 2013, 109, 41–48. [Google Scholar] [CrossRef]
- Muschol, N.M.; Pape, D.; Kossow, K.; Ullrich, K.; Arash-Kaps, L.; Hennermann, J.B.; Stücker, R.; Breyer, S.R. Growth charts for patients with Sanfilippo syndrome (Mucopolysaccharidosis type III). Orphanet. J. Rare. Dis. 2019, 14, 93. [Google Scholar] [CrossRef]
- de Ruijter, J.; Broere, L.; Mulder, M.F.; van der Ploeg, A.T.; Rubio-Gozalbo, M.E.; Wortmann, S.B.; Visser, G.; Wijburg, F.A. Growth in patients with mucopolysaccharidosis type III (Sanfilippo disease). J. Inherit. Metab. Dis. 2014, 37, 447–454. [Google Scholar] [CrossRef]
- Truxal, K.V.; Fu, H.; McCarty, D.M.; McNally, K.A.; Kunkler, K.L.; Zumberge, N.A.; Martin, L.; Aylward, S.C.; Alfano, L.N.; Berry, K.M.; et al. A prospective one-year natural history study of mucopolysaccharidosis types IIIA and IIIB: Implications for clinical trial design. Mol. Genet. Metab. 2016, 119, 239–248. [Google Scholar] [CrossRef]
- Melbouci, M.; Mason, R.W.; Suzuki, Y.; Fukao, T.; Orii, T.; Tomatsu, S. Growth impairment in mucopolysaccharidoses. Mol. Genet. Metab. 2018, 124, 1–10. [Google Scholar] [CrossRef]
- Montaño, A.M.; Tomatsu, S.; Brusius, A.; Smith, M.; Orii, T. Growth charts for patients affected with Morquio A disease. Am. J. Med. Genet. A 2008, 146, 1286–1295. [Google Scholar] [CrossRef]
- Harmatz, P.; Mengel, K.E.; Giugliani, R.; Valayannopoulos, V.; Lin, S.P.; Parini, R.; Guffon, N.; Burton, B.K.; Hendriksz, C.J.; Mitchell, J.; et al. The Morquio A Clinical Assessment Program: Baseline results illustrating progressive, multisystemic clinical impairments in Morquio A subjects. Mol. Genet. Metab. 2013, 109, 54–61. [Google Scholar] [CrossRef] [Green Version]
- Quartel, A.; Hendriksz, C.J.; Parini, R.; Graham, S.; Lin, P.; Harmatz, P. Growth Charts for Individuals with Mucopolysaccharidosis VI (Maroteaux-Lamy Syndrome). JIMD Rep. 2015, 18, 1–11. [Google Scholar]
- Chuang, C.K.; Lin, S.P.; Chung, S.F. Diagnostic screening for mucopolysaccharidoses by the dimethylmethylene blue method and two dimensional electrophoresis. Zhonghua Yi Xue Za Zhi (Taipei) 2001, 64, 15–22. [Google Scholar]
- Chen, W.; Chang, M.H. New growth charts for Taiwanese children and adolescents based on World Health Organization standards and health-related physical fitness. Pediatr. Neonatol. 2010, 51, 69–79. [Google Scholar] [CrossRef]
- Lin, H.Y.; Lee, C.L.; Lo, Y.T.; Wang, T.J.; Huang, S.F.; Chen, T.L.; Wang, Y.S.; Niu, D.M.; Chuang, C.K.; Lin, S.P. The Relationships Between Urinary Glycosaminoglycan Levels and Phenotypes of Mucopolysaccharidoses. Mol. Genet. Genomic Med. 2018, 6, 982–992. [Google Scholar] [CrossRef]
- Tomatsu, S.; Shimada, T.; Mason, R.W.; Montaño, A.M.; Kelly, J.; LaMarr, W.A.; Kubaski, F.; Giugliani, R.; Guha, A.; Yasuda, E.; et al. Establishment of glycosaminoglycan assays for mucopolysaccharidoses. Metabolites 2014, 4, 655–679. [Google Scholar] [CrossRef]
- Auray-Blais, C.; Lavoie, P.; Tomatsu, S.; Valayannopoulos, V.; Mitchell, J.J.; Raiman, J.; Beaudoin, M.; Maranda, B.; Clarke, J.T. UPLC-MS/MS detection of disaccharides derived from glycosaminoglycans as biomarkers of mucopolysaccharidoses. Anal. Chim. Acta 2016, 936, 139–148. [Google Scholar] [CrossRef]
- Mashima, R.; Sakai, E.; Tanaka, M.; Kosuga, M.; Okuyama, T. The levels of urinary glycosaminoglycans of patients with attenuated and severe type of mucopolysaccharidosis II determined by liquid chromatography-tandem mass spectrometry. Mol. Genet. Metab. Rep. 2016, 7, 87–91. [Google Scholar] [CrossRef]
- Settembre, C.; Arteaga-Solis, E.; Ballabio, A.; Karsenty, G. Self-eating in skeletal development: Implications for lysosomal storage disorders. Autophagy 2009, 5, 228–229. [Google Scholar] [CrossRef] [Green Version]
- Montaño, A.M.; Tomatsu, S.; Gottesman, G.S.; Smith, M.; Orii, T. International Morquio A Registry: Clinical manifestation and natural course of Morquio A disease. J. Inherit. Metab. Dis. 2007, 30, 165–174. [Google Scholar] [CrossRef]


| MPS Type | N | Age Range (Years) | Age (Years) | Height z Score | Height z Score vs. Age | Weight z Score | Weight z Score vs. Age | BMI z Score | BMI z Score vs. Age | |||
|---|---|---|---|---|---|---|---|---|---|---|---|---|
| r | p | r | p | r | p | |||||||
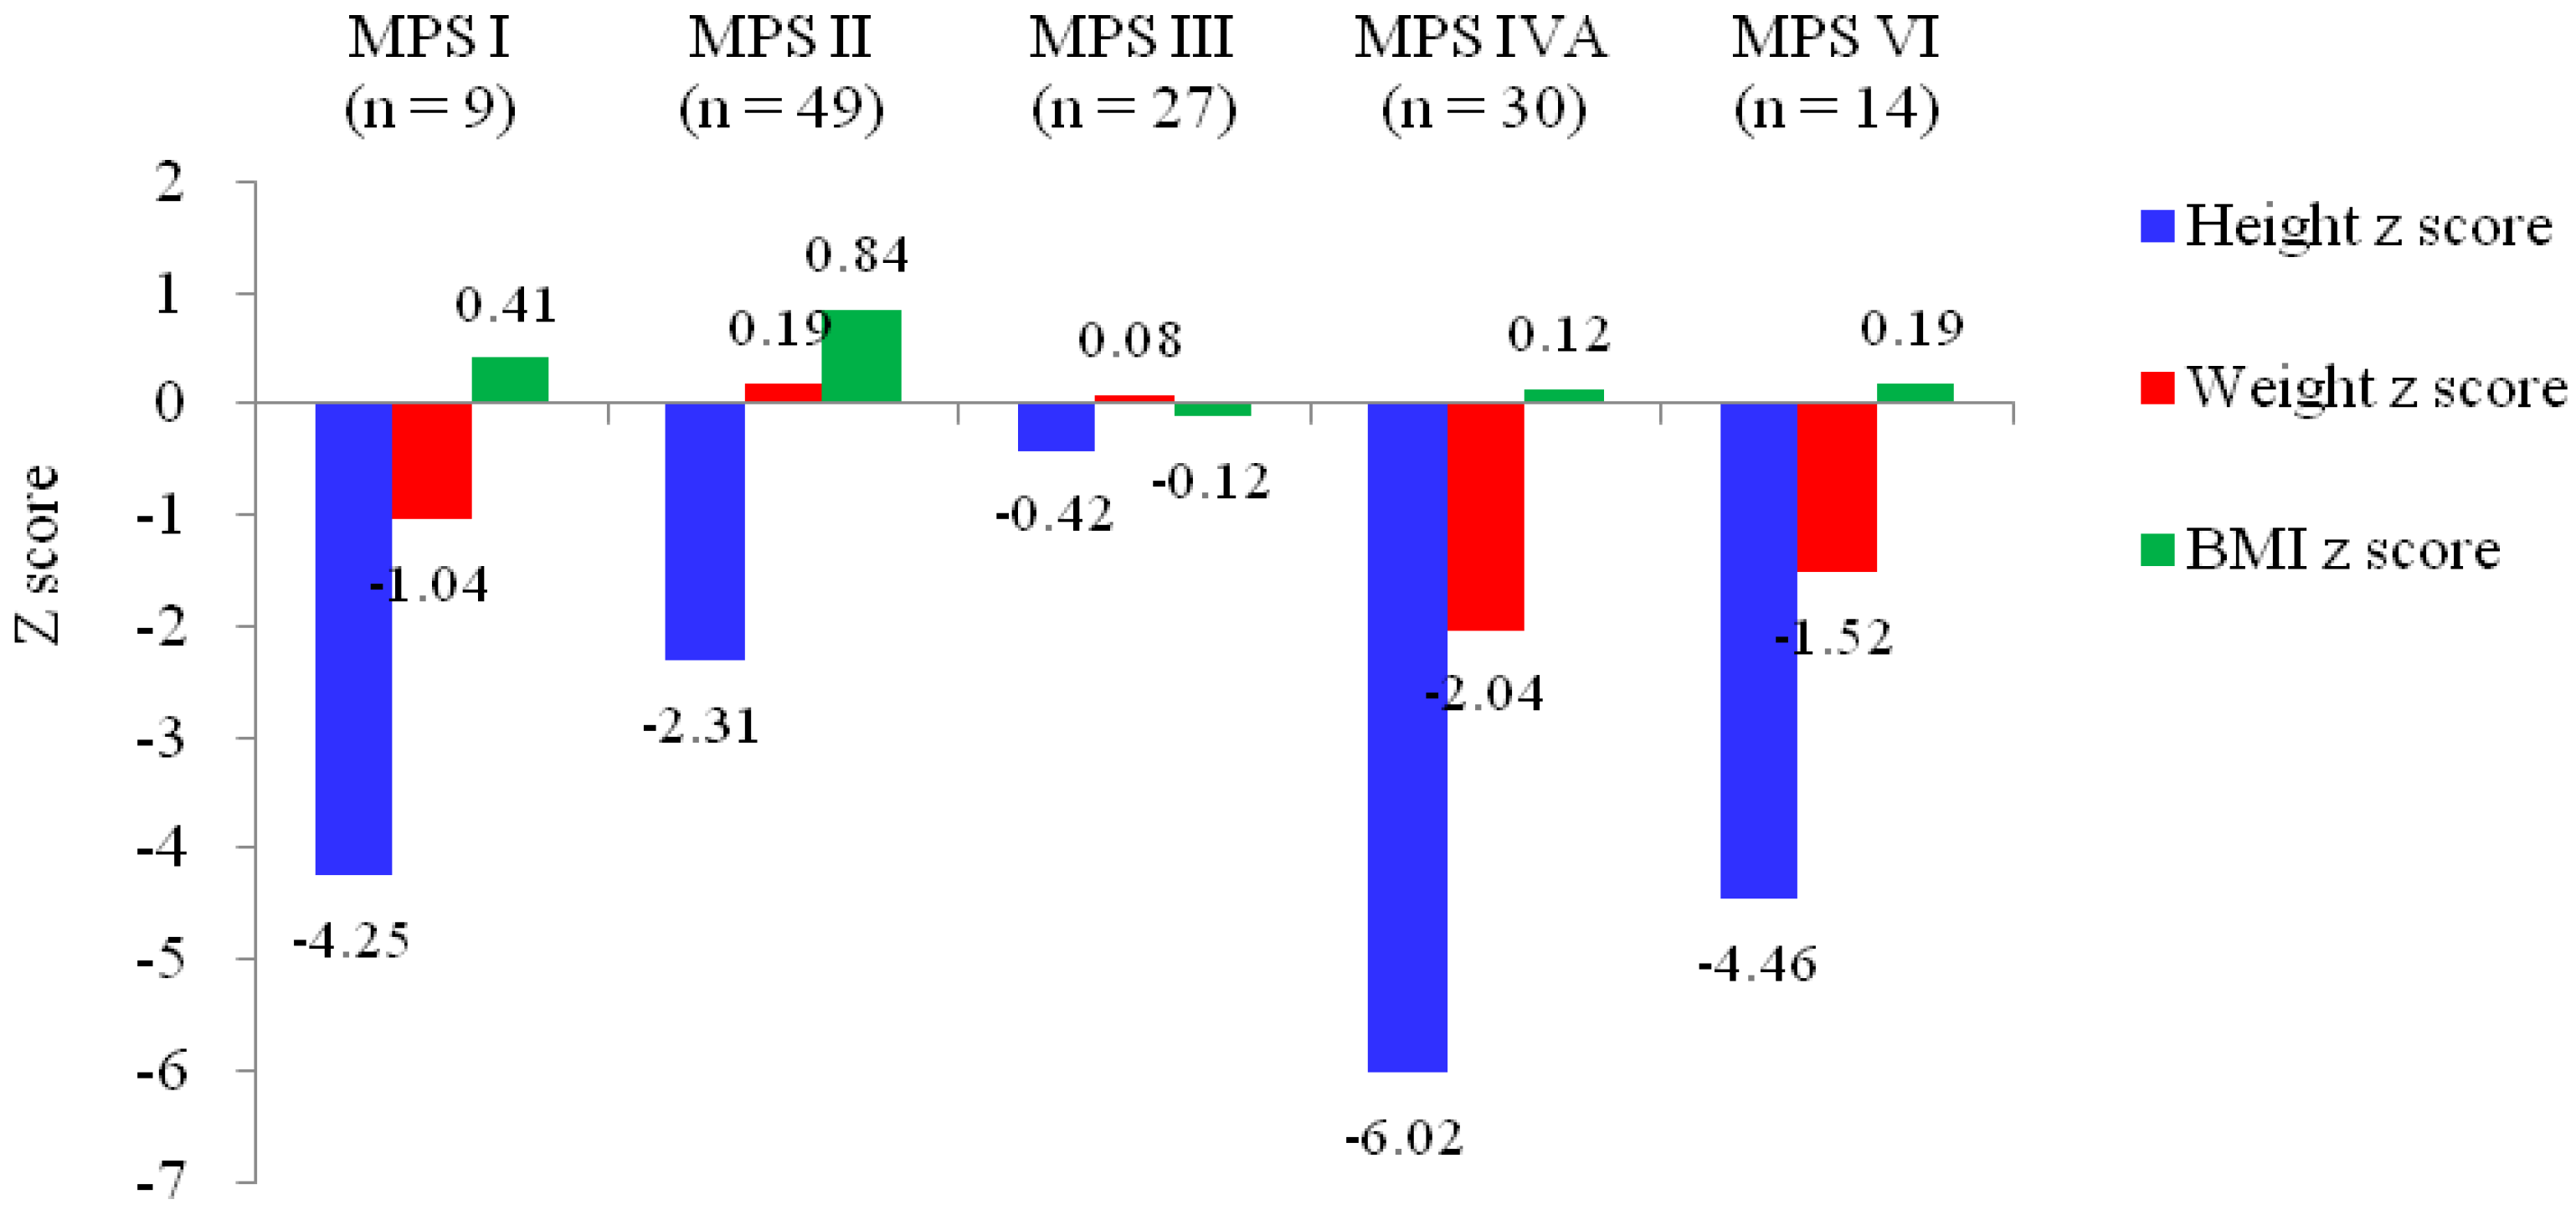
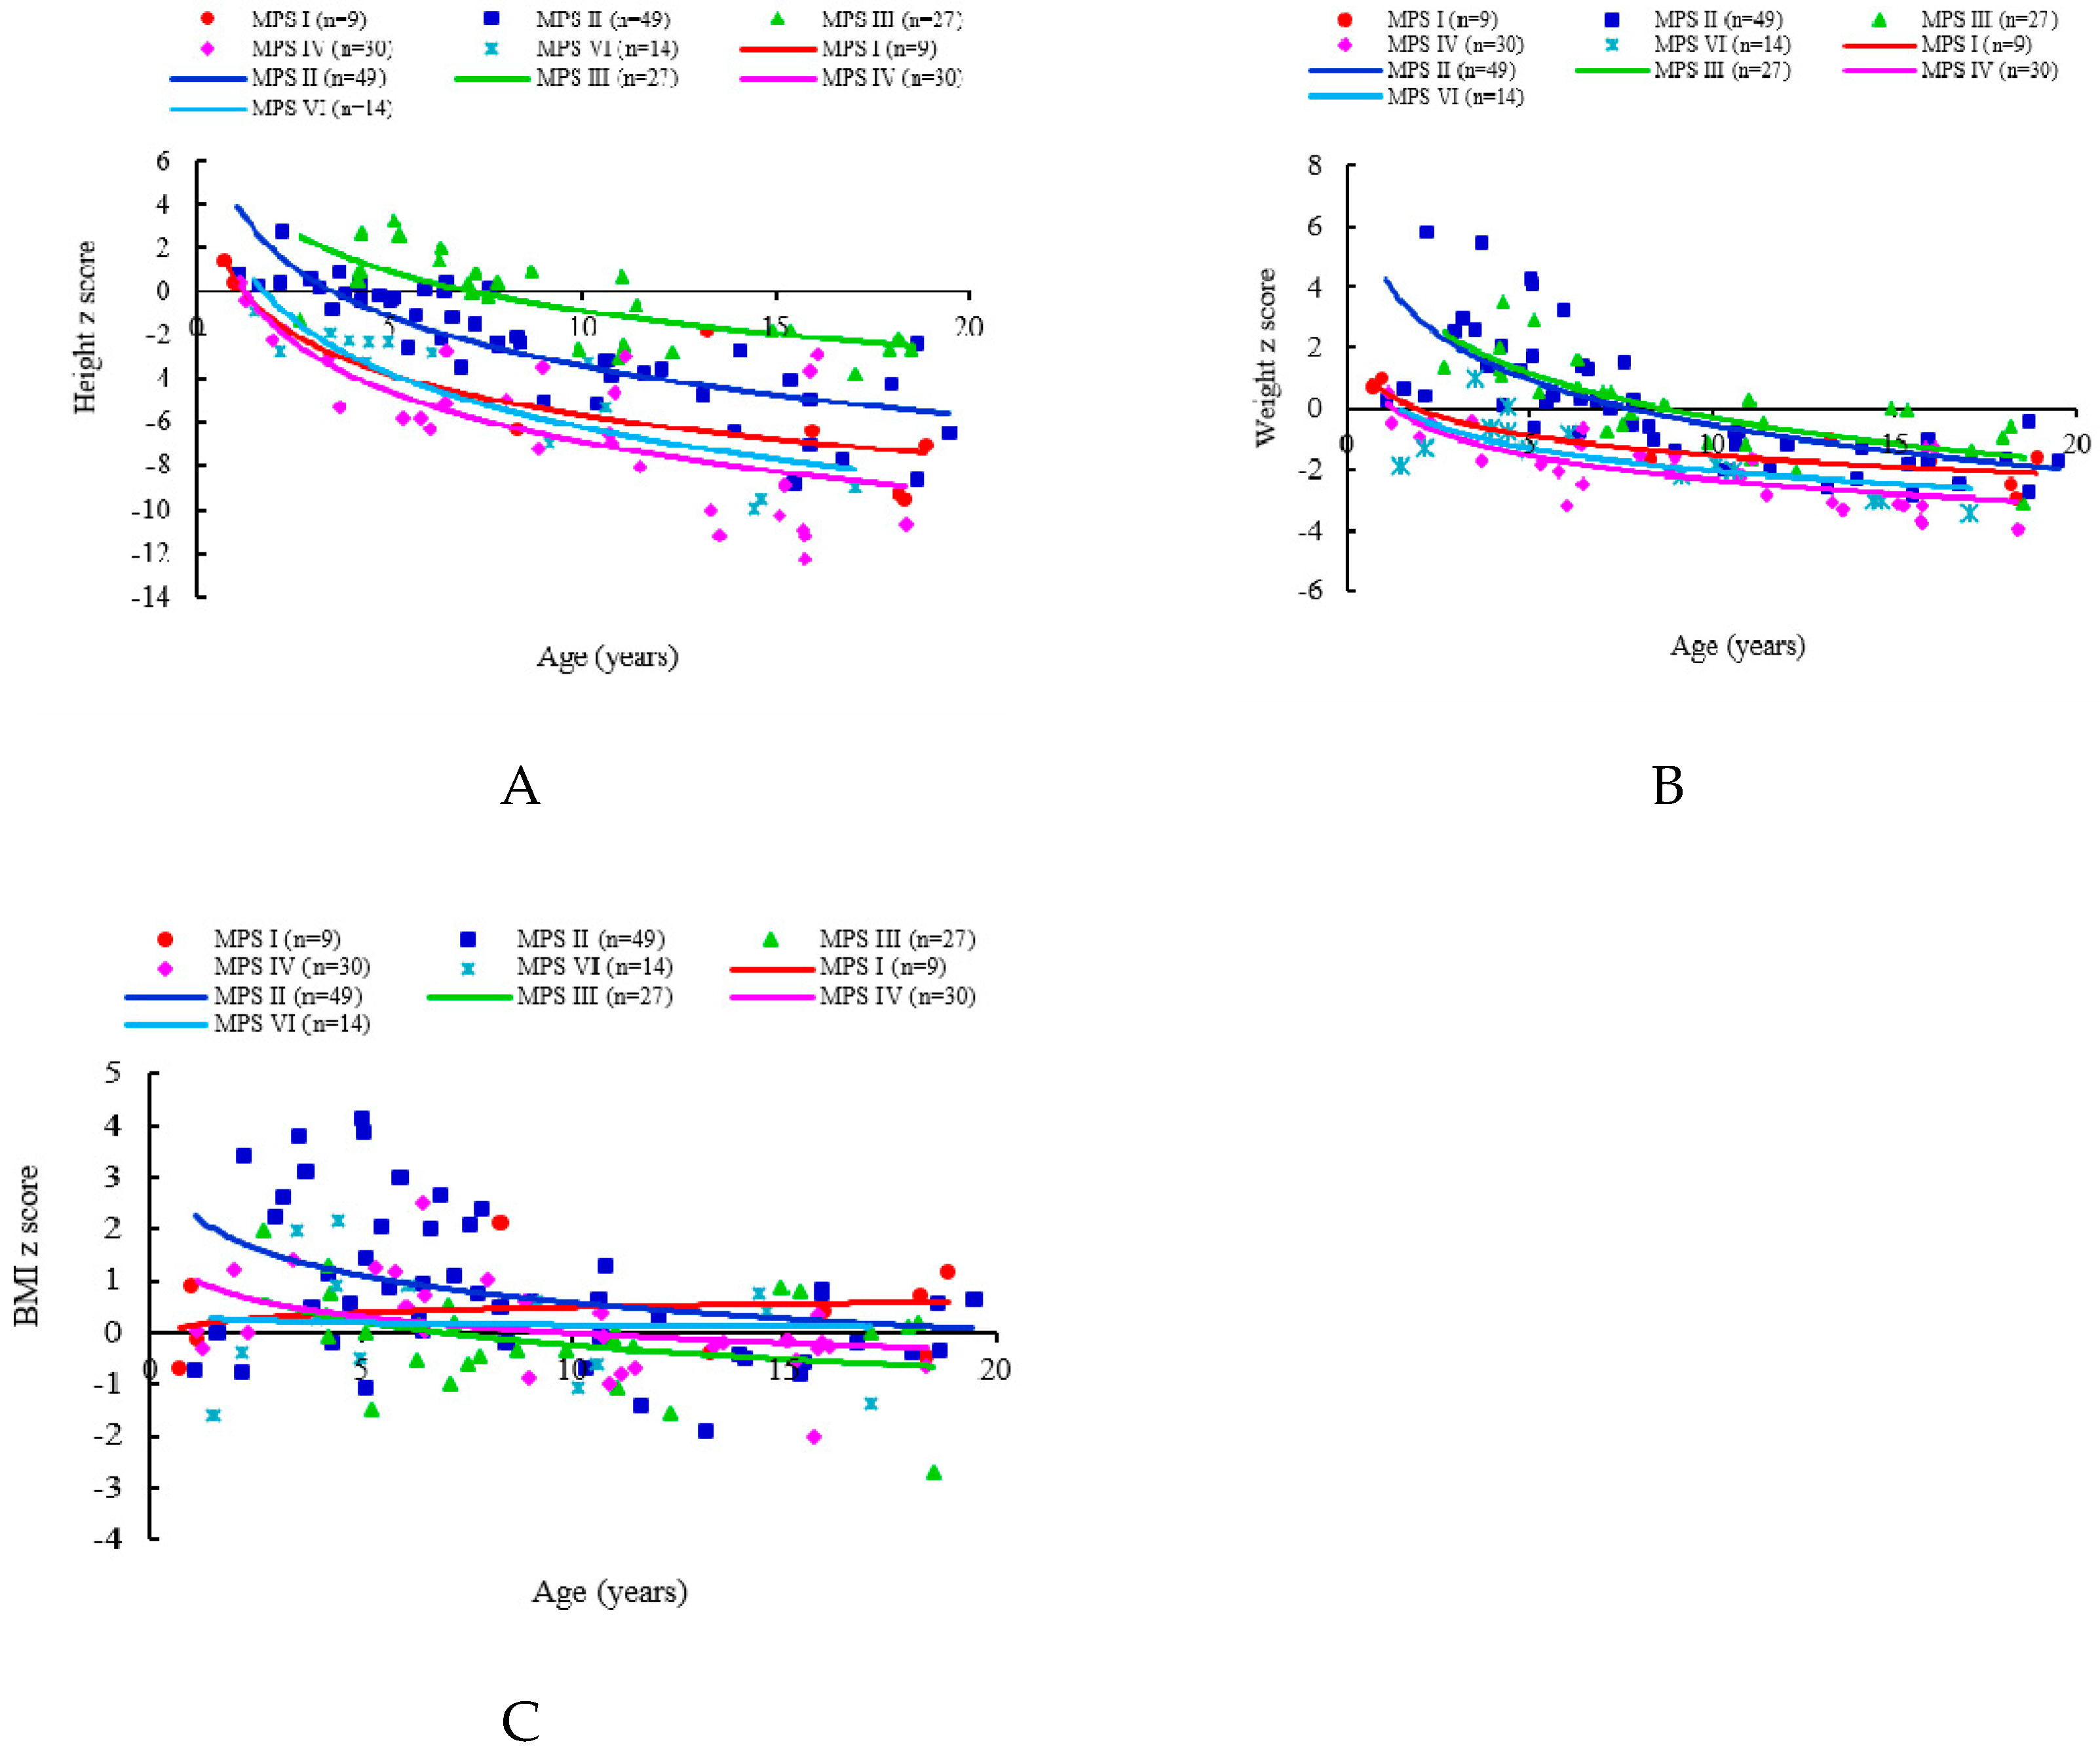
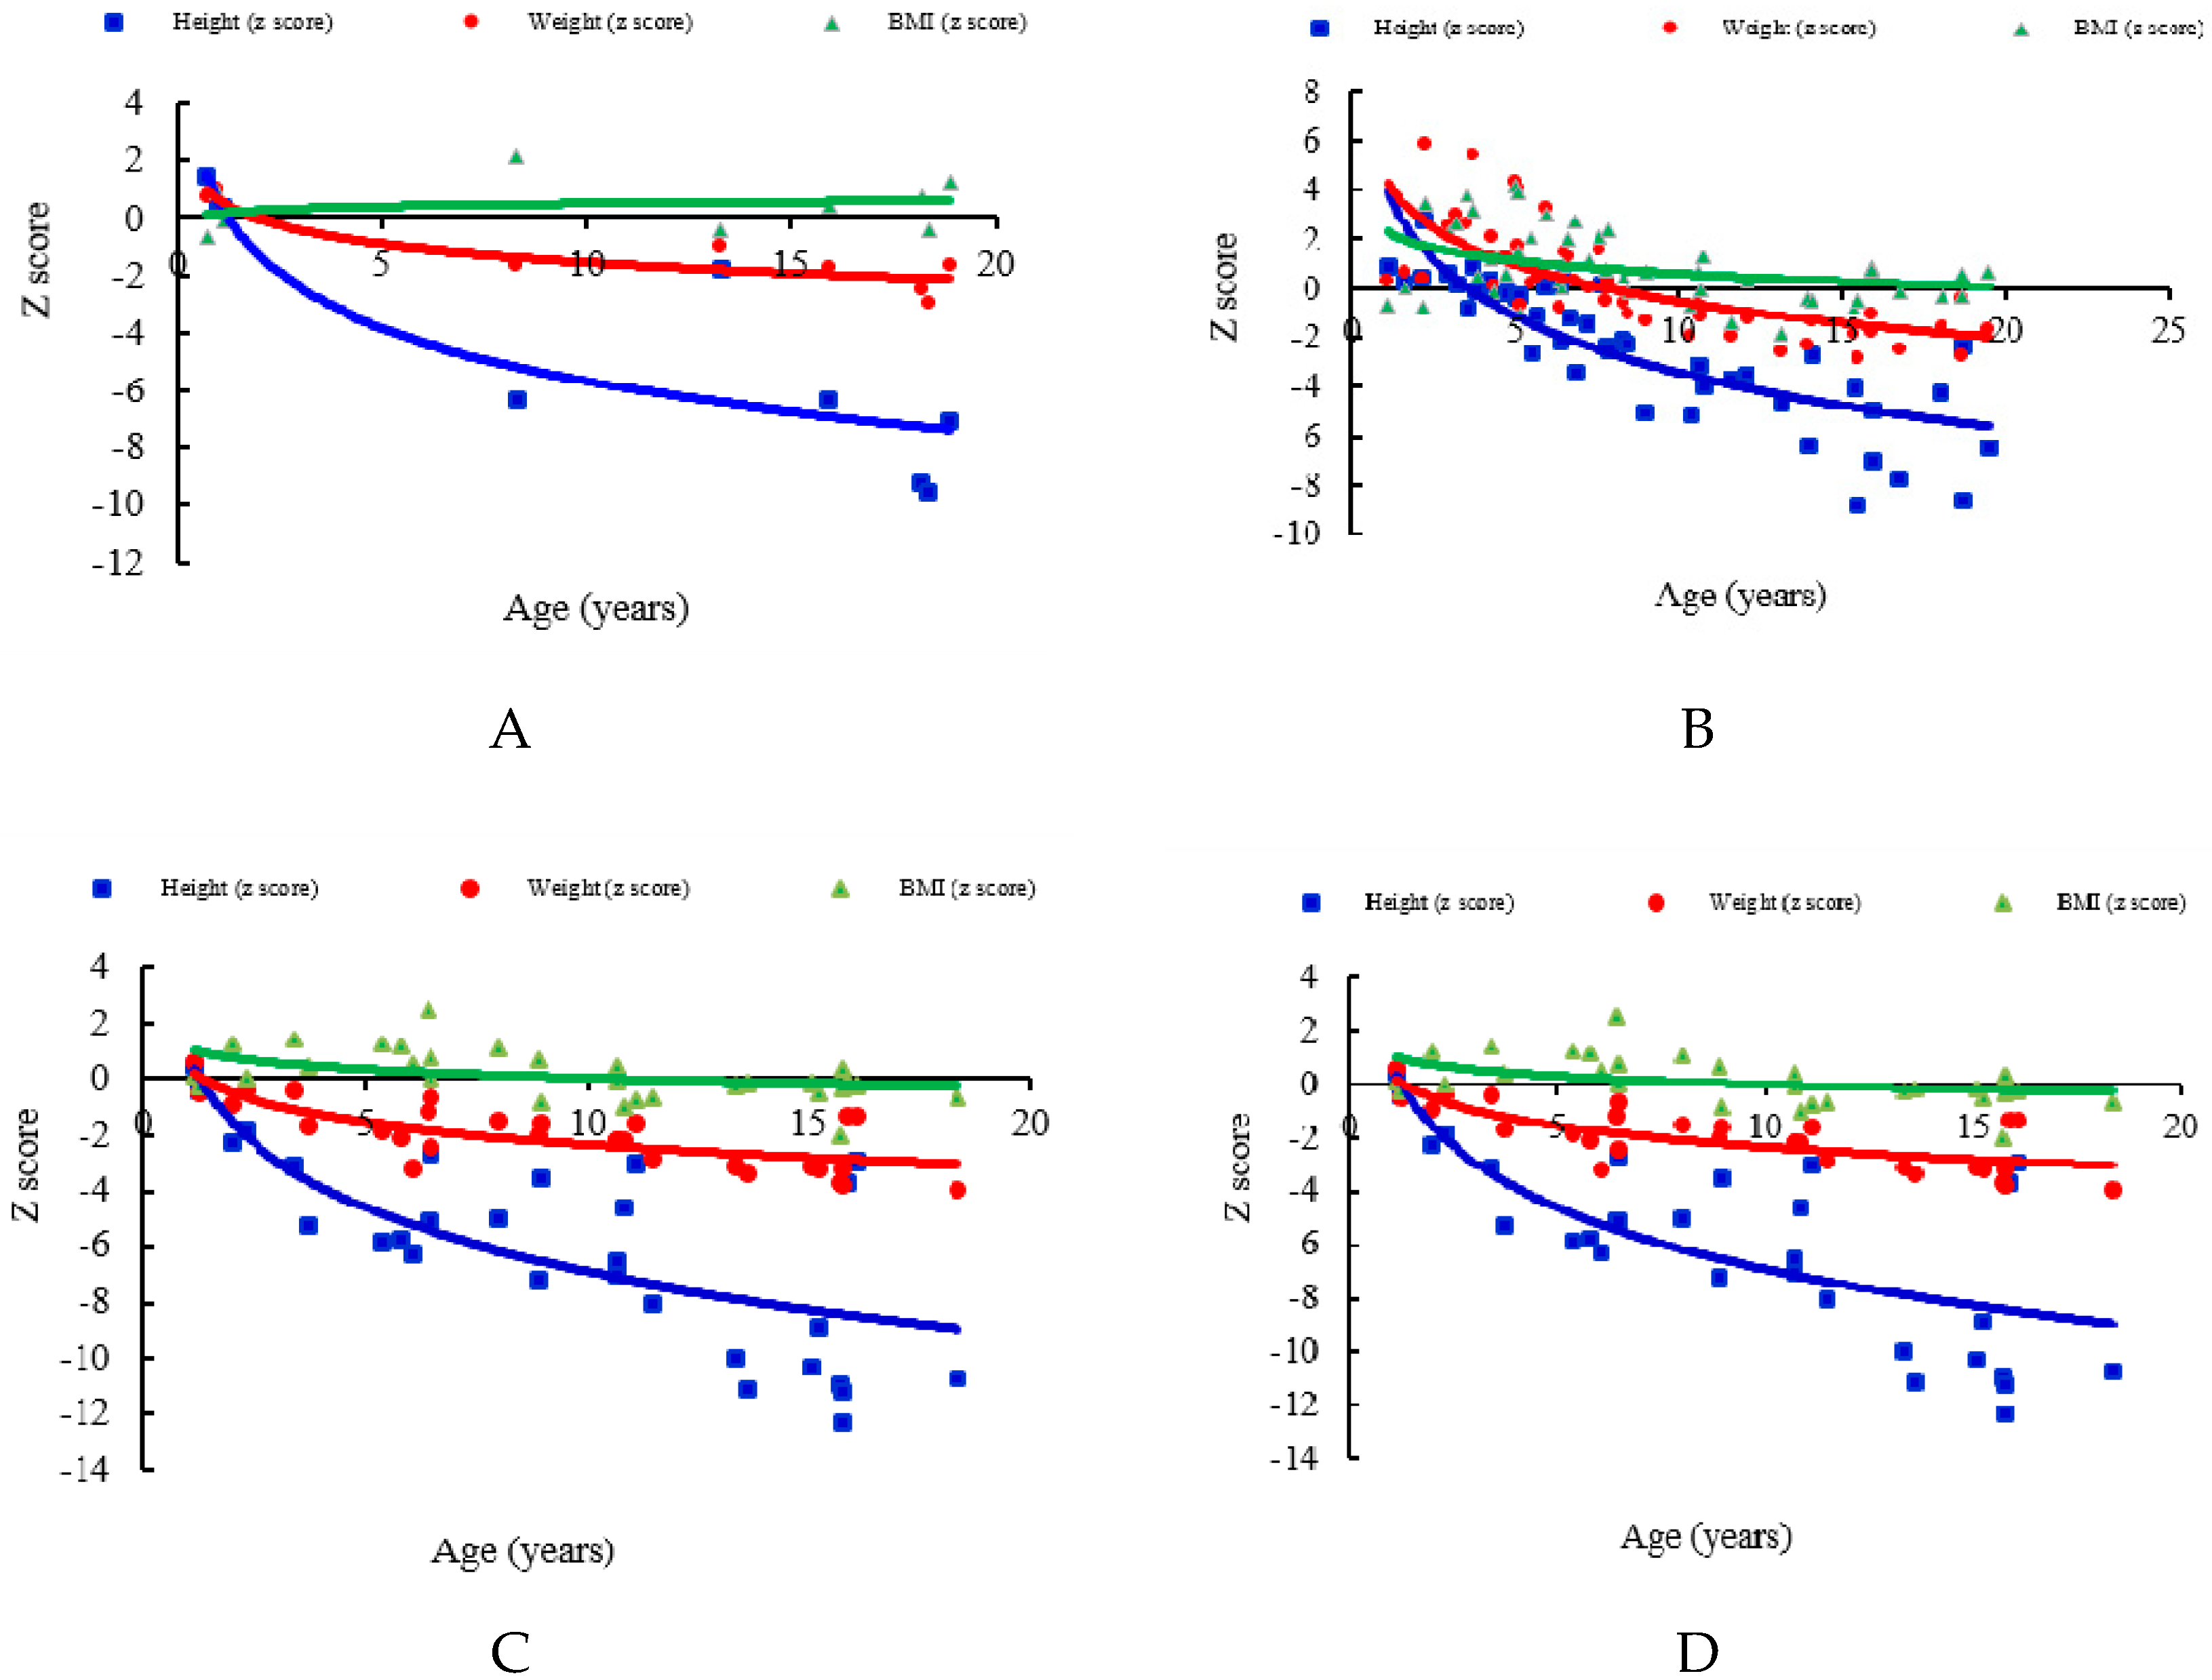
| MPS I | 9 | 0.7–18.9 | 10.6 (8.0) | −4.25 (4.35) | −0.893 | 0.001 | −1.04 (1.43) | −0.916 | 0.0005 | 0.41 (0.92) | 0.120 | 0.758 |
| MPS II | 49 | 1.1–19.5 | 8.7 (5.1) | −2.31 (2.71) | −0.858 | <0.0001 | 0.19 (2.10) | −0.728 | <0.0001 | 0.84 (1.46) | −0.435 | 0.002 |
| MPS III | 27 | 2.7–18.5 | 9.5 (4.8) | −0.42 (1.98) | −0.751 | <0.0001 | 0.08 (1.48) | −0.728 | <0.0001 | −0.12 (0.93) | −0.292 | 0.139 |
| MPS IVA | 30 | 1.1–18.4 | 9.5 (5.2) | −6.02 (3.46) | −0.736 | <0.0001 | −2.04 (1.15) | −0.749 | <0.0001 | 0.12 (0.89) | −0.534 | 0.002 |
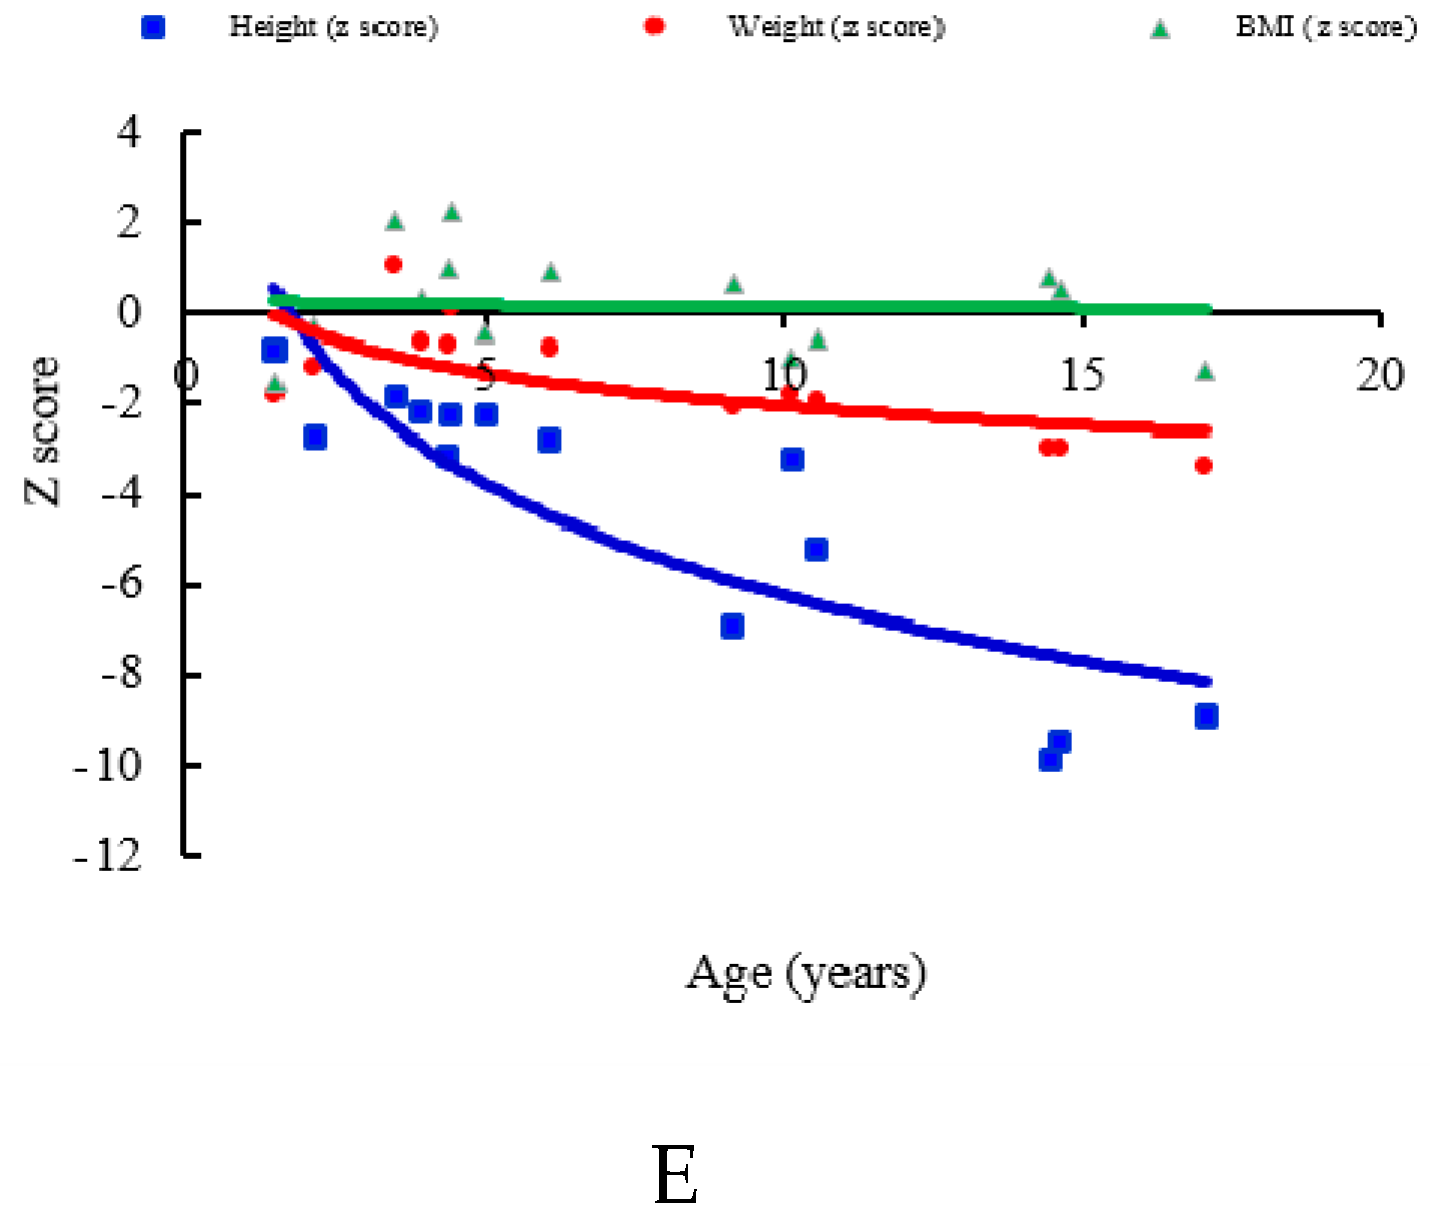
| MPS VI | 14 | 1.5–17.1 | 7.6 (5.0) | −4.46 (3.10) | −0.924 | <0.0001 | −1.52 (1.23) | −0.785 | 0.0009 | 0.19 (1.15) | −0.206 | 0.480 |
| MPS II Subtype | N | Age (Years) | Height z Score | Height z Score vs. Age | Weight z Score | Weight z Score vs. Age | BMI z Score | BMI z Score vs. Age | |||
|---|---|---|---|---|---|---|---|---|---|---|---|
| r | p | r | p | r | p | ||||||
| MPS II (mild/intermediate) | 22 | 10.5 (5.6) | −2.67 (2.87) | −0.839 | <0.0001 | −0.11 (1.83) | −0.763 | <0.0001 | 0.66 (1.19) | −0.379 | 0.082 |
| MPS II (severe) | 27 | 7.2 (4.3) | −2.01 (2.58) | −0.915 | <0.0001 | 0.42 (2.30) | −0.746 | <0.0001 | 0.99 (1.65) | −0.488 | 0.009 |
| MPS Type | N | n (Height z Score >0) | % (Height z Score >0) | n (Weight z Score >0) | % (Weight z Score >0) | n (BMI z Score >0) | % (BMI z Score >0) |
|---|---|---|---|---|---|---|---|
| I | 3 | 3 | 100% | 3 | 100% | 1 | 33% |
| II | 12 | 8 | 67% | 12 | 100% | 9 | 75% |
| III | 5 | 4 | 80% | 5 | 100% | 4 | 80% |
| IVA | 6 | 1 | 17% | 1 | 17% | 5 | 83% |
| VI | 6 | 0 | 0% | 2 | 33% | 4 | 67% |
| Total | 32 | 16 | 50% | 23 | 72% | 23 | 72% |
| MPS Type | N | Mean Birth Weight (g) |
|---|---|---|
| MPS I | 5 | 3520 |
| MPS II | 34 | 3429 |
| MPS III | 13 | 3104 |
| MPS IVA | 7 | 3697 |
| MPS VI | 6 | 3075 |
| All | 65 | 3365 |
| MPS Type | N | Median Age at Diagnosis (Years) | Mean Age at Diagnosis (Years) |
|---|---|---|---|
| MPS I (H) | 1 | 0.7 | 0.7 |
| MPS I (H/S) | 6 | 2.2 | 3.3 |
| MPS I (S) | 2 | 13.6 | 13.6 |
| MPS II (severe) | 25 | 3.0 | 3.3 |
| MPS II (mild/intermediate) | 22 | 4.2 | 4.8 |
| MPS III | 27 | 4.5 | 4.6 |
| MPS IVA | 20 | 4.2 | 4.8 |
| MPS VI | 12 | 3.2 | 3.4 |
| Total | 115 | 3.9 | 4.3 |
© 2019 by the authors. Licensee MDPI, Basel, Switzerland. This article is an open access article distributed under the terms and conditions of the Creative Commons Attribution (CC BY) license (http://creativecommons.org/licenses/by/4.0/).
Share and Cite
Lin, H.-Y.; Lee, C.-L.; Chiu, P.C.; Niu, D.-M.; Tsai, F.-J.; Hwu, W.-L.; Lin, S.J.; Lin, J.-L.; Chang, T.-M.; Chuang, C.-K.; et al. Relationships among Height, Weight, Body Mass Index, and Age in Taiwanese Children with Different Types of Mucopolysaccharidoses. Diagnostics 2019, 9, 148. https://doi.org/10.3390/diagnostics9040148
Lin H-Y, Lee C-L, Chiu PC, Niu D-M, Tsai F-J, Hwu W-L, Lin SJ, Lin J-L, Chang T-M, Chuang C-K, et al. Relationships among Height, Weight, Body Mass Index, and Age in Taiwanese Children with Different Types of Mucopolysaccharidoses. Diagnostics. 2019; 9(4):148. https://doi.org/10.3390/diagnostics9040148
Chicago/Turabian StyleLin, Hsiang-Yu, Chung-Lin Lee, Pao Chin Chiu, Dau-Ming Niu, Fuu-Jen Tsai, Wuh-Liang Hwu, Shio Jean Lin, Ju-Li Lin, Tung-Ming Chang, Chih-Kuang Chuang, and et al. 2019. "Relationships among Height, Weight, Body Mass Index, and Age in Taiwanese Children with Different Types of Mucopolysaccharidoses" Diagnostics 9, no. 4: 148. https://doi.org/10.3390/diagnostics9040148