
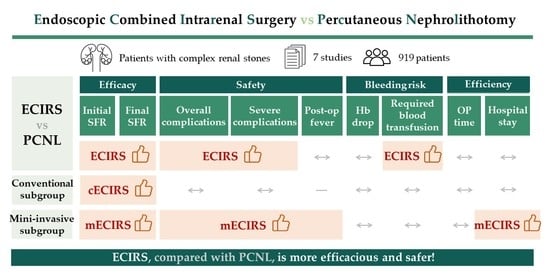
Endoscopic Combined Intrarenal Surgery Versus Percutaneous Nephrolithotomy for Complex Renal Stones: A Systematic Review and Meta-Analysis

 , , and
Abstract
:
1. Introduction
2. Materials and Methods
2.1. Study Design
2.2. Search Strategy
2.3. Eligibility Criteria
- (1)
- Types of participants: patients with complex renal stone.
- (2)
- Types of interventions: Studies comparing ECIRS and PCNL were eligible.
- (3)
- Types of outcome measures: Our outcomes of interest are categorized into “efficacy”, “safety”, and “efficiency”. Studies that reported at least an outcome of interest (i.e., initial stone free rate) were included.
2.4. Risk of Bias Assessment
2.5. Data Extraction and Outcome Measurement
2.5.1. Efficacy Outcomes
- (1)
- Initial stone-free rate (Initial SFR): Absence of stone or residual stone fragments on plain abdominal X-ray (Kidney–Ureter–Bladder, KUB) or non-contrasted abdominal computed tomography (NCCT) within 4 weeks post-operation, or as defined by each study.
- (2)
- Final stone-free rate (Final SFR): The stone-free status was defined as above, but was assessed after the auxiliary procedure (i.e., shock wave lithotripsy, PCNL or ureteroscopic lithotripsy).
2.5.2. Safety Outcomes
- (1)
- Overall complications: Perioperative complications were graded according to the Clavien classification system. Overall complications included all grades.
- (2)
- Severe complications: Clavien–Dindo classification system ≥grade 2.
- (3)
- Postoperative fever: Transient body temperature taken >38.5 °C after operation.
2.5.3. Bleeding Risk
- (1)
- Hemoglobin drop: The postoperative hemoglobin level decreased comparing with that of pre-operative evaluation.
- (2)
- Required blood transfusion: Blood transfusion needed due to significant hemorrhage.
2.5.4. Efficiency outcomes
- (1)
- Operative time: Time taken on the operating table, from positioning to the end of the procedure.
- (2)
- Hospital stay: Number of days since admission for pre-operative evaluation, operation, imaging for SFR assessment, and the treatment if complications occurred.
2.6. Quality Assessment
2.7. Subgroup Analysis, Meta-Regression, and Sensitivity Analysis
2.8. Statistical Analysis
3. Results
3.1. Study Identification and Selection
3.2. Study Characteristics and Risk of Bias Assessment
3.3. Outcomes
3.3.1. Efficacy Outcome
Initial Stone Free Rate (Initial SFR)
Final Stone Free Rate (Final SFR)
3.3.2. Safety Outcome
Overall Complications
Severe Complications
Postoperative Fever
3.3.3. Bleeding Risk
Hemoglobin Drop
Required Blood Transfusion
3.3.4. Efficiency Outcome
Operative Time
Hospital Stay
3.4. Subgroup Analysis in Different Procedure Types and Study Types
3.5. Meta-Regression
3.6. Sensitivity Analysis
4. Discussion
5. Conclusions
Author Contributions
Funding
Institutional Review Board Statement
Informed Consent Statement
Data Availability Statement
Conflicts of Interest
Appendix A. PRISMA Checklist

| Topic | No. | Item | Location where Item is Reported |
|---|---|---|---|
| TITLE | |||
| Title | 1 | Identify the report as a systematic review. | page 1 |
| ABSTRACT | |||
| Abstract | 2 | See the PRISMA 2020 for Abstracts checklist (Table A2) | |
| INTRODUCTION | |||
| Rationale | 3 | Describe the rationale for the review in the context of existing knowledge. | page 1–2 |
| Objectives | 4 | Provide an explicit statement of the objective(s) or question(s) the review addresses. | page 2 |
| METHODS | |||
| Eligibility criteria | 5 | Specify the inclusion and exclusion criteria for the review and how studies were grouped for the syntheses. | page 2 |
| Information sources | 6 | Specify all databases, registers, websites, organisations, reference lists, and other sources searched or consulted to identify studies. Specify the date when each source was last searched or consulted. | page 2 |
| Search strategy | 7 | Present the full search strategies for all databases, registers, and websites, including any filters and limits used. | Appendix C |
| Selection process | 8 | Specify the methods used to decide whether a study met the inclusion criteria of the review, including how many reviewers screened each record and each report retrieved, whether they worked independently, and, if applicable, details of automation tools used in the process. | page 2 |
| Data collection process | 9 | Specify the methods used to collect data from reports, including how many reviewers collected data from each report, whether they worked independently, any processes for obtaining or confirming data from study investigators, and, if applicable, details of automation tools used in the process. | page 2 |
| Data items | 10a | List and define all outcomes for which data were sought. Specify whether all results that were compatible with each outcome domain in each study were sought (e.g., for all measures, time points, analyses), and if not, the methods used to decide which results to collect. | page 2–3 |
| 10b | List and define all other variables for which data were sought (e.g., participant and intervention characteristics, funding sources). Describe any assumptions made about any missing or unclear information. | page 3 | |
| Study risk of bias assessment | 11 | Specify the methods used to assess risk of bias in the included studies, including details of the tool(s) used, how many reviewers assessed each study and whether they worked independently, and, if applicable, details of automation tools used in the process. | Appendix D |
| Effect measures | 12 | Specify for each outcome the effect measure(s) (e.g., risk ratio, mean difference) used in the synthesis or presentation of results. | page 4–6 |
| Synthesis methods | 13a | Describe the processes used to decide which studies were eligible for each synthesis (e.g., tabulating the study intervention characteristics and comparing against the planned groups for each synthesis (item 5)). | page 2 |
| 13b | Describe any methods required to prepare the data for presentation or synthesis, such as handling of missing summary statistics, or data conversions. | page 2 | |
| 13c | Describe any methods used to tabulate or visually display results of individual studies and syntheses. | page 3 | |
| 13d | Describe any methods used to synthesize results and provide a rationale for the choice(s). If meta-analysis was performed, describe the model(s), method(s) to identify the presence and extent of statistical heterogeneity, and software package(s) used. | page 3 | |
| 13e | Describe any methods used to explore possible causes of heterogeneity among study results (e.g., subgroup analysis, meta-regression). | page 3 | |
| 13f | Describe any sensitivity analyses conducted to assess robustness of the synthesized results. | page 3 | |
| Reporting bias assessment | 14 | Describe any methods used to assess risk of bias due to missing results in a synthesis (arising from reporting biases). | page 3 |
| Certainty assessment | 15 | Describe any methods used to assess certainty (or confidence) in the body of evidence for an outcome. | Appendix E |
| RESULTS | |||
| Study selection | 16a | Describe the results of the search and selection process, from the number of records identified in the search to the number of studies included in the review, ideally using a flow diagram. | Figure 1 |
| 16b | Cite studies that might appear to meet the inclusion criteria, but which were excluded, and explain why they were excluded. | Figure 1 | |
| Study characteristics | 17 | Cite each included study and present its characteristics. | Table 1 |
| Risk of bias in studies | 18 | Present assessments of risk of bias for each included study. | Appendix D |
| Results of individual studies | 19 | For all outcomes, present, for each study: (a) summary statistics for each group (where appropriate) and (b) an effect estimate and its precision (e.g., confidence/credible interval), ideally using structured tables or plots. | page 4,6,7 |
| Results of syntheses | 20a | For each synthesis, briefly summarise the characteristics and risk of bias among contributing studies. | page 7 |
| 20b | Present results of all statistical syntheses conducted. If meta-analysis was performed, present for each the summary estimate and its precision (e.g., confidence/credible interval) and measures of statistical heterogeneity. If comparing groups, describe the direction of the effect. | page 4,6,7 | |
| 20c | Present results of all investigations of possible causes of heterogeneity among study results. | page 3 | |
| 20d | Present results of all sensitivity analyses conducted to assess the robustness of the synthesized results. | Appendix G | |
| Reporting biases | 21 | Present assessments of risk of bias due to missing results (arising from reporting biases) for each synthesis assessed. | page 4 |
| Certainty of evidence | 22 | Present assessments of certainty (or confidence) in the body of evidence for each outcome assessed. | page 4,6,7 |
| DISCUSSION | |||
| Discussion | 23a | Provide a general interpretation of the results in the context of other evidence. | page 9–10 |
| 23b | Discuss any limitations of the evidence included in the review. | page 10 | |
| 23c | Discuss any limitations of the review processes used. | page 10 | |
| 23d | Discuss implications of the results for practice, policy, and future research. | page 10 | |
| OTHER INFORMATION | |||
| Registration and protocol | 24a | Provide registration information for the review, including register name and registration number, or state that the review was not registered. | page 2 |
| 24b | Indicate where the review protocol can be accessed, or state that a protocol was not prepared. | page 2 | |
| 24c | Describe and explain any amendments to information provided at registration or in the protocol. | page 2 | |
| Support | 25 | Describe sources of financial or non-financial support for the review, and the role of the funders or sponsors in the review. | page 11 |
| Competing interests | 26 | Declare any competing interests of review authors. | page 11 |
| Availability of data, code and other materials | 27 | Report which of the following are publicly available and where they can be found: template data collection forms; data extracted from included studies; data used for all analyses; analytic code; any other materials used in the review. | page 11 |
| Topic | No. | Item | Reported? |
|---|---|---|---|
| TITLE | |||
| Title | 1 | Identify the report as a systematic review. | Yes |
| BACKGROUND | |||
| Objectives | 2 | Provide an explicit statement of the main objective(s) or question(s) the review addresses. | Yes |
| METHODS | |||
| Eligibility criteria | 3 | Specify the inclusion and exclusion criteria for the review. | No |
| Information sources | 4 | Specify the information sources (e.g., databases, registers) used to identify studies and the date when each was last searched. | Yes |
| Risk of bias | 5 | Specify the methods used to assess risk of bias in the included studies. | Yes |
| Synthesis of results | 6 | Specify the methods used to present and synthesize results. | No |
| RESULTS | |||
| Included studies | 7 | Give the total number of included studies and participants and summarise relevant characteristics of studies. | Yes |
| Synthesis of results | 8 | Present results for main outcomes, preferably indicating the number of included studies and participants for each. If meta-analysis was performed, report the summary estimate and confidence/credible interval. If comparing groups, indicate the direction of the effect (i.e., which group is favoured). | Yes |
| DISCUSSION | |||
| Limitations of evidence | 9 | Provide a brief summary of the limitations of the evidence included in the review (e.g., study risk of bias, inconsistency and imprecision). | No |
| Interpretation | 10 | Provide a general interpretation of the results and important implications. | Yes |
| OTHER | |||
| Funding | 11 | Specify the primary source of funding for the review. | Yes |
| Registration | 12 | Provide the register name and registration number. | Yes |
Appendix B.
| Item No. | Recommendation | Reported on Page No. |
|---|---|---|
| Reporting of background should include | ||
| 1 | Problem definition | 1–2 |
| 2 | Hypothesis statement | 2 |
| 3 | Description of study outcome(s) | 4,6–7 |
| 4 | Type of exposure or intervention used | 2 |
| 5 | Type of study designs used | 2 |
| 6 | Study population | 2 |
| Reporting of search strategy should include | ||
| 7 | Qualifications of searchers (e.g., librarians and investigators) | 2 |
| 8 | Search strategy, including time period included in the synthesis and keywords | 2 |
| 9 | Effort to include all available studies, including contact with authors | 2 |
| 10 | Databases and registries searched | 2 |
| 11 | Search software used, name and version, including special features used (e.g., explosion) | Manual |
| 12 | Use of hand searching (e.g., reference lists of obtained articles) | Appendix C |
| 13 | List of citations located and those excluded, including justification | Figure 1 |
| 14 | Method of addressing articles published in languages other than English | 2 |
| 15 | Method of handling abstracts and unpublished studies | 2 |
| 16 | Description of any contact with authors | 2 |
| Reporting of methods should include | ||
| 17 | Description of relevance or appropriateness of studies assembled for assessing the hypothesis to be tested | 2 |
| 18 | Rationale for the selection and coding of data (e.g., sound clinical principles or convenience) | 2 |
| 19 | Documentation of how data were classified and coded (e.g., multiple raters, blinding and interrater reliability) | 4,6 |
| 20 | Assessment of confounding (e.g., comparability of cases and controls in studies where appropriate) | Table 1 |
| 21 | Assessment of study quality, including blinding of quality assessors, stratification or regression on possible predictors of study results | Appendix E |
| 22 | Assessment of heterogeneity | 3 |
| 23 | Description of statistical methods (e.g., complete description of fixed or random effects models, justification of whether the chosen models account for predictors of study results, dose-response models, or cumulative meta-analysis) in sufficient detail to be replicated | 2 |
| 24 | Provision of appropriate tables and graphics | Appendices |
Appendix C. Search Strategy
| Database | Search Detail |
|---|---|
| PubMed | (“endoscope s”[All Fields] OR “endoscoped”[All Fields] OR “endoscopes”[MeSH Terms] OR “endoscopes”[All Fields] OR “endoscope”[All Fields] OR “endoscopical”[All Fields] OR “endoscopically”[All Fields] OR “endoscopy”[MeSH Terms] OR “endoscopy”[All Fields] OR “endoscopic”[All Fields]) AND (“combinable”[All Fields] OR “combinated”[All Fields] OR “combination”[All Fields] OR “combinational”[All Fields] OR “combinations”[All Fields] OR “combinative”[All Fields] OR “combine”[All Fields] OR “combined”[All Fields] OR “combines”[All Fields] OR “combining”[All Fields]) AND (“intrarenal”[All Fields] OR “intrarenally”[All Fields]) AND (“surgery”[MeSH Subheading] OR “surgery”[All Fields] OR “surgical procedures, operative”[MeSH Terms] OR (“surgical”[All Fields] AND “procedures”[All Fields] AND “operative”[All Fields]) OR “operative surgical procedures”[All Fields] OR “general surgery”[MeSH Terms] OR (“general”[All Fields] AND “surgery”[All Fields]) OR “general surgery”[All Fields] OR “surgery s”[All Fields] OR “surgerys”[All Fields] OR “surgeries”[All Fields]) AND (“nephrolithotomies”[All Fields] OR “nephrolithotomy”[All Fields]) AND (“percutaneous”[All Fields] OR “percutaneously”[All Fields] OR “percutanous”[All Fields]) Translations endoscopic: “endoscope’s”[All Fields] OR “endoscoped”[All Fields] OR “endoscopes”[MeSH Terms] OR “endoscopes”[All Fields] OR “endoscope”[All Fields] OR “endoscopical”[All Fields] OR “endoscopically”[All Fields] OR “endoscopy”[MeSH Terms] OR “endoscopy”[All Fields] OR “endoscopic”[All Fields] combined: “combinable”[All Fields] OR “combinated”[All Fields] OR “combination”[All Fields] OR “combinational”[All Fields] OR “combinations”[All Fields] OR “combinative”[All Fields] OR “combine”[All Fields] OR “combined”[All Fields] OR “combines”[All Fields] OR “combining”[All Fields] intrarenal: “intrarenal”[All Fields] OR “intrarenally”[All Fields] surgery: “surgery”[Subheading] OR “surgery”[All Fields] OR “surgical procedures, operative”[MeSH Terms] OR (“surgical”[All Fields] AND “procedures”[All Fields] AND “operative”[All Fields]) OR “operative surgical procedures”[All Fields] OR “general surgery”[MeSH Terms] OR (“general”[All Fields] AND “surgery”[All Fields]) OR “general surgery”[All Fields] OR “surgery’s”[All Fields] OR “surgerys”[All Fields] OR “surgeries”[All Fields] percutaneous: “percutaneous”[All Fields] OR “percutaneously”[All Fields] OR “percutanous”[All Fields] nephrolithotomy: “nephrolithotomies”[All Fields] OR “nephrolithotomy”[All Fields] |
| Cochrane | (percutaneous):ti,ab,kw AND (nephrolithotomy):ti,ab,kw AND (endoscopic):ti,ab,kw AND (intrarenal):ti,ab,kw AND (surgery):ti,ab,kw (Word variations have been searched) |
| Embase | (endoscopic AND combined AND intrarenal AND (‘surgery’/exp OR surgery)) AND (percutaneous AND (‘nephrolithotomy’/exp OR nephrolithotomy)) |
Appendix D.
| First Author, Year | Random Sequence Generation (Selection Bias) | Allocation Concealment (Selection Bias) | Blinding of Participants and Personnel (Performance Bias) | Blinding of Outcome Assessment (Detection Bias) | Incomplete Outcome Data (Attrition Bias) | Selective Reporting (Reporting Bias) | Other Bias |
|---|---|---|---|---|---|---|---|
| Wen, 2016 | Low | High | High | Unclear | Low | Low | Unclear |
| Author, Year | Representativeness of the Exposed Cohort | Selection of the Nonexposed Cohort | Ascertainment of Exposure | Demonstration that Outcome of Interest Was Not Present at Start of Study | Comparability of Cohorts on the Basis of the Design or Analysis | Assessment of Outcome | Was Follow-up Long Enough for Outcomes to Occur | Adequacy of Follow up of Cohorts | Total Score |
|---|---|---|---|---|---|---|---|---|---|
| Zhao, 2020 | ✵ | ✵ | ✵ | ✵ | ✵✵ | ✵ | ✵ | ✵ | 9 |
| Hamamoto, 2014 | ✵ | ✵ | ✵ | ✵ | ✵✵ | ✵ | ✵ | ✵ | 9 |
| Nuño, 2013 | ✵ | ✵ | ✵ | ✵ | ✵✵ | ✵ | ✵ | 8 | |
| Isac, 2013 | ✵ | ✵ | ✵ | ✵ | ✵✵ | ✵ | 7 | ||
| Leng, 2018 | ✵ | ✵ | ✵ | ✵ | ✵✵ | ✵ | ✵ | ✵ | 9 |
| Xu, 2019 | ✵ | ✵ | ✵ | ✵ | ✵✵ | ✵ | ✵ | 8 |
Appendix E.
| Certainty Assessment | No. of Patients | Effect | Certainty | Importance | ||||||||
|---|---|---|---|---|---|---|---|---|---|---|---|---|
| № of Studies | Study Design | Risk of Bias | Inconsist-ency | Indirect-ness | Impreci-sion | Other Considerations | Endoscopic Combined Intrarenal Surgery | Percutaneous Nephrolithotomy | Relative (95% CI) | Absolute (95% CI) | ||
| Initial stone free | ||||||||||||
| 7 | observational studies and randomized control trial | not serious | not serious | not serious | not serious | strong association | 337/401 (84.0%) | 320/521 (61.4%) | OR 3.50 (2.16 to 5.67) | 234 more per 1000 (from 161 more to 286 more) | ⨁⨁⨁◯ MODERATE | CRITICAL |
| Final stone free | ||||||||||||
| 5 | observational studies and randomized control trial | not serious | not serious | not serious | not serious | strong association | 247/271 (91.1%) | 263/350 (75.1%) | OR 3.06 (1.57 to 5.95) | 151 more per 1000 (from 75 more to 196 more) | ⨁⨁⨁◯ MODERATE | CRITICAL |
| Overall complications | ||||||||||||
| 7 | observational studies and randomized control trial | not serious | not serious | not serious | not serious | strong association | 65/401 (16.2%) | 142/521 (27.3%) | OR 0.45 (0.29 to 0.70) | 128 fewer per 1000 (from 175 fewer to 65 fewer) | ⨁⨁⨁◯ MODERATE | CRITICAL |
| Severe complications | ||||||||||||
| 6 | observational studies and randomized control trial | not serious | not serious | not serious | not serious | strong association | 16/328 (4.9%) | 61/423 (14.4%) | OR 0.29 (0.16 to 0.52) | 98 fewer per 1000 (from 118 fewer to 64 fewer) | ⨁⨁⨁◯ MODERATE | CRITICAL |
| Post-operative fever | ||||||||||||
| 5 | observational studies and randomized control trial | not serious | not serious | not serious | serious a | none | 24/265 (9.1%) | 29/327 (8.9%) | OR 0.65 (0.34 to 1.24) | 29 fewer per 1000 (from 57 fewer to 19 more) | ⨁◯◯◯ VERY LOW | CRITICAL |
| Hemoglobin drop | ||||||||||||
| 5 | observational studies | not serious | serious b | not serious | serious a | none | 295 | 389 | - | MD 0.8 g/dL lower (1.64 lower to 0.04 higher) | ⨁◯◯◯ VERY LOW | IMPORTANT |
| Required blood transfusion | ||||||||||||
| 6 | observational studies and randomized control trial | not serious | not serious | not serious | serious b | strong association | 4/328 (1.2%) | 19/423 (4.5%) | OR 0.33 (0.12 to 0.91) | 30 fewer per 1000 (from 39 fewer to 4 fewer) | ⨁⨁◯◯ LOW | CRITICAL |
| Operative time | ||||||||||||
| 6 | observational studies and randomized control trial | not serious | serious b | not serious | serious a | none | 328 | 423 | - | MD 6.73 h lower (19.91 lower to 6.46 higher) | ⨁◯◯◯ VERY LOW | IMPORTANT |
| Hospital stay | ||||||||||||
| 6 | observational studies and randomized control trial | not serious | serious b | not serious | serious a | none | 338 | 425 | - | MD 2.05 days lower (4.14 lower to 0.05 higher) | ⨁◯◯◯ VERY LOW | IMPORTANT |
Appendix F. Subgroup Analyses for Operation Type
Appendix F.1. Efficacy Outcome


Appendix F.2. Safety Outcome


Appendix F.3. Bleeding Risk


Appendix F.4. Efficiency Outcome


Appendix G. Subgroup Analyses for Operation Type
Appendix G.1. Efficacy Outcome


Appendix G.2. Safety Outcome


Appendix G.3. Bleeding Risk


Appendix G.4. Efficiency Outcome


Appendix H. Sensitivity Analyses
Appendix H.1. Exclude NOS Lower than 7
Appendix H.1.1. Efficacy Outcome


Appendix H.1.2. Safety Outcome


Appendix H.1.3. Bleeding Risk


Appendix H.1.4. Efficiency Outcome


Appendix H.2. Exclude NOS Lower than 8
Appendix H.2.1. Efficacy Outcome


Appendix H.2.2. Safety Outcome


Appendix H.2.3. Bleeding Risk


Appendix H.2.4. Efficiency Outcome


Appendix I. Contour-Enhanced Meta-Analysis Funnel Plots and Egger’s Test
Appendix I.1. Efficacy Outcome


Appendix I.2. Safety Outcome


Appendix I.3. Bleeding Risk


Appendix I.4. Efficiency Outcome


Appendix J. Trial Sequential Analysis
Appendix J.1. Efficacy Outcome


Appendix J.2. Safety Outcome


Appendix J.3. Bleeding Risk


Appendix J.4. Efficiency Outcome


Appendix K.
| Outcomes | Variables | Study (N) | Coefficient (95% CI) | p-Value |
|---|---|---|---|---|
| Initial stone free rate | Publication date | 7 | −0.124 (−0.278 to 0.030) | 0.1156 |
| Final stone free rate | 5 | −0.200 (−0.412 to 0.013) | 0.0654 | |
| Overall complications | 7 | −0.093 (−0.244 to 0.058) | 0.2276 | |
| Severe complications | 6 | 0.052 (−0.188 to 0.292) | 0.6704 | |
| Postoperative fever | 5 | 0.067 (−0.320 to 0.454) | 0.7357 | |
| Hemoglobin drop | 5 | 0.886 (0.697 to 1.127) | 0.3254 | |
| Required blood transfusion | 6 | −0.020 (−0.407 to 0.366) | 0.9187 | |
| Operative time | 6 | 0.124 (0.000 to 67.032) | 0.5154 | |
| Hospital stay | 6 | 1.034 (0.449 to 2.381) | 0.9373 |
Appendix L.
| Outcomes | Variables | Study (N) | Coefficient (95% CI) | p-Value |
|---|---|---|---|---|
| Initial stone free rate | Amplatz sheath size | 7 | 0.034 (−0.078 to 0.146) | 0.5501 |
| Final stone free rate | 5 | 0.058 (−0.121 to 0.238) | 0.5227 | |
| Overall complications | 7 | 0.054 (−0.019 to 0.126) | 0.1468 | |
| Severe complications | 6 | −0.006 (−0.150 to 0.139) | 0.9399 | |
| Postoperative fever | 5 | 0.529 (−0.109 to 1.167) | 0.1043 | |
| Hemoglobin drop | 5 | 1.086 (0.894 to 1.320) | 0.4036 | |
| Required blood transfusion | 6 | 0.044 (−0.174 to 0.263) | 0.6900 | |
| Operative time | 6 | 9.308 (0.621 to 139.593) | 0.1064 | |
| Hospital stay | 6 | 1.405 (0.801 to 2.465) | 0.2362 |
References
- Vrtiska, T.J. Quantitation of stone burden: Imaging advances. Urol. Res. 2005, 33, 398–402. [Google Scholar] [CrossRef] [PubMed]
- Diri, A.; Diri, B. Management of staghorn renal stones. Ren. Fail. 2018, 40, 357–362. [Google Scholar] [CrossRef] [PubMed] [Green Version]
- Scoffone, C.M.; Cracco, C.M. Invited review: The tale of ECIRS (Endoscopic Combined IntraRenal Surgery) in the Galdakao-modified supine Valdivia position. Urolithiasis 2018, 46, 115–123. [Google Scholar] [CrossRef] [PubMed]
- Scoffone, C.M.; Cracco, C.M.; Cossu, M.; Grande, S.; Poggio, M.; Scarpa, R.M. Endoscopic combined intrarenal surgery in Galdakao-modified supine Valdivia position: A new standard for percutaneous nephrolithotomy? Eur. Urol. 2008, 54, 1393–1403. [Google Scholar] [CrossRef]
- Zeng, G.; Zhao, Z.; Wu, W.; Zhong, W. Combination of debulking single-tract percutaneous nephrolithotomy followed by retrograde intrarenal surgery for staghorn stones in solitary kidneys. Scand J. Urol. 2014, 48, 295–300. [Google Scholar] [CrossRef]
- Page, M.J.; McKenzie, J.E.; Bossuyt, P.M.; Boutron, I.; Hoffmann, T.C.; Mulrow, C.D.; Shamseer, L.; Tetzlaff, J.M.; Akl, E.A.; Brennan, S.E.; et al. The PRISMA 2020 statement: An updated guideline for reporting systematic reviews. Int. J. Surg. 2021, 88, 105906. [Google Scholar] [CrossRef]
- Stroup, D.F.; Berlin, J.A.; Morton, S.C.; Olkin, I.; Williamson, G.D.; Rennie, D.; Moher, D.; Becker, B.J.; Sipe, T.A.; Thacker, S.B.; et al. Meta-analysis of observational studies in epidemiology: A proposal for reporting. Meta-analysis Of Observational Studies in Epidemiology (MOOSE) group. JAMA 2000, 283, 2008–2012. [Google Scholar] [CrossRef]
- Higgins, J.P.T.; Altman, D.G.; Gøtzsche, P.C.; Jüni, P.; Moher, D.; Oxman, A.D.; Savović, J.; Schulz, K.F.; Weeks, L.; Sterne, J.A.C.; et al. The Cochrane Collaboration’s tool for assessing risk of bias in randomised trials. BMJ 2011, 343, d5928. [Google Scholar] [CrossRef] [Green Version]
- Stang, A. Critical evaluation of the Newcastle-Ottawa scale for the assessment of the quality of nonrandomized studies in meta-analyses. Eur. J. Epidemiol. 2010, 25, 603–605. [Google Scholar] [CrossRef] [Green Version]
- Guyatt, G.; Oxman, A.D.; Akl, E.A.; Kunz, R.; Vist, G.; Brozek, J.; Norris, S.; Falck-Ytter, Y.; Glasziou, P.; deBeerh, H.; et al. GRADE guidelines: 1. Introduction-GRADE evidence profiles and summary of findings tables. J. Clin. Epidemiol. 2011, 64, 383–394. [Google Scholar] [CrossRef]
- Riley, R.D.; Sutton, A.J.; Abrams, K.R.; Lambert, P.C. Sensitivity analyses allowed more appropriate and reliable meta-analysis conclusions for multiple outcomes when missing data was present. J. Clin. Epidemiol 2004, 57, 911–924. [Google Scholar] [CrossRef] [PubMed]
- Higgins, J.P.T.; Thompson, S.G.; Deeks, J.J.; Altman, D.G. Measuring inconsistency in meta-analyses. BMJ 2003, 327, 557–560. [Google Scholar] [CrossRef] [PubMed] [Green Version]
- Lin, L.; Chu, H. Quantifying publication bias in meta-analysis. Biometrics 2018, 74, 785–794. [Google Scholar] [CrossRef] [PubMed]
- Viechtbauer, W. Conducting Meta-Analyses inRwith themetaforPackage. J. Stat. Softw. 2011, 36, 1–48. [Google Scholar] [CrossRef] [Green Version]
- Wallace, B.C.; Dahabreh, I.J.; Trikalinos, T.A.; Lau, J.; Trow, P.; Schmid, C.H. Closing the gap between methodologists and end-users:Ras a computational back-end. J. Stat. Softw. 2012, 49, 1–15. [Google Scholar] [CrossRef] [Green Version]
- Wetterslev, J.; Jakobsen, J.C.; Gluud, C. Trial Sequential Analysis in systematic reviews with meta-analysis. BMC Med. Res. Methodol 2017, 17, 39. [Google Scholar] [CrossRef] [Green Version]
- Wen, J.; Xu, G.; Du, C.; Wang, B. Minimally invasive percutaneous nephrolithotomy versus endoscopic combined intrarenal surgery with flexible ureteroscope for partial staghorn calculi: A randomised controlled trial. Int. J. Surg. 2016, 28, 22–27. [Google Scholar] [CrossRef]
- Zhao, F.; Li, J.; Tang, L.; Li, C. A comparative study of endoscopic combined intrarenal surgery (ECIRS) in the galdakao-modified supine valdivia (GMSV) position and minimally invasive percutaneous nephrolithotomy for complex nephrolithiasis: A retrospective single-center study. Urolithiasis 2021, 49, 161–166. [Google Scholar] [CrossRef]
- Hamamoto, S.; Yasui, T.; Okada, A.; Taguchi, K.; Kawai, N.; Ando, R.; Mizuno, K.; Kubota, Y.; Kamiya, H.; Tozawa, K.; et al. Endoscopic combined intrarenal surgery for large calculi: Simultaneous use of flexible ureteroscopy and mini-percutaneous nephrolithotomy overcomes the disadvantageous of percutaneous nephrolithotomy monotherapy. J. Endourol. 2014, 28, 28–33. [Google Scholar] [CrossRef]
- Nuño de la Rosa, I.; Palmero, J.L.; Miralles, J.; Pastor, J.C.; Benedicto, A. A comparative study of percutaneous nephrolithotomy in supine position and endoscopic combined intrarenal surgery with flexible instrument. Actas Urol. Esp. (Engl. Ed.) 2014, 38, 14–20. [Google Scholar] [CrossRef]
- Isac, W.; Rizkala, E.; Liu, X.; Noble, M.; Monga, M. Endoscopic-guided versus fluoroscopic-guided renal access for percutaneous nephrolithotomy: A comparative analysis. Urology 2013, 81, 251–256. [Google Scholar] [CrossRef] [PubMed]
- Leng, S.; Xie, D.; Zhong, Y.; Huang, M. Combined single-tract of minimally percutaneous nephrolithotomy and flexible ureteroscopy for staghorn calculi in oblique supine lithotomy position. Surg Innov. 2018, 25, 22–27. [Google Scholar] [CrossRef] [PubMed]
- Xu, K.; Li, Z. Comparison of Multi-tract minimally invasive percutaneous nephrolithotomy and Endoscopic Combined Intrarenal Surgery for Staghorn Renal Calculi: A single institution experience. In Proceedings of the 37th World Congress of Endourology, Abu Dhubi, United Arab Emirates, 31 October 2019; p. 235. [Google Scholar] [CrossRef]
- Kallidonis, P.; Panagopoulos, V.; Kyriazis, I.; Liatsikos, E. Complications of percutaneous nephrolithotomy: Classification, management, and prevention. Curr. Opin. Urol. 2016, 26, 88–94. [Google Scholar] [CrossRef] [PubMed]
- De Coninck, V.; Keller, E.X.; Somani, B.; Giusti, G.; Proietti, S.; Rodriguez-Socarras, M.; Rodríguez-Monsalve, M.; Doizi, S.; Ventimiglia, E.; Traxer, O. Complications of ureteroscopy: A complete overview. World J. Urol. 2020, 38, 2147–2166. [Google Scholar] [CrossRef] [PubMed]
- Tien, H.; Nascimento, B., Jr.; Callum, J.; Rizoli, S. An approach to transfusion and hemorrhage in trauma: Current perspectives on restrictive transfusion strategies. Can. J. Surg. 2007, 50, 202–209. [Google Scholar]
- Jackman, S.V.; Hedican, S.P.; Peters, C.A.; Docimo, S.G. Percutaneous nephrolithotomy in infants and preschool age children: Experience with a new technique. Urology 1998, 52, 697–701. [Google Scholar] [CrossRef]
- De La Rosette, J.J.; Opondo, D.; Daels, F.P.J.; Giusti, G.; Serrano, A.; Kandasami, S.V.; Wolf, J.S., Jr.; Grabe, M.; Gravas, S. Categorisation of complications and validation of the Clavien score for percutaneous nephrolithotomy. Eur. Urol. 2012, 62, 246–255. [Google Scholar] [CrossRef]
- Jung, H.D.; Kim, J.C.; Ahn, H.K.; Kwon, J.H.; Han, K.; Han, W.K.; Kim, M.-D.; Lee, J.Y. Real-time simultaneous endoscopic combined intrarenal surgery with intermediate-supine position: Washout mechanism and transport technique. Investig. Clin. Urol. 2018, 59, 348–354. [Google Scholar] [CrossRef]
- Sountoulides, P.G.; Kaufmann, O.G.; Louie, M.K.; Beck, S.; Jain, N.; Kaplan, A.; McDougall, E.M.; Clayman, R.V. Endoscopy-guided percutaneous nephrostolithotomy: Benefits of ureteroscopic access and therapy. J. Endourol. 2009, 23, 1649–1654. [Google Scholar] [CrossRef]


| Author, Year | Country | Study Period | Study Design | No. of Patients | Age (Mean) | Male (%) | BMI (kg/m2) | Stone Burden Characteristics | No. of Staghorn Stone (%) | No. of Complete Staghorn stone (%) | Intervention | Comparator | Percutaneous Access Size | ECIRS Position | PCNL Position |
|---|---|---|---|---|---|---|---|---|---|---|---|---|---|---|---|
| Zhao, 2020 [17] | China | Jan 2018– Oct 2019 | RCS | 140 | 53.13 | 64.2 | 25.61 | Area 700 mm2 | 16.4 | 8.4 | mECIRS | mPCNL | 16–18F | GMSV | prone |
| Hamamoto, 2014 [18] | Japan | Feb 2004– Jan 2013 | RCS | 161 | 53.17 | 75.8 | 24.62 | Max 36.7 mm | 35.4 | 17.4 | mECIRS | mPCNL, cPCNL | (mini) 18F, (con) 30F | prone split-leg | prone |
| Wen, 2016 [19] | China | May 2012– Oct 2014 | RCT | 67 | 44.49 | 58.2 | 21.9 | Area 667 mm2 | 100 | NS | mECIRS | mPCNL | 20F | GMSV | prone |
| Nuño, 2013 [20] | Spain | Jan 2005– Dec 2011 | RCS | 171 | 51.4 | 42.1 | NS | Area 694.1 mm2 | 43.2 | 24.6 | cECIRS | cPCNL | 24–30F | GMSV | supine |
| Isac, 2013 [21] | USA | Aug 2010– Jan 2012 | RCS | 158 | 57.6 | 45.5 | 30.78 | Cumulative 30.6 mm | NS | NS | cECIRS | cPCNL | 30F | prone split-leg | prone |
| Leng, 2018 [22] | Japan | Feb 2004– Jan 2013 | RCS | 87 | 45.98 | 59.8 | NS | Mean 52.2 mm | 100 | 33.3 | mECIRS | mPCNL | 16–18F | oblique supine lithotomy | oblique supine lithotomy |
| Xu, 2019 [23] | China | NS | RCS | 135 | 50.03 | 48.2 | 23.05 | Mean 58.14 mm | 100 | 65.19 | mECIRS | mPCNL | 16–22F | NS | NS |
Publisher’s Note: MDPI stays neutral with regard to jurisdictional claims in published maps and institutional affiliations. |
© 2022 by the authors. Licensee MDPI, Basel, Switzerland. This article is an open access article distributed under the terms and conditions of the Creative Commons Attribution (CC BY) license (https://creativecommons.org/licenses/by/4.0/).
Share and Cite
Liu, Y.-H.; Jhou, H.-J.; Chou, M.-H.; Wu, S.-T.; Cha, T.-L.; Yu, D.-S.; Sun, G.-H.; Chen, P.-H.; Meng, E. Endoscopic Combined Intrarenal Surgery Versus Percutaneous Nephrolithotomy for Complex Renal Stones: A Systematic Review and Meta-Analysis. J. Pers. Med. 2022, 12, 532. https://doi.org/10.3390/jpm12040532
Liu Y-H, Jhou H-J, Chou M-H, Wu S-T, Cha T-L, Yu D-S, Sun G-H, Chen P-H, Meng E. Endoscopic Combined Intrarenal Surgery Versus Percutaneous Nephrolithotomy for Complex Renal Stones: A Systematic Review and Meta-Analysis. Journal of Personalized Medicine. 2022; 12(4):532. https://doi.org/10.3390/jpm12040532
Chicago/Turabian StyleLiu, Yung-Hao, Hong-Jie Jhou, Meng-Han Chou, Sheng-Tang Wu, Tai-Lung Cha, Dah-Shyong Yu, Guang-Huan Sun, Po-Huang Chen, and En Meng. 2022. "Endoscopic Combined Intrarenal Surgery Versus Percutaneous Nephrolithotomy for Complex Renal Stones: A Systematic Review and Meta-Analysis" Journal of Personalized Medicine 12, no. 4: 532. https://doi.org/10.3390/jpm12040532