Article

Early MRI Predictors of Relapse in Primary Central Nervous System Lymphoma Treated with MATRix Immunochemotherapy

1
UCL Institute of Neurology, Department of Brain Rehabilitation and Repair, Queen Square, London WC1N 3BG, UK
2
Lysholm Department of Neuroradiology, National Hospital for Neurology and Neurosurgery, University College London Hospitals NHS Foundation Trust, London WC1N 3BG, UK
3
Neuroradiology Department, Kings College Hospital NHS Foundation Trust, London SE5 9RS, UK
4
Radiology Department, Royal Free London NHS Foundation Trust, London NW3 2QG, UK
5
Haematology Department, University College London Hospitals NHS Foundation Trust, London NW1 2BU, UK
6
School of Medicine, University of Nottingham, Nottingham NG7 2UH, UK
7
Precision Imaging Beacon, School of Medicine, University of Nottingham, Nottingham NG7 2UH, UK
8
Neuroradiology Department, Nottingham University Hospitals NHS Trust, Nottingham NG7 2UH, UK
*
Author to whom correspondence should be addressed.
J. Pers. Med. 2023, 13(7), 1182; https://doi.org/10.3390/jpm13071182
Submission received: 15 April 2023 / Revised: 14 July 2023 / Accepted: 17 July 2023 / Published: 24 July 2023

Abstract

:
Primary Central Nervous System Lymphoma (PCNSL) is a highly malignant brain tumour. We investigated dynamic changes in tumour volume and apparent diffusion coefficient (ADC) measurements for predicting outcome following treatment with MATRix chemotherapy in PCNSL. Patients treated with MATRix (n = 38) underwent T1 contrast-enhanced (T1CE) and diffusion-weighted imaging (DWI) before treatment, after two cycles and after four cycles of chemotherapy. Response was assessed using the International PCNSL Collaborative Group (IPCG) imaging criteria. ADC histogram parameters and T1CE tumour volumes were compared among response groups, using one-way ANOVA testing. Logistic regression was performed to examine those imaging parameters predictive of response. Response after two cycles of chemotherapy differed from response after four cycles; of the six patients with progressive disease (PD) after four cycles of treatment, two (33%) had demonstrated a partial response (PR) or complete response (CR) after two cycles. ADCmean at baseline, T1CE at baseline and T1CE percentage volume change differed between response groups (0.005 < p < 0.038) and were predictive of MATRix treatment response (area under the curve: 0.672–0.854). Baseline ADC and T1CE metrics are potential biomarkers for risk stratification of PCNSL patients early during remission induction therapy with MATRix. Standard interim response assessment (after two cycles) according to IPCG imaging criteria does not reliably predict early disease progression in the context of a conventional treatment approach.

1. Introduction

Primary Central Nervous System Lymphoma (PCNSL) is a highly malignant brain tumour originating from lymphocytes, typically in the form of diffuse large B-cell lymphoma (DLBCL). The incidence of PCNSL is approximately 0.5/100,000 persons/year with a predilection for older individuals. The rising incidence of PCNSL over the last decades [1,2,3,4] and its responsiveness to chemotherapy have led to a growing focus on its management. Until recent years, PCNSL was often an incurable disease with long-term survival rates of approximately 20–30% [5]. Based on results of international randomised trials such as research conducted by the International Extranodal Lymphoma Study Group (IELSG), therapeutic strategies have evolved with a dramatic improvement in PCNSL outcomes. Since 2016, newly diagnosed PCNSL patients ≤70 years old with sufficient fitness are offered remission induction treatment consisting of four cycles of MATRix chemotherapy (methotrexate, cytarabine, thiotepa and rituximab) followed by High-Dose Therapy and Autologous Stem Cell Transplantation (HDT-ASCT), as established by IELSG32 [6]. The MATRix regimen is a highly effective treatment for PCNSL but carries a substantial risk of treatment-related neurotoxicity. Treatment-related mortality lies in range of 4–7% [7]. These complications preclude some patients from proceeding to HDT-ASCT consolidation, which likely represents an essential milestone towards survival. In addition, there are few long-term data on the side effects of MATRix; however, its components (specifically methotrexate) are known to be neurotoxic such that treatment-related neurocognitive deficits may have important and possibly underestimated long-term clinical impact. For patients with relapsed or refractory PCNSL, survival expectations are very limited with a median OS of 3.5 months [8]. It would be highly advantageous to confidently identify patients at high risk of treatment failure, earlier in the treatment pathway, towards risk-adapted treatment strategies.
Presently, the standard for imaging-based response assessment in PCNSL is based on recommendations by the International Primary CNS Lymphoma Collaborative Group (IPCG) [1] (Table 4). The standardised guidelines divide PCNSL patients receiving MATRix chemotherapy into four groups according to response, i.e., complete response (CR), unconfirmed complete response (CRu), partial response (PR) and progressive disease (PD), and are summarized in Table 1.
The radiological component of the IPCG categorical response criteria remains confined to a semi-qualitative (percentage estimate) lesion assessment based on gadolinium enhancement, despite increased clinical availability of quantitative imaging methods [4]. It has recently been suggested that IPCG-derived response has limited interobserver agreement and may not accurately predict long-term survival [9]. This is partially due to lack of adoption of standardized MRI acquisition parameters and sequences in PCNSL assessment, which has led to the IPCG suggesting ”ideal” and ”minimum” recommended PCNSL imaging protocols for both 3 T and 1.5 T MRI systems [10]. There are currently no established physiological imaging biomarkers to inform treatment approaches in PCNSL. In recent years, focus has shifted towards the possible diagnostic and prognostic role of quantitative imaging analysis in PCNSL [5], with the hope of finding correlates that reflect treatment efficacy and would be suitable for clinical translation [11]. As a first step, rather than the more clinically widespread use of two-dimensional sum-product measurements of tumour burden, contrast-enhancing lesion volumetry could provide a more accurate and objective parameter for response assessment [10].
Mean Apparent Diffusion Coefficient (ADC) measurements could be a rapid and practicable approach to improving imaging response assessment of PCNSL, which is widely known to display low diffusion (for example, [12]). ADC values are calculated from diffusion-weighted imaging (DWI) and represent a measure of the diffusion of water molecules in a given time period as a method for assessing tissue/tumoral microstructure. Typical PCNSL is characterised by a higher cellular density compared to many other CNS malignancies which corresponds to a lower ADC [5,13]. The use of ADC parameters has shown to be valuable for a number of applications, including PCNSL from glioblastoma distinction [14,15] and glioma molecular subgroup predictions. ADC measurement in PCNSL could represent a further step towards a more accurate, quantifiable image assessment.
The purpose of this research study was to test the hypothesis that baseline and early-in-therapy T1 contrast-enhanced (T1CE) lesion volume measurements and diffusion-weighted imaging (ADC values) cumulative parameters may allow prediction of response to MATRix chemotherapy in PCNSL.

2. Materials and Methods

2.1. Patients

Consecutive patients (n = 56) who received MATRix chemotherapy at two different treatment centres, the National Hospital of Neurology and Neurosurgery, University College London Hospitals NHS Foundation Trust (NHNN, n = 30), and Nottingham University Hospital (NUH, n = 26), were eligible for the analysis. Inclusion criteria comprised the following: age over 18 years, histological confirmation of primary DLBCL of the CNS as defined by the World Health Organisation Classification of CNS Tumours [16,17], treatment with MATRix chemotherapy, no evidence of systemic Non-Hodgkin Lymphoma, serology-negative for human immunodeficiency virus and available contrast-enhanced and diffusion-weighted imaging (DWI and ADC) at baseline, after 2 cycles of treatment and within one month of completion of MATRix treatment. Ethics review board approval (Health Research Authority, United Kingdom, IRAS 218180) was obtained with informed consent waived for this retrospective imaging data study. Exclusion criteria were intra-therapy death, leading to non-completion of treatment and, therefore, unavailable imaging at the treatment completion timepoint (n = 5), interval surgery during treatment (n = 4), missing images (n = 8) and failure of registration of ADC map to post-contrast T1-weighted imaging (n = 1). Of the 56 patients who met the inclusion criteria, 18 patients were excluded. A diagram of the patient selection process is shown in Figure 1.

2.2. MRI Acquisition and Post Processing

Images were obtained on 1.5 T and 3T MRI scanners at the two treatment centres and their referring institutions. MRI studies included DWI series and T1-weighted series with gadolinium-based contrast agent. Either 0.1 mmol/kg DOTAREM (Guerbet, Villepinte, France) or 0.1 mmol/kg ProHance (Bracco, Milan, Italy) contrast agent was used.
Images were acquired on 14 different MRI scanners (GE MR450, GE MR750w, GE SIGNA EXCITE, GE Signa HDxt, Philips Ingenia, Philips Achieva, Philips Ingenia, Philips Intera, Siemens Aera, Siemens Avanto, Siemens Espree, Siemens Prisma_fit, Siemens Skyra, Siemens SymphonyTim) at either 1.5 or 3 T. The range (min-max) of image acquisition parameters were as follows, and listed in full for each DWI examination in Table 2 and Table 3: T1w (TE 1.7–18 ms, TR 5–2200 ms, slice thickness 1–5 mm, slice gap (mm) 0.5–6.5 mm, in-plane voxel size 0.4–1.0 mm) and DWI (b-values 0 and 1000 s/mm2) TE 55–115 ms, TR 2660–12,025 ms, slice thickness 2.5–5 mm, slice gap (mm) 0–0.5 mm, in-plane voxel size 0.6–2.5 mm). Both gradient echo and fast spin echo based sequences were used at different sites to acquire the T1-weighted images.
T1CE tumour volumes of interest were outlined at baseline, after 2 cycles of MATRix and after 4 cycles of MATRix using ITK SNAP Toolbox Version 3.6.0 [18] (www.itksnap.org; Philadelphia, PA, USA), by a neuroimaging student (IC) blinded to IPCG response assessments, covering the entire post-contrast T1 signal abnormality on axial views. All segmentations were supervised and, where necessary, optimised by a neuroradiologist specialised in oncology (ST, 11 years’ experience). Post-treatment scans following 2 cycles and 4 cycles of chemotherapy were segmented side by side, comparing pre- and post-contrast images in order to avoid segmentation of non-enhancing T1 hyperintense tissue (T1 shortening). T1CE tumour volumes (cm3) were calculated and their mean and standard deviation parameters generated. The absolute change in tumour volume was calculated (=volume after 2 cycles of MATRix–baseline volume) as well as the percentage (%) change in tumour volume (=change in tumour volume/baseline volume in %).
ADC maps were calculated from 3-directional DWI acquired with 2 gradient values (b0 and b1000 s/mm2) using proprietary software (Olea Sphere, version 2.3, Olea Medical, La Ciotat, France). In the generation of an ADC map, the image acquired without diffusion gradients is divided by the image acquired with diffusion gradients and the natural logarithm is taken, removing dependence on T1, T2 and TR [19]. Sufficient comparability of ADC between scanners has been demonstrated previously [20]. Registration to ADC maps was performed using the FSL FLIRT toolbox (Linear Image Registration Tool, used for inter- and intra-modal registration [21,22]. A rigid transformation with either a 12 or 6 parameter model and Normalized Mutual Information as the cost function. The quality of the image registration was assessed visually by a neuroradiologist. In cases where the 6-parameter model did not result in a good spatial alignment, a 12-parameter model was used. This resulted in good alignment in all cases. Through this process, ADC of the tumour corresponding to the entire T1CE lesion was generated. We extracted the ADC value of every voxel within the ROI. Subsequently, ADC histogram data were obtained for each tumour region of interest, using an in-house script written in Python 2.7. We then calculated statistics from this histogram for each tumour, including the 2nd, 25th, 50th and 75th ADC percentiles. From the measurable histogram data, the mean ADC value (ADCmean) and cumulative parameters including the 2nd (ADCmin) and 25th (ADC25th) percentiles prior to treatment (‘baseline’) and after 2 cycles of treatment (‘early’) were used. Our hypothesis was that we would see reduced ADC at baseline in non-responses so we evaluated the minimum and lower percentiles of this histogram. Consistent with recommendations from other MRI analysis software packages such as FSL, we noticed that the raw ADCmin was susceptible to outliers so used the 2nd centile ADC as a proxy of the minimum. From here on, ADCmin = 2nd percentile ADC. Using these values change in ADC (ADCchange = ADC after 2 cycles of MATRix–ADC at baseline) and percentage ADC change (= ADCchange/baseline ADC) were calculated. ADC values are reported as 100 × 10−6 mm2/s.

2.3. Consensus Response Evaluation

All imaging was analysed in an anonymised format, blinded to tumour volumes and ADC measurements, by two board-certified neuroradiologists (AAB with 6 years of experience and ST with 11 years of experience in MR brain imaging). By consensus, categorical outcomes were specified according to the radiological criteria as defined by the International PNCSL Collaborative Group. Outcome was assessed at two time points as follows: early during treatment (after 2 cycles of MATRix) and on completion of chemotherapy (after 4 cycles of MATRix). All imaging studies following completion of treatment were carried out within one month of chemotherapy cessation.
To facilitate statistical analysis and to be consistent with prior research [4,23,24], radiological outcomes were grouped into three response categories. All complete response (CR, no residual lesion enhancement) and unconfirmed complete response (CRu, minimal enhancement) patients formed the ”complete response” category (Group 0). The next group comprised all patients who showed a partial response (Group 1), defined as >50% reduction in the size of enhancing lesion(s), but not meeting criteria for CR/CRu. Group 2 comprised patients who lacked response, either in the form of stable disease (SD) or progressive disease (PD). Example images for the three different response groups are shown in Figure 2.

2.4. Statistical Analysis

All analyses were performed using Statistical Package for the Social Sciences version 25 (IBM SPSS 25, Chicago, IL, USA). Using the Wilcoxon non-parametric test, multiple comparison analysis was performed to identify whether the response assessment after 2 cycles of MATRix could qualitatively predict the response assessment after completion of MATRix.
One-way analysis of variance (ANOVA) with post hoc analysis using the least significant difference method was carried out to confirm whether differences seen between groups are unlikely due to random chance. For this, we evaluated the tumour volume at baseline, absolute and percentage change in tumour volume, baseline ADCmin (2nd centile), baseline ADCmean, baseline ADC25th, ADCmin change, ADCmean change and ADC25th change. Each of the (continuous variable) quantitative metrics were statistically tested against the three outcomes (0 = CR/CRu, 1 = PR, 2 = SD/PD) following completion of treatment.
Univariate multinomial logistic regression was then used to test the tumour volume and ADC parameters as predictors of response assessment after completion of treatment. Significant (p < 0.05) predictors identified by univariate analysis were then combined and tested in a multivariate logistic regression model for prediction of response. A two-sided p value was used with results of p < 0.05 considered statistically significant.

3. Results

3.1. Overview

Thirty-eight patients met criteria for inclusion in the study. By the IPCG standard assessment, 20 patients were classified as “Group 0” (complete response), 12 patients as “Group 1” (partial response or stable disease) and 6 patients as “Group 2” (non-responders).

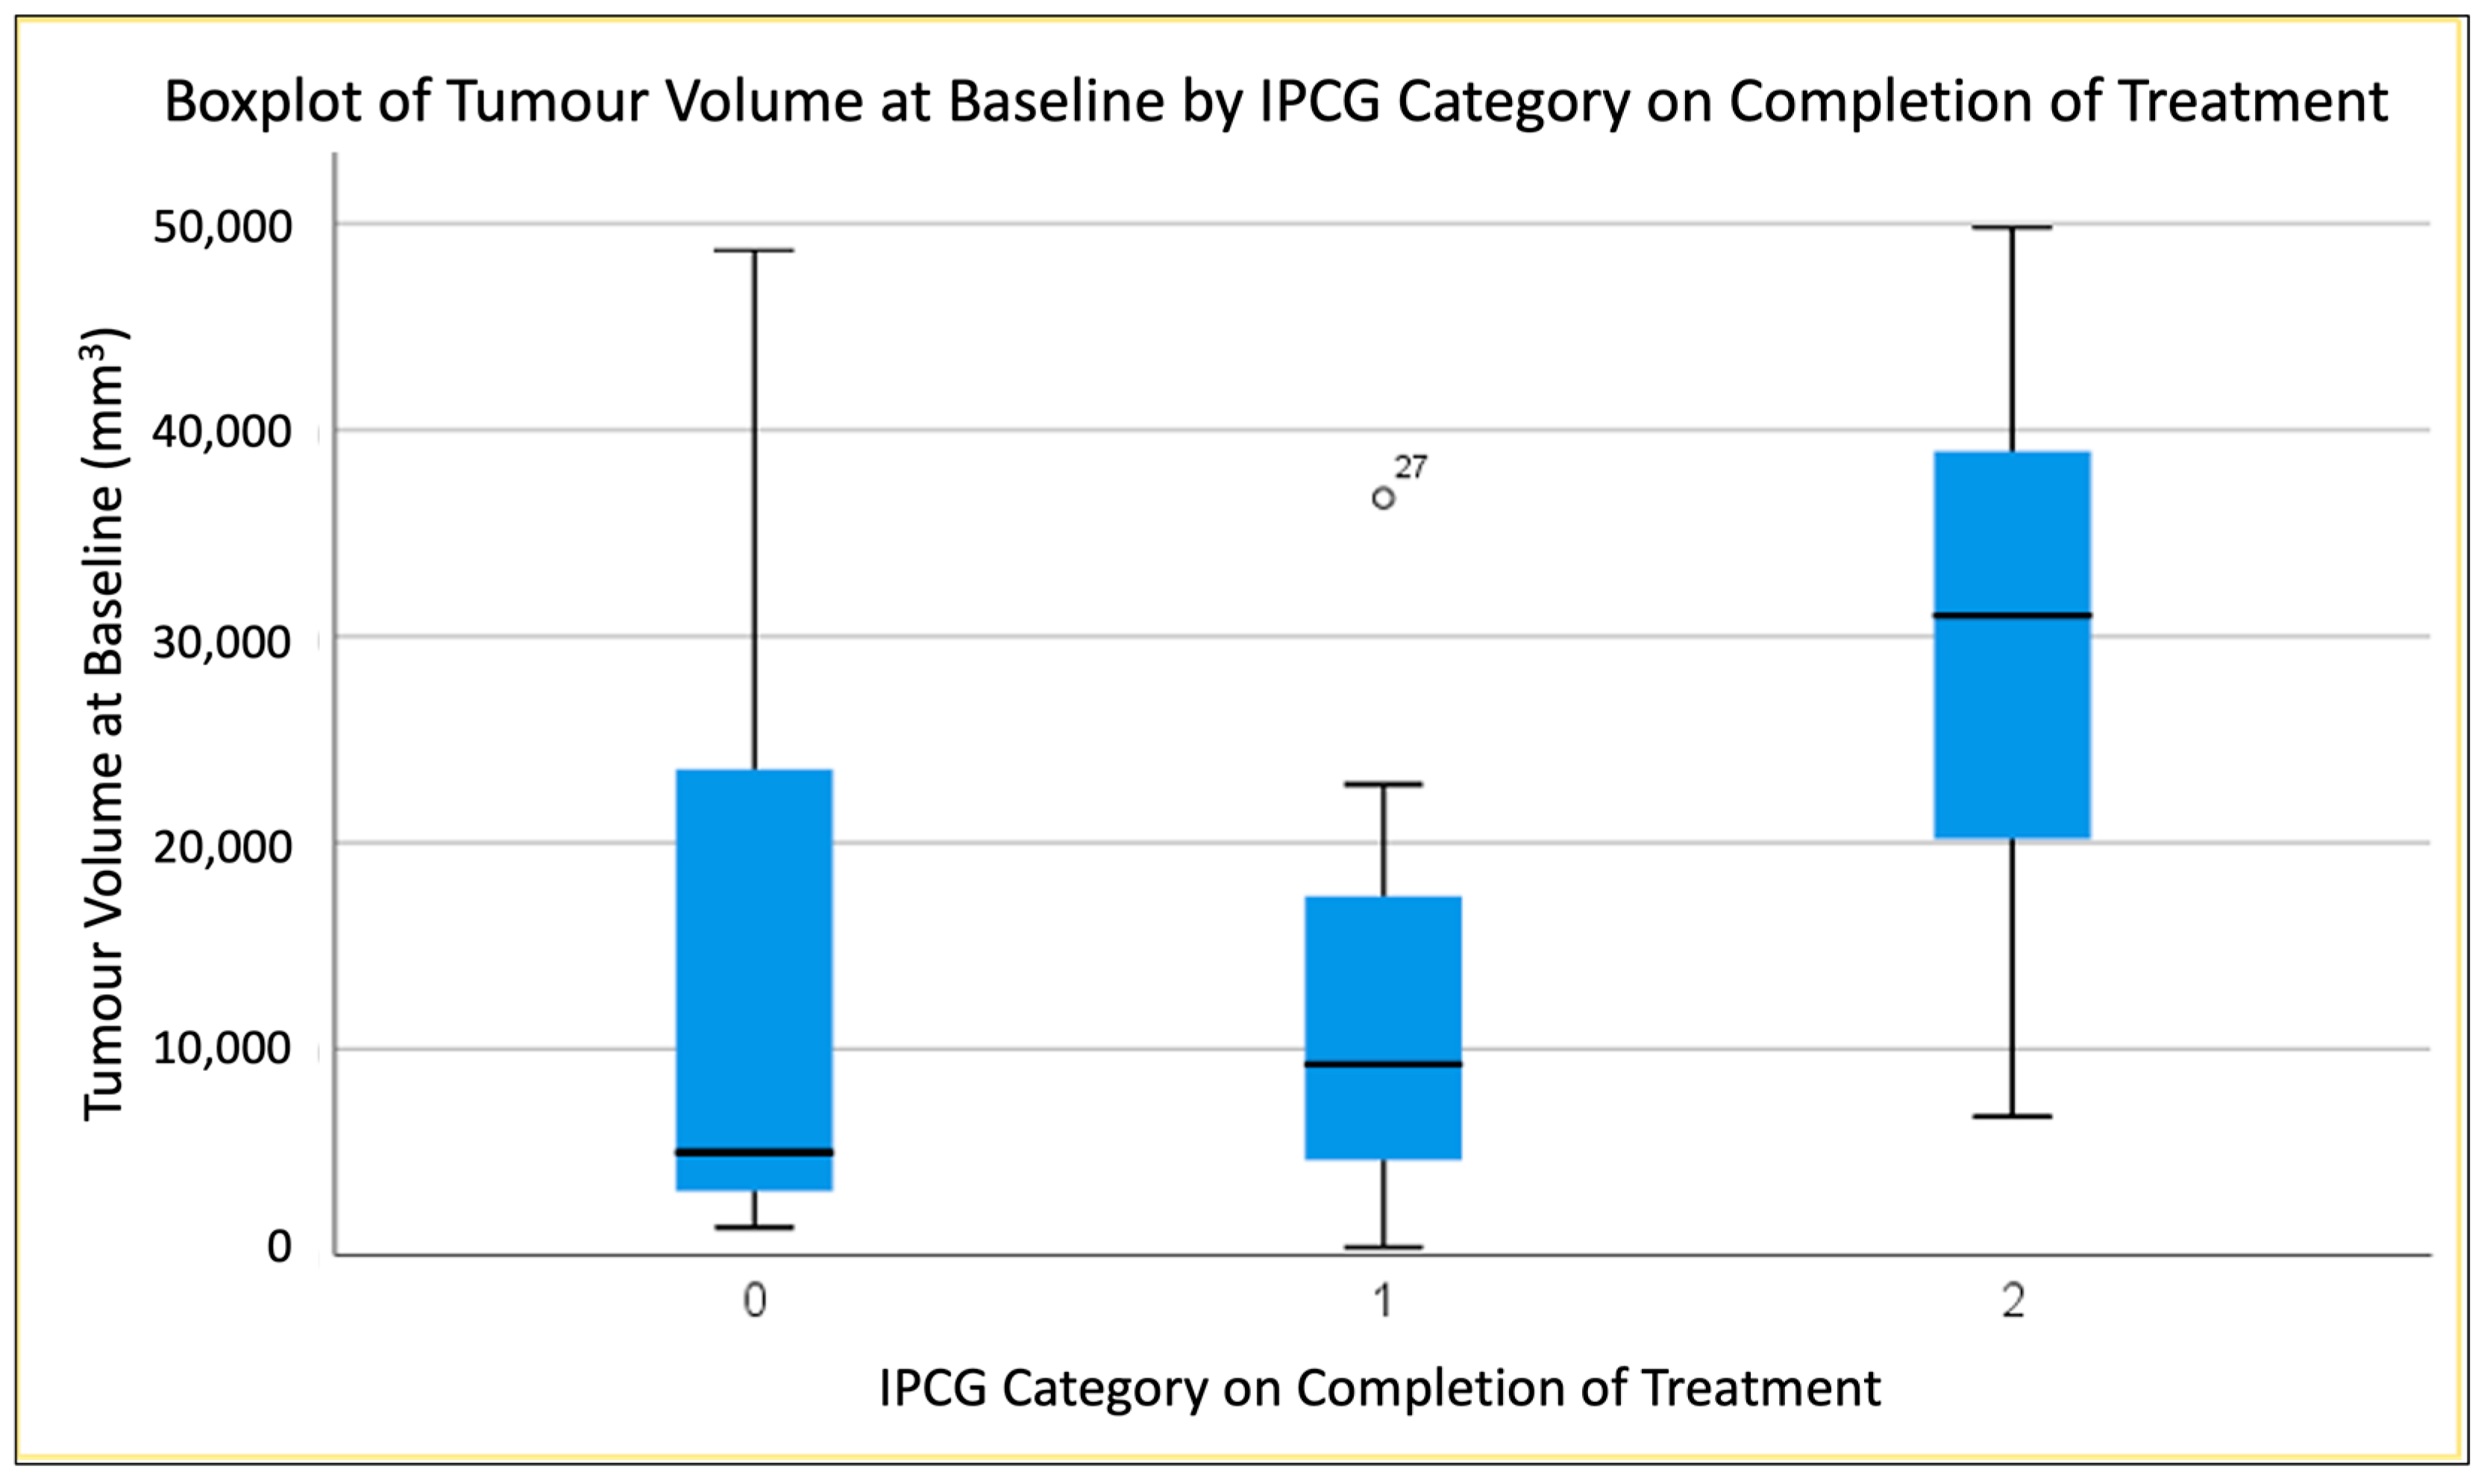
3.2. Predicting End of Treatment Response by T1CE Baseline Tumour Volume

T1CE tumour volume at baseline significantly differed amongst response groups 0, 1 and 2 (Figure 3). ANOVA testing showed that Group 2 had statistically significant larger tumour volumes at baseline compared to Group 0 (p < 0.020) and compared to Group 1 (p < 0.014). There was no significant difference in baseline tumour volume between Group 0 and Group 1. In one patient, T1 shortening due to macroscopic haemorrhage was present at baseline, but no pre-contrast axial imaging was available for segmentation. Therefore, both pre- and post-contrast segmentations were performed on coronal T1 sequences to optimise volume of interest placements. The pre-contrast segmentations were then subtracted from the post-contrast segmentations to remove haemorrhage from the tumour, enhancing volume calculation.

3.3. Predicting End of Treatment Response by T1CE Percentage Volume Change (Baseline to 2 MATRix Cycles)

There was a borderline significant difference in change in absolute tumour volume from baseline to the completion of two treatment cycles between Group 1 and Group 2, with a smaller reduction in T1CE volume in non-responders (p < 0.047). Percentage (%) change in T1CE volume differed between the groups: There was a greater % reduction in tumour volume in Group 0 compared to Group 1 (p < 0.018) and to Group 2 (p < 0.011). No significant difference in % change in T1CE tumour volume was found between groups 1 and 2 (p < 0.499).

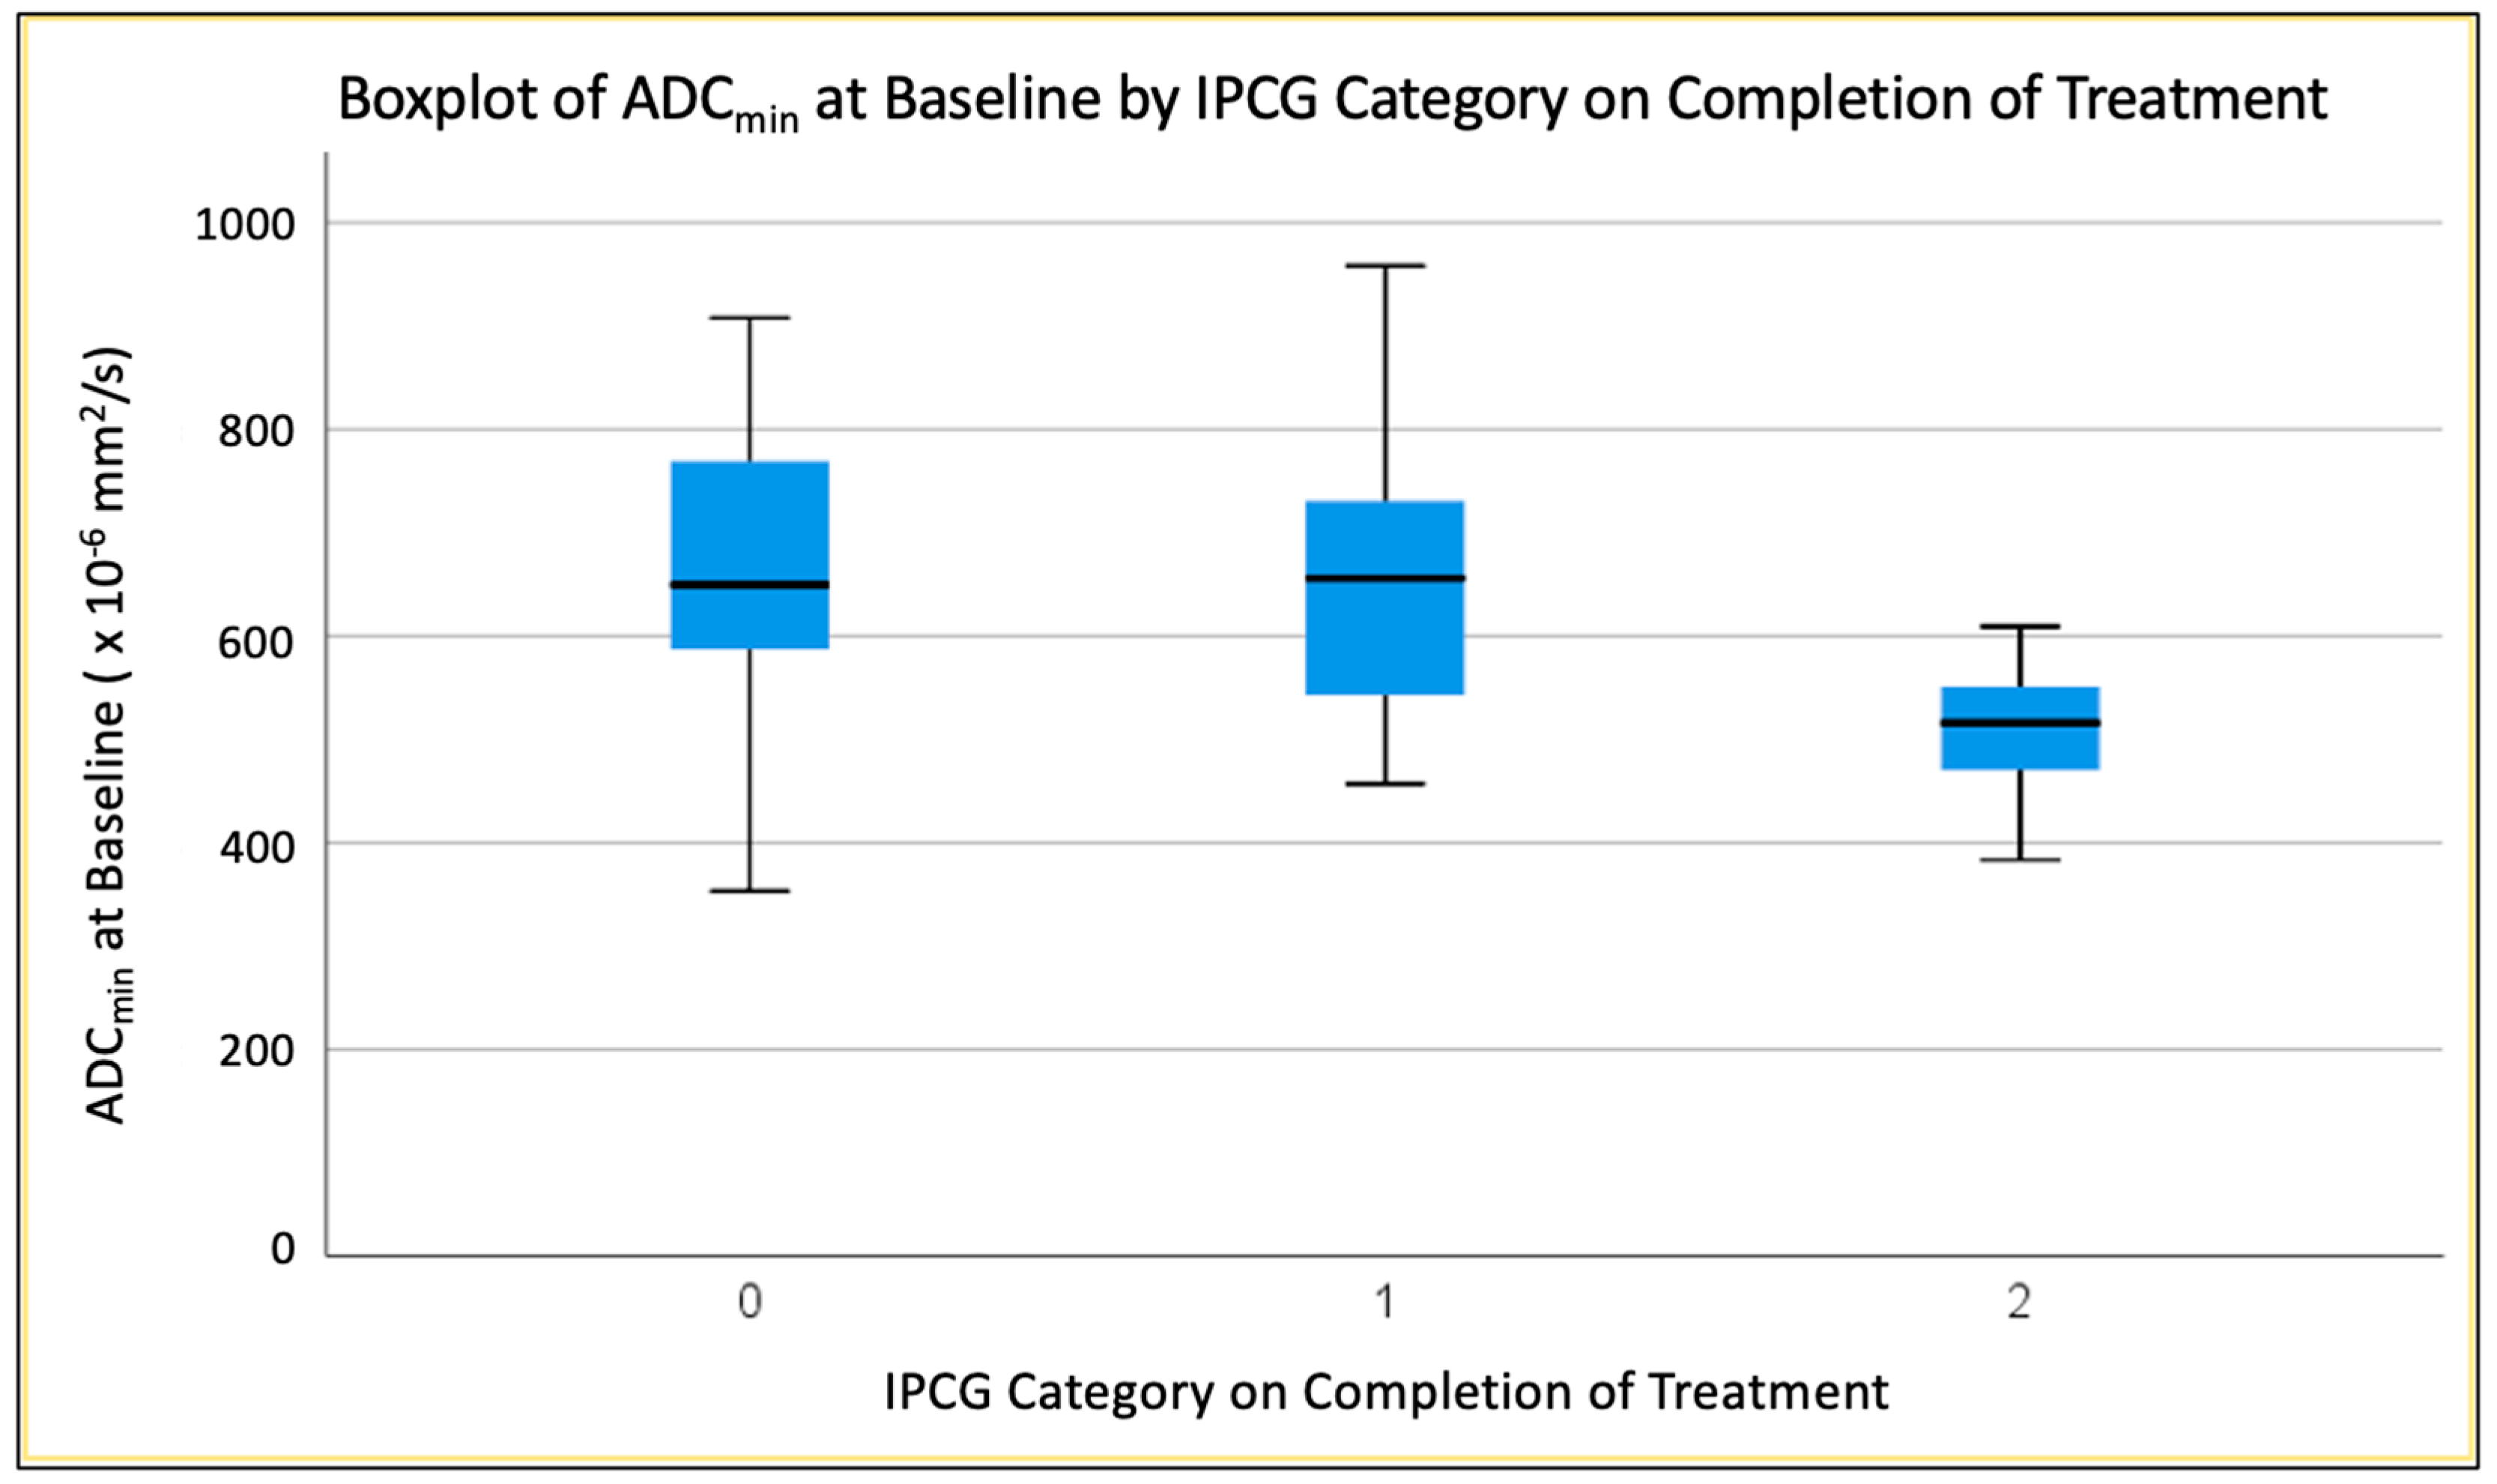
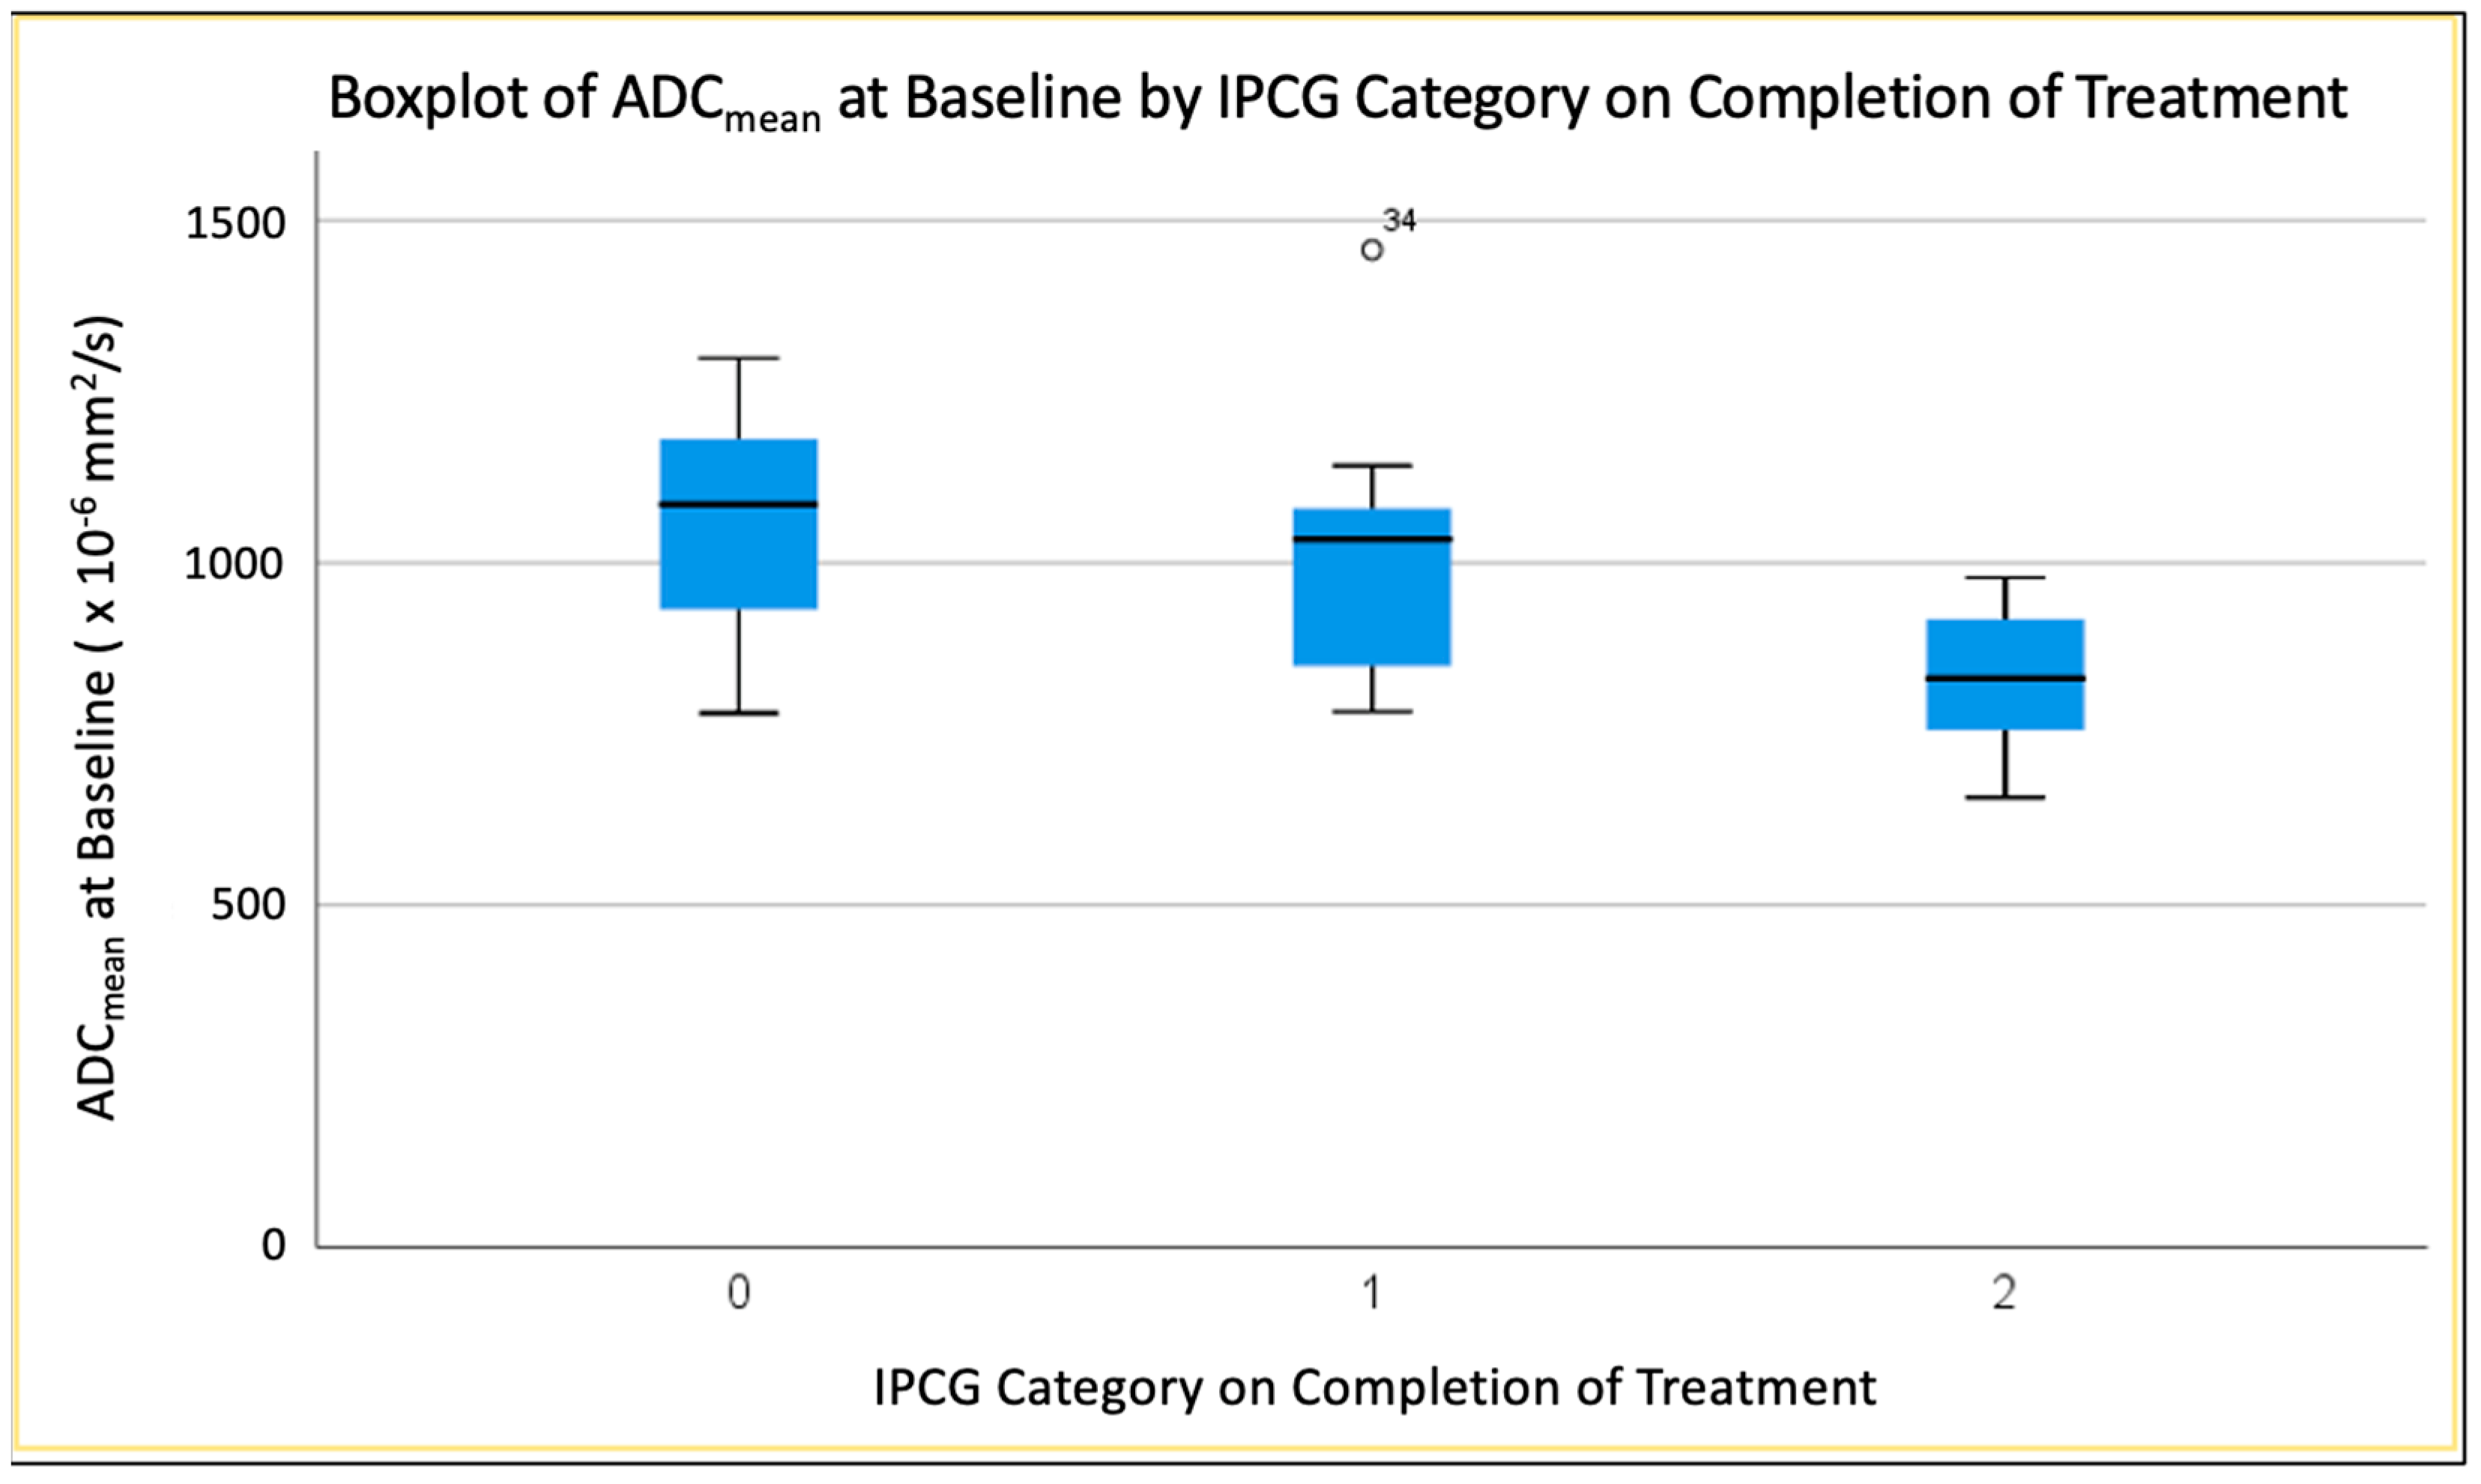
3.4. Predicting End of Treatment Response by ADC Values at Baseline

ADC values at baseline varied across groups, from largest values for the complete response group to smallest values for the progressive disease group.

3.4.1. Second-Percentile ADC (ADC2nd) at Baseline

There was a significant difference in second-percentile ADC at baseline between groups 0 and 2 (p < 0.013) and between groups 1 and 2 (p < 0.031), with lower ADC values corresponding to less response (Figure 4). No significant difference in second-percentile ADC at baseline was evident between complete response (0) and partial (1) response groups (p < 0.410).

3.4.2. Twenty-Fifth-Percentile ADC (ADC25th) at Baseline

There was a significant difference in this parameter between the complete response (0) and progressive disease (2) groups (p < 0.011) and also between partial response (1) and complete response groups (0) (p < 0.0032) with lower ADC values corresponding to less response. There was no significant difference between complete response and partial response groups (p < 0.719).

3.4.3. Mean ADC (ADCmean) at Baseline

The most strongly significant difference was in ADCmean at baseline between complete response (0) and progressive disease (2) groups (p < 0.005) (Figure 5). There was also a significant difference in ADCmean at baseline between partial response (1) and progressive disease (2) groups (p < 0.038). There was no significant difference in this parameter between complete response and partial response groups (p < 0.410).

3.5. Radiologist Early (after 2 Cycles) Compared to Later (after 4 Cycles) Assessment by IPCG Criteria

Response by IPCG criteria after two cycles of MATRiX chemotherapy differed significantly from response after four cycles (Wilcoxon p = 0.023), whereby 33% patients (n = 2) with progressive disease on MATRix therapy completion had initially shown complete or partial response after two cycles.

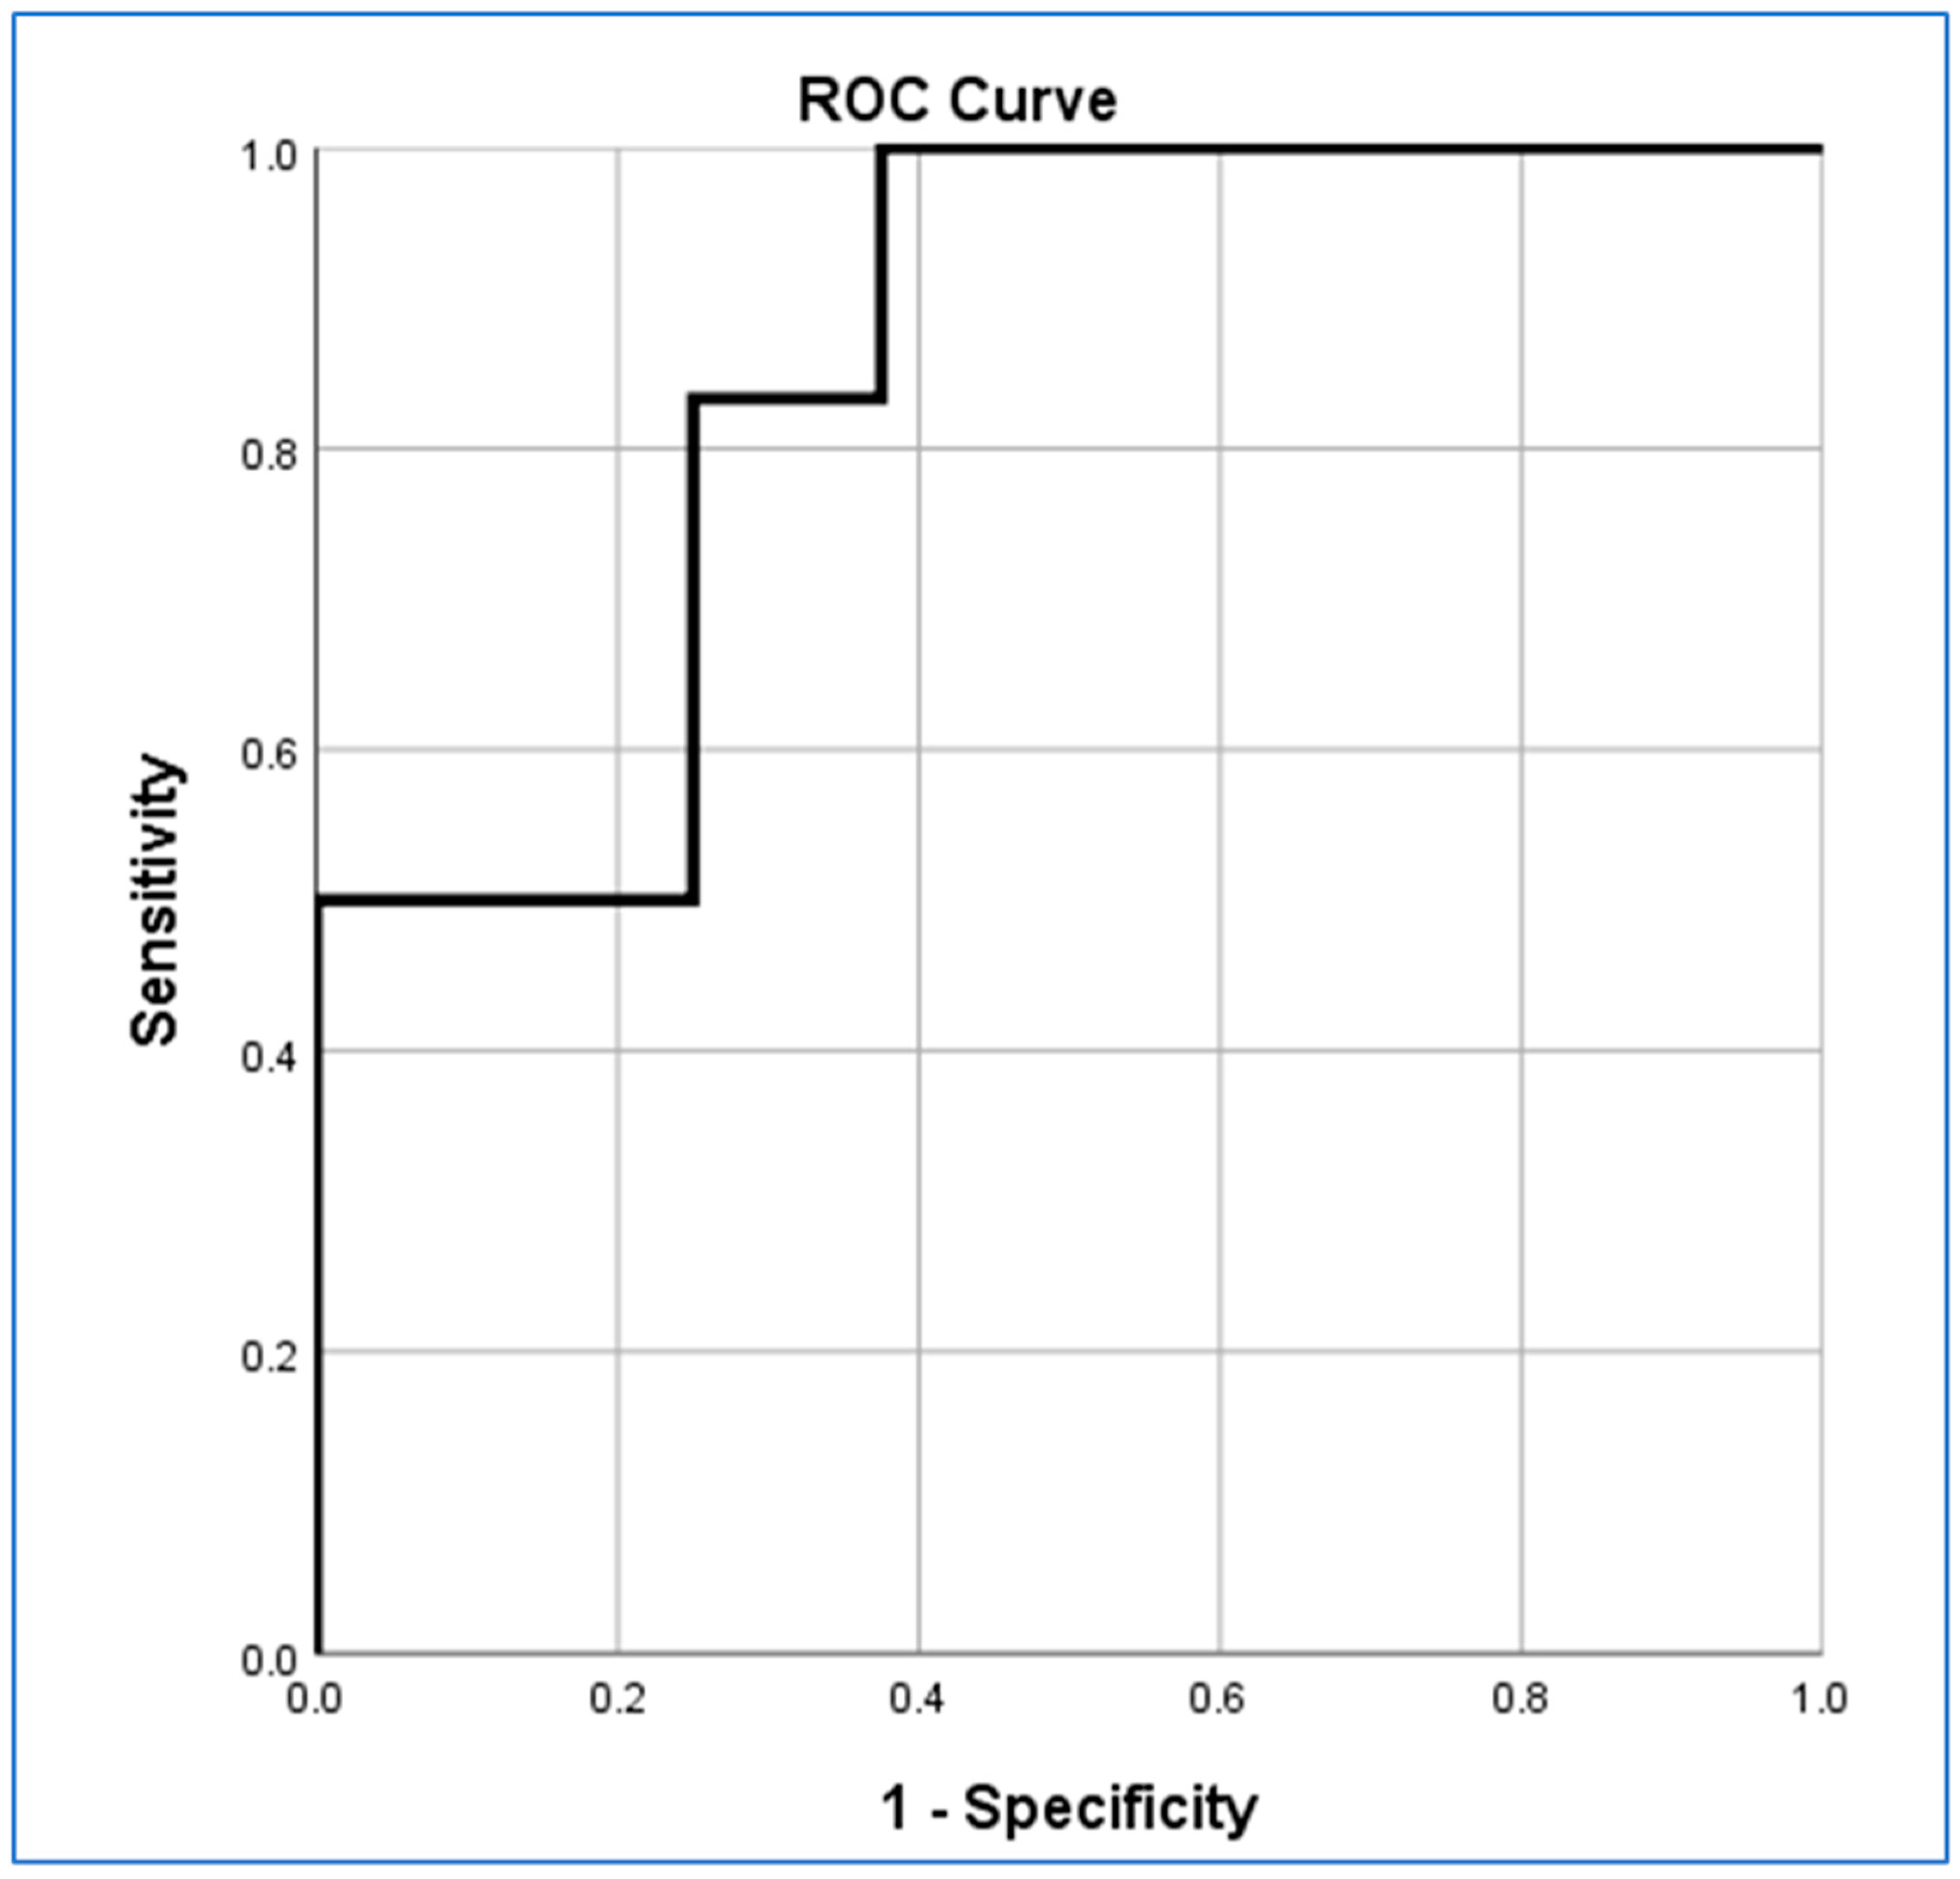
3.6. Logistic Regression

Univariate multinomial logistic regression to test T1CE tumour volume at baseline as a biomarker of response showed moderately good IPCG category prediction at the end of four cycles’ treatment (p < 0.042) but did not predict response after two cycles of treatment (p < 0.647). The area under the Receiver Operator Characteristics (ROC) curve (AUC) for prediction at 4 weeks was 0.828.
Regression to test % change in T1CE tumour volume showed that this parameter is a predictor of outcome after two cycles of treatment (p = 0.025) and after four cycles of treatment (p = 0.016). However, the AUC for this parameter was lower (0.672) than using baseline T1 volume for predictions.
ADCmean at baseline was the strongest predictor of IPCG response at the end of four cycles’ treatment (p < 0.017, AUC 0.854; Figure 6) amongst the parameters tested but, interestingly, this did not predict response after two cycles of treatment (p < 0.414).
There was no accuracy improvement derived from combining the individual predictive parameters in a multivariate logistic regression model for prediction of IPCG-categorised radiological response.

4. Discussion

In this study, we aimed to identify quantifiable biomarkers predictive of PCNSL response after completion of MATRix chemotherapy. The research was undertaken using clinical MRI data from two large UK centres with specialist lymphoma services.
Contrast-enhancing tumour percentage change estimation represents the international standard by which PCNSL response is recorded using semi-quantitative IPCG criteria [1]. The limitations of two-dimensional response approximation in brain tumours have been widely acknowledged [25]. Moreover, the value of serial tumour volumetry has been recognised, for example, in gliomas [26,27], and is deemed to be more accurate particularly for non-spherical lesions, and the latest IPCG guidelines recommend volumetric T1CE in all patients with (suspected) PCNSL [10].
In our dual-centre patient cohort, we observed that PCNSL baseline T1CE lesion volumes differ between IPCG response groups with larger tumour volumes observed in individuals non-responsive to MATRix after the completion of four cycles (p < 0.02). This finding can be explained by the more extensive intracranial disease load, which may exacerbate limitations to chemo agent penetration through the blood–brain barrier [28]. The group differences appeared greater when assessing baseline tumour volumes than when calculating dynamic % changes in tumour volumes between baseline and end of cycle 2 (weakly significant p < 0.047).
A recent study using T1-weighted dynamic contrast-enhanced perfusion MRI identified higher values of permeability metrics (Ktrans, Ve) predictive of poor response when measured at baseline and when assessing change early during combination chemotherapy for PCNSL [29]. Despite the MRI sequence differences, it is noteworthy that for both modalities the result trends are similar, with greater T1-weighted abnormalities indicating non-response. No further results on T1CE-based PCNSL response prediction were identified in a dedicated literature search.
In this study, baseline T1CE total tumour volume predicted PCNSL response as assessed by IPCG criteria upon completion of four MATRix cycles (p < 0.042, AUC 0.828). This observation could be valuable in identifying patients prone to suboptimal therapy outcome. Furthermore, differential response data could potentially inform the design of future multicentre PCNSL trials to test new treatment strategies (https://clinicaltrials.gov/ct2/show/NCT049313680, accessed on 15 May 2023). Percentage change in T1CE tumour volume predicted MATRix response at 2 weeks (p < 0.025) and following completion of treatment (p < 0.016); however, this result was less exact (0.672) compared to baseline volume-derived outcome prediction.
Low ADCmin, ADCmean and ADCmax values have been shown to reflect a high cellularity and proliferative activity in PCNSL patients [30]. Our research identified differences in baseline diffusivity between MATRix response groups, particularly in ADCmean between complete responders and non-responders (p < 0.005) and between partial response (1) and progressive disease (2) groups (p < 0.038). ADCmean at baseline seemed marginally superior to T1CE baseline tumour volume as the most accurate predictor of IPCG response (p < 0.017, AUC 0.854). The value of ADC measurements for the characterisation of PCNSL has been highlighted numerous times, most commonly in the context of differential diagnosis [31,32,33], and ADC has long been recognised as potentially valuable for brain tumour response assessment generally [34,35].
The first study to assess ADC values in association to outcome in (methotrexate-only) chemotherapy for PCNSL was by Barajas et al. [23]. In this research, all (n = 18) patients in the high-ADC group at baseline showed complete remission. Baseline minimum ADC (p < 0.01), 25th-percentile ADC (p < 0.01) and mean ADC (p = 0.02) values were significantly lower for seven patients who showed only partial response or progressive disease after completion of treatment. Similar to our results, Barajas proposed that baseline ADC values could predict clinical response following induction chemotherapy. Subsequently, Wieduwilt and colleagues [24] measured pre-treatment minimum ADC for a correlate to survival in patients (n = 23) undergoing induction with methotrexate, temozolomide and rituximab followed by consolidation with etoposide and cytarabine. In this study, patients in the low-ADC group had a shorter median progression-free survival (PFS) (p = 0.007), and restricted diffusion (defined as minimum ADC < 384 × 10−6 mm2/s) signified shorter OS (p = 0.003). The authors suggested that tumour ADC values were a better prognostic factor than clinical data (e.g., performance scores).
Similar to our results, a study by Valles et al. with 25 patients identified low ADC values as predictive of unfavourable outcome when analysing PCNSL response by survival [36]. In this study, patients with minimum ADC values < 384 × 10−6 mm2/s had worse PFS and overall survival (OS). Contrary to our data, Valles identified no relationship between contrast-enhancing lesion size and PFS or OS. The therapeutic approach in this study also slightly differed to ours with patients receiving a combination of methotrexate, temozolomide and rituximab therapy for PCNSL. Our analysis did not assess image parameters for prediction of survival, and it is noteworthy that response defined by IPCG criteria may not necessarily be an accurate measure of long-term patient outcome [9]. In a later study, Huang et al. examined pre-treatment tumour diameter for prediction of chemotherapy response (methotrexate and idarubicin, n = 35) [4]. The authors of this study found that pre-treatment minimum ADC in the progressive disease group was lower than that in the complete response and partial response groups. Huang et al. also observed that minimum ADC after one cycle and minimum ADC changes were better correlated with the treatment response than the pre-treatment minimum ADC, which slightly differs from our results.
In a different cohort of PCNSL patients receiving methotrexate-only chemotherapy (n = 28), Zhang et al. assessed the ability of baseline ADC parameters to distinguish between patients with complete and partial response [11]. Fifth-percentile and mean ADC values significantly differed response groups after four methotrexate cycles, with fifth-percentile (AUC 0.983) superior to mean ADC values (0.822).
The combination of study data, despite some variations in treatment regimen and parameters analysed, suggests that ADC metrics are likely to be a valuable biomarker predictive of outcome in PCNSL. To the authors’ knowledge, no previous research has assessed clinical imaging parameters in patients receiving MATRix chemotherapy, a treatment regimen which became standard in 2016 [6]. Therefore, the literature context includes studies assessing MRI parameters in patients receiving methotrexate therapy, either alone or in combination with other chemotherapy agents (rituximab, temozolomide or idarubicin) as described. Given the toxicity of these treatment regimens, including early (mostly infectious) complications which occur in up to 28% of patients [7] and diminished therapeutic success, early predictions of response may reduce overtreatment and/or side effects.
Limitations of the previous studies and ours are small patient numbers with PCNSL being a rare disease. As a multi-center clinical study, there was also heterogeneity in image acquisition, with studies acquired on both 3T and 1.5T MRI systems with different parameters. It has been shown that diffusion MRI parameters for clinical sequences in the brain, including ADC, are robust across different scanner systems, including those of different field strengths [20]. In addition, for texture analysis of MRI of brain tumours, there is a real risk of overfitting when using limited and uniform image data, and multi-center and multi-vendor image data is now encouraged [37].
A further limitation of this study arises from the imperfection of the IPCG reference standard, which may not consistently translate into survival differences. However, because assessment by IPCG criteria represents the basis for PCNSL trial decisions worldwide, it was deemed the most suitable short-term outcome reference.
Manual tumour segmentation is time-consuming and can be limited by intra- and inter-rater variabilities, also a potential limitation in our study. That said, in a previous study by our group on patients with WHO grade 2/3 gliomas, we found high reproducibility of region of interest ADC parameters and contrast-enhancement patterns among 3 independent raters (intraclass correlation coefficient = 0.83–0.96 and Cohen k = 0.69–0.72, respectively) [38]. We note similar methodologies have been applied in comparable studies (for example [39]) and it has also been shown in head and neck squamous cell carcinoma that ADC values can be reproducibly obtained by different radiologists pre- and post-chemoradiotherapy [40]. Nevertheless, development of automated software tools based on deep learning may improve the consistency of tumour delineation. Promisingly, a 3-dimensional convolutional neural network trained on gliomas has been found to be able to provide automatic segmentations of PCNSL tumours comparable to manual segmentation [41].
This study makes an important knowledge contribution through identification of possible T1CE and ADC biomarkers, which may predict response to MATRix at baseline. Longer-term follow up is planned to clarify in how far the candidate biomarkers relate to overall survival. Computational analysis of image data [31,42] could be explored as an adjunct for image-based outcome predictions though this would ideally benefit from large data sets for training.

5. Conclusions

The data from this study indicate a potential role for volumetric T1CE and ADC measurements as biomarkers predictive of response to MATRix chemotherapy, a recently adopted standard-of-care regimen for newly diagnosed PCNSL. Contrast-enhanced and diffusion parameters appeared similarly accurate when assessed at baseline. This research was conducted using widely adopted MRI brain protocols with a method that could be suitable for clinical translation.

Author Contributions

Conceptualization, K.C., C.P.F. and S.C.T.; data curation, I.C., N.M.-C. and E.P.; formal analysis, I.C., A.A.B., S.W. and S.C.T.; methodology, S.W. and S.C.T.; software, S.W.; writing—original draft, M.A. and S.C.T.; writing—review and editing, M.A., J.M. and S.C.T. All authors have read and agreed to the published version of the manuscript.

Funding

No grant-specific funding applies to this work. University College London/UCL Hospitals receive a proportion of funding from the NIHR Biomedical Research Centre.

Institutional Review Board Statement

Ethical approval for this study was granted by our local institutional review board and the UK Health Research Authority (IRAS 218180).

Informed Consent Statement

Patient consent was waived due to the retrospective nature of the study involving anonymised data analysis only.

Data Availability Statement

The data presented in this study are available on request from the corresponding author. The data are not publicly available due to ongoing research studies.

Acknowledgments

The authors would like to thank Pauline Rootkin for help with data preparation.

Conflicts of Interest

The authors declare no conflict of interest.

References

  1. Abrey, L.E.; Batchelor, T.T.; Ferreri, A.J.M.; Gospodarowicz, M.; Pulczynski, E.J.; Zucca, E.; Smith, J.R.; Korfel, A.; Soussain, C.; DeAngelis, L.M.; et al. Report of an International Workshop to Standardize Baseline Evaluation and Response Criteria for Primary CNS Lymphoma. J. Clin. Oncol. 2005, 23, 5034–5043. [Google Scholar] [CrossRef]
  2. Brandão, L.A.; Castillo, M. Lymphomas–Part 1. Neuroimaging Clin. N. Am. 2016, 26, 511–536. [Google Scholar] [CrossRef]
  3. Dandachi, D.; Ostrom, Q.T.; Chong, I.; Serpa, J.A.; Giordano, T.P.; Kruchko, C.; Barnholtz-Sloan, J.S.; Fowler, N.; Colen, R.R.; Morón, F.E. Primary Central Nervous System Lymphoma in Patients with and without HIV Infection: A Multicenter Study and Comparison with U.S National Data. Cancer Causes Control 2019, 30. [Google Scholar] [CrossRef]
  4. Huang, W.Y.; Wen, J.B.; Wu, G.; Yin, B.; Li, J.J.; Geng, D.Y. Diffusion-Weighted Imaging for Predicting and Monitoring Primary Central Nervous System Lymphoma Treatment Response. Am. J. Neuroradiol. 2016, 37, 2010–2018. [Google Scholar] [CrossRef] [PubMed] [Green Version]
  5. Phillips, E.H.; Fox, C.P.; Cwynarski, K. Primary CNS Lymphoma. Curr. Hematol. Malig. Rep. 2014, 9, 243–253. [Google Scholar] [CrossRef] [Green Version]
  6. Ferreri, A.J.M.; Cwynarski, K.; Pulczynski, E.J.; Ponzoni, M.; Deckert, M.; Politi, L.S.; Torri, V.; Fox, C.P.; Rosée, P.L.; Schorb, E.; et al. Chemoimmunotherapy with Methotrexate, Cytarabine, Thiotepa, and Rituximab (MATRix Regimen) in Patients with Primary CNS Lymphoma: Results of the First Randomisation of the International Extranodal Lymphoma Study Group-32 (IELSG32) Phase 2 Trial. Lancet Haematol. 2016, 3, e217–e227. [Google Scholar] [CrossRef] [PubMed] [Green Version]
  7. Schorb, E.; Fox, C.P.; Kasenda, B.; Linton, K.M.; Martinez-Calle, N.; Calimeri, T.; Ninkovic, S.; Eyre, T.A.; Cummin, T.; Smith, J.; et al. Induction Therapy with the MATRix Regimen in Patients with Newly Diagnosed Primary Diffuse Large B-Cell Lymphoma of the Central Nervous System—an International Study of Feasibility and Efficacy in Routine Clinical Practice. Br. J. Haematol. 2020, 189, 879–887. [Google Scholar] [CrossRef]
  8. Langner-Lemercier, S.; Houillier, C.; Soussain, C.; Ghesquières, H.; Chinot, O.; Taillandier, L.; Soubeyran, P.; Lamy, T.; Morschhauser, F.; Benouaich-Amiel, A.; et al. Primary CNS Lymphoma at First Relapse/Progression: Characteristics, Management, and Outcome of 256 Patients from the French LOC Network. Neuro. Oncol. 2016, 18, 1297–1303. [Google Scholar] [CrossRef] [PubMed] [Green Version]
  9. Van Der Meulen, M.; Postma, A.A.; Smits, M.; Bakunina, K.; Minnema, M.C.; Seute, T.; Cull, G.; Enting, R.H.; Van Der Poel, M.; Stevens, W.B.C.; et al. Extent of Radiological Response Does Not Reflect Survival in Primary Central Nervous System Lymphoma. Neuro-Oncol. Adv. 2021, 3. [Google Scholar] [CrossRef]
  10. Barajas, R.F.; Politi, L.S.; Anzalone, N.; Schöder, H.; Fox, C.P.; Boxerman, J.L.; Kaufmann, T.J.; Quarles, C.C.; Ellingson, B.M.; Auer, D.; et al. Consensus Recommendations for MRI and PET Imaging of Primary Central Nervous System Lymphoma: Guideline Statement from the International Primary CNS Lymphoma Collaborative Group (IPCG). Neuro. Oncol. 2021, 23, 1056–1071. [Google Scholar] [CrossRef]
  11. Zhang, Y.; Zhang, Q.; Wang, X.X.; Deng, X.F.; Zhu, Y.Z. Value of Pretherapeutic DWI in Evaluating Prognosis and Therapeutic Effect in Immunocompetent Patients with Primary Central Nervous System Lymphoma given High-Dose Methotrexate-Based Chemotherapy: ADC-Based Assessment. Clin. Radiol. 2016, 71, 1018–1029. [Google Scholar] [CrossRef]
  12. Guo, A.C.; Cummings, T.J.; Dash, R.C.; Provenzale, J.M. Lymphomas and High-Grade Astrocytomas: Comparison of Water Diffusibility and Histologic Characteristics. Radiology 2002, 224, 177–183. [Google Scholar] [CrossRef]
  13. Lu, S.S.; Kim, S.J.; Kim, N.; Kim, H.S.; Choi, C.G.; Lim, Y.M. Histogram Analysis of Apparent Diffusion Coefficient Maps for Differentiating Primary CNS Lymphomas from Tumefactive Demyelinating Lesions. Am. J. Roentgenol. 2015, 204, 827–834. [Google Scholar] [CrossRef] [PubMed]
  14. Stuart, C.; Rabiei, P.; LugoAndrea Lugo, A.; Arevalo, O.; Ocasio, L.; Syed, M.; Riascos, R.; Zhu, J.-J.; Cai, C.; Kamali, A. Use of Quantitative Diffusion-Weighted MR Imaging (DWI) in Differentiating between Glioblastoma and Primary Central Nervous System Lymphoma in Real-Time Exam Interpretation. Neurol. Neurosurg. 2019, 2. [Google Scholar] [CrossRef]
  15. Lin, X.; Lee, M.; Buck, O.; Woo, K.M.; Zhang, Z.; Hatzoglou, V.; Omuro, A.; Arevalo-Perez, J.; Thomas, A.A.; Huse, J.; et al. Diagnostic Accuracy of T1-Weighted Dynamic Contrast-Enhanced-MRI and DWI-ADC for Differentiation of Glioblastoma and Primary CNS Lymphoma. AJNR. Am. J. Neuroradiol. 2017, 38, 485–491. [Google Scholar] [CrossRef]
  16. Louis, D.N.; Perry, A.; Reifenberger, G.; von Deimling, A.; Figarella-Branger, D.; Cavenee, W.K.; Ohgaki, H.; Wiestler, O.D.; Kleihues, P.; Ellison, D.W. The 2016 World Health Organization Classification of Tumors of the Central Nervous System: A Summary. Acta Neuropathol. 2016, 131, 803–820. [Google Scholar] [CrossRef] [PubMed] [Green Version]
  17. Louis, D.N.; Perry, A.; Wesseling, P.; Brat, D.J.; Cree, I.A.; Figarella-Branger, D.; Hawkins, C.; Ng, H.K.; Pfister, S.M.; Reifenberger, G.; et al. The 2021 WHO Classification of Tumors of the Central Nervous System: A Summary. Neuro. Oncol. 2021, 23, 1231–1251. [Google Scholar] [CrossRef]
  18. Yushkevich, P.A.; Gerig, G. ITK-SNAP: An Intractive Medical Image Segmentation Tool to Meet the Need for Expert-Guided Segmentation of Complex Medical Images. IEEE Pulse 2017, 8, 54–57. [Google Scholar] [CrossRef]
  19. Pipe, J. Pulse Sequences for Diffusion-Weighted MRI. In Diffusion MRI: From Quantitative Measurement to In Vivo Neuroanatomy; Academic Press: Cambridge, MA, USA, 2014; pp. 11–34. ISBN 9780123964601. [Google Scholar]
  20. Grech-Sollars, M.; Hales, P.W.; Miyazaki, K.; Raschke, F.; Rodriguez, D.; Wilson, M.; Gill, S.K.; Banks, T.; Saunders, D.E.; Clayden, J.D.; et al. Multi-Centre Reproducibility of Diffusion MRI Parameters for Clinical Sequences in the Brain. NMR Biomed. 2015, 28, 468–485. [Google Scholar] [CrossRef] [Green Version]
  21. Jenkinson, M.; Smith, S. A Global Optimisation Method for Robust Affine Registration of Brain Images. Med. Image Anal. 2001, 5, 143–156. [Google Scholar] [CrossRef]
  22. Jenkinson, M.; Bannister, P.; Brady, M.; Smith, S. Improved Optimization for the Robust and Accurate Linear Registration and Motion Correction of Brain Images. Neuroimage 2002, 17, 825–841. [Google Scholar] [CrossRef] [PubMed]
  23. Barajas, R.F.; Rubenstein, J.L.; Chang, J.S.; Hwang, J.; Cha, S. Diffusion-Weighted MR Imaging Derived Apparent Diffusion Coefficient Is Predictive of Clinical Outcome in Primary Central Nervous System Lymphoma. Am. J. Neuroradiol. 2010, 31, 60–66. [Google Scholar] [CrossRef] [PubMed]
  24. Wieduwilt, M.J.; Valles, F.; Issa, S.; Behler, C.M.; Hwang, J.; McDermott, M.; Treseler, P.; O’Brien, J.; Shuman, M.A.; Cha, S.; et al. Immunochemotherapy with Intensive Consolidation for Primary CNS Lymphoma: A Pilot Study and Prognostic Assessment by Diffusion-Weighted MRI. Clin. Cancer Res. 2012, 18, 1146–1155. [Google Scholar] [CrossRef] [PubMed] [Green Version]
  25. Wen, P.Y.; Macdonald, D.R.; Reardon, D.A.; Cloughesy, T.F.; Sorensen, A.G.; Galanis, E.; DeGroot, J.; Wick, W.; Gilbert, M.R.; Lassman, A.B.; et al. Updated Response Assessment Criteria for High-Grade Gliomas: Response Assessment in Neuro-Oncology Working Group. J. Clin. Oncol. 2010, 28, 1963–1972. [Google Scholar] [CrossRef]
  26. Ellingson, B.M.; Wen, P.Y.; Cloughesy, T.F. Modified Criteria for Radiographic Response Assessment in Glioblastoma Clinical Trials. Neurotherapeutics 2017, 14, 307–320. [Google Scholar] [CrossRef] [PubMed] [Green Version]
  27. Ellingson, B.M.; Kim, G.H.J.; Brown, M.; Lee, J.; Salamon, N.; Steelman, L.; Hassan, I.; Pandya, S.S.; Chun, S.; Linetsky, M.; et al. Volumetric Measurements Are Preferred in the Evaluation of Mutant IDH Inhibition in Non-Enhancing Diffuse Gliomas: Evidence from a Phase I Trial of Ivosidenib. Neuro. Oncol. 2022, 24, 770–778. [Google Scholar] [CrossRef] [PubMed]
  28. Citterio, G.; Reni, M.; Gatta, G.; Ferreri, A.J.M. Primary Central Nervous System Lymphoma. Crit. Rev. Oncol. Hematol. 2017, 113, 97–110. [Google Scholar] [CrossRef]
  29. Fu, F.; Sun, X.; Li, Y.; Liu, Y.; Shan, Y.; Ji, N.; Wang, X.; Lu, J.; Sun, S. Dynamic Contrast-Enhanced Magnetic Resonance Imaging Biomarkers Predict Chemotherapeutic Responses and Survival in Primary Central-Nervous-System Lymphoma. Eur. Radiol. 2021, 31, 1863–1871. [Google Scholar] [CrossRef]
  30. Schob, S.; Meyer, J.; Gawlitza, M.; Frydrychowicz, C.; Müller, W.; Preuss, M.; Bure, L.; Quäschling, U.; Hoffmann, K.T.; Surov, A. Diffusion-Weighted MRI Reflects Proliferative Activity in Primary CNS Lymphoma. PLoS One 2016, 11. [Google Scholar] [CrossRef]
  31. Maciver, C.L.; Al Busaidi, A.; Ganeshan, B.; Maynard, J.A.; Wastling, S.; Hyare, H.; Brandner, S.; Markus, J.E.; Lewis, M.A.; Groves, A.M.; et al. Filtration-Histogram Based Magnetic Resonance Texture Analysis (MRTA) for the Distinction of Primary Central Nervous System Lymphoma and Glioblastoma. J. Pers. Med. 2021, 11, 876. [Google Scholar] [CrossRef] [PubMed]
  32. Kickingereder, P.; Wiestler, B.; Sahm, F.; Heiland, S.; Roethke, M.; Schlemmer, H.P.; Wick, W.; Bendszus, M.; Radbruch, A. Primary Central Nervous System Lymphoma and Atypical Glioblastoma: Multiparametric Differentiation by Using Diffusion-, Perfusion-, and Susceptibility-Weighted MR Imaging. Radiology 2014, 272, 843–850. [Google Scholar] [CrossRef] [PubMed] [Green Version]
  33. Africa, E.; Pauciulo, A.; Vadalà, R.; Santa Lorusso, V.; Zecca, I.; Tartaglione, T. Primary Central Nervous System Lymphoma: Role of DWI in the Differential Diagnosis. Rays 2005, 30, 221–226. [Google Scholar] [PubMed]
  34. Chenevert, T.L.; Stegman, L.D.; Taylor, J.M.G.; Robertson, P.L.; Greenberg, H.S.; Rehemtulla, A.; Ross, B.D. Diffusion Magnetic Resonance Imaging: An Early Surrogate Marker of Therapeutic Efficacy in Brain Tumors. J. Natl. Cancer Inst. 2000, 92, 2029–2036. [Google Scholar] [CrossRef] [PubMed] [Green Version]
  35. Moffat, B.A.; Chenevert, T.L.; Lawrence, T.S.; Meyer, C.R.; Johnson, T.D.; Dong, Q.; Tsien, C.; Mukherji, S.; Quint, D.J.; Gebarski, S.S.; et al. Functional Diffusion Map: A Noninvasive MRI Biomarker for Early Stratification of Clinical Brain Tumor Response. Proc. Natl. Acad. Sci. USA 2005, 102, 5524–5529. [Google Scholar] [CrossRef] [PubMed]
  36. Valles, F.E.; Perez-Valles, C.L.; Regalado, S.; Barajas, R.F.; Rubenstein, J.L.; Cha, S. Combined Diffusion and Perfusion MR Imaging as Biomarkers of Prognosis in Immunocompetent Patients with Primary Central Nervous System Lymphoma. AJNR. Am. J. Neuroradiol. 2013, 34, 35–40. [Google Scholar] [CrossRef] [PubMed] [Green Version]
  37. Kunimatsu, A.; Yasaka, K.; Akai, H.; Sugawara, H.; Kunimatsu, N.; Abe, O. Texture Analysis in Brain Tumor MR Imaging. Magn. Reson. Med. Sci. 2022, 21, 95–109. [Google Scholar] [CrossRef] [PubMed]
  38. Thust, S.C.; Maynard, J.A.; Benenati, M.; Wastling, S.J.; Mancini, L.; Jaunmuktane, Z.; Brandner, S.; Jäger, H.R. Regional and Volumetric Parameters for Diffusion-Weighted WHO Grade II and III Glioma Genotyping: A Method Comparison. AJNR. Am. J. Neuroradiol. 2021, 42, 441–447. [Google Scholar] [CrossRef]
  39. Chong, I.; Ostrom, Q.; Khan, B.; Dandachi, D.; Garg, N.; Kotrotsou, A.; Colen, R.; Morón, F. Whole Tumor Histogram Analysis Using DW MRI in Primary Central Nervous System Lymphoma Correlates with Tumor Biomarkers and Outcome. Cancers 2019, 11, 1506. [Google Scholar] [CrossRef] [Green Version]
  40. Anjari, M.; Guha, A.; Burd, C.; Varela, M.; Goh, V.; Connor, S. Apparent Diffusion Coefficient Agreement and Reliability Using Different Region of Interest Methods for the Evaluation of Head and Neck Cancer Post Chemo-Radiotherapy. Dentomaxillofacial Radiol. 2021, 50, 20200579. [Google Scholar] [CrossRef]
  41. Pennig, L.; Hoyer, U.C.I.; Goertz, L.; Shahzad, R.; Persigehl, T.; Thiele, F.; Perkuhn, M.; Ruge, M.I.; Kabbasch, C.; Borggrefe, J.; et al. Primary Central Nervous System Lymphoma: Clinical Evaluation of Automated Segmentation on Multiparametric MRI Using Deep Learning. J. Magn. Reson. Imaging 2021, 53, 259–268. [Google Scholar] [CrossRef]
  42. Destito, M.; Marzullo, A.; Leone, R.; Zaffino, P.; Steffanoni, S.; Erbella, F.; Calimeri, F.; Anzalone, N.; Momi, E.D.; Ferreri, A.J.M.; et al. Radiomics-Based Machine Learning Model for Predicting Overall and Progression-Free Survival in Rare Cancer: A Case Study for Primary CNS Lymphoma Patients. Bioengineering 2023, 10, 285. [Google Scholar] [CrossRef] [PubMed]
Figure 1. Patient inclusion and exclusion criteria.
Jpm 13 01182 g001
Figure 2. An example of the response groups defined for statistical analysis. T1CE-weighted images with manually segmented tumours before treatment (first column) and after completion of 2 and 4 cycles of MATRix immunotherapy (second and third columns, respectively) in a patient with complete response (Group 0, (ac)), a patient with partial response (Group 1, (eg)) and a patient with lack of response and with appearance of a new lymphoma deposit from 2 to 4 cycles of treatment (Group 2, (ik)). Corresponding ADC images at baseline are shown for each example (Group 0, (d); Group 1, (h); Group 2, (l)).
Jpm 13 01182 g002
Figure 3. Boxplot demonstrating difference in Baseline Volumes between treatment response groups.
Jpm 13 01182 g003
Figure 4. Boxplot demonstrating difference in Baseline ADCmin between groups.
Jpm 13 01182 g004
Figure 5. Boxplot demonstrating difference in Baseline ADCmean between groups.
Jpm 13 01182 g005
Figure 6. Receiver Operator Characteristic curve for ADCmean at baseline.
Jpm 13 01182 g006
Table 1. Response Assessment on Imaging as per IPCG recommendations.
ResponseBrain Imaging
CRDisappearance of all enhancing abnormalities on gadolinium-enhancing MRI
CRuSmall but persistent abnormality on MRI related to biopsy or focal haemorrhage, found to represent scar tissue on serial scans
PR≥50% decrease in contrast-enhancing lesion seen on MRI as compared with baseline imaging
PD>25% increase in contrast-enhancing lesion on MRI compared with baseline or best response
Table 2. DWI acquisition parameters for patients imaged at or referred to NHNN. All patients were scanned with b-values of 0 and 1000 s/mm2.
SubjectManufacturerModelField Strength (T)SeriesTE (ms)TR (ms)Slice Thickness (mm)Slice Spacing (mm)In Plane Resolution (mm × mm)
NHNN_001aSiemensSymphonyTim1.500005-MR-ep2d_diff_3scan_trace_p2106440056.51.2 × 1.2
NHNN_001bSiemensAvanto1.500007-MR-DWI_Tra81373456.51.8 × 1.8
NHNN_002aSiemensAvanto1.500004-MR-ep2d_diff_3scan_trace_p2102372356.51.2 × 1.2
NHNN_002bSiemensAvanto1.500007-MR-DWI_Tra81320056.51.8 × 1.8
NHNN_003aSiemensEspree1.500007-MR-ep2d_diff_3scan_trace_aa100400056.51.6 × 1.6
NHNN_003bSiemensSymphonyTim1.500007-MR-DWI_Tra84320056.51.8 × 1.8
NHNN_003cSiemensAvanto1.500007-MR-DWI_Tra81334856.51.8 × 1.8
NHNN_004aSiemensAvanto1.500006-MR-ep2d_diff_3scan_trace102430056.51.2 × 1.2
NHNN_004bSiemensAvanto1.500007-MR-DWI_Tra81320056.51.8 × 1.8
NHNN_004cPhilipsAchieva300401-MR-dwi_1000952900560.9 × 0.9
NHNN_005bSiemensSymphonyTim1.500009-MR-DWI_Tra84320056.51.8 × 1.8
NHNN_005cPhilipsAchieva300401-MR-dwi_1000962934560.9 × 0.9
NHNN_006aPhilipsAchieva300401-MR-dwi_1000962934560.9 × 0.9
NHNN_006bSiemensAvanto1.500007-MR-DWI_Tra81334856.52.0 × 2.0
NHNN_007aSiemensAvanto1.500005-MR-ep2d_diff_3scan_trace_p2_aa89360056.51.3 × 1.3
NHNN_008aPhilipsAchieva1.500501-MR-sDW_SSh903174561.8 × 1.8
NHNN_009aGE Medical SystemsSIGNA Excite1.500004-MR-Ax_DWI_1000b100900044.41.2 × 1.2
NHNN_009bSiemensAvanto1.500007-MR-DWI_Tra81320056.51.8 × 1.8
NHNN_010aGE Medical SystemsDiscovery MR4501.500008-MR-Ax_DWI_(NEW)838000560.9 × 0.9
NHNN_010bSiemensAvanto1.500008-MR-DWI_Tra81320056.51.8 × 1.8
NHNN_011aSiemensAvanto1.500010-MR-ep2d_diff_3scan_trace_p2_aa89360056.51.3 × 1.3
NHNN_011bSiemensAvanto1.500005-MR-DWI_Tra81320056.51.8 × 1.8
NHNN_012aSiemensEspree1.500005-MR-DWI_3scanTrace_2.5iso8768002.52.52.5 × 2.5
NHNN_012bSiemensAvanto1.500008-MR-ep2d_diff_3scan81320056.51.8 × 1.8
NHNN_012cSiemensAvanto1.500007-MR-DWI_Tra76320056.51.8 × 1.8
NHNN_013aSiemensPrisma_fit300007-MR-resolve_4scan_trace_ p2_192_TRACEW55370056.51.1 × 1.1
NHNN_013bPhilipsAchieva300401-MR-dwi_1000962933560.9 × 0.9
NHNN_013cPhilipsIngenia300702-MR-Reg_-_DWI_3b_Tra_SENSE99396155.51.0 × 1.0
NHNN_014aSiemensAvanto1.500005-MR-ep2d_diff_3scan_trace_p2102340056.51.2 × 1.2
NHNN_014bPhilipsAchieva300401-MR-dwi_1000962933560.9 × 0.9
NHNN_015aSiemensSkyra300009-MR-ep2d_diff_3scan_trace_p2_aa_TRACEW98600056.51.1 × 1.1
NHNN_015bSiemensAvanto1.500009-MR-DWI_Tra81390056.51.8 × 1.8
NHNN_016aSiemensAvanto1.500010-MR-ep2d_diff_3scan_trace_p2_aa89360056.51.3 × 1.3
NHNN_016bSiemensSymphonyTim1.500007-MR-DWI_Tra84320056.51.8 × 1.8
NHNN_016cPhilipsIngenia300801-MR-DWI_3b_ax_cc101439255.51.0 × 1.0
NHNN_017aGE Medical SystemsSigna HDxt1.500004-MR-Ax_DWI_1000b82800044.51.1 × 1.1
NHNN_017bGE Medical SystemsSigna HDxt1.500004-MR-Ax_DWI_1000b82865044.51.1 × 1.1
NHNN_018aSiemensAvanto1.500004-MR-ep2d_diff_3scan_trace_p2_aa89360056.51.3 × 1.3
NHNN_020aSiemensPrisma_fit300007-MR-resolve_4scan_trace_ p2_192_TRACEW553700451.1 × 1.1
NHNN_020bPhilipsIngenia300801-MR-DWI_3b_ax_cc99391755.51.0 × 1.0
NHNN_020cSiemensAvanto1.500008-MR-DWI_Tra81320056.51.8 × 1.8
NHNN_021aSiemensAvanto1.500007-MR-ep2d_diff_3scan_trace_p2102320056.51.2 × 1.2
NHNN_021bPhilipsAchieva300501-MR-dwi_1000952939560.9 × 0.9
NHNN_022bSiemensAvanto1.500007-MR-DWI_Tra81320056.51.8 × 1.8
NHNN_023aSiemensSkyra300012-MR-ep2d_diff_3scan_trace_p2_aa_TRACEW98600056.51.1 × 1.1
NHNN_024aSiemensAvanto1.500005-MR-ep2d_diff_3scan_trace_p2_aa89360056.51.3 × 1.3
NHNN_025aSiemensAvanto1.500006-MR-ep2d_diff_3scan_trace_p2102410056.51.2 × 1.2
NHNN_026bSiemensAvanto1.500007-MR-DWI_Tra81320056.51.8 × 1.8
NHNN_026cSiemensSymphonyTim1.500010-MR-DWI_Tra84320056.51.8 × 1.8
NHNN_028aSiemensAvanto1.500011-MR-DWI_Tra81320056.51.8 × 1.8
Table 3. DWI acquisition parameters for patients imaged at or referred to NUH. All patients were scanned with b-values of 0 and 1000 s/mm2.
SubjectManufacturerModelField Strength (T)SeriesTE (ms)TR (ms)Slice Thickness (mm)Slice Spacing (mm)In Plane Resolution (mm × mm)
Nott_020aGE Medical SystemsSigna HDxt1.500004-MR-DWI818000451.0 × 1.0
Nott_026bGE Medical SystemsSigna HDxt1.500004-MR-DWI818000451.0 × 1.0
Nott_060aPhilipsAchieva300401-MR-DW_SSh_new_2012552661451.0 × 1.0
Nott_060bGE Medical SystemsSigna HDxt1.500004-MR-DWI827000451.0 × 1.0
Nott_063aGE Medical SystemsSigna HDxt1.500004-MR-Ax_DWI828000450.9 × 0.9
Nott_063bGE Medical SystemsSigna HDxt1.500004-MR-DWI827000451.0 × 1.0
Nott_063cGE Medical SystemsSigna HDxt1.500004-MR-DWI827000451.0 × 1.0
Nott_066aSiemensAvanto1.500006-MR-ep2d_diff_3scan_trace_p2102410056.51.2 × 1.2
Nott_066bGE Medical SystemsSigna HDxt1.500004-MR-DWI817175451.0 × 1.0
Nott_066cSiemensAera1.500007-MR-ep2d_diff_3scan_trace_p2_TRACEW89630056.50.6 × 0.6
Nott_067aGE Medical SystemsSigna HDxt1.500004-MR-DWI817000451.0 × 1.0
Nott_067bSiemensAera1.500007-MR-resolve_4scan_trace_tra_160_p2_TRACEW60615044.961.4 × 1.4
Nott_068bSiemensAera1.500007-MR-resolve_4scan_trace_tra_160_p2_TRACEW60633044.961.6 × 1.6
Nott_068cPhilipsAchieva300601-MR-DWI96417644.40.9 × 0.9
Nott_070aPhilipsAchieva300601-MR-DWI96404344.40.9 × 0.9
Nott_070bSiemensAera1.500006-MR-resolve_4scan_trace_tra_160_p2_DWI_TRACEW60633044.961.6 × 1.6
Nott_070cSiemensAera1.500006-MR-resolve_4scan_trace_tra_160_p2_DWI_TRACEW60633044.961.6 × 1.6
Nott_072aGE Medical SystemsSigna HDxt1.500006-MR-Ax_DWI828000450.9 × 0.9
Nott_072bSiemensAera1.500006-MR-resolve_4scan_trace_tra_160_p2_DWI_TRACEW60656044.961.6 × 1.6
Nott_077aPhilipsAchieva300601-MR-DWI95400844.40.9 × 0.9
Nott_077bSiemensAera1.500006-MR-resolve_4scan_trace_tra_160_p2_DWI_TRACEW60633044.961.6 × 1.6
Nott_077cSiemensAera1.500006-MR-resolve_4scan_trace_tra_160_p2_DWI_TRACEW60633044.961.6 × 1.6
Nott_080aGE Medical SystemsSigna HDxt1.500003-MR-Ax_DWI828000450.9 × 0.9
Nott_080bSiemensAera1.500007-MR-resolve_4scan_trace_tra_160_p2_DWI_TRACEW60633044.961.6 × 1.6
Nott_080cSiemensAera1.500005-MR-ep2d_diff_3scan_trace_p2_TRACEW898200450.6 × 0.6
Nott_081aPhilipsAchieva1.500501-MR-DWI894119451.0 × 1.0
Nott_081bSiemensAera1.500005-MR-ep2d_diff_3scan_trace_p2_TRACEW898200450.6 × 0.6
Nott_082aGE Medical SystemsSigna HDxt1.500007-MR-Ax_DWI828000450.9 × 0.9
Nott_082bSiemensAera1.500005-MR-ep2d_diff_3scan_trace_p2_TRACEW898200450.6 × 0.6
Nott_082cSiemensAera1.500005-MR-ep2d_diff_3scan_trace_p2_TRACEW898800450.6 × 0.6
Nott_083aSiemensAera1.500005-MR-ep2d_diff_3scan_trace_p2_TRACEW898200450.6 × 0.6
Nott_083bPhilipsAchieva300601-MR-DWI95400744.40.9 × 0.9
Nott_085aSiemensAera1.500005-MR-ep2d_diff_3scan_trace_p2_TRACEW898800450.6 × 0.6
Nott_085bSiemensAera1.500005-MR-ep2d_diff_3scan_trace_p2_TRACEW899000450.6 × 0.6
Nott_085cSiemensAera1.500006-MR-resolve_4scan_trace_tra_160_p2_DWI_TRACEW60678044.961.6 × 1.6
Nott_086aPhilipsAchieva300601-MR-DWI95454144.40.9 × 0.9
Nott_086bSiemensAera1.500007-MR-resolve_4scan_trace_tra_160_p2_DWI_TRACEW60678044.961.6 × 1.6
Nott_086cSiemensAera1.500010-MR-resolve_4scan_trace_tra_160_p2_DWI_TRACEW60701044.961.6 × 1.6
Nott_087aPhilipsIntera1.500601-MR-sDW_SSh914727452.0 × 2.0
Nott_087bSiemensAera1.500005-MR-ep2d_diff_3scan_trace_p2_TRACEW898200450.6 × 0.6
Nott_087cSiemensAera1.500006-MR-resolve_4scan_trace_tra_160_p2_DWI_TRACEW60656044.961.6 × 1.6
Nott_095aSiemensAera1.500005-MR-ep2d_diff_3scan_trace_p2_TRACEW115670044.41.3 × 1.3
Nott_095bSiemensAera1.500005-MR-ep2d_diff_3scan_trace_p2_TRACEW898200450.6 × 0.6
Nott_095cSiemensAera1.500005-MR-ep2d_diff_3scan_trace_p2_TRACEW898200450.6 × 0.6
Nott_099aPhilipsAchieva300401-MR-DWI96407744.40.9 × 0.9
Nott_099bSiemensAera1.500006-MR-resolve_4scan_trace_tra_160_p2_DWI_TRACEW60678044.961.6 × 1.6
Nott_099cSiemensAera1.500006-MR-resolve_4scan_trace_tra_160_p2_DWI_TRACEW60633044.961.6 × 1.6
Nott_100aSiemensAera1.500005-MR-ep2d_diff_3scan_trace_p2_TRACEW898200450.6 × 0.6
Nott_100bSiemensAera1.500005-MR-ep2d_diff_3scan_trace_p2_TRACEW898200450.6 × 0.6
Nott_100cPhilipsAchieva300601-MR-DWI95404444.40.9 × 0.9
Nott_103aSiemensAera1.500005-MR-ep2d_diff_3scan_trace_p2_TRACEW898200450.6 × 0.6
Nott_103bSiemensAera1.500005-MR-ep2d_diff_3scan_trace_p2_TRACEW898200450.6 × 0.6
Nott_103cSiemensAera1.500006-MR-resolve_4scan_trace_tra_160_p2_DWI_TRACEW60678044.961.6 × 1.6
Nott_109aGE Medical SystemsDiscovery MR750w300003-MR-DWI_TRA_b125075120253.63.90.9 × 0.9
Nott_109bSiemensAera1.500005-MR-ep2d_diff_3scan_trace_p2_TRACEW897800450.6 × 0.6
Nott_111aPhilipsAchieva300601-MR-DWI95444244.40.9 × 0.9
Nott_111bSiemensAera1.500005-MR-ep2d_diff_3scan_trace_p2_TRACEW897800450.6 × 0.6
Nott_111cSiemensAera1.500005-MR-ep2d_diff_3scan_trace_p2_TRACEW898100450.6 × 0.6
Nott_116aPhilipsAchieva300601-MR-DWI95403244.40.9 × 0.9
Nott_116bSiemensAera1.500005-MR-ep2d_diff_3scan_trace_p2_TRACEW898600450.6 × 0.6
Nott_120aSiemensAera1.500005-MR-ep2d_diff_3scan_trace_p2_TRACEW115670044.41.3 × 1.3
Nott_120bSiemensAera1.500005-MR-ep2d_diff_3scan_trace_p2_TRACEW897800450.6 × 0.6
Nott_120cPhilipsIngenia1.500401-MR-DWI903627451.3 × 1.3
Disclaimer/Publisher’s Note: The statements, opinions and data contained in all publications are solely those of the individual author(s) and contributor(s) and not of MDPI and/or the editor(s). MDPI and/or the editor(s) disclaim responsibility for any injury to people or property resulting from any ideas, methods, instructions or products referred to in the content.

