
Systemic Inflammatory Response Index (SIRI) at Baseline Predicts Clinical Response for a Subset of Treatment-Resistant Bipolar Depressed Patients

Abstract
:1. Introduction
- (1)
- (2)
- Secondly, based on the notion that SIRI is an index of peripheral inflammation, we hypothesize that baseline SIRI is associated with classical pro-inflammatory cytokines. For exploratory purposes, we also assessed relationships between SIRI and biologically pertinent neurotrophic factors and kynurenine pathway metabolites.
- (3)
- Thirdly, based on reports of within-patient changes in inflammatory profiles in bipolar patients between the depressed and euthymic and/or (hypo)manic phases [40,41,42,43,44,45], it is plausible that SIRI may also be associated with the clinical course of depression over treatment timepoints in TRBDD. We therefore hypothesized that changes in the relationship between SIRI and depressive severity (HAMD-17) will differ significantly between treatment timepoints (e.g., baseline and week 8).
- (4)
- Fourth, we hypothesized that pre-treatment (baseline) SIRI levels are associated with post-treatment clinical outcomes (depressive severity). This last hypothesis is based on the broader notion that treatment refractoriness is based, at least in part, on pre-existing immune–metabolic abnormalities in the literature and also our sample [22,23].
2. Materials and Methods
2.1. Study Population
2.2. Healthy Controls
2.3. Study Design
2.4. Laboratory Measurements of Biomarkers and Calculation of SIRI
2.5. Clinical Outcome Variable
2.6. Statistical Analysis
3. Results
3.1. Sample Characteristics and Group Comparisons (See Table 1)

| Variable | N | Overall, N = 84 1 | HC, N = 32 1 | TRBDD (ESC + PBO), N = 23 1 | TRBDD (ESC + CBX), N = 29 1 | p-Value 2 | q-Value 3 |
|---|---|---|---|---|---|---|---|
| Sex | 83 | 0.016 | 0.13 | ||||
| Male | 44 (53%) | 11 (34%) | 16 (73%) | 17 (59%) | |||
| Female | 39 (47%) | 21 (66%) | 6 (27%) | 12 (41%) | |||
| Age | 74 | 40 (31, 52) | 37 (26, 53) | 47 (35, 58) | 38 (31, 44) | 0.083 | 0.42 |
| BMI | 71 | 3.37 (3.23, 3.49) | 3.20 a (3.12, 3.34) | 3.44 b (3.33, 3.60) | 3.39 b (3.29, 3.57) | <0.001 | 0.017 |
| Depressive severity | |||||||
| HAMD-17 (baseline) | 45 | 24.0 (20.0, 29.0) | - | 23.5 (21.0, 26.0) | 24.0 (20.0, 30.0) | 0.66 | 0.87 |
| HAMD-17 (Week 8) | 45 | 10 (7, 17) | - | 12 (9, 18) | 8 (5, 13) | 0.007 | 0.092 |
| CBC-related markers | |||||||
| Neutrophils | 81 | 1.25 (1.03, 1.57) | 1.15 (1.02, 1.53) | 1.50 (1.06, 1.68) | 1.28 (1.08, 1.49) | 0.3 | 0.68 |
| Monocytes | 82 | −0.92 (−0.92, −0.51) | −0.92 (−0.92, −0.65) | −0.69 (−1.13, −0.40) | −0.69 (−0.92, −0.51) | 0.81 | 0.92 |
| Lymphocytes | 82 | 0.59 (0.47, 0.79) | 0.59 (0.52, 0.83) | 0.59 (0.47, 0.79) | 0.59 (0.52, 0.79) | 0.9 | 0.98 |
| SIRI | 81 | −0.16 (−0.51, 0.24) | −0.28 (−0.54, 0.19) | 0.04 (−0.32, 0.40) | −0.03 (−0.52, 0.20) | 0.41 | 0.73 |
| Pro-inflammatory cytokines | |||||||
| IL-1α | 21 | 0.69 (0.69, 0.79) | - | 0.74 (0.69, 0.80) | 0.69 (0.69, 0.69) | 0.23 | 0.68 |
| IL-1β | 22 | 0.69 (0.69, 0.88) | - | 0.69 (0.69, 0.96) | 0.69 (0.69, 0.69) | 0.43 | 0.73 |
| IL-6 | 21 | 1.25 (1.00, 1.44) | - | 1.56 (1.01, 1.70) | 1.22 (1.00, 1.34) | 0.18 | 0.64 |
| TNF-α | 21 | 1.18 (1.11, 1.40) | - | 1.21 (1.12, 1.41) | 1.18 (1.08, 1.30) | 0.66 | 0.87 |
| IFN-γ | 21 | 0.69 (0.69, 0.69) | - | 0.69 (0.69, 0.82) | 0.69 (0.69, 0.69) | >0.99 | >0.99 |
| CRP | 15 | 1.61 (1.16, 1.95) | - | 1.58 (1.22, 1.65) | 1.95 (1.19, 2.58) | 0.3 | 0.68 |
| MCP1 | 21 | 4.59 (4.48, 4.85) | - | 4.76 (4.47, 4.90) | 4.56 (4.48, 4.71) | 0.47 | 0.73 |
| Growth factors | |||||||
| FGF | 15 | 1.18 (0.88, 1.58) | - | 1.36 (1.08, 1.57) | 1.11 (0.76, 1.58) | 0.73 | 0.87 |
| VEGF | 31 | 3.49 (3.36, 3.81) | - | 3.41 (3.30, 3.49) | 3.63 (3.48, 3.92) | 0.057 | 0.36 |
| EGF | 21 | 1.28 (0.69, 1.71) | - | 1.43 (1.13, 1.61) | 1.20 (0.69, 1.71) | 0.46 | 0.73 |
| Kynurenines | |||||||
| TRP | 41 | 9.70 (9.51, 9.79) | - | 9.59 (9.45, 9.76) | 9.73 (9.58, 9.80) | 0.16 | 0.64 |
| KYN | 41 | 5.76 (5.56, 5.94) | - | 5.74 (5.64, 6.07) | 5.76 (5.55, 5.86) | 0.71 | 0.87 |
| QUIN | 41 | 4.02 (3.76, 4.29) | - | 4.04 (3.83, 4.37) | 3.98 (3.64, 4.25) | 0.39 | 0.73 |
| PIC | 41 | 3.17 (2.84, 3.33) | - | 3.20 (2.69, 3.36) | 3.00 (2.84, 3.33) | 0.97 | >0.99 |
| KYN/TRP | 41 | 0.703 (0.701, 0.706) | - | 0.705 (0.702, 0.707) | 0.702 (0.701, 0.706) | 0.25 | 0.68 |
| QUIN/PIC | 41 | 1.56 (1.41, 1.76) | - | 1.55 (1.47, 1.71) | 1.56 (1.39, 1.76) | 0.63 | 0.87 |
3.2. Univariate Relationships of Sample Characteristics with Baseline SIRI (See Table 2)
| Spearman’s Correlations of CBC-Related Markers (Baseline) with Demographics, HAMD17 (Baseline and Week 8), and Biomarkers (Baseline) | ||||||||||||
|---|---|---|---|---|---|---|---|---|---|---|---|---|
| Spearman’s Coefficient (Rho) | p-Value (Unadjusted) | p-Value (Benjamini–Hochberg) | ||||||||||
| Neutrophils | Monocytes | Lymphocytes | SIRI | Neutrophils | Monocytes | Lymphocytes | SIRI | Neutrophils | Monocytes | Lymphocytes | SIRI | |
| Age | 0.470 | 0.442 | −0.011 | 0.319 | 0.172 | 0.575 | 0.392 | 0.325 | 0.732 | 0.727 | 0.975 | 0.065 |
| BMI | 0.387 | 0.712 | 0.151 | 0.436 | 0.783 | 0.442 | 0.184 | 0.227 | 0.922 | 0.966 | 0.550 | 0.548 |
| HAMD17 (Baseline) | 0.082 | −0.435 | −0.225 | −0.114 | 0.296 | 0.106 | 0.921 | 0.055 | 0.505 | 0.915 | 0.694 | 0.496 |
| HAMD17 (Week 8) | 0.444 | 0.312 | −0.076 | 0.338 | 0.815 | 0.292 | 0.497 | 0.676 | 0.966 | 0.708 | 0.837 | 0.922 |
| IL-1α | −0.460 | −0.526 | −0.399 | −0.396 | 0.153 | 0.172 | 0.680 | 0.059 | 0.505 | 0.505 | 0.922 | 0.343 |
| IL-1β | −0.558 | −0.227 | 0.193 | −0.557 | 0.307 | 0.664 | 0.596 | 0.138 | 0.708 | 0.922 | 0.908 | 0.503 |
| IL-6 | 0.087 | 0.323 | 0.586 | −0.173 | 0.628 | 0.384 | 0.021 | 0.225 | 0.915 | 0.764 | 0.171 | 0.604 |
| TNF-α | 0.178 | 0.297 | 0.456 | −0.032 | 0.791 | 0.130 | 0.053 | 0.637 | 0.966 | 0.496 | 0.322 | 0.916 |
| IFN-γ | −0.203 | −0.084 | −0.075 | −0.202 | 0.911 | 0.217 | 0.070 | 0.675 | 0.975 | 0.595 | 0.372 | 0.922 |
| CRP | 0.173 | 0.247 | 0.128 | 0.127 | 0.172 | 0.196 | 0.529 | 0.503 | 0.505 | 0.550 | 0.857 | 0.837 |
| MCP1 | −0.305 | −0.465 | 0.307 | −0.609 | 0.060 | 0.099 | 0.339 | 0.001 | 0.344 | 0.447 | 0.727 | 0.022 |
| FGF | 0.560 | 0.659 | 0.540 | 0.464 | 0.949 | 0.691 | 0.658 | 0.760 | 0.975 | 0.922 | 0.922 | 0.962 |
| VEGF | −0.387 | −0.527 | 0.014 | −0.455 | 0.313 | 0.692 | 0.178 | 0.158 | 0.716 | 0.922 | 0.517 | 0.505 |
| EGF | −0.244 | 0.014 | 0.628 | −0.440 | 0.862 | 0.352 | 0.046 | 0.950 | 0.975 | 0.732 | 0.289 | 0.975 |
| TRP | 0.050 | −0.327 | −0.403 | 0.200 | 0.688 | 0.874 | 0.711 | 0.844 | 0.922 | 0.975 | 0.926 | 0.975 |
| KYN | 0.838 | 0.522 | 0.261 | 0.691 | 0.022 | 0.041 | 0.039 | 0.098 | 0.180 | 0.278 | 0.278 | 0.447 |
| QUIN | 0.310 | 0.261 | −0.137 | 0.327 | 0.337 | 0.113 | 0.614 | 0.170 | 0.727 | 0.474 | 0.915 | 0.505 |
| PIC | −0.694 | −0.245 | 0.167 | −0.579 | 0.158 | 0.834 | 0.599 | 0.335 | 0.505 | 0.975 | 0.908 | 0.727 |
| KYN/TRP | 0.519 | 0.598 | 0.421 | 0.282 | 0.164 | 0.148 | 0.076 | 0.304 | 0.505 | 0.505 | 0.391 | 0.708 |
| QUIN/PIC | 0.642 | 0.323 | 0.128 | 0.518 | 0.626 | 0.218 | 0.290 | 0.843 | 0.915 | 0.595 | 0.708 | 0.975 |
3.3. SIRI—to—HAMD17 Relationships between Timepoints (See Table 3)
| Outcome Variable: HAMD 17 Total | |||
|---|---|---|---|
| Predictors | Estimates | CI | p |
| (Intercept) | 17.55 | 9.97–25.13 | <0.001 |
| Sex (Female) | −0.11 | −2.68–2.47 | 0.936 |
| Age | 0.1 | −0.00–0.20 | 0.057 |
| BMI | 0 | −0.23–0.23 | 0.991 |
| Treatment arm (ESC + CBX) | 1.33 | −1.36–4.03 | 0.331 |
| SIRI (log) | −2.04 | −4.95–0.86 | 0.168 |
| Timepoint (Week 8) | −12.33 | −14.77–−9.88 | <0.001 |
| SIRI (log) * Timepoint | 4.73 | 0.73–8.74 | 0.02 |
| (Week 8) | |||
| Random Effects | |||
| σ2 | 30.17 | ||
| τ00 Timepoint | 0 | ||
| ICC | 0 | ||
| N Timepoint | 2 | ||
| Observations | 84 | ||
| Marginal R2/Conditional R2 | 0.605/0.605 | ||
3.4. Post-Treatment HAMD-17 by Pre-Treatment SIRI
4. Discussion
5. Conclusions and Limitations
Author Contributions
Funding
Institutional Review Board Statement
Informed Consent Statement
Data Availability Statement
Acknowledgments
Conflicts of Interest
References
- Haroon, E.; Miller, A.H. Inflammation Effects on Glutamate as a Pathway to Neuroprogression in Mood Disorders. Mod. Trends Pharmacopsychiatry 2017, 31, 37–55. [Google Scholar] [CrossRef]
- Boufidou, F.; Halaris, A. Pharmacological and Nonpharmacological Interventions to Arrest Neuroprogression in Psychiatric Disorders. Mod. Trends Pharmacopsychiatry 2017, 31, 162–176. [Google Scholar] [CrossRef]
- Debnath, M.; Berk, M.; Maes, M. Translational evidence for the Inflammatory Response System (IRS)/Compensatory Immune Response System (CIRS) and neuroprogression theory of major depression. Prog. Neuropsychopharmacol. Biol. Psychiatry 2021, 111, 110343. [Google Scholar] [CrossRef]
- Siwek, M.; Sowa-Kućma, M.; Styczeń, K.; Misztak, P.; Nowak, R.J.; Szewczyk, B.; Dudek, D.; Rybakowski, J.K.; Nowak, G.; Maes, M. Associations of Serum Cytokine Receptor Levels with Melancholia, Staging of Illness, Depressive and Manic Phases, and Severity of Depression in Bipolar Disorder. Mol. Neurobiol. 2017, 54, 5883–5893. [Google Scholar] [CrossRef]
- Martinuzzi, E.; Barbosa, S.; Courtet, P.; Olié, E.; Guillaume, S.; Ibrahim, E.C.; Daoudlarian, D.; Davidovic, L.; Glaichenhaus, N.; Belzeaux, R. Blood cytokines differentiate bipolar disorder and major depressive disorder during a major depressive episode: Initial discovery and independent sample replication. Brain Behav. Immun.-Health 2021, 13, 100232. [Google Scholar] [CrossRef]
- van den Ameele, S.; van Nuijs, A.L.; Lai, F.Y.; Schuermans, J.; Verkerk, R.; van Diermen, L.; Coppens, V.; Fransen, E.; de Boer, P.; Timmers, M.; et al. A mood state-specific interaction between kynurenine metabolism and inflammation is present in bipolar disorder. Bipolar Disord. 2020, 22, 59–69. [Google Scholar] [CrossRef]
- Siwek, M.; Styczeń, K.; Sowa-Kućma, M.; Dudek, D.; Reczyński, W.; Szewczyk, B.; Misztak, P.; Opoka, W.; Topór-Mądry, R.; Nowak, G.; et al. The serum concentration of copper in bipolar disorder. Psychiatr. Pol. 2017, 51, 469–481. [Google Scholar] [CrossRef]
- Chamberlain, S.R.; Cavanagh, J.; de Boer, P.; Mondelli, V.; Jones, D.N.; Drevets, W.C.; Cowen, P.J.; Harrison, N.A.; Pointon, L.; Pariante, C.M.; et al. Treatment-resistant depression and peripheral C-reactive protein. Br. J. Psychiatry J. Ment. Sci. 2019, 214, 11–19. [Google Scholar] [CrossRef]
- Allen, A.P.; Naughton, M.; Dowling, J.; Walsh, A.; O’Shea, R.; Shorten, G.; Scott, L.; McLoughlin, D.M.; Cryan, J.F.; Clarke, G.; et al. Kynurenine pathway metabolism and the neurobiology of treatment-resistant depression: Comparison of multiple ketamine infusions and electroconvulsive therapy. J. Psychiatr. Res. 2018, 100, 24–32. [Google Scholar] [CrossRef]
- Esalatmanesh, S.; Kashani, L.; Khooshideh, M.; Moghaddam, H.S.; Ansari, S.; Akhondzadeh, S. Efficacy and safety of celecoxib for treatment of mild to moderate postpartum depression: A randomized, double-blind, placebo-controlled trial. Arch. Gynecol. Obstet. 2023. [Google Scholar] [CrossRef]
- Akhondzadeh, S.; Jafari, S.; Raisi, F.; Nasehi, A.A.; Ghoreishi, A.; Salehi, B.; Mohebbi-Rasa, S.; Raznahan, M.; Kamalipour, A. Clinical trial of adjunctive celecoxib treatment in patients with major depression: A double blind and placebo controlled trial. Depress. Anxiety 2009, 26, 607–611. [Google Scholar] [CrossRef]
- Bavaresco, D.V.; Colonetti, T.; Grande, A.J.; Colom, F.; Valvassori, S.S.; Quevedo, J.; da Rosa, M.I. Efficacy of Celecoxib Adjunct Treatment on Bipolar Disorder: Systematic Review and Meta-Analysis. CNS Neurol. Disord. Drug Targets 2019, 18, 19–28. [Google Scholar] [CrossRef] [PubMed]
- Gędek, A.; Szular, Z.; Antosik, A.Z.; Mierzejewski, P.; Dominiak, M. Celecoxib for Mood Disorders: A Systematic Review and Meta-Analysis of Randomized Controlled Trials. J. Clin. Med. 2023, 12, 3497. [Google Scholar] [CrossRef] [PubMed]
- Husain, M.I.; Chaudhry, I.B.; Khoso, A.B.; Hodsoll, J.; Ansari, M.A.; Naqvi, H.A.; Minhas, F.A.; Carvalho, A.F.; Meyer, J.H.; Deakin, B.; et al. Minocycline and celecoxib as adjunctive treatments for bipolar depression: A multicentre, factorial design randomised controlled trial. Lancet Psychiatry 2020, 7, 515–527. [Google Scholar] [CrossRef] [PubMed]
- Husain, M.; Chaudhry, I.B.; Hamirani, M.M.; Minhas, F.; Kazmi, A.; Hodsoll, J.; Haddad, P.M.; Deakin, J.F.; Husain, N.; Young, A.H. Minocycline and celecoxib as adjunctive treatments for bipolar depression: A study protocol for a multicenter factorial design randomized controlled trial. Neuropsychiatr. Dis. Treat. 2017, 13, 1–8. [Google Scholar] [CrossRef] [PubMed]
- Müller, N.; Schwarz, M.J.; Dehning, S.; Douhe, A.; Cerovecki, A.; Goldstein-Müller, B.; Spellmann, I.; Hetzel, G.; Maino, K.; Kleindienst, N.; et al. The cyclooxygenase-2 inhibitor celecoxib has therapeutic effects in major depression: Results of a double-blind, randomized, placebo controlled, add-on pilot study to reboxetine. Mol. Psychiatry 2006, 11, 680–684. [Google Scholar] [CrossRef]
- Zwiep, J.C.; Bet, P.M.; Rhebergen, D.; Nurmohamed, M.T.; Vinkers, C.H.; Penninx, B.W.; Milaneschi, Y.; Lamers, F. Efficacy of celecoxib add-on treatment for immuno-metabolic depression: Protocol of the INFLAMED double-blind placebo-controlled randomized controlled trial. Brain Behav. Immun.-Health 2023, 27, 100585. [Google Scholar] [CrossRef]
- Halaris, A.; Cantos, A.; Johnson, K.; Hakimi, M.; Sinacore, J. Modulation of the inflammatory response benefits treatment-resistant bipolar depression: A randomized clinical trial. J. Affect. Disord. 2020, 261, 145–152. [Google Scholar] [CrossRef]
- Edberg, D.; Hoppensteadt, D.; Walborn, A.; Fareed, J.; Sinacore, J.; Halaris, A. Plasma C-reactive protein levels in bipolar depression during cyclooxygenase-2 inhibitor combination treatment. J. Psychiatr. Res. 2018, 102, 1–7. [Google Scholar] [CrossRef]
- Murata, S.; Murphy, M.; Hoppensteadt, D.; Fareed, J.; Welborn, A.; Halaris, A. Effects of adjunctive inflammatory modulation on IL-1β in treatment resistant bipolar depression. Brain Behav. Immun. 2020, 87, 369–376. [Google Scholar] [CrossRef]
- Murata, S.; Castillo, M.F.R.; Murphy, M.; Schwarz, M.; Moll, N.; Martin, B.; Weidinger, E.; Leitner, B.; Mueller, N.; Halaris, A. Effects of inflammation modulation on tryptophan and kynurenine pathway regulation in treatment resistant bipolar depression. Neurol. Psychiatry Brain Res. 2019, 33, 65–72. [Google Scholar] [CrossRef]
- Halaris, A.; Hain, D.; Law, R.; Brown, L.; Lewis, D.; Filip, M. Single nucleotide polymorphisms in C-reactive protein (CRP) predict response to adjunctive celecoxib treatment of resistant bipolar depression. Brain Behav. Immun.-Health 2023, 30, 100625. [Google Scholar] [CrossRef] [PubMed]
- Edberg, D.; Hoppensteadt, D.; Walborn, A.; Fareed, J.; Sinacore, J.; Halaris, A. Plasma MCP-1 levels in bipolar depression during cyclooxygenase-2 inhibitor combination treatment. J. Psychiatr. Res. 2020, 129, 189–197. [Google Scholar] [CrossRef]
- Sunbul, E.A.; Sunbul, M.; Yanartas, O.; Cengiz, F.; Bozbay, M.; Sari, I.; Gulec, H. Increased Neutrophil/Lymphocyte Ratio in Patients with Depression is Correlated with the Severity of Depression and Cardiovascular Risk Factors. Psychiatry Investig. 2016, 13, 121–126. [Google Scholar] [CrossRef]
- Avcil, S. Evaluation of the neutrophil/lymphocyte ratio, platelet/lymphocyte ratio, and mean platelet volume as inflammatory markers in children with attention-deficit hyperactivity disorder. Psychiatry Clin. Neurosci. 2018, 72, 522–530. [Google Scholar] [CrossRef]
- Han, K.; Shi, D.; Yang, L.; Wang, Z.; Li, Y.; Gao, F.; Liu, Y.; Ma, X.; Zhou, Y. Prognostic value of systemic inflammatory response index in patients with acute coronary syndrome undergoing percutaneous coronary intervention. Ann. Med. 2022, 54, 1667–1677. [Google Scholar] [CrossRef] [PubMed]
- Zhang, Y.; Xing, Z.; Zhou, K.; Jiang, S. The Predictive Role of Systemic Inflammation Response Index (SIRI) in the Prognosis of Stroke Patients. Clin. Interv. Aging 2021, 16, 1997–2007. [Google Scholar] [CrossRef]
- Minogue, A.M. Role of infiltrating monocytes/macrophages in acute and chronic neuroinflammation: Effects on cognition, learning and affective behaviour. Prog. Neuropsychopharmacol. Biol. Psychiatry 2017, 79 Pt A, 15–18. [Google Scholar] [CrossRef]
- Chen, H.-R.; Chen, C.-W.; Kuo, Y.-M.; Chen, B.; Kuan, I.S.; Huang, H.; Lee, J.; Anthony, N.; Kuan, C.-Y.; Sun, Y.-Y. Monocytes promote acute neuroinflammation and become pathological microglia in neonatal hypoxic-ischemic brain injury. Theranostics 2022, 12, 512–529. [Google Scholar] [CrossRef]
- Gong, P.; Liu, Y.; Gong, Y.; Chen, G.; Zhang, X.; Wang, S.; Zhou, F.; Duan, R.; Chen, W.; Huang, T.; et al. The association of neutrophil to lymphocyte ratio, platelet to lymphocyte ratio, and lymphocyte to monocyte ratio with post-thrombolysis early neurological outcomes in patients with acute ischemic stroke. J. Neuroinflamm. 2021, 18, 51. [Google Scholar] [CrossRef]
- Harms, A.S.; Ferreira, S.A.; Romero-Ramos, M. Periphery and brain, innate and adaptive immunity in Parkinson’s disease. Acta Neuropathol. 2021, 141, 527–545. [Google Scholar] [CrossRef] [PubMed]
- Mantovani, A.; Cassatella, M.A.; Costantini, C.; Jaillon, S. Neutrophils in the activation and regulation of innate and adaptive immunity. Nat. Rev. Immunol. 2011, 11, 519–531. [Google Scholar] [CrossRef] [PubMed]
- Dadouli, K.; Janho, M.B.; Hatziefthimiou, A.; Voulgaridi, I.; Piaha, K.; Anagnostopoulos, L.; Ntellas, P.; Mouchtouri, V.A.; Bonotis, K.; Christodoulou, N.; et al. Neutrophil-to-Lymphocyte, Monocyte-to-Lymphocyte, Platelet-to-Lymphocyte Ratio and Systemic Immune-Inflammatory Index in Different States of Bipolar Disorder. Brain Sci. 2022, 12, 1034. [Google Scholar] [CrossRef]
- Chen, J.-H.; Zhai, E.-T.; Yuan, Y.-J.; Wu, K.-M.; Xu, J.-B.; Peng, J.-J.; Chen, C.-Q.; He, Y.-L.; Cai, S.-R. Systemic immune-inflammation index for predicting prognosis of colorectal cancer. World J. Gastroenterol. 2017, 23, 6261–6272. [Google Scholar] [CrossRef]
- Li, S.; Xu, H.; Wang, W.; Gao, H.; Li, H.; Zhang, S.; Xu, J.; Zhang, W.; Xu, S.; Li, T.; et al. The systemic inflammation response index predicts survival and recurrence in patients with resectable pancreatic ductal adenocarcinoma. Cancer Manag. Res. 2019, 11, 3327–3337. [Google Scholar] [CrossRef]
- Kempuraj, D.; Selvakumar, G.P.; Ahmed, M.E.; Raikwar, S.P.; Thangavel, R.; Khan, A.; Zaheer, S.A.; Iyer, S.S.; Burton, C.; James, D.; et al. COVID-19, Mast Cells, Cytokine Storm, Psychological Stress, and Neuroinflammation. Neurosci. Rev. J. Bringing Neurobiol. Neurol. Psychiatry 2020, 26, 402–414. [Google Scholar] [CrossRef]
- Jakobsson, J.; Bjerke, M.; Sahebi, S.; Isgren, A.; Ekman, C.J.; Sellgren, C.; Olsson, B.; Zetterberg, H.; Blennow, K.; Pålsson, E.; et al. Monocyte and microglial activation in patients with mood-stabilized bipolar disorder. J. Psychiatry Neurosci. 2015, 40, 250–258. [Google Scholar] [CrossRef]
- Barbosa, I.G.; Rocha, N.P.; Assis, F.; Vieira, L.M.; Soares, J.C.; Bauer, M.E.; Teixeira, A.L. Monocyte and lymphocyte activation in bipolar disorder: A new piece in the puzzle of immune dysfunction in mood disorders. Int. J. Neuropsychopharmacol. 2014, 18, pyu021. [Google Scholar] [CrossRef]
- Ceylan, M.F.; Tural Hesapcioglu, S.; Kasak, M.; Senat, A.; Erel, O. Increased prolidase activity and high blood monocyte counts in pediatric bipolar disorder. Psychiatry Res. 2019, 271, 360–364. [Google Scholar] [CrossRef]
- Wei, Y.; Wang, T.; Li, G.; Feng, J.; Deng, L.; Xu, H.; Yin, L.; Ma, J.; Chen, D.; Chen, J. Investigation of systemic immune-inflammation index, neutrophil/high-density lipoprotein ratio, lymphocyte/high-density lipoprotein ratio, and monocyte/high-density lipoprotein ratio as indicators of inflammation in patients with schizophrenia and bipolar disorder. Front. Psychiatry 2022, 13, 941728. [Google Scholar] [CrossRef]
- Mazza, M.G.; Lucchi, S.; Tringali, A.G.M.; Rossetti, A.; Botti, E.R.; Clerici, M. Neutrophil/lymphocyte ratio and platelet/lymphocyte ratio in mood disorders: A meta-analysis. Prog. Neuropsychopharmacol. Biol. Psychiatry 2018, 84 Pt A, 229–236. [Google Scholar] [CrossRef]
- Inanli, I.; Aydin, M.; Çaliskan, A.M.; Eren, I. Neutrophil/lymphocyte ratio, monocyte/lymphocyte ratio, and mean platelet volume as systemic inflammatory markers in different states of bipolar disorder. Nord. J. Psychiatry 2019, 73, 372–379. [Google Scholar] [CrossRef]
- Wei, Y.; Feng, J.; Ma, J.; Chen, D.; Chen, J. Neutrophil/lymphocyte, platelet/lymphocyte and monocyte/lymphocyte ratios in patients with affective disorders. J. Affect. Disord. 2022, 309, 221–228. [Google Scholar] [CrossRef]
- Marazziti, D.; Torrigiani, S.; Carbone, M.G.; Mucci, F.; Flamini, W.; Ivaldi, T.; Dell’Osso, L. Neutrophil/Lymphocyte, Platelet/Lymphocyte, and Monocyte/Lymphocyte Ratios in Mood Disorders. Curr. Med. Chem. 2022, 29, 5758–5781. [Google Scholar] [CrossRef] [PubMed]
- Özdin, S.; Sarisoy, G.; Böke, Ö. A comparison of the neutrophil-lymphocyte, platelet-lymphocyte and monocyte-lymphocyte ratios in schizophrenia and bipolar disorder patients—A retrospective file review. Nord. J. Psychiatry 2017, 71, 509–512. [Google Scholar] [CrossRef]
- Fekadu, A.; Donocik, J.G.; Cleare, A.J. Standardisation framework for the Maudsley staging method for treatment resistance in depression. BMC Psychiatry 2018, 18, 100. [Google Scholar] [CrossRef]
- Fekadu, A.; Wooderson, S.C.; Markopoulou, K.; Cleare, A.J. The Maudsley Staging Method for treatment-resistant depression: Prediction of longer-term outcome and persistence of symptoms. J. Clin. Psychiatry 2009, 70, 952–957. [Google Scholar] [CrossRef]
- Zimmerman, M.; Martinez, J.H.; Young, D.; Chelminski, I.; Dalrymple, K. Severity classification on the Hamilton Depression Rating Scale. J. Affect. Disord. 2013, 150, 384–388. [Google Scholar] [CrossRef]
- Thompson, E. Hamilton Rating Scale for Anxiety (HAM-A). Occup. Med. Oxf. Engl. 2015, 65, 601. [Google Scholar] [CrossRef]
- Busner, J.; Targum, S.D. The clinical global impressions scale: Applying a research tool in clinical practice. Psychiatry 2007, 4, 28–37. [Google Scholar]
- Posner, K.; Brown, G.K.; Stanley, B.; Brent, D.A.; Yershova, K.V.; Oquendo, M.A.; Currier, G.W.; Melvin, G.A.; Greenhill, L.; Shen, S.; et al. The Columbia-Suicide Severity Rating Scale: Initial validity and internal consistency findings from three multisite studies with adolescents and adults. Am. J. Psychiatry 2011, 168, 1266–1277. [Google Scholar] [CrossRef] [PubMed]
- Brundin, L.; Sellgren, C.M.; Lim, C.K.; Grit, J.; Pålsson, E.; Landén, M.; Samuelsson, M.; Lundgren, K.; Brundin, P.; Fuchs, D.; et al. An enzyme in the kynurenine pathway that governs vulnerability to suicidal behavior by regulating excitotoxicity and neuroinflammation. Transl. Psychiatry 2016, 8, e865. [Google Scholar] [CrossRef] [PubMed]
- Singh, S.; Anshita, D.; Ravichandiran, V. MCP-1: Function, regulation, and involvement in disease. Int. Immunopharmacol. 2021, 101 Pt B, 107598. [Google Scholar] [CrossRef]
- Dudek, K.A.; Dion-Albert, L.; Kaufmann, F.N.; Tuck, E.; Lebel, M.; Menard, C. Neurobiology of resilience in depression: Immune and vascular insights from human and animal studies. Eur. J. Neurosci. 2021, 53, 183–221. [Google Scholar] [CrossRef] [PubMed]
- Miller, A.H.; Maletic, V.; Raison, C.L. Inflammation and its discontents: The role of cytokines in the pathophysiology of major depression. Biol. Psychiatry 2009, 65, 732–741. [Google Scholar] [CrossRef]
- Köhler, C.A.; Freitas, T.H.; Maes, M.; De Andrade, N.Q.; Liu, C.S.; Fernandes, B.S.; Stubbs, B.; Solmi, M.; Veronese, N.; Herrmann, N.; et al. Peripheral cytokine and chemokine alterations in depression: A meta-analysis of 82 studies. Acta Psychiatr. Scand. 2017, 135, 373–387. [Google Scholar] [CrossRef]
- Felger, J.C.; Haroon, E.; Patel, T.A.; Goldsmith, D.R.; Wommack, E.C.; Woolwine, B.J.; Le, N.-A.; Feinberg, R.; Tansey, M.G.; Miller, A.H. What does plasma CRP tell us about peripheral and central inflammation in depression? Mol. Psychiatry 2020, 25, 1301–1311. [Google Scholar] [CrossRef]
- Minelli, A.; Zanardini, R.; Abate, M.; Bortolomasi, M.; Gennarelli, M.; Bocchio-Chiavetto, L. Vascular Endothelial Growth Factor (VEGF) serum concentration during electroconvulsive therapy (ECT) in treatment resistant depressed patients. Prog. Neuropsychopharmacol. Biol. Psychiatry 2011, 35, 1322–1325. [Google Scholar] [CrossRef]
- Viikki, M.; Anttila, S.; Kampman, O.; Illi, A.; Huuhka, M.; Setälä-Soikkeli, E.; Mononen, N.; Lehtimäki, T.; Leinonen, E. Vascular endothelial growth factor (VEGF) polymorphism is associated with treatment resistant depression. Neurosci. Lett. 2010, 477, 105–108. [Google Scholar] [CrossRef]
- Castillo, M.F.R.; Cohen, A.; Edberg, D.; Hoppensteadt, D.; Fareed, J.; Martin, B.; Halaris, A. Vascular endothelial growth factor in bipolar depression: A potential biomarker for diagnosis and treatment outcome prediction. Psychiatry Res. 2020, 284, 112781. [Google Scholar] [CrossRef]
- Kranaster, L.; Blennow, K.; Zetterberg, H.; Sartorius, A. Reduced vascular endothelial growth factor levels in the cerebrospinal fluid in patients with treatment resistant major depression and the effects of electroconvulsive therapy—A pilot study. J. Affect. Disord. 2019, 253, 449–453. [Google Scholar] [CrossRef] [PubMed]
- Tsai, S.-J.; Kao, C.-F.; Su, T.-P.; Li, C.-T.; Lin, W.-C.; Hong, C.-J.; Bai, Y.-M.; Tu, P.-C.; Chen, M.-H. Cytokine- and Vascular Endothelial Growth Factor-Related Gene-Based Genome-Wide Association Study of Low-Dose Ketamine Infusion in Patients with Treatment-Resistant Depression. CNS Drugs 2023, 37, 243–253. [Google Scholar] [CrossRef] [PubMed]
- Fukuda, A.M.; Hindley, L.E.; Kang, J.W.D.; Tirrell, E.; Tyrka, A.R.; Ayala, A.; Carpenter, L.L. Peripheral vascular endothelial growth factor changes after transcranial magnetic stimulation in treatment-resistant depression. Neuroreport 2020, 31, 1121–1127. [Google Scholar] [CrossRef] [PubMed]
- Clark-Raymond, A.; Meresh, E.; Hoppensteadt, D.; Fareed, J.; Sinacore, J.; Garlenski, B.; Halaris, A. Vascular endothelial growth factor: Potential predictor of treatment response in major depression. World J. Biol. Psychiatry 2017, 18, 575–585. [Google Scholar] [CrossRef]
- Weiss, N.; Miller, F.; Cazaubon, S.; Couraud, P.O. The blood-brain barrier in brain homeostasis and neurological diseases. Biochim. Biophys. Acta 2009, 1788, 842–857. [Google Scholar] [CrossRef] [PubMed]
- Schaefer, A.; Journaux, M.; El Mourabit, H.; Mouri, S.; Wendum, D.; Lasnier, E.; Couraud, P.O.; Housset, C.; Thabut, D.; Rudler, M.; et al. A systemic mechanism of increased transendothelial migration of leukocytes through the blood-brain barrier in hepatic encephalopathy. Clin. Res. Hepatol. Gastroenterol. 2022, 46, 101801. [Google Scholar] [CrossRef]
- Miller, D.W. Immunobiology of the blood-brain barrier. J. Neurovirol. 1999, 5, 570–578. [Google Scholar] [CrossRef]
- Erickson, M.A.; Wilson, M.L.; Banks, W.A. In vitro modeling of blood-brain barrier and interface functions in neuroimmune communication. Fluids Barriers CNS 2020, 17, 26. [Google Scholar] [CrossRef]
- McKim, D.B.; Weber, M.D.; Niraula, A.; Sawicki, C.M.; Liu, X.; Jarrett, B.L.; Ramirez-Chan, K.; Wang, Y.; Roeth, R.M.; Sucaldito, A.D.; et al. Microglial recruitment of IL-1β-producing monocytes to brain endothelium causes stress-induced anxiety. Mol. Psychiatry 2018, 23, 1421–1431. [Google Scholar] [CrossRef]
- Hidalgo-Mazzei, D.; Berk, M.; Cipriani, A.; Cleare, A.J.; Di Florio, A.; Dietch, D.; Geddes, J.R.; Goodwin, G.M.; Grunze, H.; Hayes, J.F.; et al. Treatment-resistant and multi-therapy-resistant criteria for bipolar depression: Consensus definition. Br. J. Psychiatry J. Ment. Sci. 2019, 214, 27–35. [Google Scholar] [CrossRef]
| Outcome Variable: HAMD 17 Total (Week 8) | |||
|---|---|---|---|
| Predictors | Estimates | CI | p |
| (Intercept) | −15.64 | −56.10–24.83 | 0.438 |
| Sex (Female) | 4.39 | 0.15–8.63 | 0.043 |
| Age | 0.12 | −0.06–0.29 | 0.198 |
| log BMI | 4.61 | −6.91–16.14 | 0.422 |
| Treatment arm (CBX + ESC) | −5.3 | −9.89–−0.71 | 0.025 |
| HAMD17 (baseline) | 0.34 | −0.02–0.69 | 0.061 |
| log SIRI (baseline) | 2.48 | −1.34–6.29 | 0.196 |
| Observations | 43 | ||
| R2/R2 adjusted | 0.352/0.244 | ||
| Outcome Variable: HAMD 17 Total (Week 8) | |||
|---|---|---|---|
| Predictors | Estimates | CI | p |
| (Intercept) | −10.29 | −47.75–27.17 | 0.581 |
| Sex [Female] | 6.02 | 1.93–10.11 | 0.005 |
| Age | 0.05 | −0.12–0.22 | 0.525 |
| log BMI | 3.31 | −7.35–13.96 | 0.533 |
| Arm [CBX + ESC] | −5.13 | −9.36–−0.90 | 0.019 |
| HAMD17 (baseline) | 0.42 | 0.09–0.75 | 0.014 |
| log SIRI (baseline) | −17.85 | −33.26–−2.44 | 0.024 |
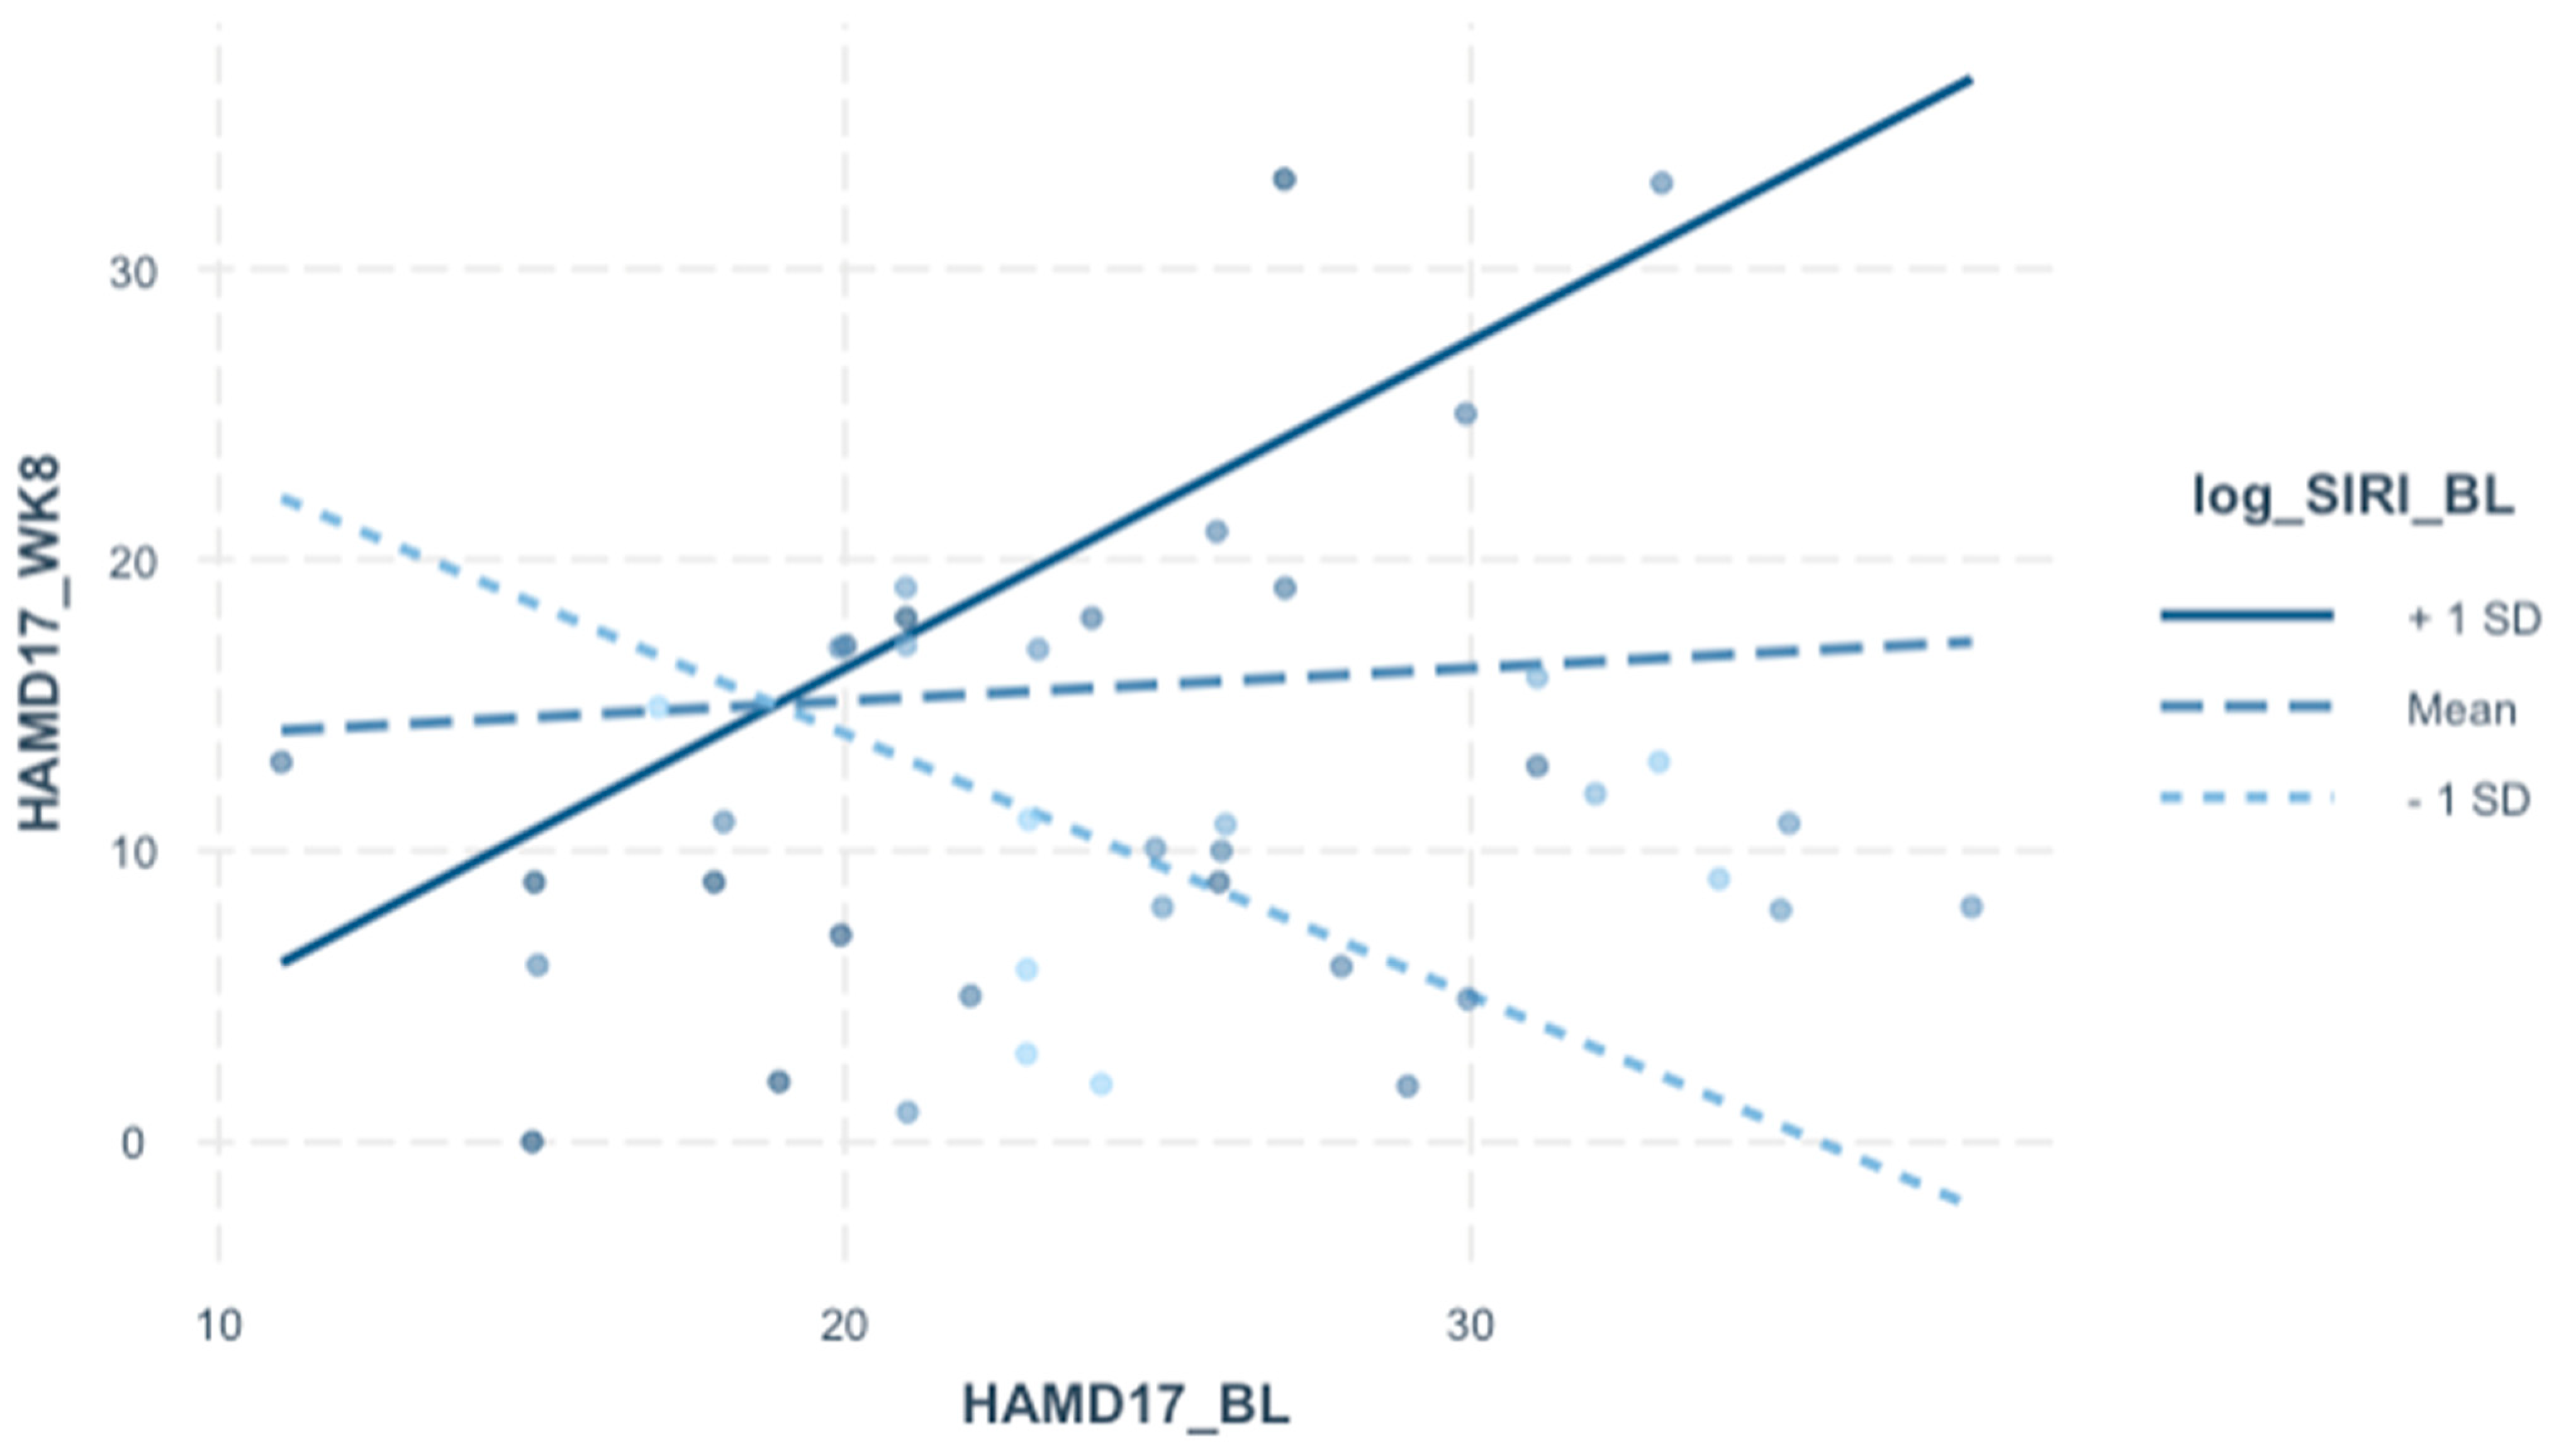
| HAMD17 (baseline) × log SIRI (baseline) | 0.91 | 0.24–1.59 | 0.009 |
| Observations | 43 | ||
| R2/R2 adjusted | 0.467/0.361 | ||
Disclaimer/Publisher’s Note: The statements, opinions and data contained in all publications are solely those of the individual author(s) and contributor(s) and not of MDPI and/or the editor(s). MDPI and/or the editor(s) disclaim responsibility for any injury to people or property resulting from any ideas, methods, instructions or products referred to in the content. |
© 2023 by the authors. Licensee MDPI, Basel, Switzerland. This article is an open access article distributed under the terms and conditions of the Creative Commons Attribution (CC BY) license (https://creativecommons.org/licenses/by/4.0/).
Share and Cite
Murata, S.; Baig, N.; Decker, K.; Halaris, A. Systemic Inflammatory Response Index (SIRI) at Baseline Predicts Clinical Response for a Subset of Treatment-Resistant Bipolar Depressed Patients. J. Pers. Med. 2023, 13, 1408. https://doi.org/10.3390/jpm13091408
Murata S, Baig N, Decker K, Halaris A. Systemic Inflammatory Response Index (SIRI) at Baseline Predicts Clinical Response for a Subset of Treatment-Resistant Bipolar Depressed Patients. Journal of Personalized Medicine. 2023; 13(9):1408. https://doi.org/10.3390/jpm13091408
Chicago/Turabian StyleMurata, Stephen, Nausheen Baig, Kyle Decker, and Angelos Halaris. 2023. "Systemic Inflammatory Response Index (SIRI) at Baseline Predicts Clinical Response for a Subset of Treatment-Resistant Bipolar Depressed Patients" Journal of Personalized Medicine 13, no. 9: 1408. https://doi.org/10.3390/jpm13091408