Gene Environment Interactions and Predictors of Colorectal Cancer in Family-Based, Multi-Ethnic Groups


Abstract
:1. Introduction
2. Results
2.1. Characteristics of Study Participants
2.2. Most Influential Predictors per Category—The Ensemble Method
2.3. Predictors for Gene–Environment Interaction
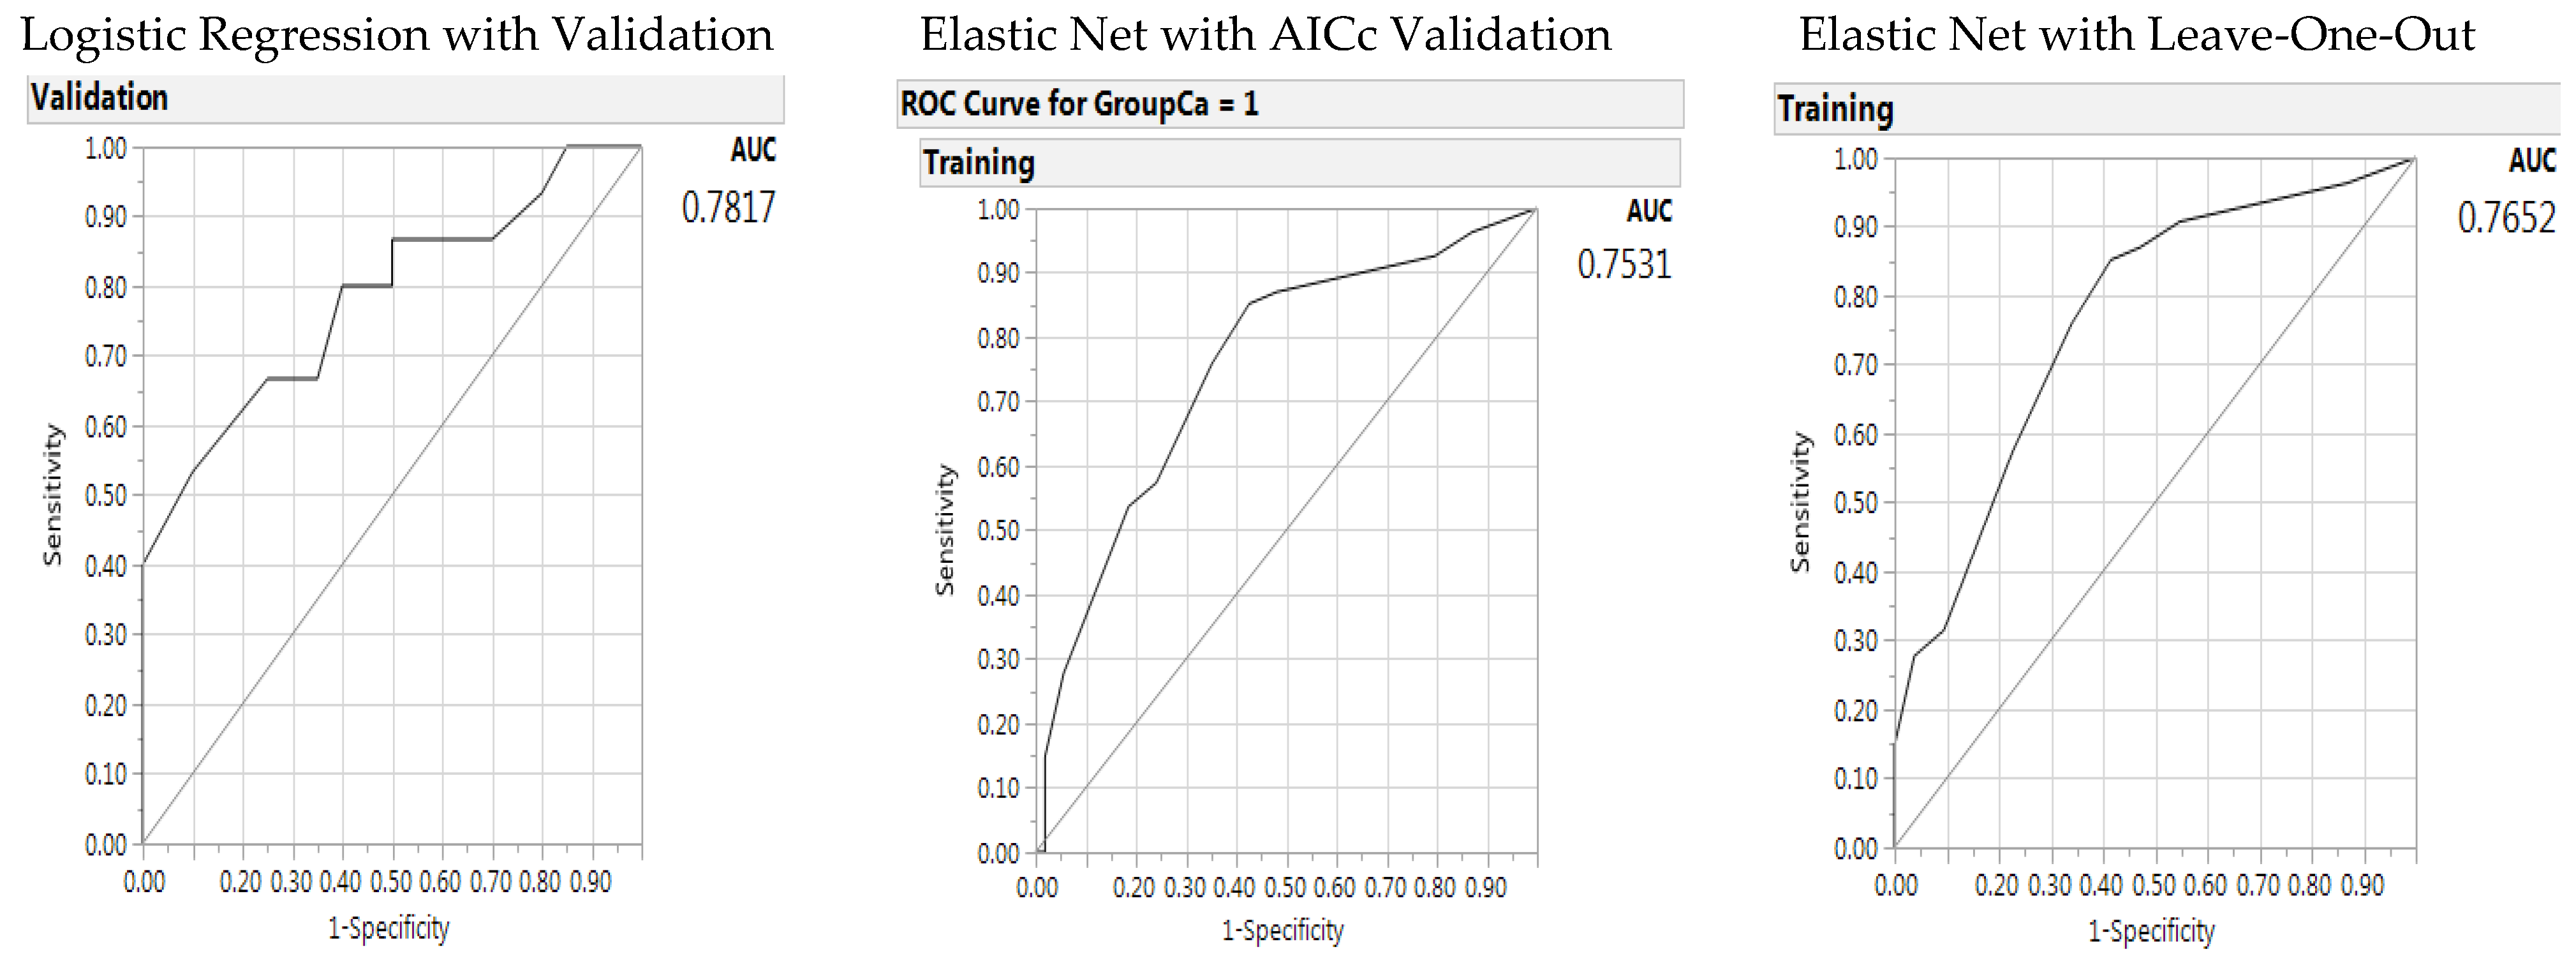
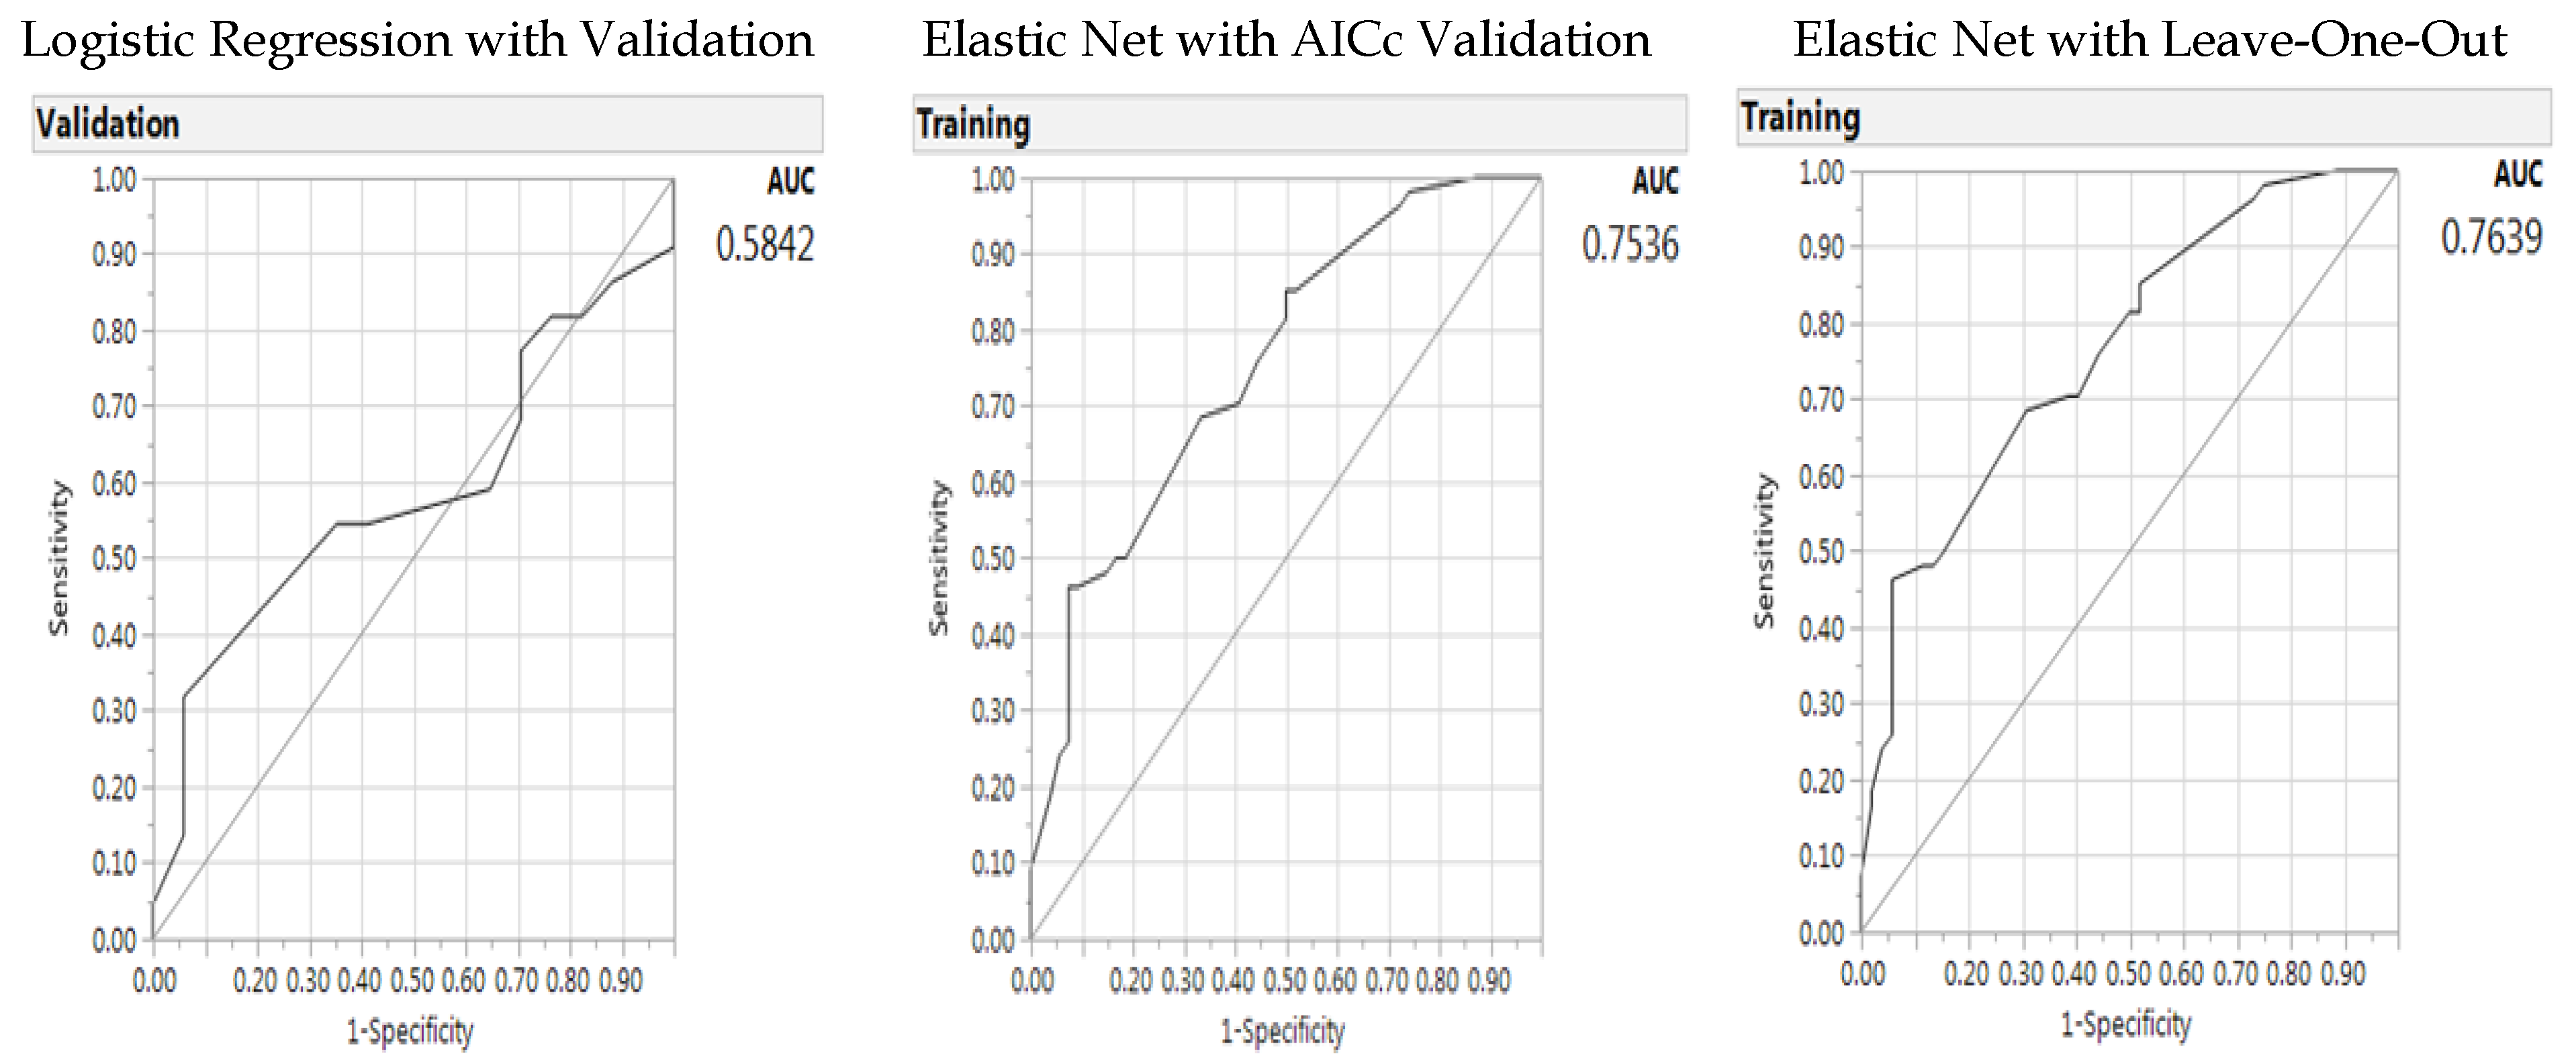
2.4. Predictive Modeling for Gene–Environment Interactions—Generalized Regression Analysis
3. Discussion
4. Materials and Method
4.1 Study Population and Setting
4.2 Demographic/Environmental and Lifestyle Data
4.3 Genotyping Data
4.4 Data Analysis
Acknowledgments
Author Contributions
Conflicts of Interest
References
- Magalhães, B.; Peleteiro, B.; Lunet, N. Dietary patterns and colorectal cancer: Systematic review and meta-analysis. Eur. J. Cancer. Prev. 2012, 21, 15–23. [Google Scholar] [CrossRef] [PubMed]
- Fan, Y.; Jin, X.; Man, C.; Gao, Z.; Wang, X. Meta-analysis of the association between the inflammatory potential of diet and colorectal cancer risk. Oncotarget 2017, 8, 59592–59600. [Google Scholar] [CrossRef] [PubMed]
- Tárraga López, P.J.; Albero, J.S.; Rodríguez-Montes, J.A. Primary and secondary prevention of colorectal cancer. Clin. Med. Insights. Gastroenterol. 2014, 7, 33–46. [Google Scholar] [CrossRef]
- Cavicchia, P.P.; Steck, S.E.; Hurley, T.G.; Hussey, J.R.; Ma, Y.; Ockene, I.S.; Hebert, J.R. A new dietary inflammatory index predicts interval changes in serum high-sensitivity C-reactive protein. J. Nutr. 2009, 139, 2365–2372. [Google Scholar] [CrossRef] [PubMed]
- Shivappa, N.; Steck, S.E.; Hurley, T.G.; Hussey, J.R.; Hebert, J.R. Designing and developing a literature-derived, population-based dietary inflammatory index. Public. Health Nutr. 2014, 17, 1689–1696. [Google Scholar] [CrossRef] [PubMed]
- Johnson, C.M.; Wei, C.; Ensor, J.E.; Smolenski, D.J.; Amos, C.I.; Levin, B.; Berry, D.A. Meta-analyses of colorectal cancer risk factors. Cancer Causes Control. 2013, 24, 1207–1222. [Google Scholar] [CrossRef] [PubMed]
- Holden, D.J.; Harris, R.; Porterfield, D.S.; Jones, D.E.; Morgan, L.C.; Reuland, D.; Gilehrist, M.; Viswanathan, M.; Lohr, K.N.; Lynda-MdDonald, B. Enhancing the use of quality of colorectal cancer screening. Evidence Report- Technology Assessment No. 190; Agency for Health Care Research and Quality, Publication No. 10-E002; Agency for Healthcare Research and Quality: Rockville, MD, USA, 2010. [Google Scholar]
- Visser, A.; Vrieling, A.; Murugesu, L.; Hoogerbrugge, N.; Kampman, E.; Hoedjes, M. Determinants of adherence to recommendations for cancer prevention among Lynch Syndrome mutation carriers: A qualitative exploration. PLoS ONE 2017, 12, e0178205. [Google Scholar] [CrossRef] [PubMed]
- Campbell, P.T.; Curtin, K.; Ulrich, C.M.; Samowitz, W.S.; Bigler, J.; Velicer, C.M.; Caan, B.; Potter, J.D.; Slattery, M.L. Mismatch repair polymorphisms and risk of colon cancer, tumour microsatellite instability and interactions with lifestyle factors. Gut 2009, 58, 661–667. [Google Scholar] [CrossRef] [PubMed]
- Kennedy, D.A.; Stern, S.J.; Matok, I.; Moretti, M.E.; Sarkar, M.; Adams-Webber, T.; Koren, G. Folate intake, MTHFR polymorphisms, and the risk of colorectal cancer: A systematic review and meta-analysis. J. Cancer Epidemiol. 2012, 2012, 952508. [Google Scholar] [CrossRef] [PubMed]
- Shiao, S.P.K.; Yu, C.H. Meta-prediction of MTHFR gene polymorphism mutations and associated risks for colorectal cancer. Biol. Res. Nurs. 2016, 18, 357–369. [Google Scholar] [CrossRef] [PubMed]
- Taioli, E.; Garza, M.A.; Ahn, Y.O.; Bishop, D.T.; Bost, J.; Budai, B.; Chen, K.; Gemignani, F.; Keku, T.; Lima, C.S.; et al. Meta- and pooled analyses of the methylenetetrahydrofolate reductase (MTHFR) C677T polymorphism and colorectal cancer: A HuGE-GSEC review. Am. J. Epidemiol. 2009, 170, 1207–1221. [Google Scholar] [CrossRef] [PubMed]
- Zacho, J.; Yazdanyar, S.; Bojesen, S.E.; Tybjærg-Hansen, A.; Nordestgaard, B.G. Hyperhomocysteinemia, methylenetetrahydrofolate reductase c.677C>T polymorphism and risk of cancer: Cross-sectional and prospective studies and meta-analyses of 75,000 cases and 93,000 controls. Int. J. Cancer 2012, 128, 644–652. [Google Scholar] [CrossRef] [PubMed]
- Zhang, D.; Wen, X.; Wu, W.; Guo, Y.; Cui, W. Elevated homocysteine level and folate deficiency associated with increased overall risk of carcinogenesis: Meta-analysis of 83 case-control studies involving 35,758 individuals. PLoS ONE 2015, 10, e0123423. [Google Scholar] [CrossRef] [PubMed]
- Lievers, K.J.; Boers, G.H.; Verhoef, P.; Heijer, M.; Kluijtmans, L.A.; Put, N.M.; Trijbels, F.J.; Blom, H.J. A second common variant in the methylenetetrahydrofolate reductase (MTHFR) gene and its relationship to MTHFR enzyme activity, homocysteine, and cardiovascular disease risk. J. Mol. Med. 2001, 79, 522–528. [Google Scholar] [CrossRef] [PubMed]
- McBride, C. Applications of genomics to improve public health. NHGRI 2012 Current Topics in Genome Analysis. April 2012. Available online: http://www.youtube.com/watch?v=bEbSpJ5pEKg&list=PLF09DBAA3E24C5068&index=12&feature=plpp_video (accessed on 7 November 2012).
- Wade, D.H.; McBride, C.M.; Kardia, S.L.R.; Brody, L.C. Considerations for designing a prototype genetic test for use in translational research. Public Health Genomics 2010, 13, 155–165. [Google Scholar] [CrossRef] [PubMed]
- Klai, S.; Fekih-Mrissa, N.; El Housaini, S.; Kaabechi, N.; Nsiri, B.; Rachdi, R.; Gritli, N. Association of MTHFR A1298C polymorphism (but not of MTHFR C677T) with elevated homocysteine levels and placental vasculopathies. Blood Coagul. Fibrinolysis 2011, 22, 374–378. [Google Scholar] [CrossRef] [PubMed]
- Yang, B.; Liu, Y.; Li, Y.; Fan, S.; Zhi, X.; Lu, X.; Wang, D.; Zheng, Q.; Wang, Y.; Wang, Y. Geographical distribution of MTHFR C677T, A1298C and MTRR A66G gene polymorphisms in China: Findings from 15357 adults of Han nationality. PLoS ONE 2013, 8, e57917. [Google Scholar] [CrossRef] [PubMed]
- Frosst, P.; Blom, H.J.; Milos, R.; Goyette, P.; Sheppard, C.A.; Matthews, R.G.; Boers, G.J.; den Heijer, M.; Kluijtmans, L.A.; van den Heuvel, L.P.; et al. A candidate genetic risk factor for vascular disease: A common mutation in methylenetetrahydrofolate reductase. Nat. Genet. 1995, 10, 111–113. [Google Scholar] [CrossRef] [PubMed]
- Yaliwal, L.V.; Desai, R.M. Methylenetetrahydrofolate reductase mutations, a genetic cause for familial recurrent neural tube defects. Indian J. Hum. Genet. 2012, 18, 122–124. [Google Scholar] [CrossRef] [PubMed]
- Ravegnini, G.; Zolezzi Moraga, J.M.; Maffei, F.; Musti, M.; Zenesini, C.; Simeon, V.; Sammarini, G.; Festi, D.; Hrelia, P.; Angelini, S. Simultaneous analysis of SEPT9 promoter methylation status, micronuclei frequency, and folate-related gene polymorphisms: The potential for a novel blood-based colorectal cancer biomarker. Int. J. Mol. Sci. 2015, 16, 28486–28497. [Google Scholar] [CrossRef] [PubMed]
- Selhub, J.; Rosenberg, I.H. Excessive folic acid intake and relation to adverse health outcome. Biochimie. 2016, 126, 71–78. [Google Scholar] [CrossRef] [PubMed]
- Cheng, T.Y.; Makar, K.W.; Neuhouser, M.L.; Miller, J.W.; Song, X.; Brown, E.C.; Beresford, S.A.; Zheng, Y.; Poole, E.M.; Galbraith, R.L.; et al. Folate-mediated one-carbon metabolism genes and interactions with nutritional factors on colorectal cancer risk: Women's Health Initiative Observational Study. Cancer 2015, 121, 3684–3691. [Google Scholar] [CrossRef] [PubMed]
- Li, W.X.; Dai, S.X.; Zheng, J.J.; Liu, J.Q.; Huang, J.F. Homocysteine metabolism gene polymorphisms (MTHFR C677T, MTHFR A1298C, MTR A2756G and MTRR A66G) jointly elevate the risk of folate deficiency. Nutrients 2015, 7, 6670–6687. [Google Scholar] [CrossRef] [PubMed]
- Lucock, M.; Yates, Z.; Martin, C.; Choi, J.H.; Beckett, E.; Boyd, L.; LeGras, K.; Ng, X.; Skinner, V.; Wai, R.; et al. Methylation diet and methyl group genetics in risk for adenomatous polyp occurrence. BBA Clin. 2015, 3, 107–112. [Google Scholar] [CrossRef] [PubMed]
- Zhou, D.; Mei, Q.; Luo, H.; Tang, B.; Yu, P. The polymorphisms in methylenetetrahydrofolate reductase, methionine synthase, methionine synthase reductase, and the risk of colorectal cancer. Int. J. Biol. Sci. 2012, 8, 819–830. [Google Scholar] [CrossRef] [PubMed]
- Cadet, J.; Douki, T.; Ravanat, J.L. Oxidatively generated base damage to cellular DNA. Free Radic. Med. 2010, 49, 9–21. [Google Scholar] [CrossRef] [PubMed]
- Hair, J.M.; Terzoudi, G.I.; Hatzi, V.I.; Lehockey, K.A.; Srivastava, D.; Wang, W.; Pantelias, G.E.; Georgakilas, A.G. BRCA1 role in the mitigation of radiotoxicity and chromosomal instability through repair of clustered DNA lesions. Chem. Biol. Interact. 2010, 188, 188–358. [Google Scholar] [CrossRef] [PubMed]
- Baccarelli, A.; Cassano, P.A.; Litonjua, A.; Park, S.K.; Suh, H.; Sparrow, D.; Vokonas, P.; Schwartz, J. Cardiac autonomic dysfunction: Effects from particulate air pollution and protection by dietary methyl nutrients and metabolic polymorphisms. Circulation 2008, 117, 1802–1809. [Google Scholar] [CrossRef] [PubMed]
- Shiao, S.P.; Yu, C.H. Meta-Prediction of MTHFR gene polymorphism mutations and associated risk for colorectal cancer. Biol. Res. Nurs. 2016, 18, 357–369. [Google Scholar] [CrossRef] [PubMed]
- Wu, S.-M.; Chen, Z.-F.; Young, L.; Shiao, S.P.K. Meta-prediction of the effects of methylenetetrahydrofolate reductase gene polymorphisms and air pollution on risk of Alzheimer’s disease. Int. J. Environ. Res. Public Health 2017, 14, 63. [Google Scholar] [CrossRef] [PubMed]
- Lien, S.-Y.A.; Young, L.; Gau, B.-S.; Shiao, S.P.K. Meta-prediction of MTHFR gene polymorphism-mutations, air pollution, and risks of leukemia among world populations. Oncotarget 2017, 8, 4387–4398. [Google Scholar] [CrossRef] [PubMed]
- Gonzales, M.C.; Yu, P.-J.; Shiao, S.P.K. Meta-prediction of MTHFR gene polymorphism-mutations and air pollution as risk factors for breast cancer. Nursing Research 2017, 66, 152–163. [Google Scholar] [CrossRef] [PubMed]
- Yang, Y.L.; Yang, H.L.; Shiao, S.P.K. Meta-prediction of MTHFR gene polymorphisms and air pollution on the risk of hypertensive disorders in pregnancy worldwide. Int. J. Environ. Res. Public Health 2018, 15, 326. [Google Scholar] [CrossRef] [PubMed]
- Simidjievski, N.; Todorovski, L.; Džeroski, S. Modeling dynamic systems with efficient ensembles of process-based models. PLoS ONE 2016, 11, e0153507. [Google Scholar] [CrossRef] [PubMed]
- Khalilia, M.; Chakraborty, S.; Popescu, M. Predicting disease risks from highly imbalanced data using random forest. BMC Med. Inform. Decis. Mak. 2011, 11, 51. [Google Scholar] [CrossRef] [PubMed]
- Islam, M.M.; Yao, X.; Shahriar Nirjon, S.M.; Islam, M.A.; Murase, K. Bagging and boosting negatively correlated neural networks. IEEE Trans. Syst. Man. Cybern. B. Cybern. 2008, 38, 771–784. [Google Scholar] [CrossRef] [PubMed]
- Wang, C.W. New ensemble machine learning method for classification and prediction on gene expression data. Conf. Proc. IEEE Eng. Med. Biol. Soc. 2006, 1, 3478–3481. [Google Scholar] [PubMed]
- Friedman, J.; Hastie, T.; Tibshirani, R. Regularization paths for generalized linear models via coordinate descent. J. Stat. Softw. 2010, 33, 1–22. [Google Scholar] [PubMed]
- Song, L.; Langfelder, P.; Horvath, S. Random generalized linear model: a highly accurate and interpretable ensemble predictor. BMC Bioinformatics 2013, 14, 5. [Google Scholar] [CrossRef] [PubMed]
- Witten, D.M.; Tibshirani, R. Covariance-regularized regression and classification for high-dimensional problems. J. R. Stat. Soc. Series B. Stat. Methodol. 2009, 71, 615–636. [Google Scholar] [CrossRef] [PubMed]
- Wu, Y. Elastic Net for Cox’s proportional hazards model with a solution path algorithm. Stat. Sin. 2012, 22, 27–294. [Google Scholar] [PubMed]
- Zhao, L.P.; Le Marchand, L. An analytical method for assessing patterns of familial aggregation in case-control studies. Genet Epidemiol. 1992, 9, 141–154. [Google Scholar] [CrossRef] [PubMed]
- Diaconis, P.; Efron, B. Computer-intensive methods in statistics. Scientific American 1983, 248, 116–130. [Google Scholar] [CrossRef]
- Yu, C.H. Resampling: A Conceptual and Procedural Introduction. In Best Practices in Quantitative Methods; Osborne, Jason, Ed.; Sage Publications: Thousand Oaks, CA, USA, 2007; pp. 283–298. [Google Scholar]
- Faraway, J.J. Extending the Linear Model with R: Generalized Linear, Mixed Effects and Nonparametric Regression Models (Texts in Statistical Science); Chapman & Hall/CRC: Boca Raton, FL, USA, 2005. [Google Scholar]
- National Coalition for Health Professional Education in Genetics. Family History Educational Aids. NCHPEG. Available online: http://www.nchpeg.org/index.php?option=com_content&view=article&id=145&Itemid=64 (accessed on 10 October 2016).
- Krist, A.H.; Glenn, B.A.; Glasgow, R.E.; Balasubramanian, B.A.; Chambers, D.A.; Fernandez, M.E.; Heurtin-Roberts, S.; Kessler, R.; Ory, M.G.; Phillips, S.M.; et al. Designing a valid randomized pragmatic primary care implementation trial: The my own health report (MOHR) project. Implement. Sci. 2013, 8, 73. [Google Scholar] [CrossRef] [PubMed]
- CDC. National Health and Nutrition Examination Survey. Center for Disease Control and Prevention, 2012. Available online: http://www.cdc.gov/nchs/nhanes/nhanes_questionnaires.htm (accessed on 15 December 2012).
- Institute of Medicine (IOM). An Integrated Framework for Assessing the Value of Community-Based Prevention. Institute of Medicine Consensus report. Available online: http://www.iom.edu/Reports/2012/An-Integrated-Framework-for-Assessing-the-Value-of-Community-Based-Prevention.aspx (accessed on 15 December 2012).
- World Health Organization (WHO). Cancer prevention; Health Impact of Chemicals; Toxicogenomics. Available online: http://www.who.int/cancer/prevention/en/; http://www.who.int/ipcs/assessment/en/; http://www.who.int/ipcs/methods/toxicogenomics/en/index.html (accessed on 15 December 2012).
- Sha, Q.; Zhang, S. A test of Hardy-Weinberg equilibrium in structured populations. Genet. Epidemiol. 2011, 35, 671–678. [Google Scholar] [CrossRef] [PubMed]
- Behrens, M.; Lange, R. A highly reproducible and economically competitive SNP analysis of several well characterized human mutations. Clin. Lab. 2004, 50, 305–316. [Google Scholar] [PubMed]
- Cenit, M.C.; Olivares, M.; Codoñer-Franch, P.; Sanz, Y. Intestinal microbiota and celiac disease: Cause, consequence or co-evolution? Nutrients 2015, 7, 6900–6923. [Google Scholar] [CrossRef] [PubMed]
- Wren, M.E.; Shirtcliff, E.A.; Drury, S.S. Not all biofluids are created equal: Chewing over salivary diagnostics and the epigenome. Clin. Ther. 2015, 37, 529–539. [Google Scholar] [CrossRef] [PubMed]
- Torres-Sánchez, L.; Chen, J.; Díaz-Sánchez, Y.; Palomeque, C.; Bottiglieri, T.; López-Cervantes, M.; López-Carrillo, L. Dietary and genetic determinants of homocysteine levels among Mexican women of reproductive age. Eur. J. Clin. Nutr. 2006, 60, 691–697. [Google Scholar] [PubMed]
- Weisberg, I.; Tran, P.; Christensen, B.; Sibani, S.; Rozen, R. A second genetic polymorphism in methylenetetrahydrofolate reductase (MTHFR) associated with decreased enzyme activity. Mol. Genet. Metab. 1998, 64, 169–172. [Google Scholar] [CrossRef] [PubMed]
- Grayson, J.; Gardner, S.; Stephens, M. Building Better Models with JMP® Pro. 2015; SAS Press: Cary, NC, USA, 2015. [Google Scholar]
- Klimberg, R.; McCullough, B.D. Fundamentals of predictive analytics with JMP, 2nd ed.; SAS Press: Cary, NC, USA, 2016. [Google Scholar]
- Meir, R.; Rätsch, G. An introduction to boosting and leveraging. In Advanced Lectures on Machine Learning. Lecture Notes in Computer Science; Mendelson, S., Smola, A.J., Eds.; Springer: Berlin, Germany, 2003; Volume 2600, pp. 118–183. [Google Scholar] [CrossRef]
- Zaman, M.F.; Hirose, H. Classification performance of bagging and boosting type ensemble methods with small training sets. New Generation Computing 2011, 29, 277–292. [Google Scholar] [CrossRef]
- Wujek, B. Machine learning; SAS Press: Cary, NC, USA, 2016. [Google Scholar]
- Burnham, K.P.; Anderson, D.R. Model Selection and Multimodel Inference: A Practical Information-Theoretic Approach, 2nd ed.; Springer-Verlag: New York, NY, USA, 2002. [Google Scholar]
- Burnham, K.P.; Anderson, D.R. Multimodel inference: Understanding AIC and BIC in model selection. Sociol. Meth. Res. 2004, 33, 261–304. [Google Scholar] [CrossRef]
- Yang, Y. Can the strengths of AIC and BIC be shared? Biometrika 2005, 92, 937–950. [Google Scholar] [CrossRef]
- Akaike, H. A new look at the statistical model identification. IEEE Trans. Autom. Control 1974, 19, 716–723. [Google Scholar] [CrossRef]
- Akaike, H. A Bayesian analysis of the minimum AIC procedure. Ann. Inst. Stat. Math. 1978, 30, 9–14. [Google Scholar] [CrossRef]
- SAS Institute Inc. JMP 13 Fitting Linear Models, 2nd ed.; SAS Institute Inc.: Cary, NC, USA, 2016. [Google Scholar]
- Cheng, H.; Garrick, D.J.; Fernando, R.L. Efficient strategies for leave-one-out cross validation for genomic best linear unbiased prediction. J. Anim. Sci. Biotechnol. 2017, 8, 38. [Google Scholar] [CrossRef] [PubMed]

| Factors | Control (n = 54) | Cancer (n = 54) | p-Value | |
|---|---|---|---|---|
| Gender | Male Female | 14 (25.9%) 40 (74.1%) | 25 (46.3%) 29 (53.7%) | 0.0275 |
| Marital Status | Married | 33 (61.1%) | 35 (64.8%) | 0.1739 |
| Health Status | Good/Excellent | 40 (74.1%) | 39 (72.2%) | 0.6878 |
| Age | Years (mean ± SD) (range) | 47.04 ± 17.16 (18–80) | 60.98 ± 10.86 (37– 79) | <0.0001 |
| Body Mass Index | Lean (<20) Normal (20–25) Overweight (25.1–29.9) Obese (>30) mean ± SD (range) | 2 (3.7%) 22 (40.7%) 18 (33.3%) 12 (22.2%) 27.8 ± 7.2 (17.2–49.1) | 2 (3.7%) 18 (33.3%) 18 (33.3%) 16 (29.6%) 27.4 ± 5.9 (19.0–54.0) | 0.8082 |
| Vegetable Intake/Day | ≥3 servings | 15 (27.8%) | 12 (22.2%) | 0.6779 |
| Fruit Intake/Day | ≥2 servings | 27 (50.0%) | 24 (44.4%) | 0.7345 |
| Whole Grain Intake/Day | ≥3 servings | 8 (14.8%) | 6 (11.1%) | 0.7821 |
| Liquid Intake/Day | ≥8 cups mean ± SD (range) | 16 (29.6%) 5.7 ± 1.6 (4–8) | 15 (27.8%) 5.6 ± 1.6 (4–8) | 0.9645 |
| Sleepy Days/Week | 0 days mean ± SD (range) | 10 (19.6%) 2.8 ± 2.4 (0–7) | 7 (13.0%) 3.2 ± 2.3 (0–7) | 0.7355 |
| Physical Activity | Minutes mean ± SD (range) ≥150 minutes per week | 48.1 ± 53.9 (0–360) 2 (3.7%) | 37.4 ± 41.8 (0–270) 1 (1.9%) | 0.2515 |
| Tobacco Use | Yes | 5 (9.3%) | 4 (7.4%) | 0.7277 |
| Alcohol Use | Yes | 24 (44.4%) | 32 (59.3%) | 0.1478 |
| Stress (0–10) | <5 mean ± SD (range) | 32 (59.3%) 4 ± 2.8 (0–10) | 31 (57.4%) 4.1 ± 3.0 (0–10) | 0.6671 |
| Nervous or Anxious | Not at all | 26 (48.1%) | 25 (46.3%) | 0.9971 |
| Depressed | Not at all | 36 (66.7%) | 34 (63.0%) | 0.3581 |
| Cognitive Capacity | Good/Excellent | 46 (85.2%) | 45 (83.3%) | 0.7418 |
| Functional Capacity | Good/Excellent | 49 (90.7%) | 45 (83.3%) | 0.7027 |
| Role Functions | Good/Excellent | 49 (90.7%) | 44 (81.5%) | 0.4913 |
| Spiritual Support | Good/Excellent | 39 (72.2%) | 45 (83.3%) | 0.2074 |
| Convenience to Healthcare | Good/Excellent | 50 (92.6%) | 52 (96.3%) | 0.2293 |
| Health Insurance Coverage | Good/Excellent | 44 (81.5%) | 47 (87.0%) | 0.1330 |
| Air Quality in Community | Good/Excellent | 34 (63.0%) | 29 (53.7%) | 0.7790 |
| Air Quality at Home | Good/Excellent | 12 (22.2%) | 13 (24.1%) | 0.6859 |
| Tobacco Use by Family Members | Yes | 5 (9.3%) | 6 (11.1%) | 0.7005 |
| Exposure to Pollutants | Yes | 5 (9.3%) | 14 (25.9%) | 0.0202 |
| Race | White Asian Hispanic African | 16 (29.6%) 23 (42.6%) 11 (20.4%) 4 (7.4%) | 18 (33.3%) 19 (35.2%) 12 (22.2%) 5 (9.3%) | 0.8842 |
| Factors | White (n = 34) | Asian (n = 42) | Hispanic (n = 23) | African (n = 9) | p-Value | |
|---|---|---|---|---|---|---|
| Gender | Male Female | 15 (44.1%) 19 (55.9%) | 13 (31.0%) 29 (69.0%) | 8 (34.8%) 15 (65.2%) | 3 (33.3%) 6 (66.7%) | 0.6876 |
| Marital Status | Married | 24 (70.6%) | 31 (73.8%) | 9 (39.1%) | 4 (44.4%) | 0.0658 |
| Health Status | Good/Excellent | 27 (79.4%) | 30 (71.4%) | 16 (69.6%) | 6 (66.7%) | 0.3674 |
| Age | Years (mean ± SD) (range) | 57.53 ± 2.73 (21–80) | 53.55 ± 2.45 (19–79) | 49.78 ± 3.31 (18–75) | 53.67 ± 5.30 (19–77) | 0.3478 |
| Body Mass Index | Lean (< 20) Normal (20–25) Overweight (25.1–29.9) Obese (> 30) mean ± SD (range) | 1 (2.9%) 8 (23.5%) 15 (44.1%) 10 (29.4%) 28.7 ± 6.5 (19–50.7) | 3 (7.1%) 27 (64.3%) 11 (26.2%) 1 (2.4%) 23.8 ± 2.9 (17.2–30) | 0 (0%) 4 (17.4%) 7 (30.4%) 12 (52.2%) 30.8 ± 6.9 (20.6–46) | 0 (0%) 1 (11.1%) 3 (33.3%) 5 (55.6%) 32.7 ± 9.3 (24.2–49.1) | <0.0001 |
| Vegetable Intake/Day | ≥3 servings | 11 (32.4%) | 13 (31.0%) | 2 (8.7%) | 1 (11.1%) | 0.1414 |
| Fruit Intake/Day | ≥2 servings | 15 (44.1%) | 22 (52.4%) | 10 (43.5%) | 4 (44.4%) | 0.3406 |
| Whole Grain Intake/Day | ≥3 servings | 7 (20.6%) | 4 (9.5%) | 2 (8.7%) | 1 (11.1%) | 0.3985 |
| Liquid Intake/Day | ≥8 cups | 10 (29.4%) | 12 (28.6%) | 7 (30.4%) | 2 (22.2%) | 0.4805 |
| Sleepy Days/Week | 0 days | 7 (20.6%) | 7 (16.7%) | 2 (8.7%) | 1 (11.1%) | 0.8448 |
| Physical Activity/Week | mean ± SD (range) ≥150 minutes | 39.3±35.2 (0–180) 1 (2.9%) | 43.9±54.5 (0–360) 1 (2.4%) | 54.1±59.2 (0–270) 1 (4.3%) | 21.7±17.7 (0–50) 0 (0%) | 0.1223 |
| Tobacco Use | Yes | 1 (2.9%) | 4 (9.5%) | 3 (13.0%) | 1 (11.1%) | 0.5457 |
| Alcohol Use | Yes | 27 (79.4%) | 13 (31.0%) | 14 (33.3%) | 2 (22.2%) | 0.0001 |
| Stress (0–10) | <5 | 15 (44.1%) | 28 (66.7%) | 14 (33.3%) | 6 (66.7%) | 0.1253 |
| Nervous or Anxious | Not at all | 14 (41.2%) | 20 (47.6%) | 11 (47.8%) | 6 (66.7%) | 0.4130 |
| Depressed | Not at all | 22 (64.7%) | 28 (66.7%) | 13 (56.5%) | 7 (77.8%) | 0.8608 |
| Cognitive Capacity | Good/Excellent | 31 (91.2%) | 34 (81.0%) | 19 (82.6%) | 7 (77.8%) | 0.3889 |
| Functional Capacity | Good/Excellent | 27 (79.4%) | 40 (95.2%) | 19 (82.6%) | 8 (88.9%) | 0.3398 |
| Role Functions | Good/Excellent | 31 (91.2%) | 36 (85.7%) | 18 (78.3%) | 8 (88.9%) | 0.4095 |
| Spiritual Support | Good/Excellent | 27 (79.4%) | 34 (81.0%) | 17 (73.9%) | 6 (66.7%) | 0.5334 |
| Convenience to Healthcare | Good/Excellent | 34 (100%) | 37 (88.1%) | 23 (100%) | 8 (88.9%) | 0.2321 |
| Health Insurance Coverage | Good/Excellent | 32 (94.1%) | 30 (71.4%) | 22 (95.7%) | 7 (77.8%) | 0.1175 |
| Air Quality in Community | Good/Excellent | 17 (50.0%) | 28 (66.7%) | 11 (47.8%) | 7 (77.8%) | 0.4525 |
| Air Quality at Home | Good/Excellent | 7 (20.6%) | 10 (23.8%) | 6 (26.1%) | 2 (22.2%) | 0.2545 |
| Tobacco Use in Family | Yes | 2 (5.9%) | 4 (9.5%) | 4 (17.4%) | 1 (11.1%) | 0.5316 |
| Exposure to Pollution | Yes | 7 (20.6%) | 5 (11.9%) | 4 (17.4%) | 3 (33.3%) | 0.4659 |
| Genes | Control (n = 54) | Cancer (n = 54) | p-Value | |
|---|---|---|---|---|
| MTHFR 677 | 0 (CC) 1 (CT) 2 (TT) | 28 (51.9%) 21 (38.9%) 5 (9.3%) | 23 (42.6%) 25 (46.3%) 6 (11.1%) | 0.6285 |
| MTHFR 1298 | 0 (AA) 1 (AC) 2 (CC) | 32 (59.2%) 15 (27.8%) 7 (13.0%) | 34 (63.0%) 15 (27.8%) 5 (9.2%) | 0.8212 |
| MTR 2756 | 0 (AA) 1 (AG) 2 (GG) | 39 (72.2%) 12 (22.2%) 3 (5.6%) | 36 (66.7%) 17 (31.5%) 1 (1.8%) | 0.3712 |
| MTRR 66 | 0 (AA) 1 (AG) 2 (GG) | 28 (52.4%) 18 (33.6%) 7 (13.0%) | 19 (35.6%) 25 (46.8%) 10 (18.5%) | 0.1842 |
| DHFR 19 bp | Del/Del Ins/Del Ins/Ins | 20 (37.0%) 17 (31.5%) 17 (31.5%) | 13 (24.1%) 25 (46.3%) 16 (29.6%) | 0.2188 |
| Total Polymorphism (0–10) | ≥4 mean ± SD (range) | 16 (29.6%) 3.1 ± 1.3 (0–6) | 27 (50.0%) 3.3 ± 1.4 (1–5) | 0.0306 0.0819 |
| Genes | White (n = 34) | Asian (n = 42) | Hispanic (n = 23) | African (n = 9) | p-Value | |
|---|---|---|---|---|---|---|
| MTHFR 677 | 0 (CC) 1 (CT) 2 (TT) | 3 (38.2%) 16 (47.1%) 5 (14.7%) | 21 (50.0%) 17 (40.5%) 4 (9.5%) | 8 (34.8%) 13 (56.5%) 2 (8.7%) | 9 (100.0%) 0 (0%) 0 (0%) | 0.0362 |
| MTHFR 1298 | 0 (AA) 1 (AC) 2 (CC) | 18 (52.9%) 12 (35.3%) 4 (11.8%) | 29 (69.1%) 9 (21.4%) 4 (9.5%) | 10 (43.5%) 9 (39.1%) 4 (17.4%) | 9 (100.0%) 0 (0%) 0 (0%) | 0.0885 |
| MTHFR Deficiency | 0% 15% 30% 35% 50% 70% mean ± SD (range) | 2 (5.9%) 7 (20.6%) 4 (11.8%) 11 (32.4%) 5 (14.7%) 5(14.7%) 35.6 ± 19.5 (0–70) | 11 (26.2%) 6 (14.3%) 4 (9.5%) 14 (33.3%) 3 (7.1%) 4 (9.5%) 26.9± 21.4 (0–70) | 0 (0.0%) 4 (17.4%) 4 (17.4%) 8 (34.8%) 6 (26.1%) 1 (4.4%) 36.1 ± 13.9 (15–70) | 9 (100.0%) 0 (0%) 0 (0%) 0 (0%) 0 (0%) 0 (0%) 0 0 | <0.0001 |
| ≥50% | 10 (29.4%) | 7 (16.7%) | 7 (30.4%) | 0 (0%) | 0.1553 | |
| MTR 2756 | 0 (AA) 1 (AG) 2 (GG) | 20 (58.8%) 11 (32.4%) 3 (8.8%) | 30 (71.4%) 11 (26.2%) 1 (2.4%) | 21 (91.3%) 2 (8.7%) 0 (0%) | 4 (44.4%) 5 (55.6%) 0 (0%) | 0.0475 |
| MTRR 66 | 0 (AA) 1 (AG) 2 (GG) | 7 (20.6%) 15 (44.1%) 12 (35.3%) | 20 (48.8%) 18 (43.9%) 3 (7.3%) | 17 (73.9%) 4 (17.4%) 2 (8.7%) | 3 (33.3%) 6 (66.7%) 0 (0%) | 0.0002 |
| DHFR 19 bp | Del/Del Ins/Del Ins/Ins | 3 (8.8%) 17 (50.0%) 14 (41.2%) | 24 (57.1%) 13 (31.0%) 5 (11.9%) | 4 (17.4%) 7 (30.4%) 12 (52.2%) | 2 (22.2%) 5 (55.6%) 2 (22.2%) | <0.0001 |
| Total Polymorphism (0–10) | ≥4 mean ± SD (range) | 16 (47.1%) 3.62 ± 1.18 (1–6) | 21 (50.0%) 3.31 ± 1.37 (0–6) | 5 (21.7%) 2.57± 1.24 (1–5) | 1 (11.1%) 2.22 ± 0.97 (1–4) | 0.0322 0.1244 |
| n (%) | Control Group | Cancer Group | ||||||
|---|---|---|---|---|---|---|---|---|
| Genotypes | 0 | 1 | 2 | p-value (HWE) | Population Allele Frequency | 0 | 1 | 2 |
| MTHFR 677 | CC | CT | TT | % C/T | CC | CT | TT | |
| Total | 28 (51.9) | 21 (44.4) | 5 (9.3) | NS | 75/25 | 23 (42.6) | 25 (46.3) | 6 (11.1) |
| White | 8 (50.0) | 7 (43.8) | 1 (6.2) | NS | 53/47 | 5 (27.8) | 9 (50) | 4 (22.2) |
| Asian | 12 (52.2) | 8 (34.8) | 3 (13.0) | NS | 70/30 | 9 (47.4) | 9 (47.4) | 1 (5.2) |
| Hispanic | 4 (36.4) | 6 (54.5) | 1 (9.1) | NS | 55/45 | 4 (33.3) | 7 (58.3) | 1 (8.3) |
| Black | 4 (100) | 0 (0) | 0 (0) | - | 91/9 | 5 (100) | 0 (0) | 0 (0) |
| MTHFR 1298 | AA | AC | CC | % A/C | AA | AC | CC | |
| Total | 32 (59.2) | 15 (27.8) | 7 (13) | 0.0314 | 75/25 | 34 (63) | 15 (27.8) | 5 (9.3) |
| White | 7 (43.8) | 6 (37.5) | 3 (18.8) | NS | 85/15 | 11 (61.1) | 6 (33.3) | 1 (5.6) |
| Asian | 16 (69.6) | 5 (21,7) | 2 (8.7) | NS | 78/22 | 13 (68.4) | 4 (21.1) | 2 (10.5) |
| Hispanic | 5 (45.4) | 4 (36.4) | 2 (18.2) | NS | 84/16 | 5 (41.7) | 5 (41.7) | 2 (16.7) |
| Black | 4 (100) | 0 (0) | 0 (0) | - | 85/15 | 5 (100) | 0 (0) | 0 (0) |
| MTR 2756 | AA | AG | GG | % A/G | AA | AG | GG | |
| Total | 39 (72.2) | 12 (22.2) | 3 (5.6) | NS | 36 (66.7) | 17 (31.5) | 1 (1.8) | |
| White | 10 (62.5) | 4 (25.0) | 2 (12.5) | NS | 84/16 | 10 (55.5) | 7 (38.9) | 1 (5.5) |
| Asian | 17 (73.9) | 5 (21.7) | 1 (4.3) | NS | 65–91/9–35 | 13 (68.4) | 6 (31.6) | 0 (0) |
| Hispanic | 11 (100) | 0 (0) | 0 (0) | - | 19/81 | 10 (83.3) | 2 (16.7) | 0 (0) |
| Black | 1 (25) | 3 (75) | 0 (0) | NS | 30–37/63–70 | 3 (60.0) | 2 (40.0) | 0 (0) |
| MTRR 66 | AA | AG | GG | % A/G | AA | AG | GG | |
| Total | 28 (52.6) | 18 (33.4) | 7 (13) | NS | 64/36 | 19 (35.6) | 25 (46.8) | 10 (18.5) |
| White | 3 (18.8) | 6 (37.5) | 7 (43.8) | NS | 45/55 | 4 (22.2) | 9 (50.0) | 5 (27.8) |
| Asian | 14 (63.6) | 8 (36.4) | 0 (0) | NS | 74/26 | 6 (31.6) | 10 (52.6) | 3 (15.8) |
| Hispanic | 10 (90.9) | 1 (9.1) | 0 (0) | NS | 72/28 | 7 (58.3) | 3 (25.0) | 2 (16.7) |
| Black | 1 (25.0) | 3 (75.0) | 0 (0) | NS | 73/27 | 2 (40.0) | 3 (60.0) | 0 (0) |
| DHFR 19 bp | II | ID | DD | % I/D | II | ID | DD | |
| Total | 20 (37) | 17 (31.5) | 17 (31.5) | 0.0068 | 50/50 | 13 (24.1) | 25 (46.3) | 16 (29.6) |
| White | 2 (12.5) | 6 (37.5) | 8 (50.0) | NS | 45–47/53–55 | 1 (5.6) | 11 (61.1) | 6 (33.3) |
| Asian | 15 (65.2) | 6 (26.1) | 2 (8.7) | NS | 63/37 | 9 (47.4) | 7 (36.8) | 3 (15.8) |
| Hispanic | 2 (18.2) | 4 (36.4) | 5 (45.4) | NS | 58/42 | 2 (16.7) | 3 (25.0) | 7 (58.3) |
| Black | 1 (25.0) | 1 (25.0) | 2 (50.0) | NS | 55/45 | 1 (20.0) | 4 (80.0) | 0 (0) |
| Term | Number of Splits | G2 | Column Contribution | Portion |
|---|---|---|---|---|
| MTRR A66G Polymorphism | 46 | 1.09506968 |  | 0.3082 |
| MTHFR Deficiency | 47 | 0.82548898 |  | 0.2324 |
| DHFR 19 bp Deletion | 43 | 0.48910685 |  | 0.1377 |
| MTR A2756G Polymorphism | 46 | 0.4855324 |  | 0.1367 |
| MTHFR A1298C Polymorphism | 42 | 0.41353505 |  | 0.1164 |
| MTHFR C677T Polymorphism | 33 | 0.24403481 |  | 0.0687 |
| Term | Number of Splits | G2 | Column Contribution | Portion |
|---|---|---|---|---|
| Body mass index | 10 | 6.78930886 |  | 0.3058 |
| Marital Status | 7 | 4.42559099 |  | 0.1993 |
| Race | 7 | 3.76884353 |  | 0.1698 |
| Exposure to Pollutants | 3 | 2.12649039 |  | 0.0958 |
| Gender | 5 | 1.81587428 |  | 0.0818 |
| Insurance Coverage | 3 | 1.17074973 |  | 0.0527 |
| Air Quality in the Community | 5 | 1.06350409 |  | 0.0479 |
| Convenience of HealthcareAccess | 3 | 0.52529395 |  | 0.0237 |
| Air Quality in the Home | 3 | 0.29975415 |  | 0.0135 |
| Tobacco Smoker in the Home | 2 | 0.21686301 |  | 0.0098 |
| Term | Number of Splits | G2 | Column Contribution | Portion |
|---|---|---|---|---|
| Stress | 27 | 3.43552989 |  | 0.1093 |
| Physical Activity | 30 | 3.37660068 |  | 0.1074 |
| Times Using Alcohol | 31 | 3.13235692 |  | 0.0996 |
| Spiritual Support | 25 | 2.91976087 |  | 0.0929 |
| Sleepiness | 28 | 2.87042298 |  | 0.0913 |
| Functional Role | 22 | 2.53679611 |  | 0.0807 |
| Whole Grain Dietary Intake | 17 | 1.92470816 |  | 0.0612 |
| Functional Capacity | 16 | 1.81050686 |  | 0.0576 |
| Fruits Intake | 20 | 1.52985178 |  | 0.0487 |
| Vegetables Intake | 20 | 1.51937688 |  | 0.0483 |
| Cognitive Capacity | 16 | 1.36910873 |  | 0.0435 |
| Depression | 13 | 1.32859637 |  | 0.0423 |
| Health Status Overall | 11 | 1.25492503 |  | 0.0399 |
| Nervous and Anxious | 12 | 1.17885473 |  | 0.0375 |
| Total Liquid Intake | 17 | 0.80560452 |  | 0.0256 |
| Tobacco Smoking | 8 | 0.45134732 |  | 0.0144 |
| Misclassification Rates | ||
|---|---|---|
| Factors | Bootstrap Forest | Logistic Regression |
| Demographic–Environmental | 0.1942 | 0.2353 |
| Genetic | 0.2019 | 0.3137 |
| Health Metrics/Lifestyle | 0.1584 | 0.2475 |
| Term | Number of Splits | G2 | Column Contribution | Portion |
|---|---|---|---|---|
| Body mass index | 73 | 2.34801946 |  | 0.1604 |
| Physical Activity | 67 | 1.83265224 |  | 0.1252 |
| Sleepiness | 74 | 1.78325631 |  | 0.1218 |
| Spiritual Support | 63 | 1.75806876 |  | 0.1201 |
| MTHFR Deficiency | 76 | 1.66137349 |  | 0.1135 |
| Times Using Alcohol | 63 | 1.46035411 |  | 0.0998 |
| Functional Role | 65 | 1.3622703 |  | 0.0931 |
| Stress | 63 | 1.32282568 |  | 0.0904 |
| MTRR66 Polymorphism | 58 | 1.10742696 |  | 0.0757 |
| Term | Number of Splits | G2 | Column Contribution | Portion |
|---|---|---|---|---|
| Sleepiness | 44 | 1.44019311 |  | 0.2209 |
| Stress | 35 | 1.32619458 |  | 0.2034 |
| MTRR66 Polymorphism | 32 | 1.02397504 |  | 0.1570 |
| Physical Activity, Minutes/Week | 38 | 0.9726631 |  | 0.1492 |
| Body mass index | 25 | 0.643443 |  | 0.0987 |
| MTHFR Deficiency | 28 | 0.46681593 |  | 0.0716 |
| Spiritual Support | 21 | 0.29696771 |  | 0.0455 |
| Times Using Alcohol | 22 | 0.19012811 |  | 0.0292 |
| Functions in Roles | 21 | 0.16033891 |  | 0.0246 |
| Term | Number of Splits | G2 | Column Contribution | Portion |
|---|---|---|---|---|
| Spiritual Support | 41 | 2.51879811 |  | 0.4094 |
| Body mass index | 18 | 0.82973589 |  | 0.1349 |
| Stress | 23 | 0.60238034 |  | 0.0979 |
| Functions in Roles | 20 | 0.54764955 |  | 0.0890 |
| Times Using Alcohol | 24 | 0.48150149 |  | 0.0783 |
| Sleepiness | 24 | 0.4798417 |  | 0.0780 |
| Physical Activity, Minutes/Week | 18 | 0.30328675 |  | 0.0493 |
| MTHFR Deficiency | 15 | 0.22482419 |  | 0.0365 |
| MTRR66 Polymorphism | 8 | 0.16489531 |  | 0.0268 |
| Term | Number of Splits | G2 | Column Contribution | Portion |
|---|---|---|---|---|
| Physical Activity, Minutes/Week | 44 | 1.64218014 |  | 0.1916 |
| BMI | 40 | 1.46162302 |  | 0.1705 |
| Times Using Alcohol | 25 | 1.29832268 |  | 0.1514 |
| Functions in Roles | 35 | 1.15435558 |  | 0.1346 |
| MTHFR Deficiency | 29 | 1.11010973 |  | 0.1295 |
| Sleepiness | 34 | 0.73467524 |  | 0.0857 |
| Stress | 21 | 0.61669827 |  | 0.0719 |
| MTRR66 Polymorphism | 19 | 0.32183586 |  | 0.0375 |
| Spiritual Support | 14 | 0.23328255 |  | 0.0272 |
| Logistic Regression Original Model with Validation | Generalized Regression Elastic Net Model | |||||
|---|---|---|---|---|---|---|
| With AICc Validation | With Leave-One-Out Validation | |||||
| Parameters | Estimate | p (X2) | Estimate | p (X2) | Estimate | p (X2) |
| (Intercept) | −0.2875 | 0.6144 | 0.3218 | 0.4096 | 0.3486 | 0.3785 |
| Gender (Male/Female) | 1.5023 | 0.0119 | 1.2972 | 0.0074 | 1.4286 | 0.0018 |
| BMI * Alcohol Use, Interaction | −2.2790 | 0.0367 | −1.9512 | 0.0146 | −1.2376 | 0.0062 |
| Total Polymorphisms | −0.7185 | 0.1865 | −1.1444 | 0.0125 | −2.1202 | 0.0063 |
| BMI | 1.3637 | 0.0602 | 0.7541 | 0.1993 | 0.8991 | 0.1036 |
| Alcohol Use | 0.5468 | 0.4038 | 0 | 1.000 | 0 | 1.000 |
| Misclassification Rate | 0.3714 | - | 0.2963 | - | 0.2804 | - |
| AICc | 56.98 | - | 138.81 | - | - | - |
| AUC | 0.7817 | - | 0.7531 | - | 0.7652 | - |
| Logistic Regression Original Model With Validation | Generalized Regression Elastic Net Model | |||||
|---|---|---|---|---|---|---|
| Elastic Net Model With AICc Validation | With Leave-One-Out Cross Validation | |||||
| Parameters | Estimate | p-value (X2) | Estimate | p-value (X2) | Estimate | p-value (X2) |
| (Intercept) | 0.5768 | 0.5445 | 1.2292 | 0.0498 | 1.3171 | 0.0487 |
| Gender (Male/Female) | 3.1964 | 0.3465 | 1.4525 | 0.0049 | 1.8934 | 0.0006 |
| Gender (Male/Female) * BMI | −4.2655 | 0.0039 | −1.9736 | 0.0219 | −-2.5539 | 0.0042 |
| MTHFR C677T Polymorphism | −2.3824 | 0.0345 | −0.9065 | 0.0523 | −1.1847 | 0.0174 |
| MTHFR C677T Polymorphism * BMI | 2.2401 | 0.1157 | 1.2404 | 0.0667 | −1.5750 | 0.0253 |
| Exposure to Pollution | −0.8194 | 0.2853 | −1.2110 | 0.0368 | −1.2466 | 0.0458 |
| MTRR66 | −0.8694 | 0.1426 | −0.6792 | 0.0975 | 1.3172 | 0.0800 |
| BMI | 0.8029 | 0.3465 | 0 | 1.000 | 0 | 1.000 |
| Misclassification Rate | 0.4103 | - | 0.3241 | - | 0.3396 | - |
| AICc | 85.24 | - | 140.69 | - | - | - |
| AUC | 0.5842 | - | 0.7536 | - | 0.7639 | - |
© 2018 by the authors. Licensee MDPI, Basel, Switzerland. This article is an open access article distributed under the terms and conditions of the Creative Commons Attribution (CC BY) license (http://creativecommons.org/licenses/by/4.0/).
Share and Cite
Shiao, S.P.K.; Grayson, J.; Yu, C.H.; Wasek, B.; Bottiglieri, T. Gene Environment Interactions and Predictors of Colorectal Cancer in Family-Based, Multi-Ethnic Groups. J. Pers. Med. 2018, 8, 10. https://doi.org/10.3390/jpm8010010
Shiao SPK, Grayson J, Yu CH, Wasek B, Bottiglieri T. Gene Environment Interactions and Predictors of Colorectal Cancer in Family-Based, Multi-Ethnic Groups. Journal of Personalized Medicine. 2018; 8(1):10. https://doi.org/10.3390/jpm8010010
Chicago/Turabian StyleShiao, S. Pamela K., James Grayson, Chong Ho Yu, Brandi Wasek, and Teodoro Bottiglieri. 2018. "Gene Environment Interactions and Predictors of Colorectal Cancer in Family-Based, Multi-Ethnic Groups" Journal of Personalized Medicine 8, no. 1: 10. https://doi.org/10.3390/jpm8010010