Interaction between Fexofenadine and CYP Phenotyping Probe Drugs in Geneva Cocktail
by
 ,
,
Marija Bosilkovska
1, 
Gaelle Magliocco
1,
Jules Desmeules
1,2,
Caroline Samer
1,2 and
Youssef Daali
1,2,* 1
Division of Clinical Pharmacology and Toxicology, Geneva University Hospitals, 1205 Geneva, Switzerland
2
Faculty of Medicine, University of Geneva, 1205 Geneva, Switzerland
*
Author to whom correspondence should be addressed.
J. Pers. Med. 2019, 9(4), 45; https://doi.org/10.3390/jpm9040045
Submission received: 19 July 2019
/
Revised: 4 September 2019
/
Accepted: 12 September 2019
/
Published: 2 October 2019
Abstract
:Drug metabolic enzymes and transporters are responsible for an important variability in drug disposition. The cocktail approach is a sound strategy for the simultaneous evaluation of several enzyme and transporter activities for a personalized dosage of medications. Recently, we have demonstrated the reliability of the Geneva cocktail, combining the use of dried blood spots (DBS) and reduced dose of phenotyping drugs for the evaluation of the activity of six cytochromes and P-glycoprotein (P-gp). As part of a study evaluating potential drug–drug interactions between probe drugs of the Geneva cocktail, the present paper focuses on the impact of cytochromes (CYP) probe drugs on the disposition of fexofenadine, a P-gp test drug. In a randomized four-way Latin-square crossover study, 30 healthy volunteers (15 men and 15 women) received caffeine 50 mg, bupropion 20 mg, flurbiprofen 10 mg, omeprazole 10 mg, dextromethorphan 10 mg, midazolam 1 mg, and fexofenadine 25 mg alone (or as part of a previously validated combination) and all together (Geneva cocktail). The determination of drug concentrations was performed in DBS samples and pharmacokinetic parameters were calculated. Fexofenadine AUC0–8 h and Cmax decreased by 43% (geometric mean ratio: 0.57; CI 90: 0.50–0.65; p < 0.001) and 49% (geometric mean ratio: 0.51; CI 90: 0.44–0.59; p < 0.001), respectively, when fexofenadine was administered as part of the Geneva cocktail in comparison to fexofenadine alone. Consequently, the apparent oral clearance (Cl/F) increased 1.7-fold (CI 90: 1.49–1.93; p < 0.001). There was no interaction between the remaining probes. In conclusion, an unexpected interaction occurred between fexofenadine and one or several of the following substances: caffeine, bupropion, flurbiprofen, omeprazole, dextromethorphan, and midazolam. Further studies are necessary to elucidate the mechanism of this interaction.
1. Introduction
Variations in the function of cytochrome P450 (CYP) enzymes as a result of genetic polymorphisms or environmental factors such as dietary components, toxins, or drugs can result in interindividual variability in drug response and pharmacokinetics [1]. Thus, the in vivo evaluation of the activity of these enzymes (phenotyping) is of great importance. A cocktail approach involving the administration of multiple CYP specific probe drugs can be used to simultaneously assess their activity. Numerous cocktails for CYP phenotyping have been described in the past decades and used for the identification of factors which influence CYPs activities or for the study of drug–drug interactions during drug development [2,3,4,5].
In addition to metabolizing enzymes, the importance of drug influx and efflux transporters as a source of pharmacokinetic variability in drug response has been underlined recently [6].
P-glycoprotein (P-gp) is one of the best studied and most significant efflux drug transporters. It is expressed in multiple key organs in drug disposition such as the small intestine, blood-brain barrier, kidneys, and liver and, as such, has been involved in a large number of clinically significant drug–drug interactions [7]. As evidence of the importance of this transporter in drug disposition grows, so does interest in assessing its activity. The investigation of the impact of new drugs on in vivo P-gp activity is recommended by both the FDA and European Medicines Agency (EMA) [8,9]. To this aim, several probe drugs such as digoxin, fexofenadine, talinolol, quinidine, and others have been proposed. Their advantages and limitations have been previously reviewed [10]. In its ‘Guideline on the Investigation of Drug Interactions’, the EMA has suggested the use of renal clearance of digoxin for the determination of renal P-gp function. The function of intestinal P-gp was proposed to be assessed in in vivo studies with probes having a lower oral bioavailability, such as fexofenadine (if no OATP1A1 or 1B3 inhibition is expected) or dabigatran [8].
Previously developed cocktails did not include probes for P-gp activity assessment. Therefore, in vivo interaction studies evaluating the impact of a new drug on CYP and P-gp activity should be conducted on separate occasions [11]. To palliate this, we have recently developed the Geneva cocktail composed of caffeine, bupropion, flurbiprofen, omeprazole, dextromethorphan, midazolam, and fexofenadine as probes for the simultaneous phenotyping of CYP1A2, 2B6, 2C9, 2C19, 2D6, 3A, and P-gp, respectively [12]. In a previous study, we showed that the modulation of CYP and P-gp activity in the presence of inhibitors/inducers could be reliably predicted using this cocktail [12].
As part of a study evaluating potential drug–drug interactions between probe drugs of the Geneva cocktail, the present manuscript focuses on the pharmacokinetic interaction between CYP probe drugs and fexofenadine (P-gp substrate).
2. Methods
2.1. Subjects
Characteristics of the study volunteers were given in more detail in the previous paper devoted to the analytical development of the Geneva cocktail [12]. Briefly, thirty healthy non-smoking Caucasian volunteers (15 women, 15 men) were included in the study. The median age was 23.5 years (range, 18–36) and median BMI was 21.7 (range, 18.4–27.7). All subjects had normal results on physical examination and liver-function tests and were not taking any medications influencing the function of metabolic enzymes or transporters. Six women had oral contraception and 2 had a hormonal implant. Pregnancy was tested using urinary tests, and all urine analyses were negative at the inclusion and at the morning of each study session. Study sessions for women using oral contraception were scheduled outside the one-week break period for monthly oral contraception. Grapefruit juice was forbidden for at least one week before and during the study, and alcohol and caffeine-containing products were restricted at least 48 h before each study session.
This study (registration NCT02391688) was approved by the Ethics Committee of Geneva University Hospitals (ID: 14-061) and the Swiss Agency for Therapeutic Products (Swissmedic). All volunteers were asked to give written informed consent before starting the study.
2.2. Study Design
As this work is part of the previously published study evaluating potential drug–drug interactions between probe drugs of the Geneva cocktail, the design was described in more detail in the previous paper [12]. Briefly, it was a randomized, open-label, four-way Latin-square, cross-over study. The four treatment arms were composed of A: caffeine 50 mg, flurbiprofen 10 mg, omeprazole 10 mg, dextromethorphan 10 mg, and midazolam 1 mg; B: fexofenadine 25 mg; C: bupropion 20 mg; and D: the seven-drug cocktail regimen of caffeine 50 mg, bupropion 20 mg, flurbiprofen 10 mg, omeprazole 10 mg, dextromethorphan 10 mg, midazolam 1 mg, and fexofenadine 25 mg (Geneva cocktail). The Pharmacy of Geneva University Hospitals prepared all the treatments for the study in capsule form except omeprazole 10 mg, where the commercially available tablets (Antramups® 10) were used. The pharmacy is accredited by Swissmedic and works under GMP conditions.
At each session, volunteers received one of the treatments A, B, C or D orally. Capillary blood samples from a small finger prick (BD Microtainer, Contact-Activated Lancet, Plymouth, UK) were collected before (time 0) as well as 0.5, 1, 2, 3, 4, 6, and 8 h after drug administration. Capillary whole blood (10 µL) was collected on a Whatman 903 filter paper card (GmbH, Dassel, Germany) using a volumetric micropipette (Rainin, CA, USA). After 30 min of drying at room temperature, DBS cards were packed in sealable plastic bags and stored at −20 °C. Only capillary whole blood samples were used for fexofenadine pharmacokinetic assessment since we previously demonstrated a high correlation with plasma concentrations.
2.3. Analytical Methods
The analytical method used in this study for the determination of fexofenadine, CYP probe drugs, as well as the generated metabolites, consisted of a validated high-performance liquid chromatography-tandem mass spectrometry method (HPLC-MS/MS). Details of the development and the validation of the method were reported elsewhere [13].
2.4. Genotyping
Genomic DNA was extracted from whole blood (200 μL) using the QIAamp DNA blood mini kit (QIAGEN, Switzerland). ABCB1 G2677T/A and C3435T polymorphisms were determined by means of a multiplex PCR with fluorescent probes (Lightmix, TibMolbiol, Berlin, Germany) and melting curve analysis on a LightCycler480 (Roche Diagnostics, Switzerland). For description purposes, volunteers were classified into 3 genotype groups (Table 1):
- (a)
- homozygous wild-type carriers 2677GG/3435CC (n = 4) and homozygous wild-type carriers at one chromosome and heterozygous for the other ex.2677GG/3435CT or 2677GT/3435CC (n = 6).
- (b)
- heterozygous carriers at both chromosomes (2677GT/3435CT) (n = 10) and homozygous mutated at one chromosome + homozygous wild-type for the other ex. 2677TT/3435CC or 2677GG/3435TT (n = 6)
- (c)
- homozygous mutated carriers at both chromosomes (2677TT/3435TT) (n = 3) and 2677GT/3435TT (n = 1)
2.5. Statistical Analysis
Pharmacokinetic parameters were estimated by standard noncompartmental methods using WinNonlin version 6.2.1 (Pharsight, Mountain View, CA, USA). The results are presented as mean values (± SD) and geometric mean ratios with 90% CIs. Pharmacokinetic parameters of fexofenadine when administered alone or as part of the cocktail were compared using the nonparametric Wilcoxon signed-rank test. All statistical analyses were performed using SPSS software version 22 (Chicago, IL, USA) and p-values of ≤0.05 were considered statistically significant.
3. Results
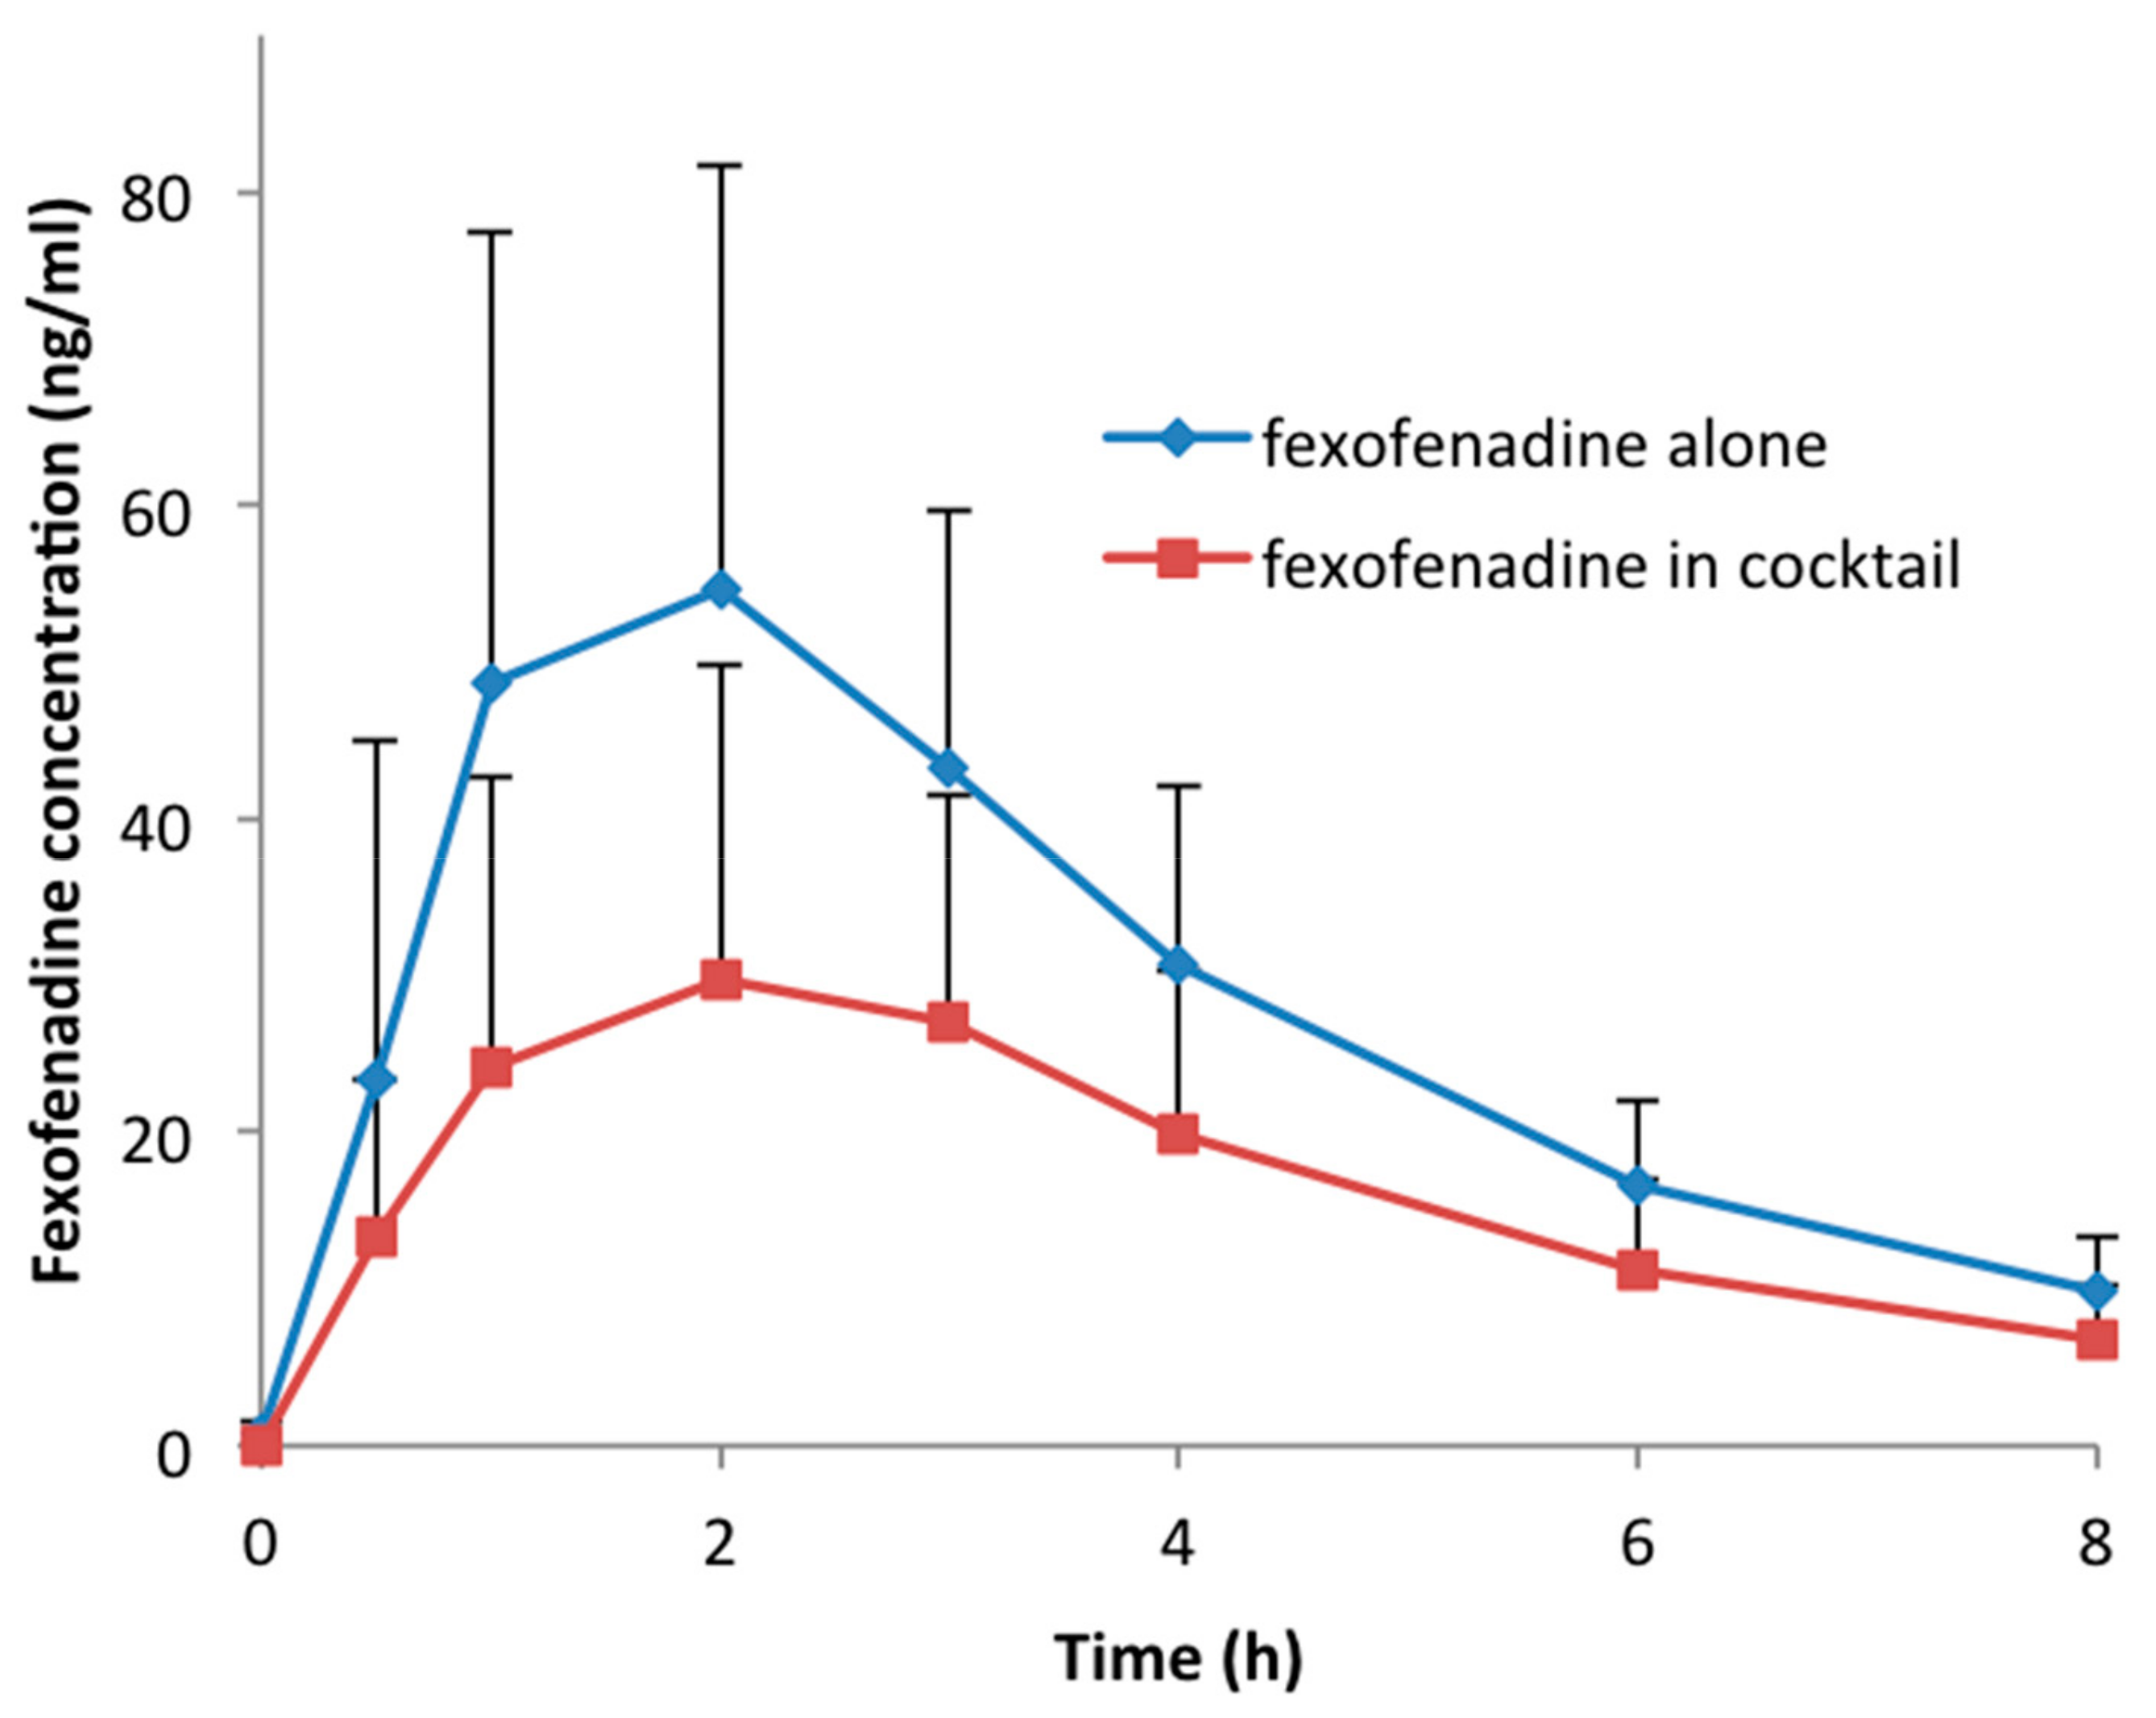
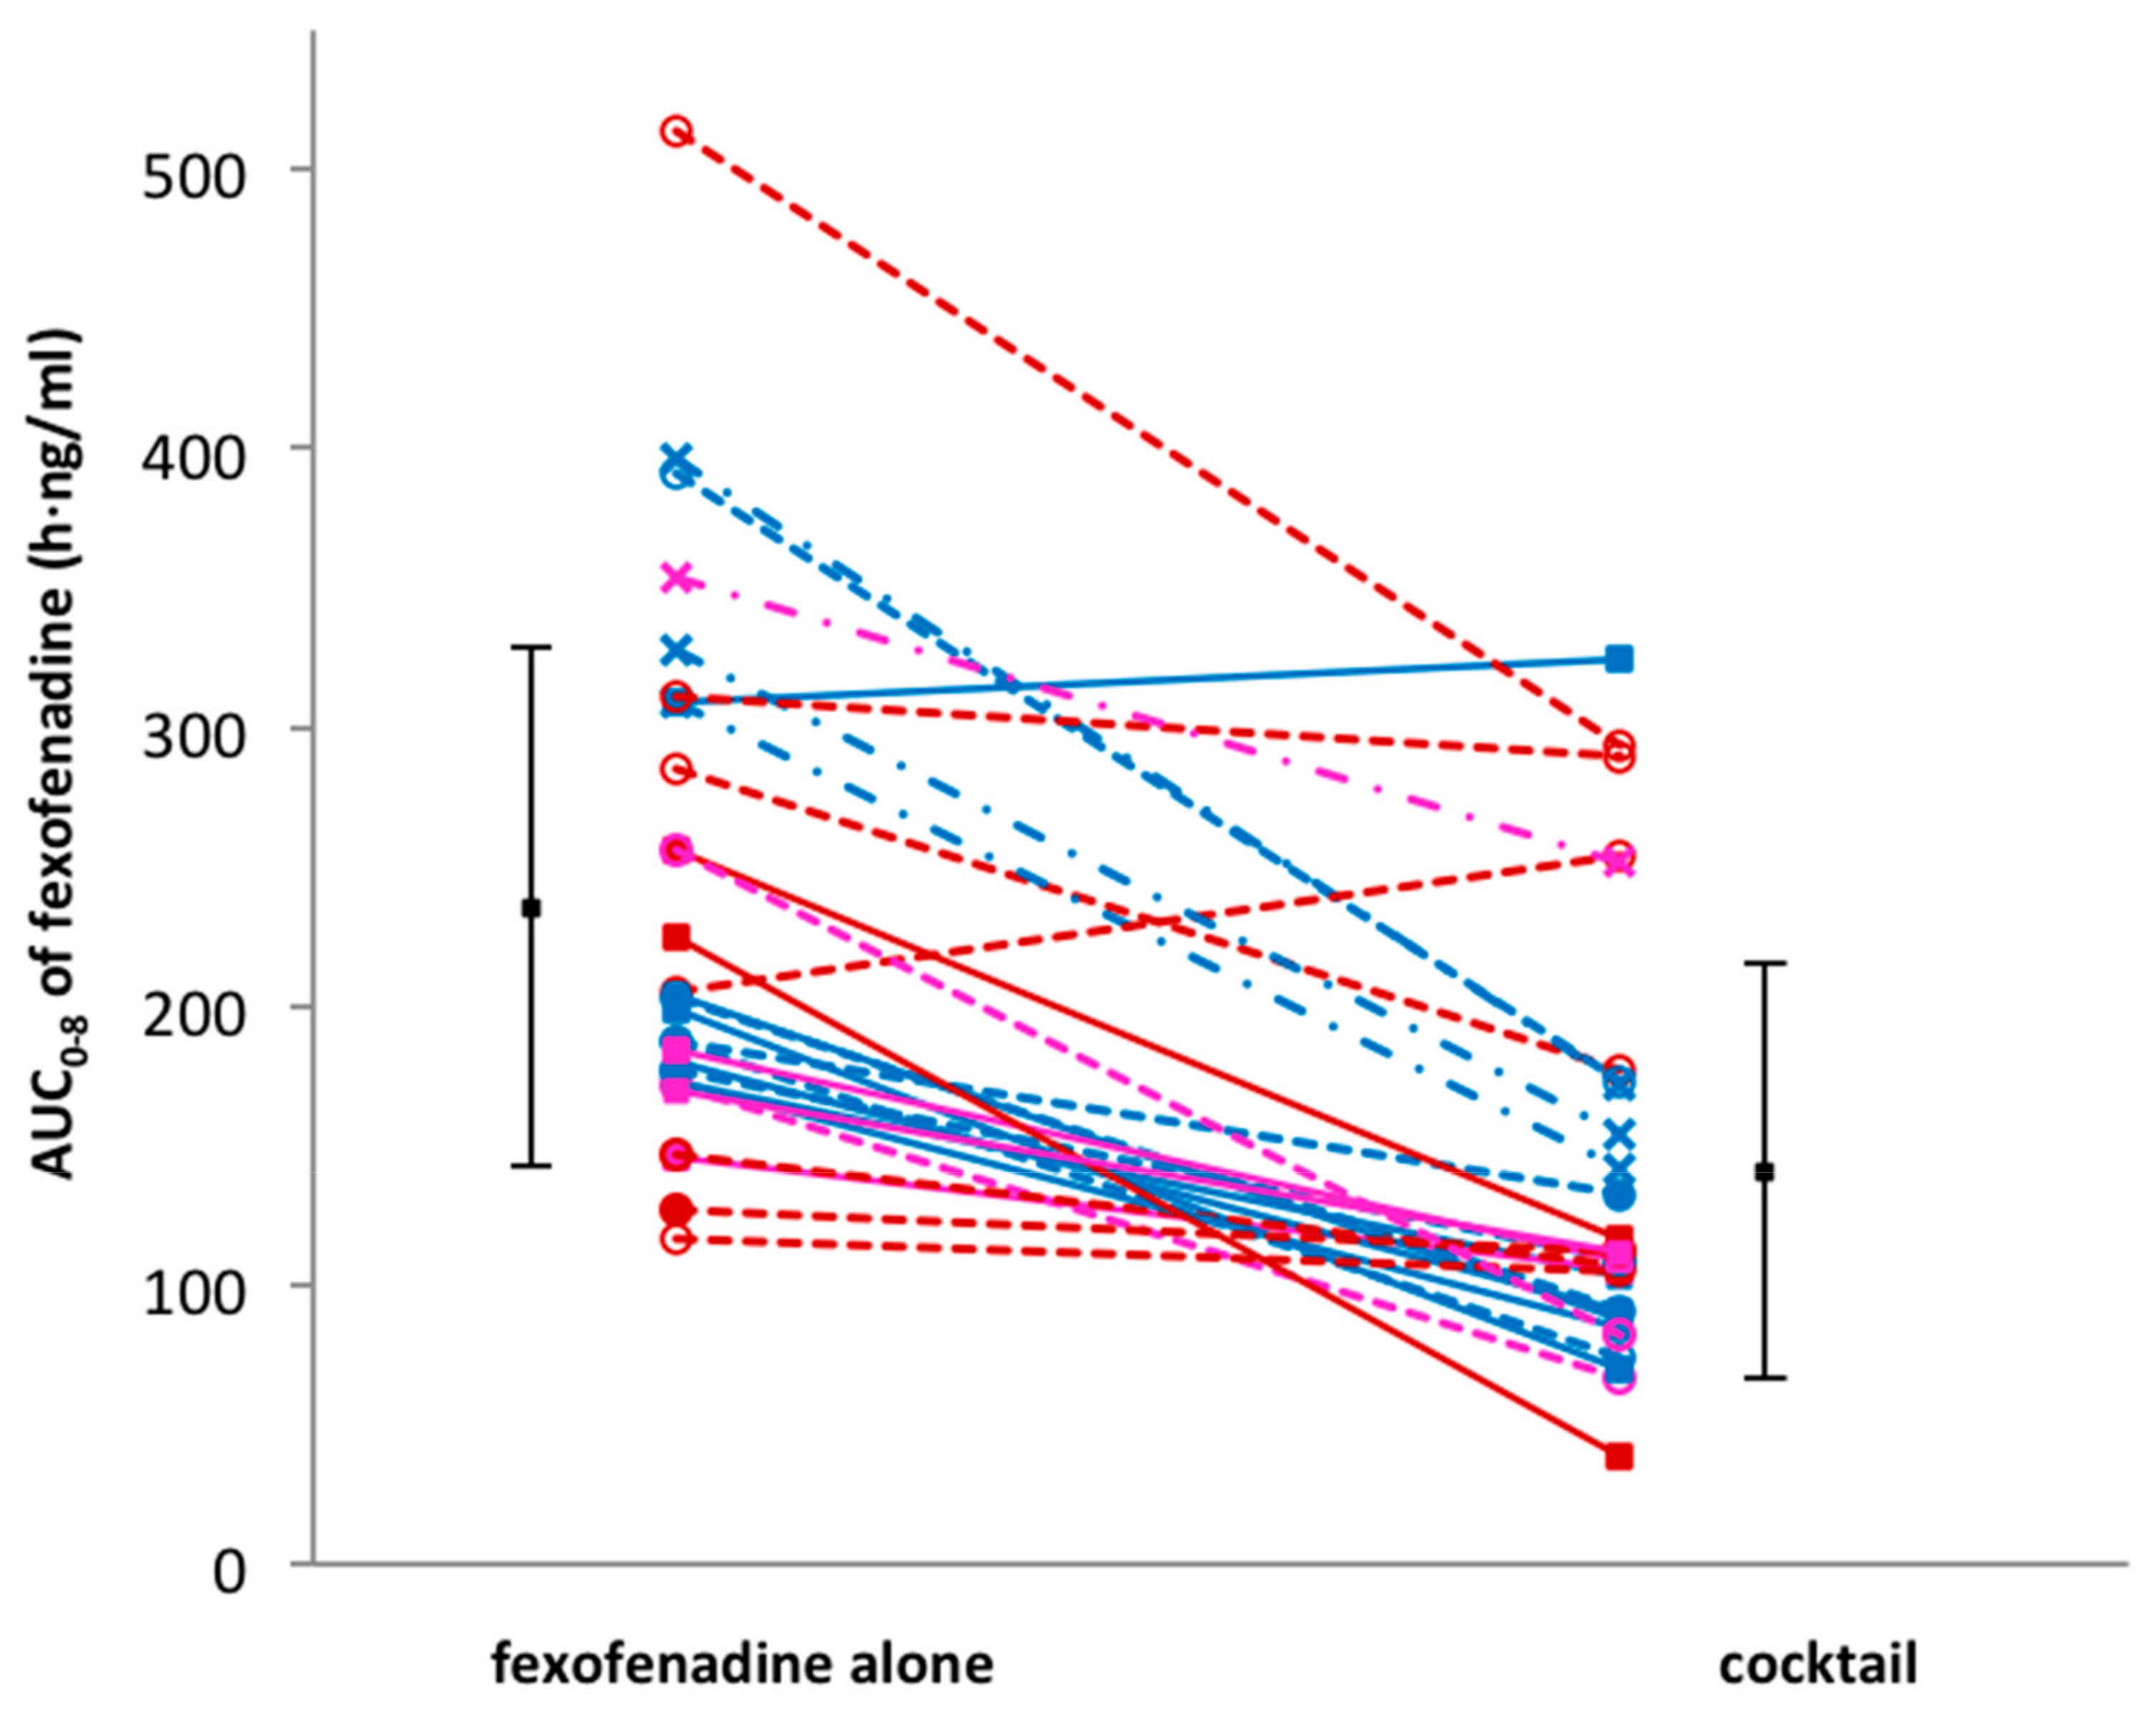
Thirty volunteers participated in the study and successfully completed the four study sessions. None of the subjects reported any side effects after single drug or cocktail administration. Detailed results of drug–drug interactions between the CYP probe substrates contained in the cocktail are described elsewhere [14]. An unexpected interaction occurred between fexofenadine and CYP probe drugs. In fact, in comparison to fexofenadine alone, AUC0–8 h and Cmax decreased by 43% (geometric mean ratio: 0.57; CI 90: 0.50–0.65; p < 0.001) and 49% (geometric mean ratio: 0.51; CI 90: 0.44–0.59; p < 0.001), respectively, when fexofenadine was administered as part of the Geneva cocktail. Consequently, the apparent oral clearance (Cl/F) increased 1.7-fold (CI 90: 1.49–1.93; p < 0.001). There was no difference in the time to reach the maximum concentration (Tmax) (geometric mean ratio: 1.14; CI 90: 0.87–1.50; p = 0.082) and the half-life (t1/2) (geometric mean ratio: 1.07; CI 90: 1.00–1.13; p = 0.054) when fexofenadine was administered alone or as part of the cocktail (Table 2, Figure 1). The individual AUC0–8 h values of fexofenadine at both sessions are presented in Figure 2. This figure also shows the distribution of MDR1 genotypes regarding SNPs 2677G > T/A and 3435C > T, which are classified as described in the Methods section (Table 1). The AUC values for these genotypic groups are also shown in Table 3. As expected, the volunteers in group (a), which were homozygous carriers of the wild-type exon-21 2677G > T/A (GG) and exon-26 3435C > T (CC), or heterozygous for one of the exons, had lower AUC values in comparison to volunteers in group (c) with the TT/TT or GT/TT genotype (207.3 ± 44.9 vs. 346.7 ± 37.8 when fexofenadine was administered alone and 113.7 ± 77.5 vs. 179.9 ± 49.6, respectively).
4. Discussion
Fexofenadine is a P-glycoprotein substrate that is eliminated unchanged mostly through biliary (80%) and urinary (10%) excretion [15]. Its sensitivity as a P-gp substrate has been demonstrated both in vitro and in vivo in mdr1 knock-out mice as well as in humans with P-gp inhibitors and inducers [10,16,17]. Therefore, fexofenadine has been proposed as an in vivo P-gp probe by several authors as well as by the International Transporter Consortium [18,19,20]. Furthermore, in comparison to other P-gp probes, fexofenadine has advantages such as a short half-life and a good safety profile. For these reasons, it has been included as a probe for P-gp phenotyping in the Geneva cocktail [12].
Besides its numerous advantages, the main limitation of fexofenadine, as well as the other currently available P-gp probes, is the lack of transporter specificity. Recent studies have shown that in addition to P-gp, other transporters such as multidrug resistance-associated proteins (MRPs), and in particular, organic anion-transporting polypeptides (OATPs), are also involved in fexofenadine disposition [21,22].
In this study, an unexpected interaction occurred between fexofenadine and CYP probe drugs. Few mechanisms can give a potential explanation for the 1.7-fold increase in the apparent oral clearance of fexofenadine. These mechanisms include: (1) increased intestinal efflux due to P-glycoprotein induction, resulting in a decrease in systemic exposure; (2) inhibition of OATP1A2 or OATP2B1, resulting in decreased intestinal uptake; (3) increased hepatic OATP1B1 or OATP1B3 uptake, resulting in increased biliary clearance; or (4) increased hepatic and renal P-glycoprotein-mediated excretion.
Since the probe drugs were administered concomitantly and as a single dose, it is unlikely that P-gp induction will occur. Activation of P-gp has been shown in vitro but has not yet been demonstrated in vivo [23]. Activation of hepatic OATPs (OATP1B1 and OATP1B3) by the non-steroidal anti-inflammatory drugs (NSAIDs) diclofenac, ibuprofen, and naproxen have been observed in vitro [24]. It has been suggested that the allosteric binding of these drugs could increase the transport of some OATP substrates (pravastatin) but not of others (sulfobromophthalein). Further studies should be conducted to verify if flurbiprofen, a NSAID contained in the cocktail, would have this effect on OATPs and on fexofenadine disposition. No direct interaction has been described so far between fexofenadine and any of the other administered probes. However, recently, an unexpected interaction has been observed between bupropion and digoxin, another P-gp probe. Administration of a single oral dose of bupropion (150 mg), 24 h before a single oral dose of digoxin (0.5 mg), resulted in an 80% increase of digoxin clearance [25]. The mechanism of this interaction has been investigated in vitro, and it has been proposed that bupropion increased digoxin renal uptake by activation of renal OATP4C1 [26]. In the present case, this transporter is not known to be involved in fexofenadine disposition, and the fraction of fexofenadine eliminated by the renal route is too low to be the only explanation for the observed interaction.
An inhibition of intestinal OATP1A2 or OATP2B1 seems to be the most plausible explanation for the observed interaction in this study. However, to our knowledge, none of the co-administered drugs are known to have an inhibitory effect on these transporters.
5. Conclusions
An unexpected drug–drug interaction resulting in increased fexofenadine clearance has been observed between this drug and one or several of the following substances: caffeine, bupropion, flurbiprofen, omeprazole, dextromethorphan, and midazolam. Further studies are required to determine the perpetrator responsible for this drug interaction among the six co-administered CYP probe substrates. The exact mechanism of this interaction also remains to be elucidated.
Because of the involvement of several transporters in their disposition as well as the occurrence of unpredictable interactions, the utility of fexofenadine as a probe drug for P-gp should be questioned.
Author Contributions
M.B., C.S., G.M. and Y.D. wrote the manuscript and designed the research; M.B., C.S., J.D. and Y.D. performed the clinical trial; M.B., G.M., C.S. and Y.D. analyzed the data.
Funding
This research received no external funding.
Acknowledgments
The authors thank the Clinical Research Center (University Hospital and Faculty of Medicine, Geneva) for their help and assistance. This work was supported by the medical direction of Geneva University Hospitals (Research and development project n PRD 17-2014-I).
Conflicts of Interest
The authors have no conflict of interests to declare regarding this manuscript.
References
- Zanger, U.M.; Schwab, M. Cytochrome P450 enzymes in drug metabolism: Regulation of gene expression, enzyme activities, and impact of genetic variation. Pharmacol. Ther. 2013, 138, 103–141. [Google Scholar] [CrossRef] [PubMed]
- Goh, B.C.; Reddy, N.J.; Dandamudi, U.B.; Laubscher, K.H.; Peckham, T.; Hodge, J.P.; Suttle, A.B.; Arumugham, T.; Xu, Y.; Xu, C.F.; et al. An evaluation of the drug interaction potential of pazopanib, an oral vascular endothelial growth factor receptor tyrosine kinase inhibitor, using a modified Cooperstown 5 + 1 cocktail in patients with advanced solid tumors. Clin. Pharmacol. Ther. 2010, 88, 652–659. [Google Scholar] [CrossRef] [PubMed]
- Inui, N.; Akamatsu, T.; Uchida, S.; Tanaka, S.; Namiki, N.; Karayama, M.; Chida, K.; Watanabe, H. Chronological Effects of Rifampicin Discontinuation on Cytochrome P450 Activity in Healthy Japanese Volunteers, Using the Cocktail Method. Clin. Pharmacol. Ther. 2013, 94, 702–708. [Google Scholar] [CrossRef] [PubMed]
- Shelepova, T.; Nafziger, A.N.; Victory, J.; Kashuba, A.D.; Rowland, E.; Zhang, Y.; Sellers, E.; Kearns, G.; Leeder, J.S.; Gaedigk, A.; et al. Effect of a triphasic oral contraceptive on drug-metabolizing enzyme activity as measured by the validated Cooperstown 5 + 1 cocktail. J. Clin. Pharmacol. 2005, 45, 1413–1421. [Google Scholar] [CrossRef] [PubMed]
- Zadoyan, G.; Rokitta, D.; Klement, S.; Dienel, A.; Hoerr, R.; Gramatté, T.; Fuhr, U. Effect of Ginkgo biloba special extract EGb 761 (R) on human cytochrome P450 activity: A cocktail interaction study in healthy volunteers. Eur. J. Clin. Pharmacol. 2012, 68, 553–560. [Google Scholar] [CrossRef] [PubMed]
- Konig, J.; Muller, F.; Fromm, M.F. Transporters and drug-drug interactions: Important determinants of drug disposition and effects. Pharmacol. Rev. 2013, 65, 944–966. [Google Scholar] [CrossRef] [PubMed]
- Glaeser, H. Importance of P-glycoprotein for drug-drug interactions. Handb. Exp. Pharmacol. 2011, 201, 285–297. [Google Scholar]
- EMEA. Guideline on the Investigation of Drug Interactions. 2012. Available online: http://www.ema.europa.eu/docs/en_GB/document_library/Scientific_guideline/2012/07/WC500129606.pdf (accessed on 4 May 2016).
- FDA. Drug Interaction Studies-Study Design, Data Analysis, Implications for Dosing, and Labeling Recommendations. 2012. Available online: http://www.fda.gov/downloads/Drugs/GuidanceComplianceRegulatoryInformation/Guidances/ucm292362.pdf (accessed on 4 May 2016).
- Ma, J.D.; Tsunoda, S.M.; Bertino, J.S.; Trivedi, M.; Beale, K.K.; Nafziger, A.N. Evaluation of in vivo P-glycoprotein phenotyping probes: A need for validation. Clin. Pharmacokinet. 2010, 49, 223–237. [Google Scholar] [CrossRef]
- Dumond, J.B.; Vourvahis, M.; Rezk, N.L.; Patterson, K.B.; Tien, H.C.; White, N.; Jennings, S.H.; Choi, S.O.; Li, J.; Wagner, M.J.; et al. A phenotype-genotype approach to predicting CYP450 and P-glycoprotein drug interactions with the mixed inhibitor/inducer tipranavir/ritonavir. Clin. Pharmacol. Ther. 2010, 87, 735–742. [Google Scholar] [CrossRef] [PubMed]
- Bosilkovska, M.; Samer, C.F.; Deglon, J.; Rebsamen, M.; Staub, C.; Dayer, P.; Walder, B.; Desmeules, J.A.; Daali, Y. Geneva cocktail for cytochrome p450 and p-glycoprotein activity assessment using dried blood spots. Clin. Pharmacol. Ther. 2014, 96, 349–359. [Google Scholar] [CrossRef]
- Bosilkovska, M.; Déglon, J.; Samer, C.; Walder, B.; Desmeules, J.; Staub, C.; Daali, Y. Simultaenous LC-MS/MS quantification of P-glycoprotein and cytochrome P450 probe substrates and their metabolites in DBS and plasma. Bioanalysis 2014, 6, 151–164. [Google Scholar] [CrossRef] [PubMed]
- Bosilkovska, M.; Samer, C.; Déglon, J.; Thomas, A.; Walder, B.; Desmeules, J.; Daali, Y. Evaluation of Mutual Drug-Drug Interaction within Geneva Cocktail for Cytochrome P450 Phenotyping using Innovative Dried Blood Sampling Method. Basic Clin. Pharmacol. 2016, 119, 284–290. [Google Scholar] [CrossRef] [PubMed] [Green Version]
- Joy, M.S.; Frye, R.F.; Nolin, T.D.; Roberts, B.V.; La, M.K.; Wang, J.; Brouwer, K.L.; Dooley, M.A.; Falk, R.J. In vivo alterations in drug metabolism and transport pathways in patients with chronic kidney diseases. Pharmacotherapy 2014, 34, 114–122. [Google Scholar] [CrossRef] [PubMed]
- Hamman, M.A.; Bruce, M.A.; Haehner-Daniels, B.D.; Hall, S.D. The effect of rifampin administration on the disposition of fexofenadine. Clin. Pharmacol. Ther. 2001, 69, 114–121. [Google Scholar] [CrossRef] [PubMed]
- Yasui-Furukori, N.; Uno, T.; Sugawara, K.; Tateishi, T. Different effects of three transporting inhibitors, verapamil, cimetidine, and probenecid, on fexofenadine pharmacokinetics. Clin. Pharmacol. Ther. 2005, 77, 17–23. [Google Scholar] [CrossRef] [PubMed]
- Kim, K.A.; Park, P.W.; Park, J.Y. Short-term effect of quercetin on the pharmacokinetics of fexofenadine, a substrate of P-glycoprotein, in healthy volunteers. Eur. J. Clin. Pharmacol. 2009, 65, 609–614. [Google Scholar] [CrossRef] [PubMed]
- Shimizu, M.; Uno, T.; Sugawara, K.; Tateishi, T. Effects of itraconazole and diltiazem on the pharmacokinetics of fexofenadine, a substrate of P-glycoprotein. Br. J. Clin. Pharmacol. 2006, 61, 538–544. [Google Scholar] [CrossRef] [Green Version]
- Giacomini, K.M.; Huang, S.M.; Tweedie, D.J.; Benet, L.Z.; Brouwer, K.L.; Chu, X.; Dahlin, A.; Evers, R.; Fischer, V.; Hillgren, K.M.; et al. Membrane transporters in drug development. Nat. Rev. Drug Discov. 2010, 9, 215–236. [Google Scholar]
- Akamine, Y.; Miura, M.; Yasui-Furukori, N.; Ieiri, I.; Uno, T. Effects of multiple-dose rifampicin 450 mg on the pharmacokinetics of fexofenadine enantiomers in Japanese volunteers. J. Clin. Pharm. Ther. 2015, 40, 98–103. [Google Scholar] [CrossRef]
- Matsushima, S.; Maeda, K.; Ishiguro, N.; Igarashi, T.; Sugiyama, Y. Investigation of the inhibitory effects of various drugs on the hepatic uptake of fexofenadine in humans. Drug Metab. Dispos. 2008, 36, 663–669. [Google Scholar] [CrossRef]
- Soldner, A.; Christians, U.; Susanto, M.; Wacher, V.J.; Silverman, J.A.; Benet, L.Z. Grapefruit juice activates P-glycoprotein-mediated drug transport. Pharm. Res. 1999, 16, 478–485. [Google Scholar] [CrossRef] [PubMed]
- Kindla, J.; Muller, F.; Mieth, M.; Fromm, M.F.; Konig, J. Influence of non-steroidal anti-inflammatory drugs on organic anion transporting polypeptide (OATP) 1B1- and OATP1B3-mediated drug transport. Drug Metab. Dispos. 2011, 39, 1047–1053. [Google Scholar] [CrossRef] [PubMed]
- Kirby, B.J.; Collier, A.C.; Kharasch, E.D.; Whittington, D.; Thummel, K.E.; Unadkat, J.D. Complex drug interactions of the HIV protease inhibitors 3: Effect of simultaneous or staggered dosing of digoxin and ritonavir, nelfinavir, rifampin, or bupropion. Drug Metab. Dispos. 2012, 40, 610–616. [Google Scholar] [CrossRef] [PubMed]
- He, J.; Yu, Y.; Prasad, B.; Chen, X.; Unadkat, J.D. Mechanism of an unusual, but clinically significant, digoxin-bupropion drug interaction. Biopharm. Drug Dispos. 2014, 35, 253–263. [Google Scholar] [CrossRef] [PubMed]
Figure 1.
Concentration–time profile of fexofenadine administered alone or within cocktail.

Figure 2.
Comparison of individual fexofenadine AUC after administration of fexofenadine alone versus fexofenadine in cocktail. Volunteers in genotype group (a) are shown as solid lines and full squares; genotype group (b) as dotted lines and open symbols; genotype group (c) as dashed lines and cross symbols.


Table 1.
Stratification of volunteers in genotypic groups according to MDR1 genotypes regarding single nucleotide polymorphism (SNPs) 2677G > T/A and 3435C > T.
Table 1.
Stratification of volunteers in genotypic groups according to MDR1 genotypes regarding single nucleotide polymorphism (SNPs) 2677G > T/A and 3435C > T.
| Genotype Group | G2677T/A | C3435T | Number of Subjects |
|---|---|---|---|
| (a) | GG | CC | 4 |
| GG | CT | 5 | |
| GT | CC | 1 | |
| (b) | GT | CT | 10 |
| TT | CC | 4 | |
| GG | TT | 2 | |
| (c) | GT | TT | 1 |
| TT | TT | 3 |
Table 2.
Pharmacokinetic parameters of fexofenadine administered alone or with cytochromes (CYP) probe substrates.
Table 2.
Pharmacokinetic parameters of fexofenadine administered alone or with cytochromes (CYP) probe substrates.
| Fexofenadine Alone | Fexofenadine in Cocktail | Geometric Mean Ratio | 90% CI | p-Value | |
|---|---|---|---|---|---|
| t1/2 (h) | 2.46 ± 0.30 | 2.64 ± 0.55 | 1.07 | 1.00–1.13 | 0.054 |
| Tmax (h) | 1.60 ± 0.66 | 2.01 ± 0.98 | 1.14 | 0.87–1.50 | 0.082 |
| Cmax (ng/mL) | 59.6 ± 27.0 | 32.9 ± 21.8 | 0.51 | 0.44–0.59 | <0.001 |
| AUC0–8 (h·ng/mL) | 235.5 ± 92.8 | 140.8 ± 74.2 | 0.57 | 0.50–0.65 | <0.001 |
| AUC0–∞ (h·ng/mL) | 270.4 ± 102.3 | 165.7 ± 84.4 | 0.59 | 0.52–0.67 | <0.001 |
| Cl/F (l/h) | 103.9 ± 33.7 | 189.1 ± 95.1 | 1.70 | 1.49–1.93 | <0.001 |
Data are presented as mean values ± SD and geometric mean ratios (fexofenadine in cocktail vs. fexofenadine alone) with 90% CIs. AUC0–∞, area under the concentration–time curve extrapolated to infinity; AUC0–8, area under the concentration–time curve form 0 to 8 h; CI, confidence interval; Cl/F, apparent clearance; Cmax, maximum blood concentration; t1/2, elimination half-life; Tmax, time to maximum blood concentration.
Table 3.
Stratification of fexofenadine AUC according to MDR1 genotypes deduced from SNPs 2677G > T/A and 3435C > T.
Table 3.
Stratification of fexofenadine AUC according to MDR1 genotypes deduced from SNPs 2677G > T/A and 3435C > T.
| Genotype Group | AUC0–8 Fexofenadine Alone | AUC0–8 Fexofenadine in Cocktail |
|---|---|---|
| a (n = 10) | 207.3 ± 44.9 | 113.7 ± 77.5 |
| b (n = 16) | 225.4 ± 105.9 | 147.9 ± 74.9 |
| c (n = 4) | 346.7 ± 37.8 | 179.9 ± 49.6 |
Data are presented as mean values ± SD. For genotype classification see the Methods section. AUC0–8, area under the concentration–time curve form 0 to 8 h (last sampling point).
© 2019 by the authors. Licensee MDPI, Basel, Switzerland. This article is an open access article distributed under the terms and conditions of the Creative Commons Attribution (CC BY) license (http://creativecommons.org/licenses/by/4.0/).
Share and Cite
MDPI and ACS Style
Bosilkovska, M.; Magliocco, G.; Desmeules, J.; Samer, C.; Daali, Y. Interaction between Fexofenadine and CYP Phenotyping Probe Drugs in Geneva Cocktail. J. Pers. Med. 2019, 9, 45. https://doi.org/10.3390/jpm9040045
AMA Style
Bosilkovska M, Magliocco G, Desmeules J, Samer C, Daali Y. Interaction between Fexofenadine and CYP Phenotyping Probe Drugs in Geneva Cocktail. Journal of Personalized Medicine. 2019; 9(4):45. https://doi.org/10.3390/jpm9040045
Chicago/Turabian StyleBosilkovska, Marija, Gaelle Magliocco, Jules Desmeules, Caroline Samer, and Youssef Daali. 2019. "Interaction between Fexofenadine and CYP Phenotyping Probe Drugs in Geneva Cocktail" Journal of Personalized Medicine 9, no. 4: 45. https://doi.org/10.3390/jpm9040045
Note that from the first issue of 2016, this journal uses article numbers instead of page numbers. See further details here.