UV Monochromatic Imaging of the Protoplanetary Nebula Hen 3-1475 Using HST STIS
by
 , , , and
Xuan Fang
1,2,* ,
,
Martín A. Guerrero
3,
Ana I. Gómez de Castro
4,
Jesús A. Toalá
5,
Bruce Balick
6 and
Angels Riera
7 1
Laboratory for Space Research, Faculty of Science, University of Hong Kong, Pokfulam Road, Hong Kong, China
2
Department of Physics, Faculty of Science, University of Hong Kong, Pokfulam Road, Hong Kong, China
3
Instituto de Astrofísica de Andalucía (IAA-CSIC), Glorieta de la Astronomía s/n, E-18008 Granada, Spain
4
AEGORA Research Group, Facultad de Ciencias, Universidad Complutense, E-28040 Madrid, Spain
5
Instituto de Radioastronomía y Astrofísica, UNAM Campus Morelia, Apartado Postal 3-72, Morelia 58090, Michoacán, Mexico
6
Department of Astronomy, University of Washingtgon, Seattle, WA 98 195-1580, USA
7
Departament de Física i Enginyeria Nuclear, EUETIB, Universitat Politécnica de Catalunya, E-08036 Barcelona, Spain
*
Author to whom correspondence should be addressed.
Galaxies 2018, 6(4), 141; https://doi.org/10.3390/galaxies6040141
Submission received: 8 August 2018
/
Revised: 10 December 2018
/
Accepted: 11 December 2018
/
Published: 14 December 2018
(This article belongs to the Special Issue Asymmetric Planetary Nebulae VII)
Abstract
:Collimated outflows and jets play a critical role in shaping planetary nebulae (PNe), especially in the brief transition from a spherical AGB envelope to an aspherical PN, which is called the protoplanetary nebula (pPN) phase. We present UV observations of Hen 3-1475, a bipolar pPN with fast, highly collimated jets, obtained with STIS on board the Hubble Space Telescope (HST). The deep, low-dispersion spectroscopy enabled monochromatic imaging of Hen 3-1475 in different UV nebular emission lines; this is the first of such attempt ever conducted for a pPN. The northwest inner knot (NW1) is resolved into four components in Mg ii 2800. Through comparison analysis with the HST optical narrowband images obtained 6 yr earlier, we found that these components of NW1 hardly move, despite of a negative gradient of high radial velocities, from −1550 km s on the innermost component to ∼−300 km s on the outermost. These NW1 knot components might thus be quasi-stationary shocks near the tip of the conical outflow of Hen 3-1475.
1. Introduction
Hen 3-1475 (a.k.a., the “Garden Sprinkler Nebula”; also IRAS 17423-1755) is known to harbour very fast bipolar outflows [1]. Since its nature as a protoplanetary nebula (pPN) was settled, Hen 3-1475 has been imaged several times [2,3,4,5]. It has a highly collimated bipolar structure with an S-shaped string of point-symmetric, [N ii]-bright knots extending over ∼17 along the main axis (Figure 1). High-dispersion spectroscopy revealed high-velocity jets (1200 km s, [4]); ultra-fast (up to 2300 km s) winds was detected very close to the central star [6]. Extended (or diffuse) X-ray emission a signature of interactions of the fast and slow stellar winds. Hen 3-1475 is so far the only pPN where diffuse X-ray emission is detected [7]; this X-ray emission mostly comes from its brightest NW11 knot, whose emission is shock excited [4,8,9]. Its fast outflows are being collimated into jets far away from the central star, through two inner cones (i.e., the limb-brightened edges of conical shocks; [3]), but the collimation mechanism is not well understood.
The shock effects of stellar wind interactions can also be traced by UV emission. IUE detection of UV emission lines in Hen 3-1475 was only marginal due to dust obscuration [10]. This proceeding paper reports the first UV spectroscopy of Hen 3-1475 with high spatial resolution.
2. STIS Observations and the UV Spectra
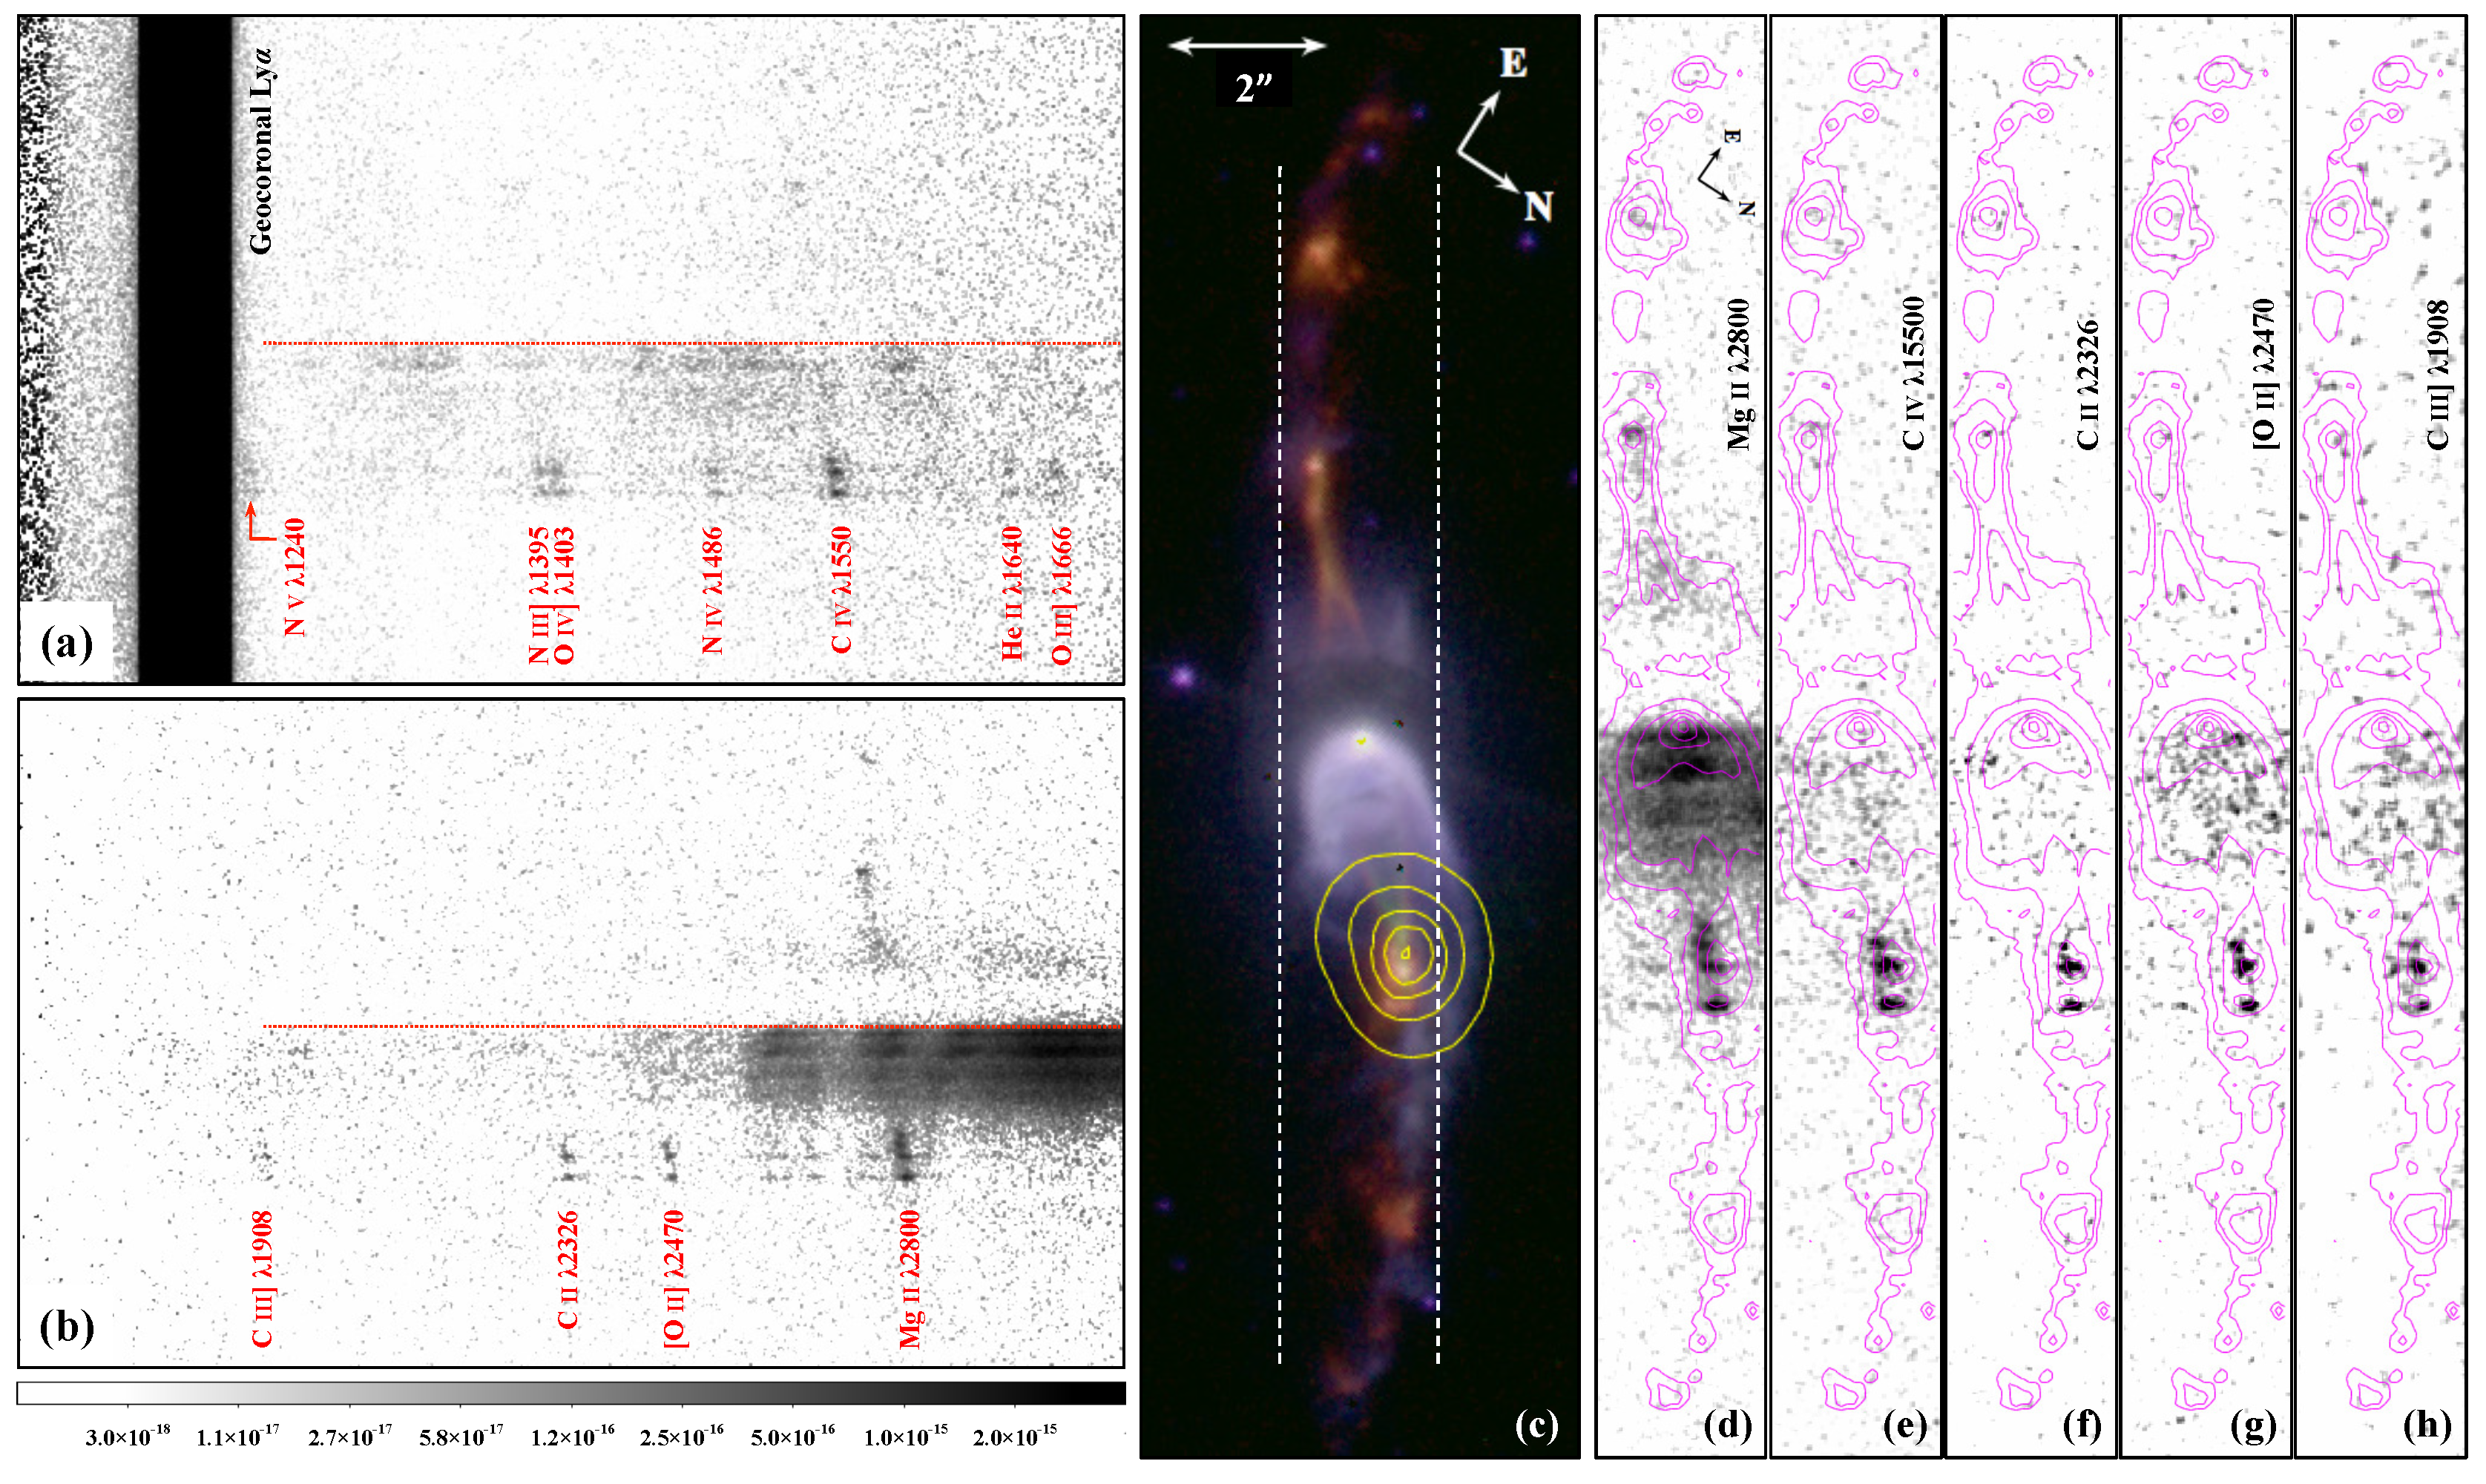
Long-slit UV spectra of Hen 3-1475 were obtained with the Space Telescope Imaging Spectrograph (STIS) on board the Hubble Space Telescope (HST) on 11 June 2015 (GO prop. #13838, PI: X. Fang, Cycle 22). The STIS 522 long slit was centered on the core (R.A.=17451419, Decl.=−17564690) with a position angle (PA, defined as the angle measured east from north) of 12465, along the nebular axis. All knots lie within the slit (Figure 1c). The FUV spectrum was obtained with the first-order grating G140L (∼1150–1730 Å) and STIS/FUV-MAMA (00246 pixel) at an exposure of 2800 s, and has a spectral resolution of 1000–1440 with a dispersion of 0.6 Å pixel. The NUV spectrum was obtained with the first-order grating G230L (∼1570–3180 Å) and STIS/NUV-MAMA (00248 pixel) at an exposure of 2100 s, and has a spectral resolution of 500–1010 with a 1.55 Å pixel dispersion. The STIS observations were made in the TIME-TAG mode. Data were reduced and calibrated using the HST STIS pipeline, and are demonstrated in Figure 1a,b. The FUV spectrum covers N v 1240 (a blend of 1239,1243; all wavelengths in Å), C iv 1550 (a blend of 1548,1551), He ii1640, O iii] 1666, etc. In NUV we detected C iii] 1908 (a blend of 1907,1909), C ii 2326, [O ii] 2470, and Mg ii 2800 (a blend of 2795,2803). The deep, low-resolution spectroscopy enables monochromatic imaging of Hen 3-1475 in UV nebular emission lines (Figure 1d–h). No fine-structure transition lines within any doublet are spectroscopically resolved in our UV spectra.
3. UV Morphology of Hen 3-1475
In the STIS low-dispersion UV spectra, the overall morphology of Hen 3-1475 as seen in the HST optical images is generally maintained in UV emission lines (Figure 1a,b), especially in Mg ii 2800, the strongest emission line in our UV spectra, where the brightest region between the NW1 and SE1 knots are shown. We created UV monochromatic images by first carefully selecting and chopping from the STIS 2D spectrograms rectangular regions (centered on UV emission lines), and then registering them with the archival WFC3 F656N image (GO prop. 11580, PI: B. Balick); NW1 and SE1 are both seen in the UV spectral-line images and thus used as reference when aligning the chopped UV images with the WFC3 F656N image. The UV morphology of Hen 3-1475 was studied in Mg ii 2800, the brightest nebular emission line in the STIS UV spectra. The WFC3 narrowband filters F656N and F658N show the H and [N ii] 6583 emission, respectively, from the jets and knots in Hen 3-1475 that are presumably shock excited [4].
Our HST STIS UV spectroscopy of Hen 3-1475, utilizing a broad (2 width) long slit that covers the whole object, follows essentially the same technique employed in the previous STIS optical slitless spectroscopy of the Magellanic Cloud PNe [11,12]. In an optical slitless (or broad-slit) spectrum, the overall morphology of the target can be seen at different nebular emission lines; this is equivalent to monochromatic imaging of the target at individual emission lines. Our STIS UV low-dispersion spectra have the similar format, as the tilted nebular axis of Hen 3-1475 (with respect to the slit direction) that follows the optical image is also seen in the UV emission lines (see Figure 1a,b), except that, as discussed in Section 4, the radial velocities of the jet in Hen 3-1475 are so high that some features along the jet are blueshifted with respect to their counterparts in the HST narrow-band images (see the description below and the discussion in Section 4).
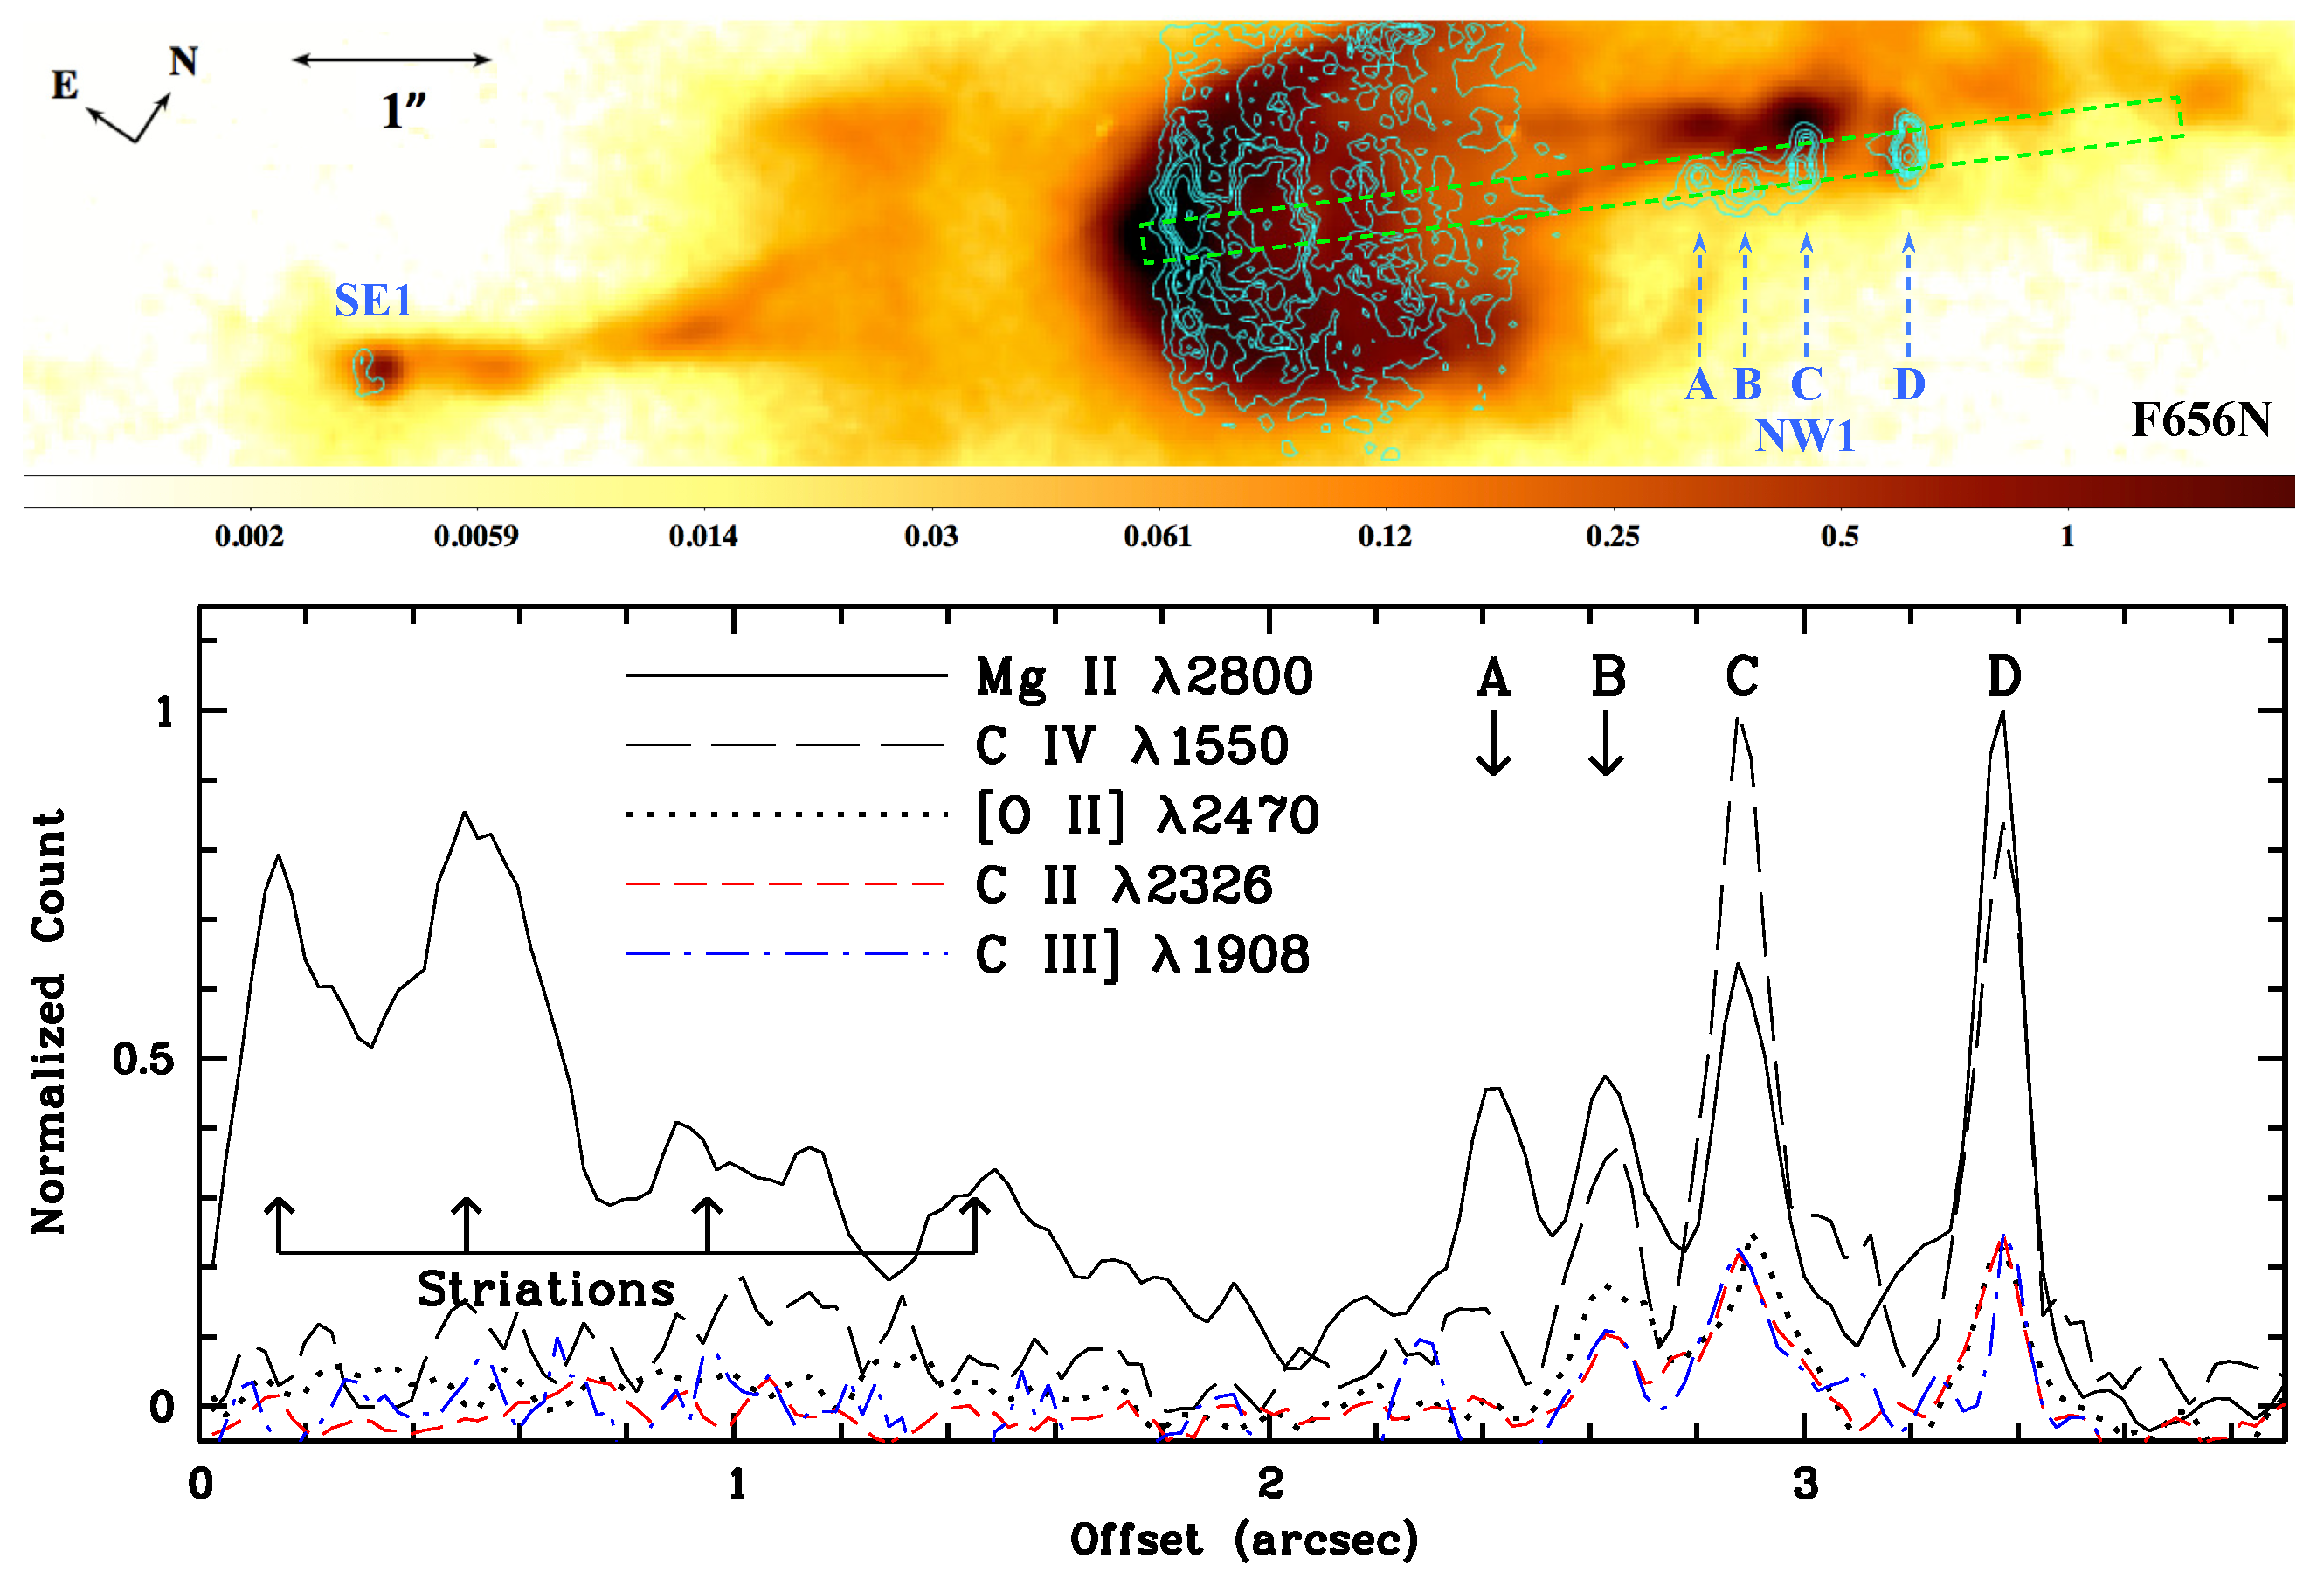
In the Mg ii 2800 spectral-line image (Figure 1d), the NW1 knot is resolved into four components, hereafter named A, B, C, and D from inside out (Figure 2, top), with angular sizes of ∼012–014 along jet axis; in the other UV lines, generally fainter than Mg ii, only B, C, and D are seen (Figure 1e–h). The SE1 knot seen in the UV could be the counterpart of the outermost component D. The optical counterparts (in H) of the four UV components A, B, C, and D are located 249, 267, 291, and 330 from the central star, respectively. B, C, and D are “elongated” (in the dispersion direction) in the Mg ii spectral-line image, which may be due to internal velocity gradients [4]; this effect is obvious in B and C, which are compact in the H image. D comprises two subcomponents in H that are ∼015 apart and stretch by 032, similar to the size in the UV. The NW conical shock “converges” on A (Figure 2), the most compact (radius∼006) among the four NW1 components in the UV.
Along the dispersion direction of the STIS NUV spectrum, most of the components of the NW1 knot are displaced with respect to their optical counterparts, especially in H; we briefly discuss this in Section 4. Along the slit direction, positions of A, B, and C in the UV are unchanged compared to their counterparts in H. Component D and SE1 in the UV are slightly outside their H counterparts (Figure 2, top) due to jet propagation since 2009. The position of D in Mg ii is shifted outward (i.e., towards NW) by 0069 from its position in H, which corresponds to a proper motion of 11.8 mas yr, or ∼280 km s. Similarly, SE1 in Mg ii is displaced from its position in H by 0091, corresponding to ∼15.5 mas yr, or ∼360 km s.
In the NUV spectrum, <2 from the central star, there are four “stripes” (or striations) that are more prominent near the red end of STIS NUV-MAMA (Figure 1b). These striations are only detected in the NW lobe, and seem to spatially align with the optical features at corresponding locations: in H and [N ii], the hollow U-shaped “bowls” near the nucleus of Hen 3-1475 also seem striated (Figure 1c). The central region of Hen 3-1475 is dominated by the scattered starlight as shown in the HST STIS G750M spectrum ([4], see Figure 2 therein). Along the jet axis, the four UV striations in the NW lobe are ∼013, 05, 095, and 143 from the central star (Figure 2, bottom).
4. Jet Kinematics and Preliminary Interpretation
In the slit direction (i.e., along the nebular axis of Hen 3-1475), positions of A, B, and C in Mg ii 2800 emission generally coincide with those of their counterparts in H (the WFC3 F656N image obtained in 2009). Along the dispersion direction (i.e., perpendicular to the long slit) of the STIS NUV spectrum, these three inner components of NW1 show noticeable blueward displacements with respect to their counterparts in H (Figure 2, top); these displacements are probably due to Doppler shift, given that the NW jet of Hen 3-1475 has high approaching radial velocities [4,8].
Compared to the H image, A, B, and C in Mg ii emission are shifted blueward by −1550 ± 160, −1200 ± 330, and −1100 ± 400 km s, respectively. The systemic radial velocity of Hen 3-1475 (+40 km s, [4]) is well within the velocity errors. At 2800 Å the kinematic resolution of the G230L grating is ∼310 km s (as given by the STIS Instrument Handbook), which can be set as an upper-limit approaching speed of the outermost component D. Adopting this radial speed and the sky-projected velocity of D (∼280 km s, see Section 3), we deduce a jet inclination (i, with respect to the line of sight) ≥42, which is consistent with the previous estimate of 40 [4]. The radial velocities of A, B, C, and D of the NW1 knot generally follow a trend of negative gradient, as found in previous HST STIS G750M optical spectroscopy of the [N ii] and H emission lines (in 1999; [4]).
The unchanged (or very little changes in) radial positions and fast Doppler speeds of the NW1 knot components seem to resemble quasi-stationary shocks: A, B, C, and D may actually be shock interfaces where the outflowing gas moves through with high speeds, and have no (or very small) measurable proper motions; each of these clumpy shocks may brighten or fade in time owing to variations in density or speed of the gas flow. The negative radial velocity gradient in NW1 may then be explained as a series of speed losses of the (possibly unstable) flow as it propagates outward along the jet. This interpretation, although quite reasonable, is speculative and needs careful assessment with comprehensive hydrodynamic simulations.
A precessing jet model with a time-dependent ejection velocity was proposed to interpret the observed morphology and kinematics of Hen 3-1475 [13]; but this model might still be ad hoc. The actual jet dynamics within the lobes could be more complex than previously anticipated. An investigation of the multi-epoch HST F658N images suggests that the outer knots (NW2/SE2 and NW3/SE3) of Hen 3-1475 may not be the radially fast-moving “bullets” as previously thought, but locally excited due to Kelvin–Helmholtz instabilities [14]. If this is true, then NW2/SE2 and NW3/SE3 are probably different from NW1/SE1 in terms of formation and excitation. Better understanding of the jets in Hen 3-1475 requires better modeling.
The simultaneous detection of X-ray, UV and optical emission suggests that the NW1 knots are cooling regions with strong temperature gradient. We also expect ionization stratification in NW1, i.e., Mg ii and H may come from different regions. However, the UV components (at least, the innermost component A) of NW1 are spatially unresolved in our STIS UV monochromatic imaging, given that their angular sizes are comparable to the actual angular resolution of the STIS/NUV-MAMA detector (006, as provided by the STIS Instrument Handbook); thus our comparison of the NW1 knot positions in Mg ii and H is reasonable.
5. Summary and Conclusions
We report on monochromatic imaging of Hen 3-1475 in UV nebular emission lines obtained through the HST STIS UV long-slit spectroscopy; this is the first of such attempt ever made for a pPN in the UV. We analyzed the UV morphology of Hen 3-1475, in conjunction with the archival HST optical narrowband images. The high spatial resolution of our STIS imaging enables a very sharp view of the inner region of Hen 3-1475, especially the NW1 knot near the tip of the inner conical shock. The NW1 knot is clearly resolved into four components in the Mg ii 2800 line emission.
The four UV components of the NW1 knot are distributed roughly along the jet axis. Compared to their optical counterparts in H, the four components of NW1 are mostly blueshifted in the Mg ii spectral-line image, probably due to their high (approaching) radial velocities, from −1550 km s on the innermost component to ∼−300 km s on the outermost one. Despite of their high Doppler speeds, these components of NW1 show no obvious proper motions compared to previous HST imaging, indicating that they might be quasi-stationary shocks where fast gas flows through.
Author Contributions
The original HST proposal (conceptualization) was prepared together by X.F., M.A.G., A.I.G.d.C., J.A.T., and A.R.; analysis of the HST STIS data was carried out by X.F.; data visualization, X.F., M.A.G., B.B., and J.A.T.; intensive discussion was made together by B.B., M.A.G., X.F., A.I.G.d.C, and J.A.T.; writing–original draft preparation, X.F.; writing–review and editing, M.A.G., B.B., A.I.G.d.C., and J.A.T.
Funding
M.A.G. acknowledges support of the grant AYA 2014-57280-P, cofunded with FEDER funds. M.A.G. and J.A.T. are funded by UNAM DGAPA PAPITT project IA100318.
Acknowledgments
This research is based on observations made with the NASA/ESA Hubble Space Telescope, and obtained from the Hubble Legacy Archive (HLA; http://hla.stsci.edu), which is a collaboration between the Space Telescope Science Institute (STScI/NASA), the Space Telescope European Coordinating Facility (ST-ECF/ESA) and the Canadian Astronomy Data Centre (CADC/NRC/CSA). This research also made use of the Chandra Data Archive (CDA; http://cxc.cfa.harvard.edu/cda) and NASA’s Astrophysics Data System (http://adsabs.harvard.edu). X.F. acknowledges the support and hospitality of the IAA-CSIC for an academic visit in September 2017, during which part of the contents in this paper was discussed. We thank Quentin A. Parker for discussion and helpful suggestions. The coauthor Angels Riera passed away in Barcelona on 27 September 2017, when the HST STIS UV spectra reported in this article were analyzed; she was the first to recognize the peculiar nature of the bipolar pPN Hen 3-1475. This article is dedicated to her.
Conflicts of Interest
The authors declare no conflict of interest.
References
- Riera, A.; García-Lario, P.; Manchado, A.; Pottasch, S.R.; Raga, A.C. IRAS 17423-1755: A massive post-AGB star evolving into the planetary nebula stage? Astron. Astrophys. 1995, 302, 137–153. [Google Scholar]
- Bobrowsky, M.; Zijlstra, A.A.; Grebel, E.K.; Tinney, C.G.; Hekkert, P.; Van de Steene, G.C.; Likkel, L.; Bedding, T.R. He 3-1475 and its jets. Astrophys. J. Lett. 1995, 446, L89–L92. [Google Scholar] [CrossRef]
- Borkowski, K.J.; Blondin, J.M.; Harrington, J.P. Collimation of astrophysical jets: The protoplanetary nebula He 3-1475. Astrophys. J. Lett. 1997, 482, L97–L100. [Google Scholar] [CrossRef]
- Borkowski, K.J.; Harrington, J.P. Kinematics of 1200 kilometer per second jets in He 3-1475. Astrophys. J. 2001, 550, 778–784. [Google Scholar] [CrossRef]
- Ueta, T.; Meixner, M.; Bobrowsky, M. A Hubble Space Telescope snapshot survey of proto-planetary nebula candidates: Two types of axisymmetric reflection nebulosities. Astrophys. J. 2000, 528, 861–884. [Google Scholar] [CrossRef]
- SáchezContreras, C.; Sahai, R. A 2000 kilometer per second “pristine” post-asymptotic giant branch wind in the proto-planetary nebula He 3-1475. Astrophys. J. Lett. 2001, 553, L173–L176. [Google Scholar] [CrossRef]
- Sahai, R.; Kastner, J.H.; Frank, A.; Morris, M.; Blackman, E.G. X-ray emission from the pre-planetary nebula Henize 3-1475. Astrophys. J. Lett. 2003, 599, L87–L90. [Google Scholar] [CrossRef]
- Riera, A.; García-Lario, P.; Manchado, A.; Bobrowsky, M.; Estalella, R. The high-velocity outflow in the proto-planetary nebula Hen 3-1475. Astron. Astrophys. 2003, 401, 1039–1056. [Google Scholar] [CrossRef]
- Riera, A.; Binette, L.; Raga, A.C. Shock excitation of the knots of Hen 3-1475. Astron. Astrophys. 2006, 455, 203–213. [Google Scholar] [CrossRef] [Green Version]
- Gauba, G.; Parthasarathy, M. UV (IUE) spectra of hot post-AGB candidates. Astron. Astrophys. 2003, 407, 1007–1020. [Google Scholar] [CrossRef]
- Stanghellini, L.; Shaw, R.A.; Mutchler, M.; Palen, S.; Balick, B.; Blades, J.C. Optical slitless spectroscopy of Large Magellanic Cloud planetary nebulae: A study of the emission lines and morphology. Astrophys. J. 2002, 575, 178. [Google Scholar] [CrossRef]
- Stanghellini, L.; Shaw, R.A.; Balick, B.; Mutchler, M.; Blades, J.C.; Villaver, E. Space Telescope Imaging Spectrograph slitless observations of Small Magellanic Cloud planetary nebulae: A study on morphology, emission-line intensity, andevolution. Astrophys. J. 2003, 596, 997. [Google Scholar] [CrossRef]
- Velázquez, P.F.; Riera, A.; Raga, C. Time-dependent ejection velocity model for the outflow of Hen 3-1475. Astron. Astrophys. 2004, 419, 991–998. [Google Scholar] [CrossRef] [Green Version]
- Fang, X.; Gómez de Castro, A.I.; Toalá, J.A.; Riera, A. HST STIS UV spectroscopic observations of the protoplanetary nebula Hen 3-1475. Astrophys. J. Lett. 2018, 865, L23. [Google Scholar] [CrossRef]
| 1. | Following (Borkowski et al. [3], Figure 2 therein), we hereafter refer the inner, middle, and outer pairs of knots in Hen 3-1475 as NW1/SE1, NW2/SE2, and NW3/SE3, respectively. Here NW means northwest, and SE means southeast. |
Figure 1.
(Left) Negative grayscale images of the STIS FUV-MAMA (a) and NUV-MAMA (b) spectra of Hen 3-1475; emission features are identified. Note the bright geocoronal Ly. Red dotted lines mark the position of the central star. The color bar below shows the grey scale coded in flux values (in units of erg s cm Å). Panel (c): HST 2009 WFC3 color-composite image of Hen 3-1475 created with F658N (red), F656N (green), and F555W (blue) and overlaid with Chandra X-ray emission contours (yellow; Obs. ID 2580, PI: R. Sahai); white dashed lines indicate the STIS 522 long slit (PA = 12465). Panels (d–h): STIS UV spectral-line images (see legend) overlaid by WFC3 F658N emission contours (magenta); the panels are displayed in negative greyscale and slightly smoothed to reduce noise.

Figure 2.
(Top) Emission contours (in cyan) of the STIS Mg ii 2800 line overlaid on the 2009 WFC3 F656N image showing the central 210 region of Hen 3-1475; images are displayed in logarithm and data counts are indicated on the colorbar. The NW1 knot is resolved into four components (A, B, C, and D labeled in blue) in Mg ii emission. Nebular core is saturated in F656N to enhance lobe structures, including NW1/SE1 and the conical shocks. (Bottom) Emission profiles of different UV nebular lines along a cut (green-dashed rectangle in the top panel) through the central star and the NW1 knot components, at PA = 311; positions of the four components of NW1 and the striations seen in Mg ii emission (Figure 1d) are labeled. The other UV emission lines are shown in Figure 1e–h.

© 2018 by the authors. Licensee MDPI, Basel, Switzerland. This article is an open access article distributed under the terms and conditions of the Creative Commons Attribution (CC BY) license (http://creativecommons.org/licenses/by/4.0/).
Share and Cite
MDPI and ACS Style
Fang, X.; Guerrero, M.A.; Gómez de Castro, A.I.; Toalá, J.A.; Balick, B.; Riera, A. UV Monochromatic Imaging of the Protoplanetary Nebula Hen 3-1475 Using HST STIS. Galaxies 2018, 6, 141. https://doi.org/10.3390/galaxies6040141
AMA Style
Fang X, Guerrero MA, Gómez de Castro AI, Toalá JA, Balick B, Riera A. UV Monochromatic Imaging of the Protoplanetary Nebula Hen 3-1475 Using HST STIS. Galaxies. 2018; 6(4):141. https://doi.org/10.3390/galaxies6040141
Chicago/Turabian StyleFang, Xuan, Martín A. Guerrero, Ana I. Gómez de Castro, Jesús A. Toalá, Bruce Balick, and Angels Riera. 2018. "UV Monochromatic Imaging of the Protoplanetary Nebula Hen 3-1475 Using HST STIS" Galaxies 6, no. 4: 141. https://doi.org/10.3390/galaxies6040141
Note that from the first issue of 2016, this journal uses article numbers instead of page numbers. See further details here.