Article

Magnetic Fields in Galaxy Clusters and in the Large-Scale Structure of the Universe

1
INAF—Osservatorio Astronomico di Cagliari, Via della Scienza 5, 09047 Selargiu, Italy
2
MPA, Karl-Schwarzschild-Str 1, 85748 Garching bei München, Germany
3
Canadian Institute for Theoretical Astrophysics, University of Toronto, 60 St. George Street, Toronto, ON M5S 3H8, Canada
4
Istituto di Radioastronomia, Via Gobetti 101, 40129 Bologna, Italy
5
Department of Physics Astronomy—DIFA, Università degli Studi di Bologna, Viale Berti Pichat 6/2, 40126 Bologna, Italy
*
Author to whom correspondence should be addressed.
Galaxies 2018, 6(4), 142; https://doi.org/10.3390/galaxies6040142
Submission received: 1 November 2018 / Revised: 27 November 2018 / Accepted: 29 November 2018 / Published: 17 December 2018
(This article belongs to the Special Issue The Power of Faraday Tomography)

Abstract

:
The formation and history of cosmic magnetism is still widely unknown. Significant progress can be made through the study of magnetic fields properties in the large-scale structure of the Universe: galaxy clusters, filaments, and voids of the cosmic web. A powerful tool to study magnetization of these environments is represented by radio observations of diffuse synchrotron sources and background or embedded radio galaxies. To draw a detailed picture of cosmic magnetism, high-quality data of these sources need to be used in conjunction with sophisticated tools of analysis.

1. Introduction

Evidence of magnetization has been found in a variety of environments up to the largest gravitationally bound systems of the Universe, clusters of galaxies. A fraction of galaxy clusters hosts diffuse and extended synchrotron sources that reveal the presence in these systems of ∼ μ G magnetic fields and ultra-relativistic electrons ( γ 10 4 ) at their center (e.g., [1,2]). Despite the fact that these sources have been detected only in about 50 galaxy clusters, the presence of magnetic fields has been recognized in all galaxy clusters because they act as a birefringent medium for the signal traversing them (e.g., [3]). Magneto-hydro-dynamical simulations suggest that filaments connecting galaxy clusters should be magnetized with strengths ≳ nG (e.g., [4]). To date, only indications of the presence of magnetic fields have been found outside galaxy clusters [5] and upper limits on their strength of 0.03–2 μ G have been derived from the cross-correlation of radio images with magneto-hydro-dynamical simulations and data at other wavelengths [6,7]. Filaments should also host a large fraction of the thermal baryons that inhabit our Universe that should be visible at X-ray and millimeter/sub-millimeter wavelengths due to thermal bremsstrahlung and the Sunyaev-Zel’dovich effect. These signals are very hard to detect due to the low-densities involved. However, the mixing of magnetic fields and thermal particles could be observed at radio frequencies through the Faraday rotation of the signal of background radio sources up to a level of ∼1 rad/m 2 [8].
Observations of radio galaxies and diffuse synchrotron radio sources in the large-scale structure of the Universe have the potential to shed light on the magnetic field properties in these environments and, therefore, give a precious contribution in the comprehension of genesis and history of cosmic magnetism. Presently, there is a general agreement on a primordial seed field modified in strength and geometry by structure formation processes. Galaxy clusters mergers, for example, can amplify magnetic fields and completely change their structure. Therefore, intracluster magnetic fields are thought to reflect the present level of turbulence in the environment and, consequently, the evolutionary processes. In the cluster outskirts, filaments, and voids of the cosmic web, the gas motion did not have enough time to affect magnetic field strength and structure and, therefore, they are deeply linked to those of the seed field. A detailed overview of magnetic field properties in these environments is essential for shedding light on cosmic magnetism but the detection and measurement of these magnetic fields are very challenging due to their extremely weak strengths. High-quality observations obtained with the new generation of radio telescopes in combination with advanced tools of analysis will play a key role in the study of magnetic fields from galaxy clusters to filaments and voids.
In the following, we report our recent works in the field. In Section 2, we describe the techniques that can be used for the study of magnetic fields in the large-scale structure of the Universe, with the help of the numerical simulations presented in Section 3. In Section 4 and Section 5 we respectively present and discuss our findings concerning the magnetization of galaxy clusters and the results and perspective beyond these systems. Finally, in Section 6 we draw our conclusions.

2. Methods

The presence of magnetic fields in the large-scale structure of the Universe can be investigated through the analysis of the emission of diffuse large-scale synchrotron sources and the Faraday effect on background radio galaxies with data of both individual objects and statistical samples. Diffuse synchrotron emission probes magnetic field properties on large-scales, while the depolarization of the radio galaxy signal witnesses the small-scale properties of magnetic fields.

2.1. Diffuse Synchrotron Emission

To date, diffuse synchrotron sources called radio halos have been detected in about 50 galaxy clusters characterized by ongoing violent mergers (Figure 1, left panel). Radio halos directly prove the coexistence of magnetic fields and ultra-relativistic electrons at the center of galaxy clusters. Their emission in total intensity and polarization is deeply linked to the properties of intraclutser magnetic fields in strength and structure: total intensity is primarily related to the magnetic field strength, while polarization to its degree of order. Therefore, the analysis of their properties is capable to put solid constraints on the intracluster magnetic field power spectrum. Radio halos are characterized by a brightness of about 0.1–1 μ Jy/arcsec 2 at 1.4 GHz, are ∼Mpc in size, show a radio emissivity of ≈ 10 42 erg/s/cm 3 /Hz and, unfortunately, are typically unpolarized at the present sensitivity limits (see [9] and references therein). In the periphery of a fraction of galaxy clusters, diffuse low-surface-brightness (∼0.1–1 μ Jy/arcsec 2 at 1.4 GHz), extended (≳1 Mpc) and strongly polarized (≈20–30%) sources have been observed. They indicate the presence of ≈ μ G magnetic fields and γ 10 4 relativistic particles at the location of shock fronts in disturbed systems (e.g., [10]). Beyond galaxy clusters, only hints of diffuse synchrotron sources have been reported in the literature, corresponding to a surface brightness ∼0.01–0.1 μ Jy/arcsec 2 at 1.4 GHz (e.g., [11,12]).

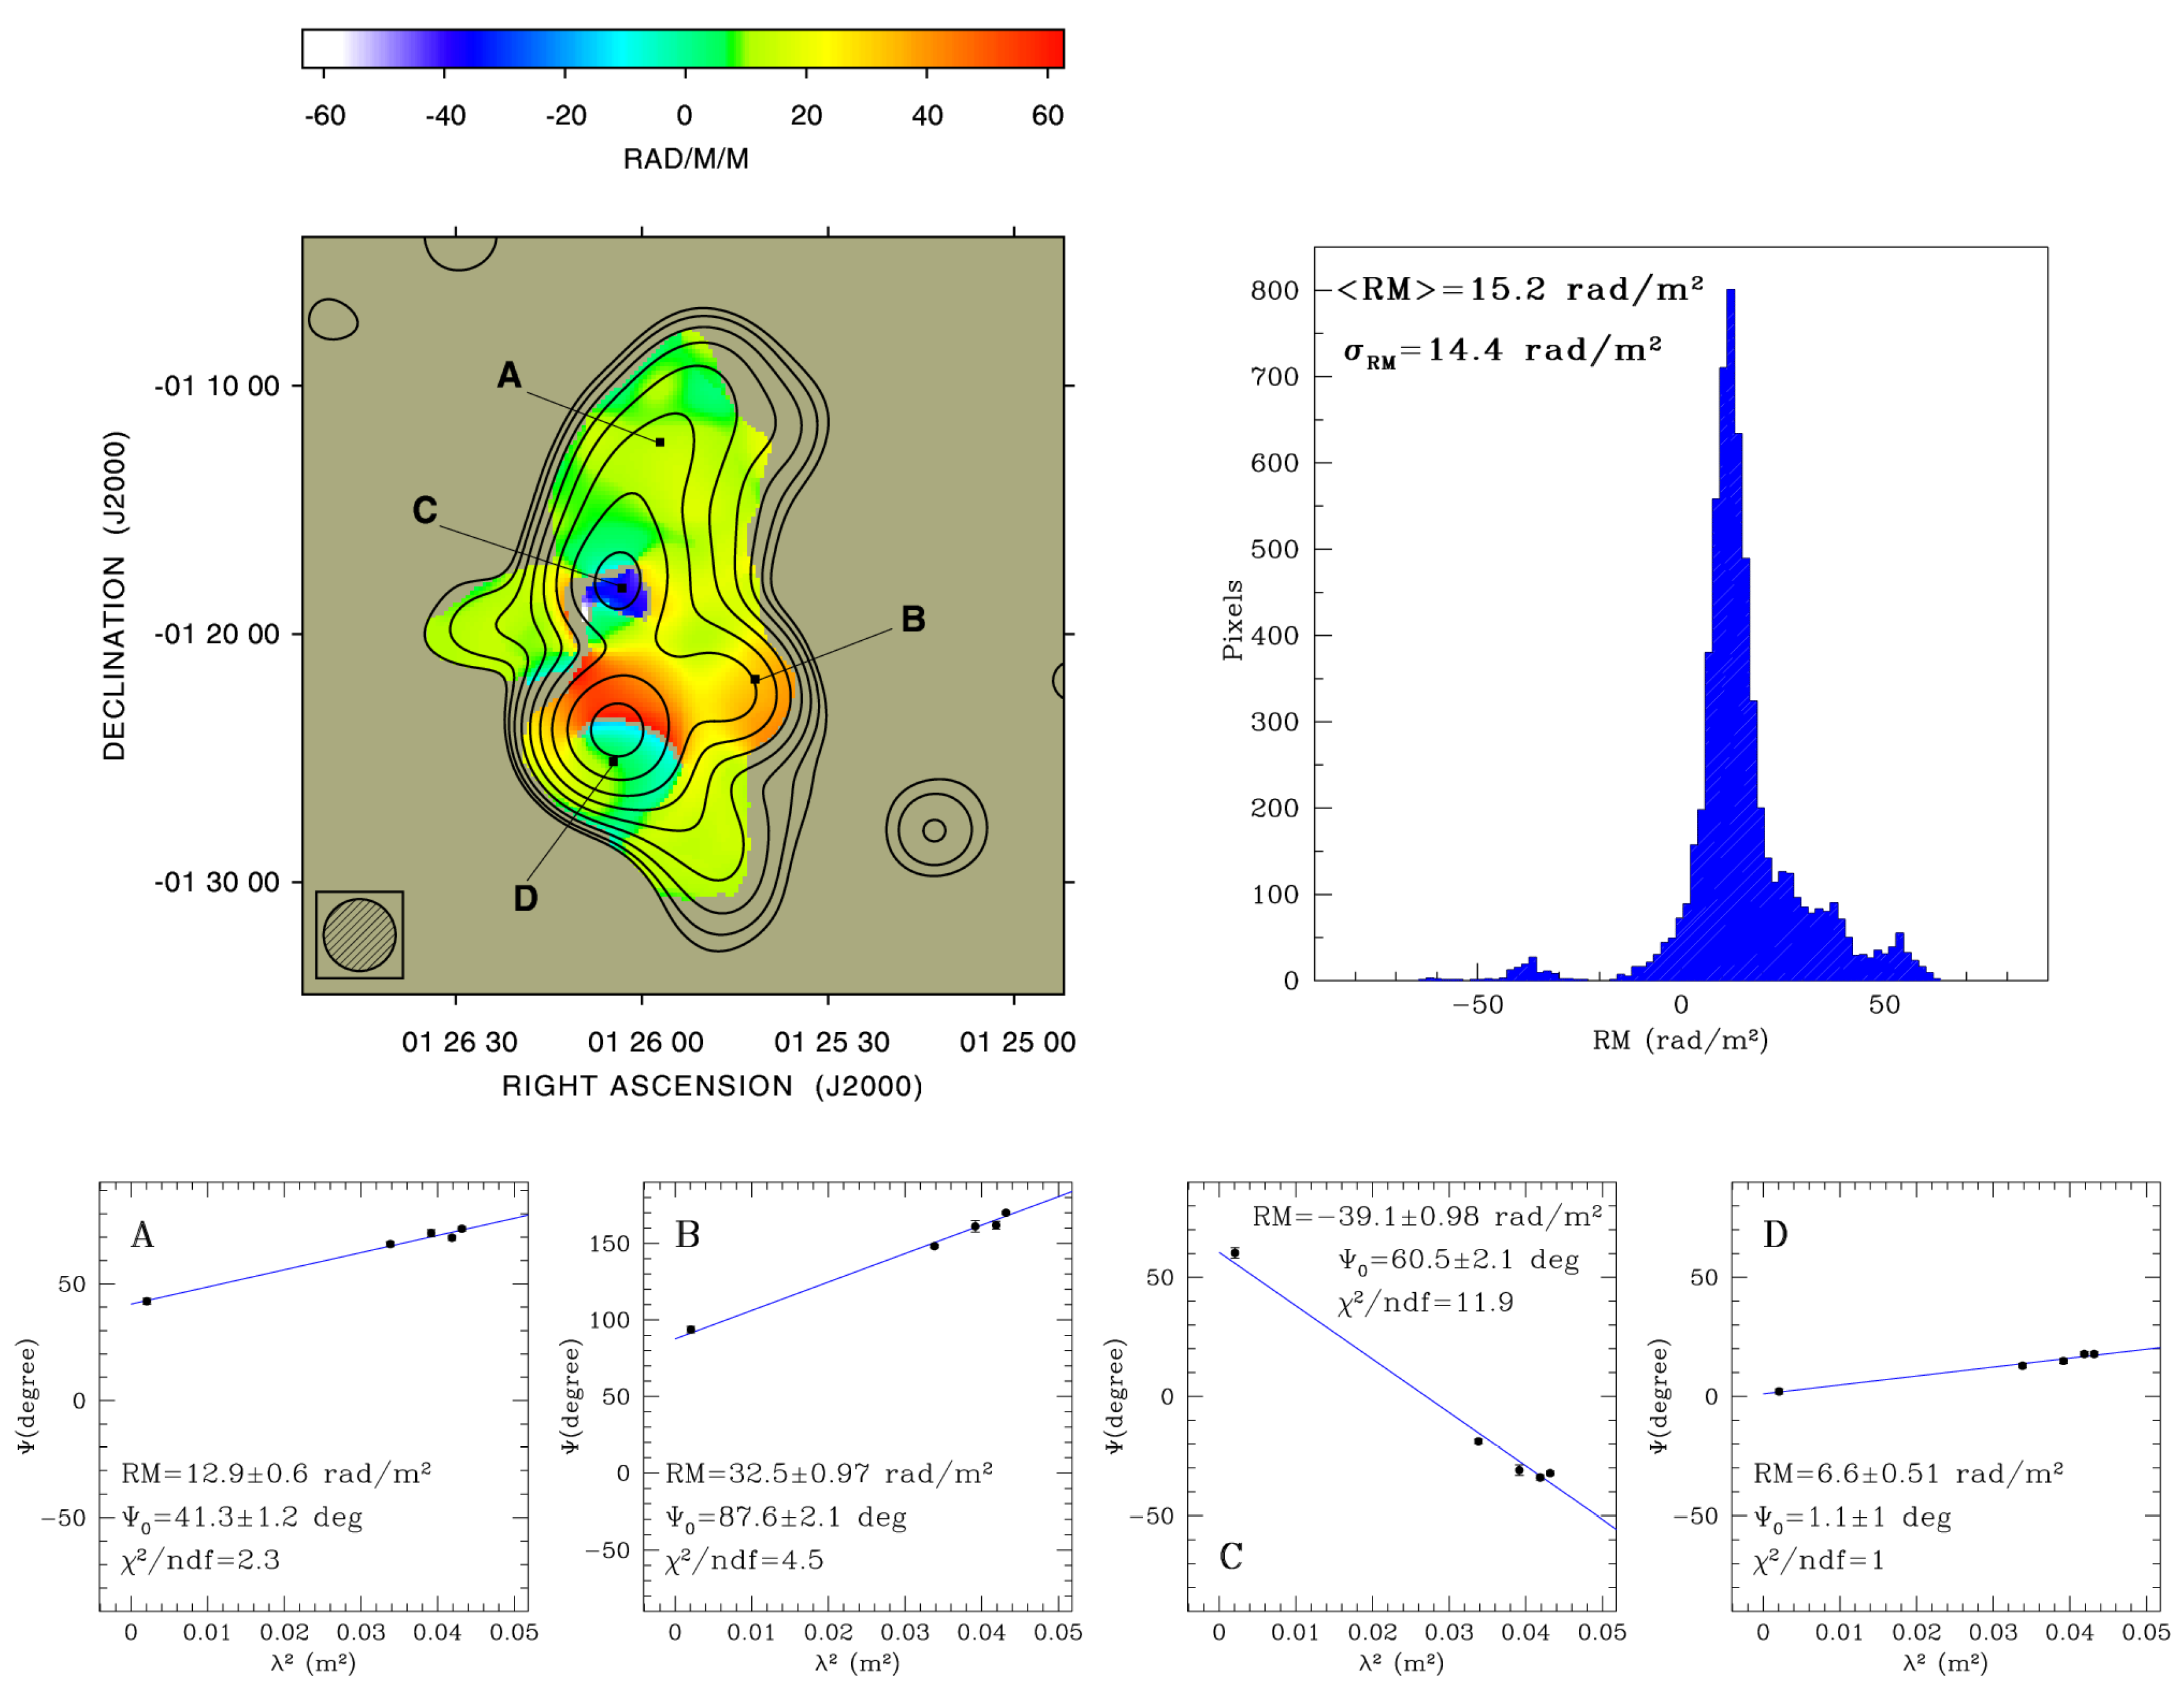
2.2. Polarimetric Properties of Radio Galaxies

An alternative and complementary instrument to study magnetic fields in the cosmic web is given by the Faraday effect on embedded or background radio galaxies (e.g., [14]). The linearly polarized signal of a radio galaxy suffers a rotation of the polarization angle while crossing a magneto-ionic medium as a galaxy cluster. For a completely foreground Faraday screen, the rotation is given by
Ψ obs = Ψ int + R M λ 2
where Ψ int and Ψ obs are respectively the intrinsic and observed polarization angle, λ is the wavelength of observation, and R M is the rotation measure,
R M = 812 0 l n e B | | d l rad / m 2 ,
related to the magnetic field component parallel to the line of sight B | | ( μ G) and to the thermal gas density n e (cm 3 ) of the magneto-ionic medium along a physical depth of l (kpc). A linear fit of the observed polarization angle Ψ obs versus λ 2 at three or more different wavelengths permits the derivation of the intrinsic polarization angle and the rotation measure. Detailed rotation measure images can be obtained with a pixel-by-pixel fit of high-quality and extended polarization images of a radio galaxy at multiple frequencies. If the source is embedded or in the background of a galaxy cluster and the cluster is the only or the predominant contribution to the Faraday rotation, this image represents a two-dimensional projection of the intracluster magnetic field: the mean value of the rotation measure image probes the magnetic field fluctuations on large spatial scale, while its dispersion reflects the turbulent behavior of the field on small scales. Unresolved rotation measure structures in the foreground screen cause a depolarization of the signal of the radio galaxies. Therefore, depolarization of the radio galaxy signal can be used in conjunction with the analysis of the rotation measure images to constrain the intracluster magnetic field [15,16].

3. Simulations

A detailed evaluation of the magnetic field power spectrum from radio observations of diffuse synchrotron sources and polarized emission of radio galaxies is not an easy task (e.g., [17,18]). Following [19], we look for the best magnetic field that describes the data by using a numerical approach based on the comparison of the observations with synthetic images corresponding to different configurations of the magnetic field. Numerical simulations of diffuse synchrotron sources and of radio galaxies require a model of the thermal and non-thermal components: images of diffuse synchrotron sources in total intensity can be produced based on a model for the magnetic field and for the relativistic electrons, while polarization intensity and radio galaxy rotation measure images additionally require a thermal gas model. We assume:
  • a Gaussian intracluster magnetic field with a power law power spectrum
    | B k | 2 k n
    fluctuating between a minimum Λ min = 2 π / k max and a maximum Λ max = 2 π / k min spatial scale, where k is the wave-number and n the slope of the power spectrum | B k | 2 k n . The normalization of the power spectrum is fixed by imposing an average magnetic field radial profile B ( r ) proportional to a function of the thermal gas density n e ,
    B ( r ) = B 0 n e ( r ) n 0 η ,
    where B 0 and n 0 are respectively the magnetic field strength and the thermal gas density at the center of the cluster and η describes the radial profile;
  • a population of relativistic electrons with a power law energy spectrum
    N ( ϵ , θ ) = N 0 ϵ δ s i n θ 2
    with energy ϵ between γ min m e c 2 and γ max m e c 2 , index δ related to the spectral index α of the radio halo emission through δ = 2 α + 1 , isotropic distribution of the pitch angle θ between the direction of the magnetic field and of their velocity and normalization N 0 ;
  • a single β -model
    n e ( r ) = n 0 1 + r 2 r c 2 3 2 β
    for the thermal gas in merging galaxy clusters [20], where n 0 is the central thermal gas density, r c the core radius, an β the parameter that describes the radial decrease. A combination of two β -models is more suitable in relaxed systems [21].

4. Magnetic Fields in Galaxy Clusters

We investigated the magnetic field properties in galaxy clusters characterized by different dynamical and thermal properties by comparing the observations of radio halos and powerful and extended radio galaxies with the expectation from numerical simulations. In Table 1 is given a summary of all the clusters for which a detailed study of the magnetic field has been done either with a numerical or an analytic approach. Column 1 reports the name of the cluster, Column 2 the observable(s) used to carry out the analysis, Column 3 the frequency band(s) of the observations, Column 4 the instrument(s) used for the observations (VLA = Very Large Array, SRT = Sardinia Radio Telescope), and Column 5: Reference of the corresponding work.
We studied the magnetic field strength and structure in a galaxy cluster suffering strong merger events, i.e., A665 [13], by exploiting the spatial fluctuations in total intensity and the upper limits in the polarized emission of the radio halo at its center. Radio halo emission is a simultaneous expression of magnetic fields and relativistic electrons. To discriminate among the two contributions from radio observations only is not possible. Approaches based on multiwavelength observations as, e.g., the combination of the synchrotron radio and inverse Compton X-ray emission from galaxy clusters could be applied (see e.g., [33]). However, difficulties may derive by the fact that the population of electrons responsible for the radio and X-ray emission must be the same and that to discern between the thermal and non-thermal X-ray emission of the source may be not trivial. We carried out our analysis with radio data only and for this reason we assumed an equipartition condition between the relativistic electrons and the magnetic field. To constraint the intracluster magnetic field, we compared the observations with synthetic radio halo images corresponding to different magnetic field strengths and structures. By varying the magnetic field outer scale of fluctuation from 102.4 kpc to 1024 kpc, we found that if the intracluster magnetic field fluctuates on spatial scales comparable with the resolution of the radio observation, the halo emission appears smooth and regular, while if it is ordered on spatial scales larger than the observing beam, the radio halo morphology is much more distorted and the offset of the radio halo peak from the cluster X-ray center is significant (Figure 1, right panel). A key tool to directly constrain the magnetic field properties is represented by the polarized emission of radio halos. The ratio of the total and polarized emission is indeed only marginally dependent on the relativistic electron energy spectrum and permits the placing of strong constraints on the magnetic field properties. Unfortunately, the polarized emission has been detected only in three radio halos to date as, e.g., A523 [32], where we could use this signal to investigate the magnetic field properties.
In galaxy clusters not showing diffuse synchrotron radio emission, we investigated the intracluster magnetic field power spectrum with the analysis of polarimetric properties of powerful and extended radio galaxies over a wide frequency range, as for example in A2199 [27] and A194 [30] where the Faraday effect is dominated by the intracluster contribution. By using radio observations respectively from 1.4 to 8 GHz and from 1.4 to 5 GHz, we derived rotation measure images for the radio galaxies in these clusters that appear patchy and reveal turbulent central intracluster magnetic fields, see Figure 2. We characterized these rotation measures images by means of their structure function
S RM ( r ) = [ R M ( x , y ) R M ( x + Δ x , y + Δ y ) ] 2 x , y
obtained by averaging the difference in rotation measure values in pixels at the scale distance r = Δ x 2 + Δ y 2 . To derive the power spectrum of the intracluster magnetic field, we produced synthetic images corresponding to different configurations of intracluster magnetic field and we compared the observed and synthetic rotation measure structure functions with advanced Bayesian algorithms of inference (Figure 3).
According to magneto-hydro-dynamical simulations, the dynamical state of the system plays an important role in the intracluster magnetic field evolution [34]. Young merging galaxy clusters are expected to be less magnetized than old relaxed systems since the amplification of the magnetic field strength requires long timescales. During the formation of galaxy clusters, significant amount of energy is released in the intracluster medium. The energy is injected on large spatial scales and then decades on smaller and smaller scales through turbulent cascades. This expectation is confirmed by present radio observations. Indeed, overall, we find magnetic fields characterized by central strengths of ∼ μ G and fluctuation scales up to a few hundreds of kpc in merging systems, while in relaxed systems we derive magnetic field central strengths up to ∼10 μ G and fluctuation scales from a few tens of kpc down to a few kpc or less.
Present and next generation radio telescopes will supply sensitive and detailed observations both of diffuse synchrotron sources and of radio galaxies in total intensity and polarization, essential to derive stronger constraints on intracluster magnetic fields. Radio halos are steep spectrum sources brighter at frequencies ≲1 GHz. Their polarized signal is affected by Faraday rotation that is less important at higher frequencies. Overall, total intensity and polarized emission of radio halos can be therefore studied simultaneously at best at frequencies ∼1 GHz. Our numerical three-dimensional simulations [35] indicate that radio halos are intrinsically polarized with central fractional polarization at full resolution of 15–35% at 1.4 GHz and higher levels toward the cluster periphery. However, this polarization is hard to detect due to instrumental limitations of present radio telescopes. The sensitivity and resolution imposed by the Jansky Very Large Array (JVLA) and Meerkat and by the polarimetric surveys planned with APERTIF (Westerbork Observations of the Deep APERTIF Northern-Sky, [36]) and ASKAP (Polarization Sky Survey of the Universe’s Magnetism [37]) allow for the detection of polarized emission in high-luminosity ( L 1.4 GHz 10 25 W/Hz) radio halos, while for intermediate-luminosity ( L 1.4 GHz 10 24 W/Hz) the advanced capabilities of the Square Kilometer Array (SKA) during Phase 1 are necessary. Instead, polarized emission from faint-luminosity ( L 1.4 GHz 10 23 W/Hz) radio halos will be very hard to detect even with the SKA during Phase 2.
Moreover, the sensitivity and high-spatial and spectral resolution of the SKA during Phase 1 will permit the study of polarimetric properties for a large number of radio galaxies in the background of galaxy clusters. With the radio instruments presently available detailed rotation measure images can be typically produced only for one extended radio galaxy (either background or cluster) per cluster, the only exception being in A2255 (4 sources, [31]) and in the Coma cluster (7 sources, [28]), being the main limitations the sensitivity and resolution of the observations. With observations taken by SKA during Phase 1, detailed and extended rotation measure images will be produced for several sources between several tens and a few hundreds in nearby galaxy clusters ( z < 0.1 ) and at least for 1–2 radio galaxies for high redshift systems (up to z = 0.5 ) [38], consequently enabling the trace of magnetic field strength and structure up to the cluster outskirts [39], a territory still largely unexplored.

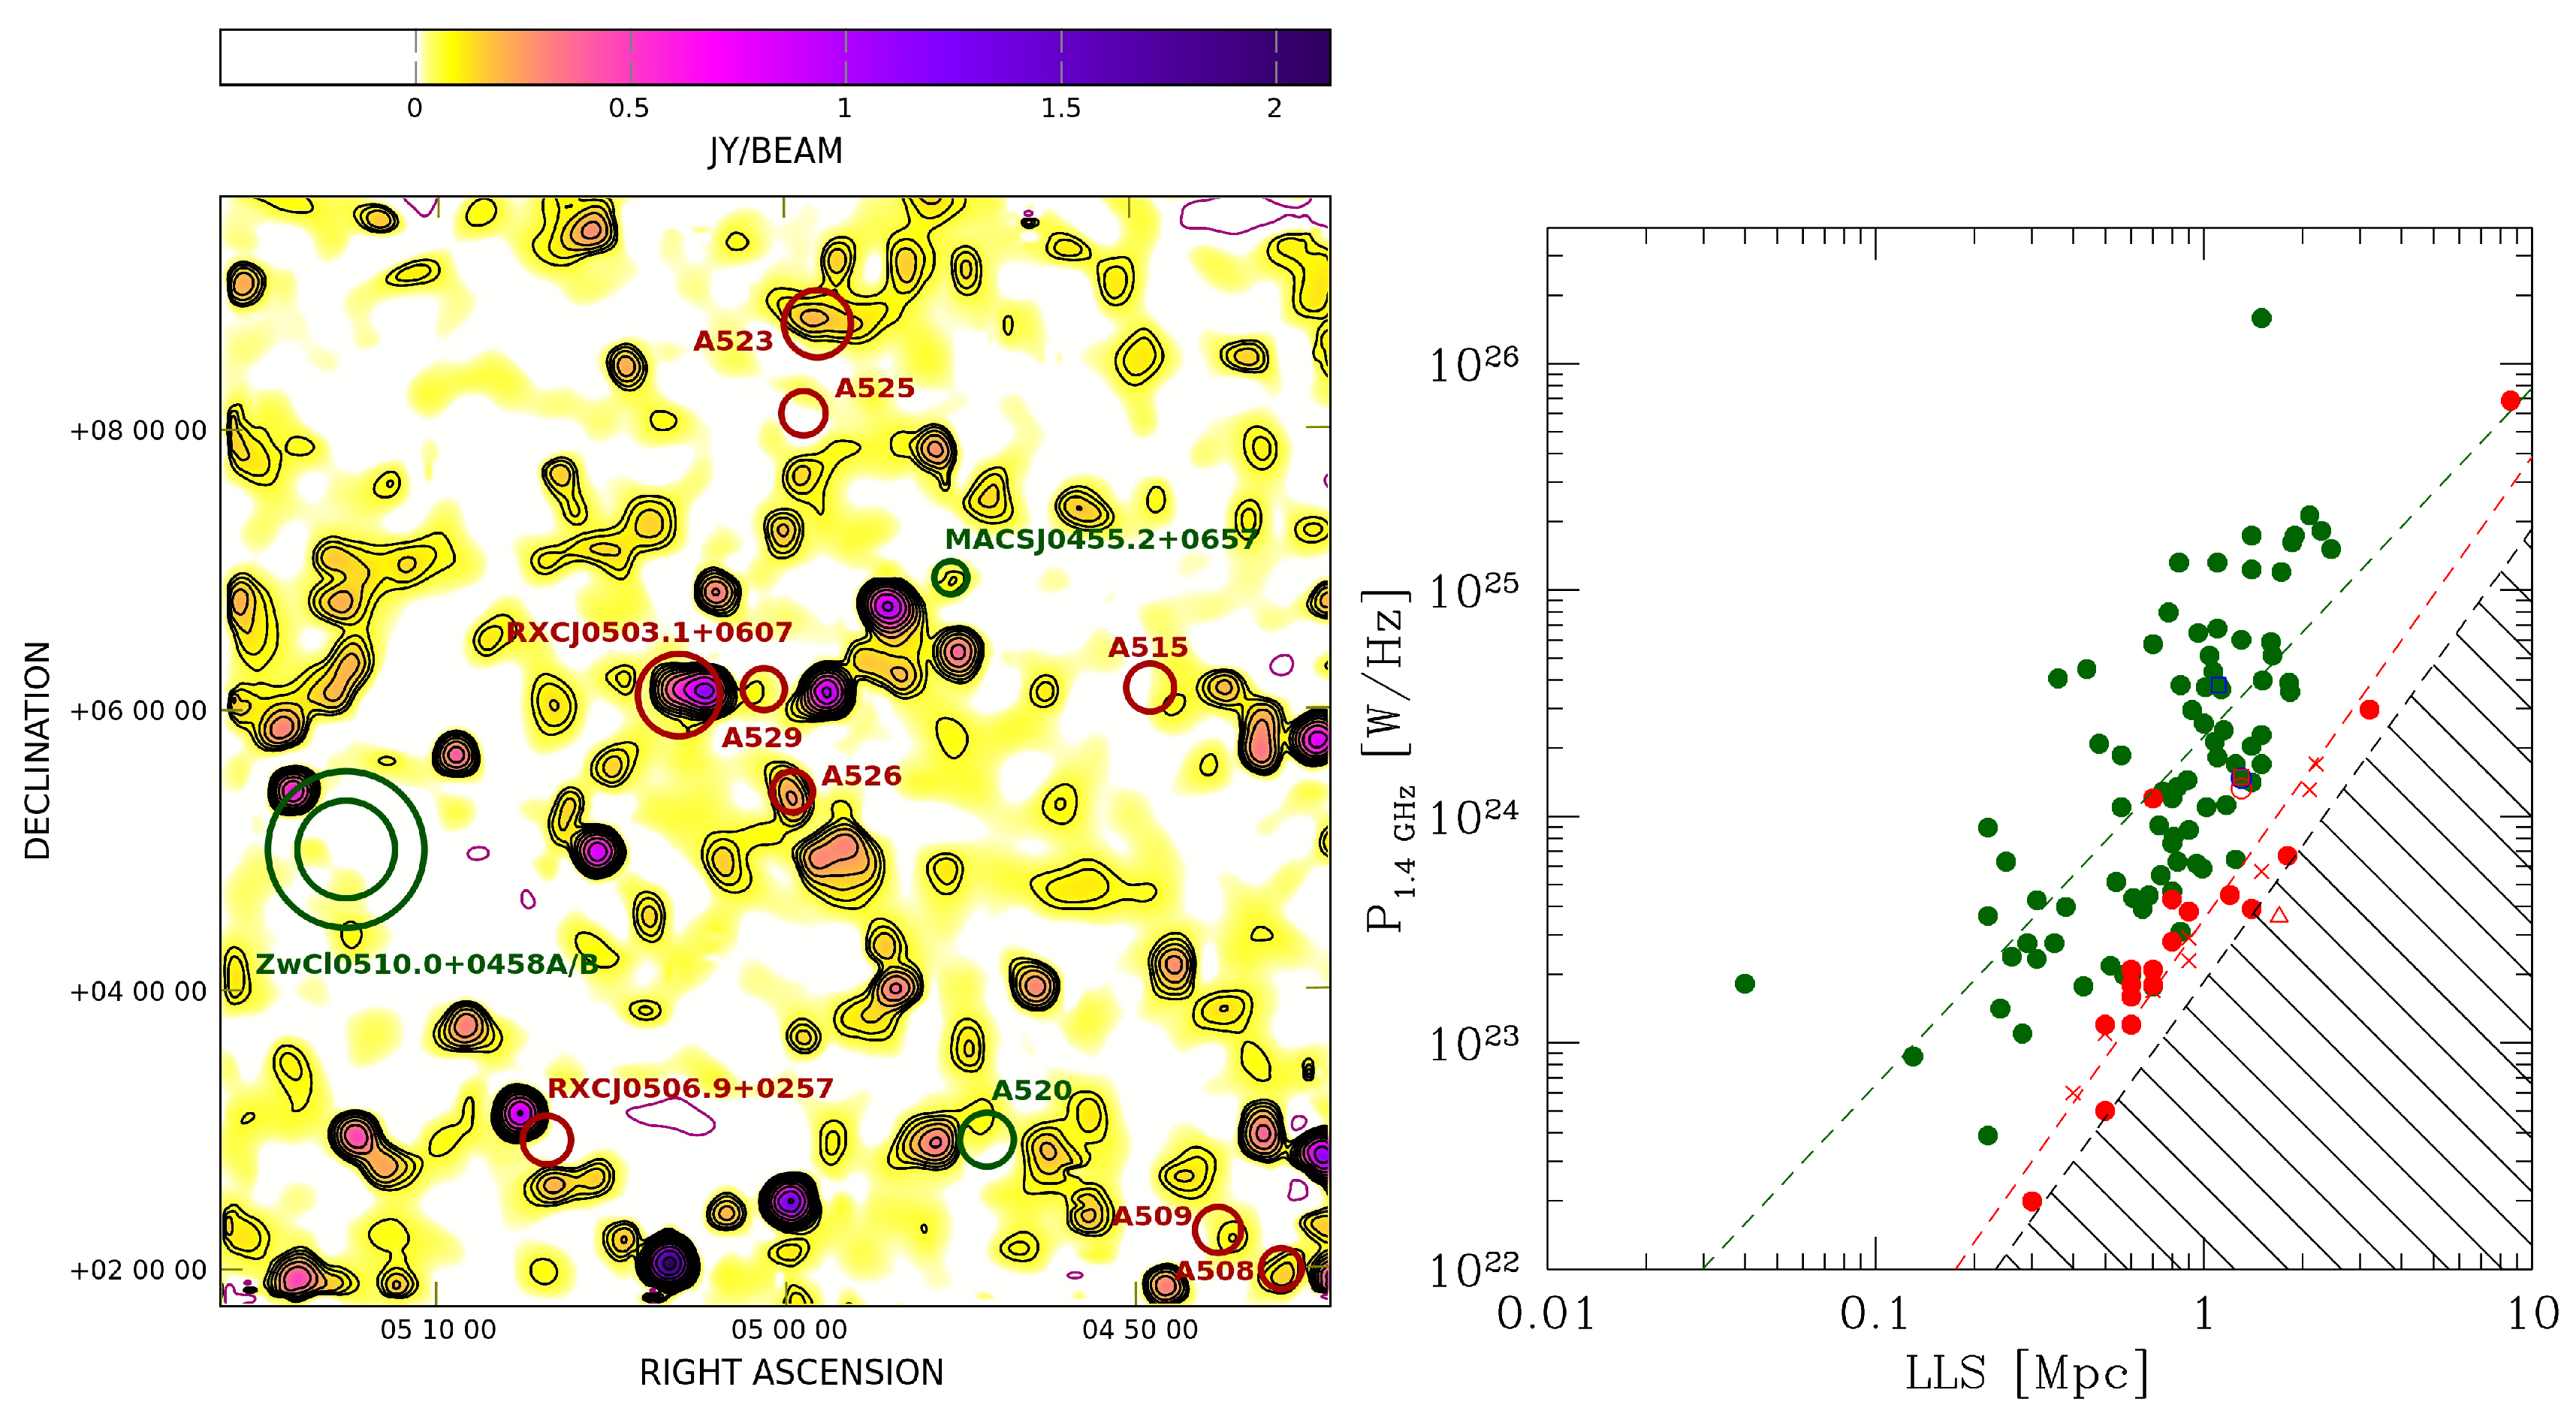
5. Present Results and Perspectives Beyond Galaxy Clusters

With the aim of investigating the magnetization along the elusive regions connecting galaxy clusters, we recently observed an area of the sky of 8 × 8 with the Sardinia Radio Telescope (SRT) at 1.4 GHz [40]. This field of view is very bright in radio (Figure 4) and is of particular interest because of the presence of several galaxy clusters among which nine are at a similar redshift ( z 0.1 ). Single-dish observations are very sensitive to faint surface brightness extended over large angular scale but are characterized by low-spatial resolution (in our case ∼13 ). To discriminate between the presence of diffuse large-scale synchrotron emission and the radio emission from discrete sources, we combined these data with higher resolution observations from the NRAO VLA Sky Survey (NVSS, [41]). After the subtraction of point-like emission (not shown here, but see [40]), the combined image revealed a population of 28 new diffuse synchrotron radio sources whose properties differ from cluster sources, with X-ray luminosity and radio emissivity 10–100 lower. The comparison of these observations with magneto-hydro-dynamical simulations indicates that their properties are consistent with those expected for the brightest patches of the cosmic web and correspond to magnetic field strengths of ∼20–50 nG. Polarization analysis of these data is currently in progress and will be the subject of a future work.
Due to their weak strengths, the detection and study of magnetic fields along filaments and voids of the cosmic web is very challenging. Sensitive and high-spatial and spectral resolution polarization surveys of the sky are planned with the SKA, its pathfinders and precursors. These surveys will enable the study of polarimetric properties for several extra-galactic radio sources from a few thousands with low-frequency radio telescopes as the LOw-Frequency ARray (LOFAR, e.g., [42]) up to 7–14 million with the SKA during Phase 1 [38]. Typically, the linearly polarized signal from background radio sources is modified through the Faraday effect by different intervening media: our Galaxy, galaxy clusters, filaments, voids, sheets, the emitting source itself and any other source along the line of sight. Therefore, the upcoming data contain an enormous quantity of information, among which is the tiny signature of intergalactic magnetic field. This signal is very weak (≈1 rad/m 2 ) and is easily buried by the Galactic rotation measure (up to several hundreds of rad/m 2 ) and by the observing noise (up to ≈10–15 rad/m 2 , for the largest rotation measure catalog presently available [43]). To detect and investigate the magnetization of the cosmic web based on these data, it is crucial to develop statistical advanced tools of analysis capable of disentangling all the contributions to the Faraday rotation, properly taking into account the observing noise. We developed a sophisticate Bayesian tool to separate the Galactic contribution from the Faraday effect associated with extra-galactic environments and derived that the extra-galactic Faraday rotation is well described by a Gaussian distribution with zero-mean and standard deviation σ e 7 rad/m 2 [44]. As a further step, we built upon it an advanced Bayesian algorithm based on Gibbs sampling, to disentangle the contributions from different extra-galactic environments. As we described in [45], the overall extra-galactic Faraday rotation variance can be expressed as the sum of the intrinsic σ int 2 and environmental σ env 2 Faraday rotation
σ e 2 = σ int 2 + σ env 2 = L L 0 χ lum σ int , 0 2 ( 1 + z ) 4 + D ( z , χ red ) D 0 σ env , 0 2
where σ int , 0 2 is the pure variance in Faraday rotation intrinsic to the emitting radio source, L is the total luminosity of the source, L 0 = 10 27 W/Hz, χ lum absorbs possible dependencies on the luminosity of the source, σ env , 0 2 is the variance in the pure environmental Faraday rotation, D 0 = 1 Gpc, and D ( z , χ red ) is defined as
D ( z , χ red ) = 0 z c H ( z ) ( 1 + z ) 4 + χ red d z
to capture the redshift dependence. Our studies indicate that low-frequency (≈150 MHz) data can provide useful constraints on the presence of ≲ μ G magnetic fields in the cosmic web already with rotation measures for a few thousands of sources thanks to the small observational uncertainty (∼0.05–0.1 rad/m 2 ), see Figure 5. However, difficulties in calibration of low-frequency observations (e.g., due to the ionosphere and to the wide fields of view) as well as limited number density of polarized sources due to the depolarization of the signal, makes the use of higher frequency observations (≈1.4 GHz) easier. The larger uncertainties in rotation measures (≈1–10 rad/m 2 ) at these frequencies require the use of wider catalogs of sources [46].
The overall environmental extra-galactic Faraday rotation is the result of several magneto-ionic media along the line of sight as, e.g., galaxy clusters, filaments, voids, sheets,
σ env 2 = j = 1 N env l j σ j 2
where σ 1 , σ 2 , …, σ N env is the standard deviation of the Faraday rotation from each of the N env different environments and l j is the length of the path covered by the signal through each environment j. Detailed knowledge of the redshift of the emitting sources and of the large-scale structure of the Universe ( l j , e.g., [47]) is therefore essential to further disentangle the contribution to Faraday rotation from the environments of the large-scale structure of the Universe.

6. Conclusions

The detection and investigation of magnetic fields in the large-scale structure of the Universe, from galaxy clusters to filaments and voids, have the potential to put strong constraints on cosmic magnetism genesis and evolution. To date, detailed investigation of magnetic fields in galaxy clusters have been possible only in a few systems. These studies suggest magnetic field properties strongly related to the dynamical and thermal state of the cluster. Magnetic fields at the center of merging galaxy cluster show ≈ μ G strengths and are ordered up to scales of ≈500 kpc, while in relaxed systems we measure magnetic fields with ∼10 μ G central strengths and turbulence down to scales of a few kpc or less. The comparison of thermal and non-thermal properties in galaxy clusters for which a detailed study is available suggests that at the center of the cluster the magnetic field energy is deeply related to the thermal gas density. Thanks to instruments with high-sensitivity to surface brightness and capable of sampling large angular scales in the sky, we are now starting to observe the magnetization also beyond galaxy clusters, along the brightest patches of the cosmic web, where we observe large-scale diffuse synchrotron sources with radio emissivity 10–100 lower than in clusters, corresponding to magnetic fields strengths ∼20–50 nG.
The coexistence of large and small scales of turbulence can be well studied by combining total and polarized brightness fluctuations of diffuse synchrotron sources and polarimetric data of background radio galaxies. The advent of sensitive high-spatial and spectral resolution observations will enable to exploit the information from radio halo polarized emission in a larger number of systems and to produce extended and high-quality rotation measure images for several sources both at the center and in the periphery of close-by galaxy clusters. To investigate the properties of the magnetic field in a detailed way from the center of galaxy clusters to their periphery and beyond galaxy clusters, along filaments and voids of the cosmic web, where our knowledge of the non-thermal component is still limited, it is crucial to combine these data with advanced tools of analysis.

Author Contributions

Conceptualization, V.V., M.M., F.G., T.E. and N.O.; methodology, V.V., M.M., F.G., T.E. and N.O.; software, V.V., M.M., F.G. and N.O.; validation, V.V., M.M., F.G., N.O. and F.L.; formal analysis, V.V., M.M., F.G. and N.O.; investigation, V.V., M.M., F.G., T.E., N.O., L.F., G.G. and F.L.; resources, M.M., F.G., T.E., L.F. and G.G.; data curation, V.V., M.M. and F.G.; writing—original draft preparation, V.V.; writing—review and editing, V.V., M.M., F.G., T.E., N.O., L.F., G.G. and F.L.; visualization, V.V., M.M., F.G., T.E., N.O., L.F., G.G. and F.L.; supervision, M.M., F.G., T.E., L.F. and G.G.; project administration, V.V., M.M., F.G. and N.O.; funding acquisition, M.M., F.G., T.E., L.F. and G.G.

Funding

This research received the following external funding. The Sardinia Radio Telescope ([48,49] is funded by the Department of University and Research (MIUR), Italian Space Agency (ASI), and the Autonomous Region of Sardinia (RAS) and is operated as National Facility by the National Institute for Astrophysics (INAF). The development of the SARDARA back-end was funded by the Autonomous Region of Sardinia (RAS) using resources from the Regional Law 7/2007 “Promotion of the scientific research and technological innovation in Sardinia” in the context of the research project CRP-49231 (year 2011, PI Possenti): “High resolution sampling of the Universe in the radio band: an unprecedented instrument to understand the fundamental laws of the nature”. The trg computer cluster was funded by the Autonomous Region of Sardinia (RAS) using resources from the Regional Law 7 August 2007 n. 7 (year 2015) “Highly qualified human capital”, in the context of the research project CRP 18 “General relativity tests with the Sardinia Radio Telescope” (P.I. of the project: Dr. Marta Burgay). This work made use of results produced by the Cybersar Project managed by the Consorzio COSMOLAB, a project cofunded by the Italian Ministry of University and Research (MIUR) within the Programma Operativo Nazionale 2000–2006 “Ricerca Scientifica, Sviluppo Tecnologico, Alta Formazione” per le Regioni Italiane dell’ Obiettivo 1 (Campania, Calabria, Puglia, Basilicata, Sicilia, Sardegna)—Asse II, Misura II.2 “Societá dell’Informazione”, Azione a “Sistemi di calcolo e simulazione ad alte prestazioni”. More information is available at http://www.cybersar.it.

Acknowledgments

We thank the anonymous referees who helped to improve the quality of this work. The National Radio Astronomy Observatory (NRAO) is a facility of the National Science Foundation, operated under cooperative agreement by Associated Universities, Inc. This research made use of the NASA/IPAC Extragalactic Database (NED) which is operated by the Jet Propulsion Laboratory, California Institute of Technology, under contract with the National Aeronautics and Space Administration. The implementation of the code makes use of the NIFTY package by [50] and of the cosmology calculator by Ned Wright (www.astro.ucla.edu/~wright).

Conflicts of Interest

The authors declare no conflict of interest. The founding sponsors had no role in the design of the study; in the collection, analyses, or interpretation of data; in the writing of the manuscript, or in the decision to publish the results.

References

  1. Brunetti, G.; Lazarian, A. Acceleration of primary and secondary particles in galaxy clusters by compressible MHD turbulence: From radio haloes to gamma-rays. Mon. Not. R. Astron. Soc. 2011, 410, 127–142. [Google Scholar] [CrossRef]
  2. Enßlin, T.; Pfrommer, C.; Miniati, F.; Subramanian, K. Cosmic ray transport in galaxy clusters: Implications for radio halos, gamma-ray signatures, and cool core heating. Astron. Astrophys. 2011, 527, A99. [Google Scholar] [CrossRef]
  3. Govoni, F.; Feretti, L. Magnetic Fields in Clusters of Galaxies. Int. J. Mod. Phys. D 2004, 13, 1549–1594. [Google Scholar] [CrossRef]
  4. Vazza, F.; Brüggen, M.; Gheller, C.; Wang, P. On the amplification of magnetic fields in cosmic filaments and galaxy clusters. Mon. Not. R. Astron. Soc. 2014, 445, 3706–3722. [Google Scholar] [CrossRef]
  5. Giovannini, G.; Bonafede, A.; Brown, S.; Feretti, L.; Ferrari, C.; Gitti, M.; Govoni, F.; Murgia, M.; Vacca, V. Mega-parsec scale magnetic fields in low density regions in the SKA era: Filaments connecting galaxy clusters and groups. arXiv, 2015; arXiv:1501.01023. [Google Scholar]
  6. Brown, S.; Vernstrom, T.; Carretti, E.; Dolag, K.; Gaensler, B.M.; Staveley-Smith, L.; Bernardi, G.; Haverkorn, M.; Kesteven, M.; Poppi, S. Limiting magnetic fields in the cosmic web with diffuse radio emission. Mon. Not. R. Astron. Soc. 2017, 468, 4246–4253. [Google Scholar] [CrossRef]
  7. Vernstrom, T.; Gaensler, B.M.; Brown, S.; Lenc, E.; Norris, R.P. Low-frequency radio constraints on the synchrotron cosmic web. Mon. Not. R. Astron. Soc. 2017, 467, 4914–4936. [Google Scholar] [CrossRef]
  8. Akahori, T.; Ryu, D. Faraday Rotation Measure Due to the Intergalactic Magnetic Field. Astrophys. J. 2010, 723, 476–481. [Google Scholar] [CrossRef]
  9. Feretti, L.; Giovannini, G.; Govoni, F.; Murgia, M. Clusters of galaxies: Observational properties of the diffuse radio emission. Astron. Astrophys. Rev. 2012, 20, 54. [Google Scholar] [CrossRef]
  10. Eckert, D.; Jauzac, M.; Vazza, F.; Owers, M.S.; Kneib, J.-P.; Tchernin, C.; Intema, H.; Knowles, K. A shock front at the radio relic of Abell 2744. Mon. Not. R. Astron. Soc. 2016, 461, 1302–1307. [Google Scholar] [CrossRef] [Green Version]
  11. Kronberg, P.P.; Kothes, R.; Salter, C.J.; Perillat, P. Discovery of New Faint Radio Emission on 8° to 3’ Scales in the Coma Field, and Some Galactic and Extragalactic Implications. Astrophys. J. 2007, 659, 267–274. [Google Scholar] [CrossRef]
  12. Carretti, E.; Brown, S.; Staveley-Smith, L.; Malarecki, J.M.; Bernardi, G.; Gaensler, B.M.; Haverkorn, M.; Kesteven, M.J.; Poppi, S. Detection of a radio bridge in Abell 3667. Mon. Not. R. Astron. Soc. 2013, 430, 1414–1422. [Google Scholar] [CrossRef] [Green Version]
  13. Vacca, V.; Murgia, M.; Govoni, F.; Feretti, L.; Giovannini, G.; Orrù, E.; Bonafede, A. The intracluster magnetic field power spectrum in Abell 665. Astron. Astrophys. 2010, 514, A71. [Google Scholar] [CrossRef] [Green Version]
  14. Carilli, C.L.; Taylor, G.B. Cluster Magnetic Fields. Ann. Rev. Astron. Astrophys. 2002, 40, 319–348. [Google Scholar] [CrossRef]
  15. Burn, B.J. On the depolarization of discrete radio sources by Faraday dispersion. Mon. Not. R. Astron. Soc. 1966, 133, 67. [Google Scholar] [CrossRef]
  16. Tribble, P.C. Depolarization of extended radio sources by a foreground Faraday screen. Mon. Not. R. Astron. Soc. 1991, 250, 726–736. [Google Scholar] [CrossRef] [Green Version]
  17. Laing, R.A.; Bridle, A.H.; Parma, P.; Murgia, M. Structures of the magnetoionic media around the Fanaroff-Riley Class I radio galaxies 3C31 and Hydra A. Mon. Not. R. Astron. Soc. 2008, 391, 521–549. [Google Scholar] [CrossRef]
  18. Enßlin, T.A.; Vogt, C. The magnetic power spectrum in Faraday rotation screens. Astron. Astrophys. 2003, 401, 835–848. [Google Scholar] [CrossRef] [Green Version]
  19. Murgia, M.; Govoni, F.; Feretti, L.; Giovannini, G.; Dallacasa, D.; Fanti, R.; Taylor, G.B.; Dolag, K. Magnetic fields and Faraday rotation in clusters of galaxies. Astron. Astrophys. 2004, 424, 429–446. [Google Scholar] [CrossRef] [Green Version]
  20. Cavaliere, A.; Fusco-Femiano, R. X-rays from hot plasma in clusters of galaxies. Astron. Astrophys. 1976, 49, 137–144. [Google Scholar]
  21. Mohr, J.J.; Mathiesen, B.; Evrard, A.E. Properties of the Intracluster Medium in an Ensemble of Nearby Galaxy Clusters. Astrophys. J. 1999, 517, 627–649. [Google Scholar] [CrossRef] [Green Version]
  22. Vogt, C.; Enßlin, T.A. Measuring the cluster magnetic field power spectra from Faraday rotation maps of Abell 400, Abell 2634 and Hydra A. Astron. Astrophys. 2003, 412, 373–385. [Google Scholar] [CrossRef] [Green Version]
  23. Vogt, C.; Enßlin, T.A. A Bayesian view on Faraday rotation maps Seeing the magnetic power spectra in galaxy clusters. Astron. Astrophys. 2005, 434, 67–76. [Google Scholar] [CrossRef]
  24. Kuchar, P.; Enßlin, T.A. Magnetic power spectra from Faraday rotation maps. REALMAF and its use on Hydra A. Astron. Astrophys. 2011, 529, A13. [Google Scholar] [CrossRef]
  25. Guidetti, D.; Murgia, M.; Govoni, F.; Parma, P.; Gregorini, L.; de Ruiter, H.R.; Cameron, R.A.; Fanti, R. The intracluster magnetic field power spectrum in Abell 2382. Astron. Astrophys. 2008, 483, 699–713. [Google Scholar] [CrossRef]
  26. Guidetti, D.; Laing, R.A.; Murgia, M.; Govoni, F.; Gregorini, L.; Parma, P. Structure of the magnetoionic medium around the Fanaroff-Riley Class I radio galaxy 3C 449. Astron. Astrophys. 2010, 514, A50. [Google Scholar] [CrossRef] [Green Version]
  27. Vacca, V.; Murgia, M.; Govoni, F.; Feretti, L.; Giovannini, G.; Perley, R.A.; Taylor, G.B. The intracluster magnetic field power spectrum in A2199. Astron. Astrophys. 2012, 540, A38. [Google Scholar] [CrossRef] [Green Version]
  28. Bonafede, A.; Feretti, L.; Murgia, M.; Giovannini, G.; Dallacasa, D.; Dolag, K.; Taylor, G.B. The Coma cluster magnetic field from Faraday rotation measures. Astron. Astrophys. 2010, 513, A30. [Google Scholar] [CrossRef] [Green Version]
  29. Bonafede, A.; Vazza, F.; Brüggen, M.; Murgia, M.; Govoni, F.; Feretti, L.; Giovannini, G.; Ogrean, G. Measurements and simulation of Faraday rotation across the Coma radio relic. Mon. Not. R. Astron. Soc. 2013, 433, 3208–3226. [Google Scholar] [CrossRef] [Green Version]
  30. Govoni, F.; Murgia, M.; Vacca, V.; Loi, F.; Girardi, M.; Gastaldello, F.; Giovannini, G.; Feretti, L.; Paladino, R.; Carretti, E.; et al. Sardinia Radio Telescope observations of Abell 194. The intra-cluster magnetic field power spectrum. Astron. Astrophys. 2017, 603, A122. [Google Scholar] [CrossRef]
  31. Govoni, F.; Murgia, M.; Feretti, L.; Giovannini, G.; Dolag, K.; Taylor, G.B. The intracluster magnetic field power spectrum in Abell 2255. Astron. Astrophys. 2006, 460, 425–438. [Google Scholar] [CrossRef] [Green Version]
  32. Girardi, M.; Boschin, W.; Gastaldello, F.; Giovannini, G.; Govoni, F.; Murgia, M.; Barrena, R.; Ettori, S.; Trasatti, M.; Vacca, V. A multiwavelength view of the galaxy cluster Abell 523 and its peculiar diffuse radio source. Mon. Not. R. Astron. Soc. 2016, 456, 2829–2847. [Google Scholar] [CrossRef]
  33. Murgia, M.; Eckert, D.; Govoni, F.; Ferrari, C.; Pandey-Pommier, M.; Nevalainen, J.; Paltani, S. GMRT observations of the Ophiuchus galaxy cluster. Astron. Astrophys. 2010, 514, A76. [Google Scholar] [CrossRef] [Green Version]
  34. Dolag, K.; Bartelmann, M.; Lesch, H. Evolution and structure of magnetic fields in simulated galaxy clusters. Astron. Astrophys. 2002, 387, 383–395. [Google Scholar] [CrossRef] [Green Version]
  35. Govoni, F.; Murgia, M.; Xu, H.; Li, H.; Norman, M.L.; Feretti, L.; Giovannini, G.; Vacca, V. Polarization of cluster radio halos with upcoming radio interferometers. Astron. Astrophys. 2013, 554, A102. [Google Scholar] [CrossRef] [Green Version]
  36. Röttgering, H.; Afonso, J.; Barthel, P.; Batejat, F.; Best, P.; Bonafede, A.; Brüggen, M.; Brunetti, G.; Chyzy, K.; Conway, J.; et al. LOFAR and APERTIF Surveys of the Radio Sky: Probing Shocks and Magnetic Fields in Galaxy Clusters. J. Astrophys. Astron. 2011, 32, 557–566. [Google Scholar] [CrossRef] [Green Version]
  37. Gaensler, B.M.; Landecker, T.L.; Taylor, A.R. Survey Science with ASKAP: Polarization Sky Survey of the Universe’s Magnetism (POSSUM). In Bulletin of the American Astronomical Society; POSSUM Collaboration 2010; American Astronomical Society: Washington, DC, USA, 2010; Volume 42, p. 515. [Google Scholar]
  38. Johnston-Hollitt, M.; Govoni, F.; Beck, R.; Dehghan, S.; Pratley, L.; Akahori, T.; Heald, G.; Agudo, I.; Bonafede, A.; Carretti, E.; et al. Using SKA Rotation Measures to Reveal the Mysteries of the Magnetised Universe. arXiv, 2015; arXiv:1506.00808. [Google Scholar]
  39. Bonafede, A.; Vazza, F.; Brüggen, M.; Akahori, T.; Carretti, E.; Colafrancesco, S.; Feretti, L.; Ferrari, C.; Giovannini, G.; Govoni, F.; et al. Unravelling the origin of large-scale magnetic fields in galaxy clusters and beyond through Faraday Rotation Measures with the SKA. arXiv, 2015; arXiv:1501.00321. [Google Scholar]
  40. Vacca, V.; Murgia, M.; Govoni, F.; Loi, F.; Vazza, F.; Finoguenov, A.; Carretti, E.; Feretti, L.; Giovannini, G.; Concu, R.; et al. Observations of a nearby filament of galaxy clusters with the Sardinia Radio Telescope. Mon. Not. R. Astron. Soc. 2018, 479, 776–806. [Google Scholar] [CrossRef] [Green Version]
  41. Condon, J.J.; Cotton, W.D.; Greisen, E.W.; Yin, Q.F.; Perley, R.A.; Taylor, G.B.; Broderick, J.J. The NRAO VLA Sky Survey. AJ 1998, 115, 1693–1716. [Google Scholar] [CrossRef] [Green Version]
  42. Van Eck, C.L.; Haverkorn, M.; Alves, M.I.R.; Beck, R.; Best, P.; Carretti, E.; Chyzy, K.T.; Farnes, J.S.; Ferriére, K.; Hardcastle, M.J.; et al. Polarized point sources in the LOFAR Two-meter Sky Survey: A preliminary catalog. Astron. Astrophys. 2018, 613, A58. [Google Scholar] [CrossRef] [Green Version]
  43. Taylor, A.R.; Stil, J.M.; Sunstrum, C. A Rotation Measure Image of the Sky. Astrophys. J. 2009, 702, 1230–1236. [Google Scholar] [CrossRef]
  44. Oppermann, N.; Junklewitz, H.; Greiner, M.; Enßlin, T.A.; Akahori, T.; Carretti, E.; Gaensler, B.M.; Goobar, A.; Harvey-Smith, L.; Johnston-Hollitt, M.; et al. Estimating extragalactic Faraday rotation. Astron. Astrophys. 2015, 575, A118. [Google Scholar] [CrossRef]
  45. Vacca, V.; Oppermann, N.; Enßlin, T.A.; Selig, M.; Junklewitz, H.; Greiner, M.; Jasche, J.; Hales, C.A.; Reneicke, M.; Carretti, E.; et al. Statistical methods for the analysis of rotation measure grids in large scale structures in the SKA era. arXiv, 2015; arXiv:1501.00415. [Google Scholar]
  46. Vacca, V.; Oppermann, N.; Enßlin, T.; Jasche, J.; Selig, M.; Greiner, M.; Junklewitz, H.; Reinecke, M.; Brüggen, M.; Carretti, E.; et al. Using rotation measure grids to detect cosmological magnetic fields: A Bayesian approach. Astron. Astrophys. 2016, 591, A13. [Google Scholar] [CrossRef]
  47. Jasche, J.; Kitaura, F.S.; Li, C.; Enßlin, T.A. Bayesian non-linear large-scale structure inference of the Sloan Digital Sky Survey Data Release 7. Mon. Not. R. Astron. Soc. 2010, 409, 355–370. [Google Scholar] [CrossRef] [Green Version]
  48. Bolli, P.; Orlati, A.; Stringhetti, L.; Orfei, A.; Righini, S.; Ambrosini, R.; Bartolini, M.; Bortolotti, C.; Buffa, F.; Buttu, M.; et al. Sardinia Radio Telescope: General Description, Technical Commissioning and First Light. J. Astron. Instrum. 2015, 4, 1550008. [Google Scholar] [CrossRef]
  49. Prandoni, I.; Murgia, M.; Tarchi, A.; Burgay, M.; Castangia, P.; Egron, E.; Govoni, F.; Pellizzoni, A.; Ricci, R.; Righini, S.; et al. The Sardinia Radio Telescope. From a technological project to a radio observatory. Astron. Astrophys. 2017, 608, A40. [Google Scholar] [CrossRef]
  50. Selig, M.; Bell, M.R.; Junklewitz, H.; Oppermann, N.; Reinecke, M.; Greiner, M.; Pachajoa, C.; Enßlin, T.A. NIFTY—Numerical Information Field Theory. A versatile PYTHON library for signal inference. Astron. Astrophys. 2013, 554, A26. [Google Scholar] [CrossRef]
Figure 1. Left: radio image of the central region of the galaxy cluster A665. Contours show the total intensity radio emission at 1.4 GHz (resolution 25 , first contour level 135 μ Jy/beam and the rest spaced by a factor 2 ), while the colors represent the X-ray emission in the 0.8–4 keV band. Right: X-ray to radio peak offset versus Λ max for synthetic radio halos. The red dashed line identifies the Λ max based on the observed X-ray to radio peak offset for the radio halo in A665. These images have been produced in the context of the work [13].
Galaxies 06 00142 g001
Figure 2. Top left: Total intensity emission at 1.4 MHz of the radio sources at the center of A194 overlaid on the rotation measure image derived by using radio observations between 1.4 and 6.6 GHz, smoothed with a FWHM Gaussian of 2.9 . Top right: histogram of the rotation measure distribution. Bottom: plots of the polarization angle Ψ versus the square wavelength λ 2 at four different source locations. These images have been produced in the context of the work [30].
Galaxies 06 00142 g002
Figure 3. Results from the Bayesian 3-dimensional analysis of the rotation measure structure function in the galaxy cluster A2199 [27]. Top: dots represent the data, the shaded area represents the population of synthetic RM structure functions from the posterior distribution, and the dashed line corresponds to the most probable value for the model parameters. Bottom: one-dimensional (histograms) and two-dimensional (colors and contours) marginalizations of the posterior for the model parameters B 0 and η .
Galaxies 06 00142 g003
Figure 4. Left: Colors and contours represent the SRT image at 1.4 GHz. The contours are 3 σ (magenta, σ = 20 mJy/beam), 3 σ and the remaining scale by a factor 2 (black) at a resolution of 13.9 × 12.4 . Circles and labels identify galaxy clusters in the field with known redshift, with size of the circles proportional to the distance of the cluster (large circles are close-by clusters, while small circles are distance clusters), in red for 0.08 < z < 0.15 , in green outside this range. Right: Radio power P 1.4 GHz versus the largest linear size L L S at 1.4 GHz. Measurements from literature are represented by green dots and blue open symbols, while red symbols are the new data presented in [40]. The shaded area represents the inaccessible region at our sensitivity. Dashed green and red lines represent respectively the linear fit in logarithmic scale for cluster sources and for the new sources. These images have been produced in the context of the work [40].
Galaxies 06 00142 g004
Figure 5. Results obtained for a mock LOFAR catalog produced with observations at 150 MHz for ≈2200 sources and an overall extra-galactic standard deviation ≈7 rad/m 2 , corresponding to magnetic field strengths in the large-scale structures of ∼ μ G [46]. Top plots of each column contain the one-dimensional projection of the posterior along with the true value of the parameter (dotted line), the outcome of the analysis (dashed and dash-dotted lines), and the prior (continuous line). The panels in color contain the two-dimensional marginalization of the posterior.
Galaxies 06 00142 g005
Table 1. Summary of all the clusters for which either a numerical or analytic study of the intracluster magnetic field is available.
ClustersObservable(s)Frequency Band(s)Instrument(s)Reference
A400Radio galaxiesC, X bandVLA[22]
A2634Radio galaxiesC, X bandVLA[22]
Hydra ARadio galaxiesX bandVLA[17,22,23,24]
A119Radio galaxiesL, C, X bandVLA[19]
A2382Radio galaxiesL, C bandVLA[25]
3C 31Radio GalaxiesL, C, X bandVLA[17]
3C 449Radio galaxiesL, C, X bandVLA[26]
A2199Radio galaxiesL, C, X bandVLA[27]
A1656 (center)Radio galaxiesL, C, X bandVLA[28]
A1656 (outskirts)Radio GalaxiesL, C bandVLA[29]
A194Radio galaxiesL, C bandVLA, SRT[30]
A2255Radio galaxies and radio haloC, X bandVLA[31]
A665Radio haloL bandVLA[13]
A523Radio haloL bandVLA[32]

