3C 84: Observational Evidence for Precession and a Possible Relation to TeV Emission
by
 , , , ,
Silke Britzen
1,* ,
,
Christian Fendt
2,
Michal Zajaček
1,3,4,
Frédéric Jaron
1,5,
Ilya Pashchenko
6,
Margo F. Aller
7 and 
Hugh D. Aller
7 1
Max-Planck-Institut für Radioastronomie, Auf dem Hügel 69, 53121 Bonn, Germany
2
Max Planck Institute for Astronomy, Königstuhl 17, 69117 Heidelberg, Germany
3
I. Physikalisches Institut, Universität Köln, Zülpicher Str. 77, 50937 Köln, Germany
4
Center for Theoretical Physics, Polish Academy of Sciences, Al. Lotników 32/46, 02-668 Warsaw, Poland
5
Institute of Geodesy and Geoinformation, University of Bonn, Nußallee 17, 53115 Bonn, Germany
6
Astro Space Center, Lebedev Physical Institute, Russian Academy of Sciences, 84/32 Profsoyuznaya st., 117997 Moscow , Russia
7
Astronomy Department, University of Michigan, Ann Arbor, MI 48109-1107, USA
*
Author to whom correspondence should be addressed.
Galaxies 2019, 7(3), 72; https://doi.org/10.3390/galaxies7030072
Submission received: 13 February 2019
/
Revised: 8 July 2019
/
Accepted: 28 July 2019
/
Published: 14 August 2019
(This article belongs to the Special Issue Radio Galaxies at TeV Energies)
Abstract
:3C 84 (NGC 1275, Perseus A) is a bright radio source at the center of an ongoing merger, where HST observations show two colliding spiral galaxies. 3C 84 holds promise to improve our understanding about how of the activity of active galactic nuclei, the formation of supermassive binary black holes, feedback processes, and galaxy collisions are interrelated. 3C,84 is one of only six radio galaxies, which reveal TeV emission. The origin of this TeV emission is still a matter of debate. Our present study is based on high resolution radio interferometric observations (15 GHz) of the pc-scale jet in this complex radio galaxy. We have re-modeled and re-analyzed 42 VLBA observations of 3C 84, performed between 1999.99 and 2017.65. In order to enable a proper alignment of the VLBA observations, we developed a method of a “differential” alignment whereby we select one reference point and minimize the deviations from this reference point in the remaining epochs. As a result, we find strong indication for a precession of the 3C 84 jet—not only for its central regions, but also for the outer lobe at 10 mas distance. These findings are further supported by our kinematic precession modeling of the radio flux-density monitoring data provided by the University of Michigan Radio Observatory and the Owens Valley Radio Observatory, which yields a precession time scale of about 40 yr. This time scale is further supported by literature maps obtained about 40 yr ago (1973 and 1974.1) which reveal a similar central radio structure. We suggest that the TeV flare detected by MAGIC may correlate with the precession of 3C 84, as we disentangle a projected reversal point of the precessing motion that correlates with the flaring time. This may physically be explained by a precessing jet sweeping over a new region of so far undisturbed X-ray gas which would then lead to shock-produced TeV-emission. In addition, we perform a correlation analysis between the radio data and GeV data obtained by the Fermi Gamma-ray Space Telescope and find that the -ray data are lagging the radio data by 300–400 days. A possible explanation could be that the radio and the GeV data stem from different emission regions. We discuss our findings and propose that the detected jet precession can also account for the observed cavities in the X-ray emission on kpc-scales.
1. Introduction
3C 84 has long been an enigmatic example of an AGN. The physical nature of this particular AGN is of interest because of its very powerful radio jet. For some time it has been the brightest extragalactic radio source at high frequencies (e.g., [1]).The physical nature is also important with regard to understanding the relationship between the radio jet and the feedback in the cluster cooling flow (e.g., [2]). The classification of this AGN is still unclear. It has been classified as a broad emission line Seyfert galaxy, an obscured Seyfert galaxy, a narrow line radio galaxy, or a BL Lac object (for an overview please see [3]). Ref [3] showed that the ionizing continuum resembles that of a weak broad line Seyfert galaxy but with the hard ionizing continuum somewhat suppressed. They also found that the “innermost jet (within 0.1 pc from the source) is best interpreted as a slightly off-angle BL Lac object jet”.
1.1. VLBI Observations of 3C 84
The complex pc-scale radio structure of 3C 84 has been investigated by many authors using VLBI observations at different observing frequencies (e.g., [4,5,6,7,8,9]). The radio structure of 3C 84 does not resemble the typical core-jet sources mapped with VLBI observations (e.g., [10]). The source structure in early VLBI observations can be seen in Figure 1 in an image taken from [11]. The morphology in the radio band can be nicely seen in the map by [12]. Highest resolution-observations with the RadioAstron space telescope resolved the edge-brightened radio jet down to only 30 as from the core and revealed the position of the core [13]. The core is also named “C1” in several papers.
Nagai et al. [14] studied the sub-pc scale jet in 14 epochs of VLBI observations with the Japanese VLBI Network and the VLBI Exploration of Radio Astrometry (VERA) array between 2006 and 2009. They present evidence for a recurrence of jet activity and the emergence of a new component C3 associated with the radio outburst which started in 2005. Reference [15] perform a detailed analysis of the kinematics and light curve of the central sub-pc scale structure using archival VLBA data obtained at 43 GHz and covering the period between January 2002 and November 2008. They find that C3 (relative to C1) shows moderate acceleration from 0.10c to 0.47c. A very detailed investigation of the motion in 3C 84 has been performed by [5]. The authors use VERA at 22 GHz and observed 3C 84 in 80 epochs between October 2007 and December 2013. They determine the averaged radial velocity of component C3 relative to the radio core to be 0.27 ± 0.02c. They explain the constant velocity of C3 as due to the advancing motion of the head of a mini-radio lobe. In addition, they find a non-linear component in the motion of C3 relative to the core. According to [5], C3 is the head of a radio lobe including hot spots at an early stage of the evolution. This finding is based on VLBA images obtained at 43 GHz which show that C3 is embedded in a very complex structure [9].
1.2. TeV Emission from 3C 84
TeV emission from AGN is mostly found from blazars (e.g., [16]). Only six radio galaxies so far have been observed in the TeV regime (e.g., [17,18])—3C 84 being one of them. While beaming is thought to play an important role with regard to the TeV energy production in blazars, the angle to the line of sight for radio galaxies seems to be unfavourable. The physical processes causing very-high-energy (VHE) radiation in radio galaxies are thus still unclear. There have been various attempts to investigate a possible connection and correlation between the radio emission sites and the TeV emission (e.g., for M 87: [19,20]). Several authors presented direct evidence that the TeV emission in the radio galaxy M87 originates from the core region [21,22,23]. The TeV emitting radio galaxy IC 310 is most likely a blazar (e.g., [24]) and HESS 0625-354 (e.g., [25]) as well.
In case of a blazar-like jet in the inner regions, TeV emission can be explained by Doppler boosting, caused by relativistic beaming of Inverse Compton (IC) scattered synchrotron radiation (e.g., [26,27,28]).
In the case of 3C 84, several authors have studied and discussed possible mechanisms that might explain the TeV emission. Reference [29] study multifrequency observations and modeled the overall spectral energy distribution (SED). They find that a single-zone synchrotron-self-Compton model, with an electron spectrum following a power-law with an exponential cutoff can explain the broadband SED and the multifrequency behavior of the source. This model, however, suggests an atypical low bulk-Lorentz factor or a velocity alignment closer to the line of sight than derived for the parsec-scale radio jet. Reference [30] study different scenarios to explain the fast gamma-ray variability. The authors prefer as the only plausible model the production of gamma rays in a magnetospheric gap around the central black hole. In addition, an enhancement of the magnetic field threading the hole from its equipartition value with the gas pressure in the accretion flow is required. The studies mentioned before encounter discrepancies.
We investigate 3C 84 to understand better the physical processes producing the TeV emission in this radio galaxy. Throughout the paper we adopt the following parameters: a luminosity distance D = 78.7 Mpc, at the source redshift of z = 0.0176 [31] with cosmological parameters corresponding to a ΛCDM universe with = 0.308, = 0.692, and km s Mpc [32]. A proper motion of 1 mas yr corresponds to an apparent superluminal speed of 1.21c, while 1 mas = 0.368 pc.
2. Methods
This manuscript relies on a re-analysis of observational data observed in the low energy (radio) and high energy (GeV-data) regime. In the following we describe the methods and tools used and developed in our data analysis.
2.1. Re-Analysis of VLBA Data
The MOJAVE1 (Monitoring Of Jets in Active galactic nuclei with VLBA Experiments) Program provides excellent VLBA monitoring data of pc-scale jets in AGN. We re-modeled 42 VLBA observations (15 GHz) of 3C 84 performed between 1999.99 and 2017.65. Gaussian circular components were fitted to the data to obtain the optimum set of parameters within the difmap-modelfit programme [33]. Every epoch was fitted independently from all the other epochs. Thus, the model-fitting procedure was performed blindly to not impose any specific outcome. We show the central structure of all the images with Gaussian model fit components superimposed in the Appendix A in Figure A1, Figure A2, Figure A3, Figure A4 and Figure A5.
Several authors (e.g., [4]) have mentioned that the well-known radio structure of 3C 84 contains substructure. This substructure is usually not modeled. In our studies presented here, we also model the substructure to trace the details of the radio structural evolution better.
3C 84 is a very complex radio galaxy with large-scale jet emission on pc-scales. In addition, the source structure evolved significantly with time. The proper alignment of the individual components within the central region would require phase-referencing observations since the information about the absolute positions of the components is lost in the VLBI data reduction. However and to our knowledge, phase referencing observations are not available for the time span analyzed in this manuscript. What we can measure, are relative offsets with regard to a chosen reference point.
We used a similar approach as described in [5]. The structure of the central region in 3C 84 changes significantly between 1999.99 and 2017.65. The core has only been observed and identified once in RadioAstron observations (in September 2013) [13]. We checked whether this core position would be detectable in all the epochs and could serve as a reference point. However, this core position could not be traced reliably across all the epochs and thus could not serve as a proper reference point. For a very crude alignment we used the separation between the larger lobe-structures (at about 10mas separation from the central structure) and the central part. Since the lobes were only detectable in a subset of the data sets, this provided only a coarse first step in the alignment of the maps.
Therefore we chose as the reference point the central position at epoch 1999.99 and kept this reference position through the epochs. This seemed to us the most promising and feasible approach to trace the structural changes in the central region as reliably as possible. By doing this, we did not impose any pre-knowledge and allowed an unambiguous analysis of the kinematics. Special care has been taken to correctly align the maps from epoch to epoch in the time sequence. The reference position (the core at (x,y) = (0,0)) has been chosen from the first epoch of the data we re-modeled and re-analyzed. This reference position has been kept by a very careful alignment of all the data from all the epochs and by checking the source evolution with time. The xy-positions of all jet components have been compared to the xy-positions of those same components that had been modeled in the epoch before and after. We aimed at minimizing the motion in x and y for each component across the epochs.
To summarize the basic procedure of our approach:
- We only use data from the MOJAVE survey to ensure comparing data obtained at the same frequency and similar quality of the data sets regarding the number of data points and the resolution of the observations.
- By fitting circular Gaussian components we model the details of the complex radio morphology and the substructure, which is usually not modeled due to the complexity of the source structure. Despite the complexity, our goal is to make robust component identifications which are not artifacts of the modeling procedure and then to follow and cross-identify these same components in the imaging time sequence. The model fitting has been performed blindly—each epoch has been modeled independently of other epochs. This enabled an unambiguous analysis of the kinematics.
- Since the “core” position determined in observations at 43 GHz by Giovannini et al. [13] could not be identified unambiguously in all the epochs obtained at 15 GHz, we developed a “differential” alignment method to analyse the complex kinematics in 3C 84. To our knowledge, this differential analysis has not been applied in VLBI data analysis before.
- Within this differential alignment, the central position at epoch 1999.99 has been kept as reference position through the epochs. The deviation in xy-positions of all jet components across the epochs has been minimized.
Uncertainties of the modelfit component parameters were determined using bootstrap [34]. For bootstrap applications to estimate uncertainties of VLBI results see [35]. We bootstrapped the adjusted residuals between self-calibrated interferometric visibilities and the best-fit difmap model. The residuals were first filtered from outliers, centered and distributions of the adjusted residuals were fitted using kernel density estimates (KDE). It was done independently for each baseline, correlation and frequency sub-band. We then added samples of the residuals from the fitted KDE to the model visibilities obtained from our best difmap model. The resulting bootstrapped visibility data sets were fitted in difmap using original best-fit model as the initial guess. It was done 300 times for each epoch. Thus we obtained a distribution for each parameter. The standard deviation was used for estimating the corresponding uncertainty.
2.2. Single-Dish Radio Flux-Densities
For the study presented here, we make use of the light-curves provided by the University of Michigan Radio Observatory monitoring program (UMRAO) providing long-term single-dish radio observations taken at three frequencies (4.8, 8.0, and 14.5 GHz). We combine the GHz data from the UMRAO with light-curve data obtained in 15 GHz radio observations by the Owens Valley Radio Observatory (OVRO2).
2.3. Fermi-LAT Data Analysis
We compare the light-curve evolution of 3C 84 at low energies in the radio regime with high energy GeV data provided by the Fermi Gamma-ray Space Telescope (Fermi-LAT). To generate the GeV light curves we analyzed Pass 8 photon data3 using version v11r5p3 of the Fermi ScienceTools4, including all photon data within around the position of 3C84. We fit 3C84 with a log-parabola of the form
with normalization factor , , and left free for the fit, while the scale parameter was fixed to its catalog value. The parameters of sources with a separation less than from 3C84 where left free for the fit as well. All parameters of all sources between and where included in the analysis with their parameters fixed to their catalog values. Time epochs during which 3C84 was observed at a zenith angle greater than were excluded in order to avoid contamination from the Earth limb. The Galactic diffuse emission was modeled using gll_iem_v06.fits and the template iso_P9R2_SOURCE_V6_v06.txt. We performed an unbinned likelihood analysis, as described above, for every time bin of width 5 days in the interval MJD 54683-58428 (2008-08-05 until 2018-11-06).
In the following, we discuss the results of the re-analysis of the VLBA observations of the jet of 3C 84 (Section 3.1). We will present strong indication for precession based on the observations. We find some indication for a correlation between the appearance of the TeV flare and the phase of the precession. To check for further support of a precession, we apply a precession model to single-dish radio light-curves (UMRAO + OVRO data) to test whether the radio flux-density evolution is consistent with precession (Section 3.3). We compare the OVRO light-curve with GeV data obtained by Fermi and perform a correlation analysis (Section 3.4). We briefly discuss the different time-scales for precession found in observations at different wavelengths and spatial scales (Section 4.5). We discuss the indications for precession in 3C 84 presented in this paper and in the literature. Finally we consider possible implications regarding cosmological questions (Section 4.6) and present our conclusions in Section 5.
3. Results
3C 84 reveals a complex radio structure on milli-arcsecond scales. In Figure 2a we show the radio structure visible in 15 GHz observations with the VLBA. The central region reveals significant changes of the radio structure between 1999.99 and 2017.65 (for comparison please see a map from Jan. 2000 in Figure 2b and from Apr. 2017 in Figure 2c. At the same time, epochs close in time to each other reveal comparable structure that confirms our modeling (see Figure 3). While the radio morphology in the central region consists of one curved chain of jet components in 1999.99, about 18 yr later there are components next to each other in a much broader jet.
3.1. Evidence for Jet Precession Based on VLBA Data Analysis
To determine the origin of these morphological changes, we studied the different parts of the pc-scale structure. In Figure 3 we show the positions of all the jet components which have been derived from the model-fitting of the VLBA data. The components are shown in an xy-plot and are displayed with their error bars. In most cases, the error bar is smaller than the symbol used to display the component. With boxes, we mark those components that will be discussed further within this paper. The red box marks the central region of 3C 84, while the cyan box marks the jet features of the northern lobe. The components of the southern lobe are marked with the blue box.
In Figure 4 we show the xy-coordinates of the jet components which were detected within the inner region of 3C 84 (red box of Figure 3). The data points are displayed in 42 different colors and styles, marking the 42 epochs that were covered by the observations. The first epoch is shown in yellow. Darker colors mark the data from later years. With time, a displacement of the jet components relative to the early data is visible from this figure.
To trace the direction of the displacement, we calculate the arithmetic mean and uncertainty for each yearly interval of the 18 year period in Figure 5a. In Figure 5b we show the same relation but calculated based on two-year averaging. The “uncertainty” in both figures is a measure for the angular distribution of the jet components and their motion within the one year of binning. Obviously, the displacement follows a clear trend. The paths in Figure 5a,b are indicated by green arrows. In addition, we performed a flux-density weighted averaging on yearly and bi-yearly timescale shown in Figure 5c,d respectively. The dominant trend of motion on a curve remains. The displacement with regard to the x-axis is similar as in the non flux-density weighted averaging. The main difference occurs with regard to the y-coordinate of the distribution. The flux-density weighted curve is constrained to a smaller range of (−0.3–0.6 mas) compared to (0.5–1) without flux-density weighting. At the end of this curved displacement (corresponding to the turn of the year 2016/17), the direction of motion seems to change (swings back). A similar motion and backswing is seen in the upper lobe in Figure 6.
3.2. VLBA Flux-Density Evolution of the Source Structure
Figure 7 shows the flux-density of the upper lobe (cyan), the lower lobe (blue), the central region (red), and of the reference point/component (grey). The flux of the reference component is for most of the time period analyzed much brighter than the upper lobe or the lower lobe. Most flux is contained in the central region for the whole observing period. The flux-density of the central region reveals an increase starting around 2006–2007 and so does the flux-density of the reference component. Around 2017, roughly 50% of the single-dish flux can be found within the reference component. At that time, the lobes are not detectable and the central region contains the total flux. We interpret the observed temporal and spatial structure of the jet evolution as clear evidence for a jet precession. In the following, we will provide further tests and in Section 4 we will discuss our findings and further arguments that this motion is consistent with precession.
The wealth of data observed for 3C 84 allows us to study the jet kinematics in great detail. This is, however, still work in progress, and the presentation of the full kinematic analysis is foreseen for a future paper.
3.3. Radio Variability Consistent with Inner Jet Precession on Time-Scales of ∼100 yr
The radio light curve based on the combined UMRAO (at 14.5 GHz) and OVRO data (monitoring with 40 m telescope at 15 GHz, Figure 8) shows first a gradual decrease from the peak at ∼1981.7 to the minimum at ∼2005 and a subsequent gradual increase [6]. Such a gradual, coherent change in flux densities is qualitatively consistent with the precession of the jet bulk motion, where the underlying non-thermal continuum of the jet can generally be expressed as with being the spectral index. The flux density is Doppler-boosted as the viewing angle decreases during the jet precession. The time-dependent flux density in the observer’s frame can then be expressed as (see e.g., [36,37]),
where is the time-dependent Doppler-boosting factor given by with being the Lorentz factor, the velocity of the moving jet components, and represents the angle with respect to the line of sight. The is the exponent of Doppler beaming and it is given by , where p is the factor expressing the geometry of the emission region: corresponds to the case of a continuous, cylindrical jet emission, while expresses the contribution from discrete spherical components [38,39]; see also the original derivation of Doppler-beaming by [40,41].
We fit the composite function of the flux variability caused by the precessing jet, see Equation (2), to the combined radio light curve from UMRAO and OVRO monitoring. In total, we are searching for eight parameters—, , , , , , , —where is the reference epoch, is the precession period in the observer’s frame, is the half-opening angle of the precession-cone axis, is the viewing angle of the precession-cone axis, and is the position angle of the precession axis on the sky plane (for a detailed description of the precession model see [37]). Since we have eight free parameters and we fit only the flux density evolution, the model is not constrained completely. However, at this stage, we are primarily interested in the qualitative assessment whether the radio variability is consistent with a realistic precession set-up. Further constraints on the model will come in combination with a detailed component analysis, as was previously done for OJ 287 [37].
In the fitting procedure, we make use of previous indications that the jet in 3C 84 should be precessing. This is based on the detection of colder bubbles or cavities that have different position angles with respect to the Perseus cluster core. They were detected as X-ray depressions in surface brightness maps [42]. Based on the position analysis and the estimates of the bubble buoyant rising time and their expansion speed, reference [43] constrained the half-opening angle of the precession cone, , the viewing angle of the precession axis , and the position angle of the precession axis , and finally the jet precession period of . We use these constraints to restrict the initial bounds of the fitted parameters shown in Table 1.
Based on only the radio light curve, the precession model can only be weakly constrained. However, the precession parameters obtained in this analysis can be used as initial values for a further analysis with the support of the kinematics of jet components, which is in preparation. That is why we decided, as a first approach, to limit the bounds of the basic precession angles based on the X-ray model and search for the best fit within these constraints, see Table 1 for a summary. Alternatively, one can fix the precession angles as well as the spectral index at specific values and search for the best solution for the other parameters. Concerning the precession period, we obtained two solutions as was already outlined and we summarize the best-fitted values in Table 1. The solution with a longer period of years (displayed in the top panel of Figure 8), with two different flux-density peaks, and the solution with a shorter period of years with two equal flux-density peaks (lower panel of Figure 8). These two fits had a different upper bound for the searched precession period in Table 1: years for the obtained period of 88 years and years for the obtained period of years.
Afterwards, we broadened the initial bounds significantly to include all physically plausible values. The fitting procedure converged to the one with the precession period of years. The best-fit values converged to values within the initial bounds, not at their limits as for the cases motivated by X-ray studies. Within the uncertainties, all the solutions can be considered consistent and can be further constrained by the future flux-density evolution.
In all the fitted cases, we obtain fit residuals with the maximum value of ∼15 . These residuals could hint at a more complex kinematical model, for instance a smaller nutation-like motion as studied in the case of the blazar OJ287 [37]. The model, by default, assumes the constant intrinsic jet emission over the studied time interval , which, if variable, could be another source of variability in addition to the Doppler beaming effect.
The precession model with the initial bounds as listed in Table 1 converged with the precession periods of yr and yr, respectively, the moderate Lorentz factor of , the base jet flux of , and the Doppler boosting exponent of , which implies the radio spectral index of (continuous jet) or (discreet jet) representing a steep or flat synchrotron spectrum, respectively. The precession angles are within the uncertainties consistent with the values inferred by [43]. We also tried the fitting procedure with the precession period within the interval yr, but the fit did not converge. The precession period is approximately 90 years since the two flux-density peaks are not of the same amplitude—the earlier peak appears to be larger than the following one based on observed data, see Figure 8 (upper panel). In case the two peaks would be comparable, as may be refined by future radio observations, the precession period may be shortened by approximately a factor of two to approximately 40 years, as shown in Figure 8 (lower panel).
In addition, we analyze the evolution of the viewing angle for the three precession models with three different periods: 41, 88, and 101 years, see Figure 9 for the temporal evolution of the viewing angle, the temporal evolution of the apparent velocity, and the temporal evolution of the Doppler factor. Depending on the best-fit precession angles, the maximum viewing angle of the jet is close to . The minimum viewing angle is for the solution with the shortest precession period of 41 years, 5 degrees. This solution is also consistent with the viewing angle of ∼11 degrees as inferred by Lister et al. [46] from the MOJAVE survey in the years 2002–2007. The precession period of 41 years is also preferred due to the temporal evolution of the apparent velocity which remains below 0.4c (in accordance with the results by [5,6]). According to this precession model, the viewing angle for the epoch 2019 should be ∼70.
3.4. Correlation between Single-Dish Radio Flux-Density Data and Fermi Gamma-Ray Data
A correlation analysis has been performed between the OVRO radio data and the GeV data observed by Fermi. For the Fermi data, 5-day binning was applied. The correlation analysis was performed in different ways. One approach similar to that described in [47] was used. In Figure 10b we show the normalized radio and GeV data, with the radio data shifted in time by +310 days (+meaning that the radio leads the GeV emission). Please note the different time axes for radio (upper axis) and GeV (lower axis). The data have been normalized by subtracting their average values and dividing them by their standard deviation. In addition, we applied the DCF routine by [48]. We find a moderate degree of correlation between the two light-curves with a peak value of ∼0.7 (Figure 10c) (1.0 would be perfect correlation). We find a delay between 300 and 400 days and checked the significance of the DCF peak using 3000 simulated noise-like light curves with the same probability density function (PDF) and power spectral density (PSD) as the original gamma- and radio light curves according to [49]. This method allows accounting for red-noise leakage and aliasing, see [49] for detail. Figure 10c shows the DCF and the range of DCF values that are not significant at a 3 level. We also fitted the gamma- and radio light curves with Gaussian Processes (GP) accounting for uncertainty in the parameters that determine the characteristic time scale and amplitude variation of the fitted function (i.e., hyperparameters). We applied Rational Quadratic kernel [50] that can account for different time scales of variability. An additional white noise kernel was used to describe the possible unaccounted noise. The posterior distribution of hyperparameters was obtained using the Marcov chain Monte Carlo (MCMC) method. For that purpose we applied an emcee sampler [51] and george Python library [52]. For the gamma-ray light curve data points with test statistics value “ts” < 25 were filtered out. This corresponds to a threshold in a detection significance equal to 5 [53]. Using realizations of the fitted GPs with hyperparameters drawn from their posterior distribution (Figure 10f,g) it is straightforward to calculate the uncertainty of the time lag. Both ordinal CCF (on a fine regular grid interpolated by GP) and DCF were calculated. The result is that for ordinal CCF 68% the credible interval is [−266, 234] d with median −251 d (Figure 10d. For DCF the conservative 68% confidence interval is [−509, −249] d with median −395 d. The -rays are significantly delayed relative to the radio data. We discuss this finding in Section 4.
In the following, we briefly summarize the content of this section. We presented first details of our study of the long-term kinematic evolution of the central radio structure of 3C 84. We find evidence for a smooth evolution with time which seems to be best described by precession. To our knowledge, this is the first time that such a continuous displacement has been reported. The appearance of the TeV flare reported by MAGIC seems to be correlated with a certain precession phase. In addition, we present the results of fitting a precession model to the radio flux-density data and show that a simple model fits the data. We derive a precession period in the range of ∼40–100 yrs, which depends on the characteristics of the precession model, and compare this to the much longer precession period derived earlier based on the observations of the X-ray cavities. A correlation analysis has been performed to determine the lag between the radio data (OVRO) and the GeV-data observed by the Fermi satellite. The GeV-data lag the radio data by 300–400 days.
4. Discussion
The radio structure of 3C 84 has long been a subject of debate. Reference [10] already discussed that the radio structure differs significantly from other objects mapped with VLBI. The main difference being that 3C 84 shows neither a linear structure nor the typical core-jet structure. The core has only recently been detected in high resolution observations with RadioAstron [13] within the central region.
Our detailed study of almost 18 yr of high-resolution observations of 3C 84 reveals essentially a smooth evolution of the radio structure. We do not find any evidence for dramatic changes in the outflow kinematics. Instead, it seems that the different appearance of the source structure is due to a change in the viewing angle—indicating that the source itself is moving or rotating with regard to the observer. As a consequence, different parts of the source structure become visible and detectable to the observer for different times of observation.
We therefore conclude, that the observed kinematic evolution provides a strong indication for precession of the central region (and upper lobe) in the pc-scale radio jet of 3C 84—based on a first analysis of the overall motion of all the jet features in 3C 84. Precession in 3C 84 has been claimed before by several authors based on simulations (e.g., [43,54]) to explain the Chandra observations of the X-ray cavities (e.g., [42]).
With the new results based on the long-term kinematics of the pc-scale jet, observational support for the precession origin is provided. The precessing motion of the jet features also quite naturally explains the long-term flux-density variations seen in the radio. Independent support for a scenario with a varying viewing angle (thus supporting the precession model) comes from the detection of a change in the -ray spectral properties for which variations in the Lorentz factor and/or the viewing angle are required to explain the observed variability from February 2011 onwards [55].
4.1. Origin of Radio Variability in 3C 84: Variable Jet Activity or Variable Doppler Beaming?
Several authors discuss the physical origin of the long-term (decades) radio variability in 3C 84 (e.g., [14]). The standard interpretation so far is that this variability is due to a variation of the jet activity or even restart of the jet activity. This interpretation is also based on the presence of the multiple radio-lobe structures on 10 mas scale. The double lobes on the 10 mas scale might originate in the 1959 outburst [56]. Nagai et al. [9] link the emergence of C3 with the outburst starting around 2005. C3 has also been identified as a hotspot of the innermost radio structure [9]. The understanding of these authors is, that the lobes account for most of the radio flux at centimeter wavelengths which is not correct, as we showed in Figure 7. The flux-density is dominated by the flux of the central region and the reference component contributes about 50% of the total flux. The general understanding is that the lobes are decelerated components. According to this standard interpretation, 3C 84 should have experienced several outbursts in its jet activity which lead to the formation of these lobes. Based on this argumentation, the jet power is variable on the timescale of decades or longer. The long-term radio light curve would then be explained by the variable jet activity alone. This standard interpretation takes only the variations of the intrinsic jet activity into account but not changes due to a varying Doppler factor that arise due to the bulk motion of the jet.
However, based on the data and analysis presented in this paper, we argue that the long-term radio variability is most likely due to the changes in the Doppler factor . We further illustrate this in Figure 11 where we plot the normalized Doppler factor as a function of the precession phase for the three different precession solutions (see Table 1 and Table 2 for details). The ratio of the maximum to the minimum Doppler factor is relatively small ∼1.4–1.5, but it is sufficient to account for the flux variability, with the variability amplitude given by . We do not exclude that the intrinsic jet activity is variable in addition and that the outer lobes might have been created in outbursts. But the current radio variability on the timescale of 10 years seems to be related to and caused by changes in the Doppler beaming and can be modeled as such. Our reasoning is based on the kinematics presented in this paper, the radio variability which can be explained by the precession model, the additional evidence for precession discussed and modeled for the X-ray emission, and to the SED modeling (discussed later in this paper) which requires a change in the angle to the line of sight.
4.2. Possible Causes of the Jet Precession in 3C 84
Two possible scenarios are usually invoked to explain the precessing motion (see also discussion by [43]):
Independent support for a binary origin of the precession comes from optical observations of 3C 84. For example, [59] have identified two spiral galaxy systems in the host galaxy of 3C 84 and suggested that they are two colliding galaxies. Note however, that [60] have shown that one of the two systems is probably an unrelated spiral galaxy seen in projection against NGC 1275. Detailed observations of NGC 1275 with the HST reveal an ongoing collision between a spiral system seen nearly edge-on and a giant elliptical with peculiar faint spiral structure in its nucleus [61], indicating that both galaxies are colliding at over 2700 km/s. Theoretical modeling by [62] provides a general explanation of jet precession as the result of the merger of two galaxies.
In a subsequent paper we will present a more detailed analysis of the overall kinematics, hopefully being able to place constraints on the binary black hole system parameters of the system.
4.3. GeV-Emission from 3C 84
Previous studies suggested that the increase in the -ray flux may be correlated with the radio flux densities in 3C 84 [6,63]. We study in Section 3.4 a possible correlation between the GeV light-curve obtained with Fermi and the radio light-curve observed within the OVRO monitoring program including the most recent data (see Figure 10a–c). We confirm the earlier findings of a correlated variability between the high energies (GeV) and low energies (15 GHz). In addition we find that the -ray data lag the radio data by about 300–400 days. It is usually assumed in models of fast particle acceleration (e.g., [64]) that the relation is the opposite: the radio data lag the high-frequency data. Fuhrmann et al. [65] performed a cross-correlation analysis between radio and -ray light-curves of 54 Fermi-bright blazars based on a source stacking analysis. They found an evidence for the radio data lagging the -rays when averaging over the whole sample. Reference [66] performed a cross-correlation analysis using discrete correlation functions between the radio and the -ray light curves. They found 26 sources with significant correlations where in most of the sources the -ray peaks lead the radio.However, this relation seems not to be consistently present even for blazars, as a study shows [67]. The results of their investigation show that correlations between radio and gamma-ray light curves of blazars are only found in a minority of the sources (over a 4 yr period). The conclusion of this study is that most likely the connection between both frequency regimes is of more complex nature. Currently there is no accepted explanation why the gamma-ray data lag the radio data by a significant amount of time in 3C 84. We speculate that the lag could be related to the precession reported in this current paper and the geometry of the system, e.g., the radio emission and gamma-ray emission might be produced in different regions of the jet. Due to the precessing motion, these regions would be detectable at different times.
3C 84 shows a significant brightness increase in the radio since 2005 [68]. The maximum of this brightness increase seems to be reached in 2017 (Figure 10). The -ray flux has steadily increased between 2008 and 2016. For the period between 2013 and 2015, a correlated brightening of the nucleus in the X-rays and -ray regime has been reported [69]. Between 2016 and 2017 a dip in the -ray flux is observed, which seems to follow a similar dip seen before in the radio light-curve. The -ray flux of 3C 84 is known to be highly variable on short (∼days to weeks) time-scales (e.g., [55]).
4.4. Potential Origin of the TeV Emission in 3C 84
3C 84 was detected in two observational campaigns by MAGIC between 2009 October and 2010 February and between 2010 August and 2011 February and by VERITAS in ToO observations between 2012 December and 2013 February as well as between 2013 October and November [29,70,71]. A bright TeV flare has been observed in the night from 2016 December 31 to 2017 January 1 by [30]. The MAGIC collaboration has investigated different models to explain the TeV emission observed in 3C 84. According to these authors, the only mechanism to account for the observed luminosities in the brightest TeV flare is the generation of gamma-rays in a magnetospheric gap around the central black hole. In addition, an enhancement of the magnetic field threading the black hole from its equipartition value with the gas pressure in the accretion flow is required. This explanation refers to the brightest TeV-flare. In the following, we report on results from previous studies with regard to lower-level emission. The TeV emission observed in 3C 84 before the 2016/17 event has been modeled by several authors (e.g., [55,69]) within a one-zone synchrotron self-Compton model. A change in the spectral behavior in the LAT energy band has been found around 2011 February [55]. The authors suggest that at earlier times the flux changes were caused by high-energy electron injections into the jet. After February 2011, the -ray flares were either caused by a changing Doppler factor due to variations of the jet Lorentz factor and/or the angle to our line of sight. A precessing system leads to changes of the angle to the line of sight.
The studies by [55,69] point towards a change in the -ray spectral properties which can be explained (after February 2011) by a changing Lorentz factor and/or the viewing angle. This finding supports our result of detecting precession for 3C 84.
Interestingly, we find that the time of the TeV flare seems to correlate with the (projected) reversal point of the precessing motion of the components. The flaring activity appears to have occurred over only several days. Ahnen et al. [72] report on MAGIC telescope observations at very-high energies for a total of 253 h from 2009 to 2014 and no flares seem to have occurred during this time. Also, the complete data observed for the Perseus cluster by MAGIC between 2009 and 2017 are presented by [73]. It seems that 3C 84 flared only once at TeV-energies. Our study and correlation analysis will have to be continued in the future with more data.
In summary, we don’t know what the specific physical conditions at this position are, or whether the flare is caused by intrinsic or environmental effects, or by a geometric effect. It is possible, that the sites producing the radio, GeV, and TeV emission in 3C 84 are not cospatial. As already mentioned, the precession has been invoked by simulations based on the X-ray data to explain the cavities. As [74] have confirmed based on 900 ks Chandra X-ray observations, there is a strong hard X-ray excess within the central region of the Perseus cluster. We suggest, that the precessing motion of the radio jet might lead to an interaction with ambient X-ray gas. This could explain the TeV-flare. Especially, since the TeV-flare seems to correlate with the projected turning point of the precessing motion. Another possibility, which we will explore with the detailed kinematic analysis planned for a future paper, whether the TeV-flare can be related to specific jet component behaviour. However, we may conclude that the origin of the TeV emission in 3C 84 might be related to the jet precession. We assume—this will have to be confirmed by modeling—that the source is pointing towards us with a smaller viewing angle at that time. Further support for our findings stems from the studies of [3] who suggest that the innermost jet resembles a slightly off-angle BL Lac object.
4.5. The Derived Time-Scales for Precession in 3C 84
With this paper, we provide strong indication for a precessing jet in 3C 84 based on almost 18 years of VLBA observations. This finding is based on the highest resolution observations discussed for this source in this paper. This is a first analysis of the overall kinematics and most likely can be improved by studying the detailed individual component motions.
4.5.1. Time-Scales for Precession in 3C 84: VLBI Maps
In case, precession plays an important role for the source structure of 3C 84, then older maps should reveal a similar source structure as some of the maps we show in this manuscript. We searched the archives for earlier maps of 3C84. In Figure 1 we show two maps obtained in 6cm VLBI observations in 1973 (left) and 1974.1 (right). Both reveal a central structure which seems to consist of two features. This is similar to what we find around the time of 2014 and later (see Figure A4). Although the observation from 1973 and 1974.1 have been performed at a lower frequency, the basic central structure looks similar. This finding provides an estimate for the precession time-scale of the order of about 40 years.
4.5.2. Time-Scales for Precession in 3C 84: Single-Dish Radio Flux Modeling
To check for consistency of the finding of precession based on the source kinematics, we fitted a precession model to the so far available single dish radio observations (at 14.5 and 15 GHz). Indeed, a precession model nicely reproduces the observed flux-density evolution and thus provides further support for the precessing motion deduced based on the VLBA jet observations. Although we made use of all radio data available since the beginning of UMRAO-monitoring, it is clear from Figure 8 that we can not cover several cycles. This fit supports our finding from the morphological studies of the jet but can not be regarded as a firm proof of the precession model. Several precession cycles will have to be observed in order to establish the precession unambiguously. This, however, will most likely be the work for future generations of astronomers given the precession period of ∼88–101 yrs. As discussed before, a value of ∼41 yrs is also possible, which could be tested in the near future. Based on the VLBA data analysis of the kinematics of 3C 84 presented in this paper, the precession time-scale seems to be shorter. From Figure 5b it seems that one half of an orbit (blue arrow from about 2007–2017) takes about 10 yr. This VLBI precession period seems to be inconsistent with the precession fit to the single-dish light curve. This inconsistency can be softened by considering the time after 2010 when the radio curve rose more rapidly. From Figure 8 this seems to fit the OVRO data light-curve. This might imply a change in the value of the precession period.
4.5.3. Time-Scales for Precession in 3C 84: X-Ray Cavity Simulations
Additional support for the precession model comes from the SED-modeling of the multi-wavelength observations [55] and the simulations reproducing the X-ray cavities (e.g., [43,54]). Several groups have nicely shown that precession is capable of reproducing the X-ray observations. The modeling of the required precession based on the X-ray cavities leads to a different value for the precession time-scale.
The apparent discrepancy between the precession time-scale of the inner jet, 40–90 based on our analysis of the kinematics, and the precession period based on the cavities, , implies a difference of five orders of magnitude. This difference can be explained by one of the three following effects or by their combination,
- The longer precession period is based on the X-ray observations of larger, kpc structures where cavities or bubbles can be resolved. These structures come from older times, when the supermassive black holes of the merging two galaxies were further apart from each other. The shorter precession period is related to the inner jet, which reflects the more recent activity. In the meantime, the two black holes could have approached significantly. Typical orbital decay time-scales from modelling are –10 yr for gas dynamical friction (e.g., [75]). The shortening of the precession period depends on the merging time-scale of the binary system of 3C 84.
- The X-ray cavities could be created only occassionally during epochs of increased intrinsic jet emission , which can be time-variable. The sparse ejection of rising bubbles, i.e., not during every precession period, would prolong the periodicity in case the precession period determination is based on the resolved pair of bubbles. In other words, smaller bubbles could be beyond the detection threshold, or more bubbles could be blended into an apparent larger one.
- Faster precession motion may be superposed on the slower motion. Faster precession on the time-scales of ∼100 yr could be driven by a secondary black hole, while the slower precession could be due to the warped disc on larger scales, which leads to the misalignment of angular momenta and the Lense-Thirring precession of either the inner portion of the disc and the black hole [76] or the precession of an outer disc [54], which can affect the jet kinematics depending on where it originates (Blandford-Znajek [77] or Blandford-Payne [78] process).
Dunn et al. [43] already discuss whether the different pairs of X-ray cavities/bubbles belong to different “generations” and whether the precession is speeding up. A speeding up would explain a decrease in the precession time scale. It seems likely that the precession angle is changing (from kpc-scales to pc-scales). However, in the current modeling presented in this paper, the precession angle is kept fixed to get a first rough idea on the parameters of the system. We plan to take care of this point in the future kinematic study. More data and simulations are clearly needed to answer this question.
We want to stress, that the multi-wavelength observations performed with different telescopes providing different resolutions all seem to come to the same conclusion, that precession seems to play a dominant role in explaining the different physical phenomena which make 3C 84 so special. It is not really a surprise that the shortest time-scale is found based on the highest resolution observations (radio). This would have been expected since these observations probe the region of the most recent and youngest activity. In case the precession model is correct and originates in a binary black hole scenario of approaching black holes, the orbital evolution of the binary system should lead to changing precession time-scales with time.
Of course, much more data and detailed modeling of those is required to connect the different spatial scales and the proper time-scales of precession potentially at work in 3C 84 to finally prove the precession model and decode the dynamics of this source.
4.6. Implications for Cosmology
With this paper we present another important piece to understand the relation between galaxy mergers and the triggering of AGN jet activity. It has long been derived (by analysis and numerical modeling) that mergers of galaxies enable the removal of angular momentum and the transport of material to the central engine within the hierarchical galaxy formation model (e.g., [79,80]). The collision of galaxies can lead to the formation of binary black hole systems (e.g., [80]). The so-called final parsec problem [81] results from an obvious conflict between the observational finding that most supermassive binary black holes (SMBBH) in nearby galaxies seem to have coalesced quickly and the theoretical expectation of a stall on a time-scale longer than the Hubble time. Unbound AGN binary systems with separations of the order of kiloparsecs have been found (e.g., [82]). Many authors have presented indirect evidence for supermassive binary black holes based on pc-scale jet precession (e.g., OJ287: [37,38]; 1928+738: [83]; 3C 454.3: [84]; 3C 120: [36]; PG 1553+113: [85]).
NGC 1275—as Hubble observations show—is an ongoing merger of two spiral systems and 3C 84 seems to be precessing. This latter finding provides further strong support for the more general hypothesis that AGN activity is related to galaxy mergers and the consequent formation of supermassive black hole pairs (e.g., [86,87,88]). Precession is a fingerprint to discover these systems. Precession is also a tool to derive information on the physical parameters of the binary system, e.g., as was done for OJ 287 [37], for the other sources by the authors listed at the end of the previous paragraph and for many more sources. X-ray cavities in addition provide an independent proof for the validity of this concept and can help to study the long-time cosmic evolution of these systems.
More: In case our interpretation is correct and the flux-density evolution is due to precession, then the claim of restarting activity [14] is probably not corret.
5. Conclusions
By re-modeling and re-analyzing 42 epochs of 15 GHz VLBA observations of 3C 84, we find evidence for a long-term continuous displacement of the central radio structure. This long-term variation has not been shown before and can best be explained by precession. We thus find clear indication for precession of the jet source in 3C 84. The derived precession period (based on fitting the UMRAO and OVRO radio data) is in the range of ∼41–101 yrs. A comparison with maps of 3C 84 taken in 1973 and 1974.1 which show a similar central readio structure support a value of 41 yrs for the precession period. The derived values for the apparent speeds also seem to favor a precession period of abour 40 yrs. This value differs from the precession period derived earlier to explain the X-ray cavities, which is five orders of magnitude larger. We discuss several possible explanations. The most plausible reason to explain the difference is the evolution of the merging process of a binary black hole system. In this paper, we study the evolution of the inner jet, while the X-ray cavities most likely provide information about an earlier phase of the approaching black holes. 3C 84 seems to show a change in the precession period with time—this result and its implications should be studied in more detail.
To our knowledge, this is the first time that observational evidence for precession is presented in 3C 84. We tentatively suggest that the TeV-flaring coincides with a specific precession phase. Our results indicate that the dynamical evolution of the jet (and the beaming factor) might play a role in explaining the TeV emission in this source. SED-modeling of multi-frequency data (e.g., [55,69] support our findings that the angle to the line of sight is changing. Beaming thus plays a role in this AGN where the innermost jet resembles a slightly off-angle BL Lac object [3]. The accordance of the direction of the precession with the sizes and shapes of the X-ray cavities supports our claims of the reality of the three-dimensional motion of the radio jet in 3C 84.
Author Contributions
S.B. prepared most of the text in collaboration with C.F. and M.Z. S.B. performed the VLBA data re-analysis. M.Z. provided the precession analysis. The Fermi-LAT Data Analysis was done by F.J. The correlation analysis was contributed by M.Z., I.P., and F.J. UMRAO data were provided by M.F.A. and H.D.A. All co-authors contributed in the discussion of the presented results.
Funding
M.Z. acknowledges the support by the National Science Centre, Poland, grant No. 2017/26/A/ST9/00756 (Maestro 9). This research has made use of data from the OVRO 40-m monitoring program [89] which is supported in part by NASA grants NNX08AW31G, NNX11A043G, and NNX14AQ89G and NSF grants AST-0808050 and AST-1109911. This research has made use of data from the University of Michigan Radio Astronomy Observatory which has been supported by the University of Michigan and by a series of grants from the National Science Foundation, most recently AST-0607523 and by NASA Fermi GI grants.
Acknowledgments
We thank M. Böttcher, R. Lico, T. Reiprich, E. Prandini, A. Witzel, Gopal-Krishna, and P. Biermann for very insightful discussions. A. Roy’s comments helped to significantly improve this paper. The comments of both anonymous referees provided very constructive help. Michal Zajaček acknowledges the support by the National Science Centre, Poland, grant No. 2017/26/A/ST9/00756 (Maestro 9). This research has made use of data from the MOJAVE database that is maintained by the MOJAVE team [90]. This research has made use of data from the OVRO 40-m monitoring program [89] which is supported in part by NASA grants NNX08AW31G, NNX11A043G, and NNX14AQ89G and NSF grants AST-0808050 and AST-1109911. This research has made use of data from the University of Michigan Radio Astronomy Observatory which has been supported by the University of Michigan and by a series of grants from the National Science Foundation, most recently AST-0607523 and by NASA Fermi GI grants. This work has made use of public Fermi data obtained from the High Energy Astrophysics Science Archive Research Center (HEASARC), provided by NASA Goddard Space Flight Center.
Conflicts of Interest
The authors declare no conflict of interest.
Appendix A. Difmap Model-Fitting Parameters
Figure A1.
VLBA images superimposed by Gaussian circular components. Their parameters have been derived within the difmap-modelfit programme. The epochs are: December 1999–February 2002.
Figure A1.
VLBA images superimposed by Gaussian circular components. Their parameters have been derived within the difmap-modelfit programme. The epochs are: December 1999–February 2002.
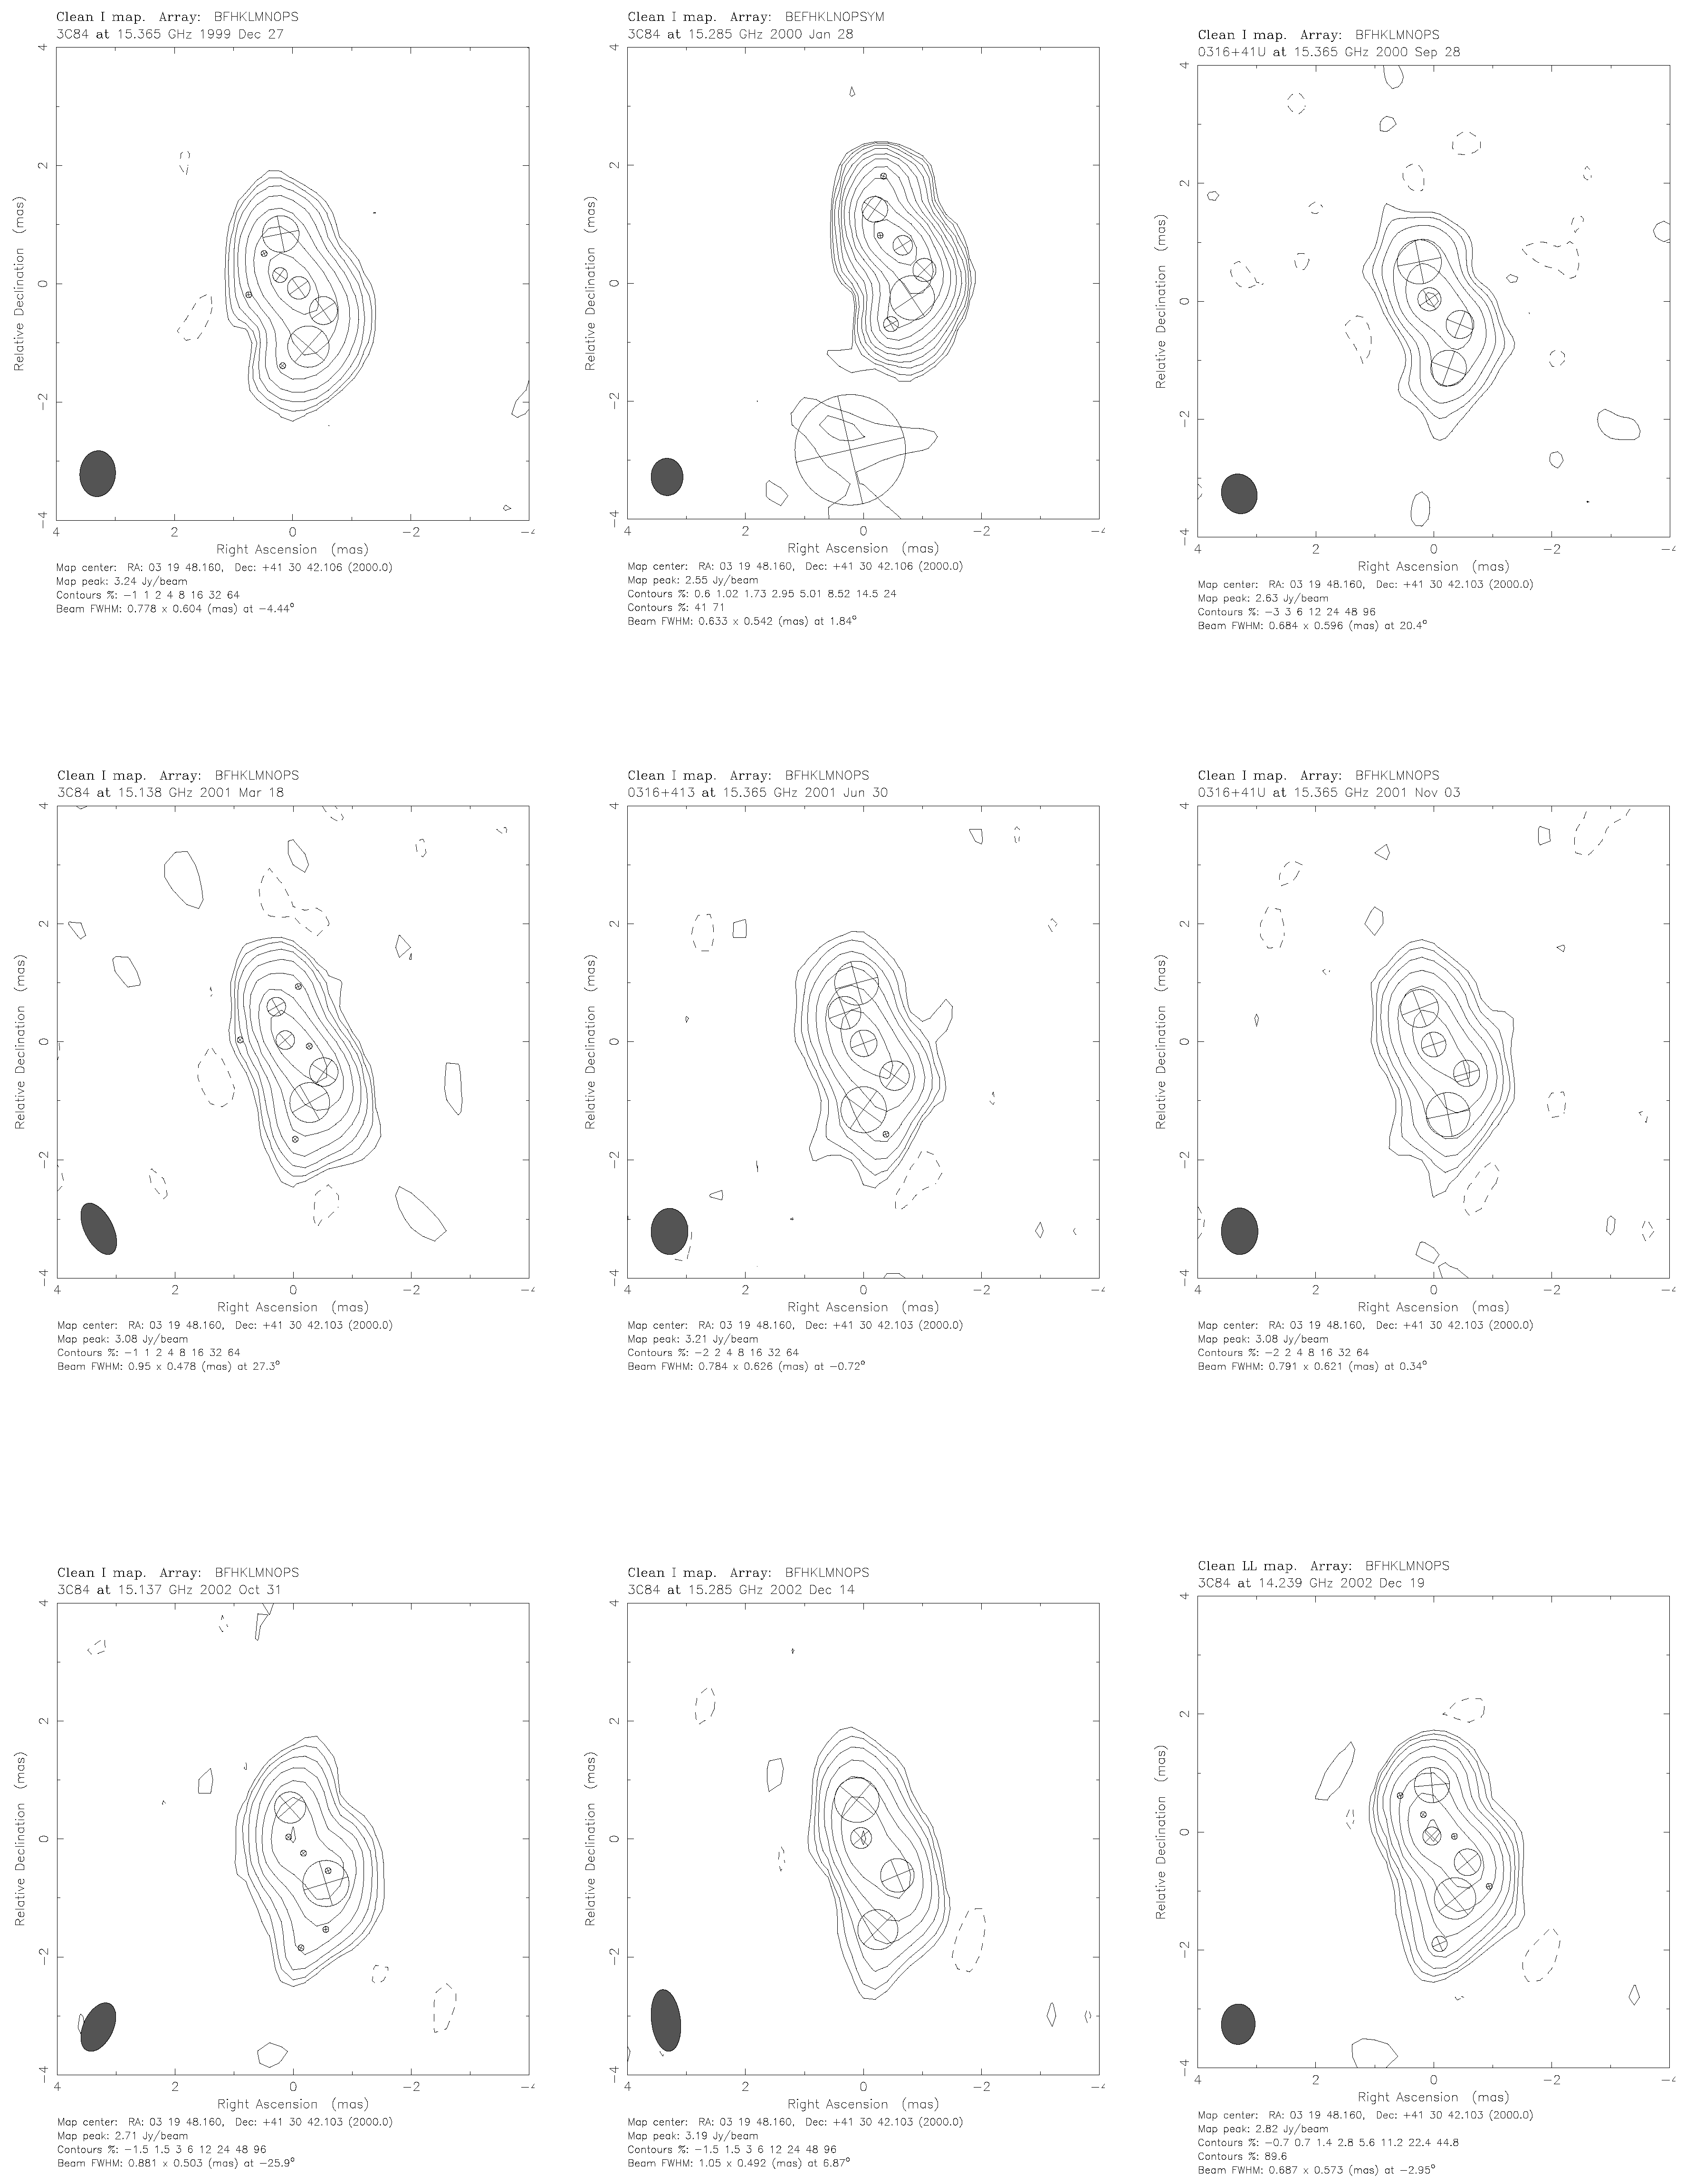
Figure A2.
Same as Figure A1 for epochs: March 2003–March 2007.
Figure A2.
Same as Figure A1 for epochs: March 2003–March 2007.


References
- Nesterov, N.S.; Lyuty, V.M.; Valtaoja, E. Radio and optical evolution of the Seyfert galaxy NGC 1275. Astron. Astrophys. 1995, 296, 628–632. [Google Scholar]
- Bridges, T.J.; Irwin, J.A. Molecular gas in the Perseus cooling flow galaxy, NGC 1275. Mon. Not. R. Astron. Soc. 1998, 300, 967–976. [Google Scholar] [CrossRef] [Green Version]
- Punsly, B.; Marziani, P.; Bennert, V.N.; Nagai, H.; Gurwell, M.A. Revealing the Broad Line Region of NGC 1275: The Relationship to Jet Power. Astrophys. J. 2018, 869, 143. [Google Scholar] [CrossRef] [Green Version]
- Kino, M.; Wajima, K.; Kawakatu, N.; Nagai, H.; Orienti, M.; Giovannini, G.; Hada, K.; Niinuma, K.; Giroletti, M. Evidence of Jet-Clump Interaction: A Flip of the Radio Jet Head of 3C 84. Astrophys. J. 2018, 864, 118. [Google Scholar] [CrossRef]
- Hiura, K.; Nagai, H.; Kino, M.; Niinuma, K.; Sorai, K.; Chida, H.; Akiyama, K.; D’Ammando, F.; Giovannini, G.; Giroletti, M.; et al. VERA monitoring of the radio jet 3C 84 in the period of 2007-2013: Detection of non-linear motion. Publ. Astron. Soc. Jpn. 2018, 70, 83. [Google Scholar] [CrossRef]
- Hodgson, J.A.; Rani, B.; Lee, S.S.; Algaba, J.C.; Kino, M.; Trippe, S.; Park, J.H.; Zhao, G.Y.; Byun, D.Y.; Kang, S.; et al. KVN observations reveal multiple γ-ray emission regions in 3C 84? Mon. Not. R. Astron. Soc. 2018, 475, 368–378. [Google Scholar] [CrossRef]
- Jorstad, S.G.; Marscher, A.P.; Morozova, D.A.; Troitsky, I.S.; Agudo, I.; Casadio, C.; Foord, A.; Gómez, J.L.; MacDonald, N.R.; Molina, S.N.; et al. Kinematics of Parsec-scale Jets of Gamma-Ray Blazars at 43 GHz within the VLBA-BU-BLAZAR Program. Astrophys. J. 2017, 846, 98. [Google Scholar] [CrossRef]
- Lister, M.L.; Aller, M.F.; Aller, H.D.; Homan, D.C.; Kellermann, K.I.; Kovalev, Y.Y.; Pushkarev, A.B.; Richards, J.L.; Ros, E.; Savolainen, T. MOJAVE: XIII. Parsec-scale AGN Jet Kinematics Analysis Based on 19 years of VLBA Observations at 15 GHz. Astron. J. 2016, 152, 12. [Google Scholar] [CrossRef]
- Nagai, H.; Haga, T.; Giovannini, G.; Doi, A.; Orienti, M.; D’Ammando, F.; Kino, M.; Nakamura, M.; Asada, K.; Hada, K.; et al. Limb-brightened Jet of 3C 84 Revealed by the 43 GHz Very-Long-Baseline-Array Observation. Astrophys. J. 2014, 785, 53. [Google Scholar] [CrossRef]
- Pearson, T.J.; Readhead, A.C.S. The milli-arcsecond structure of a complete sample of radio sources. I. VLBI maps of seven sources. Astrophys. J. 1981, 248, 61–81. [Google Scholar] [CrossRef]
- Pauliny-Toth, I.I.K.; Preuss, E.; Witzel, A.; Graham, D.; Kellerman, K.I.; Ronnang, B. 6-cm VLBI observations of compact radio sources. Astron. J. 1981, 86, 371–385. [Google Scholar] [CrossRef]
- Walker, R.C.; Anantharamaiah, K.R. A VLBA Search for a Stimulated Recombination Line from the Accretion Region in NGC 1275. Astron. J. 2003, 125, 1756–1761. [Google Scholar] [CrossRef]
- Giovannini, G.; Savolainen, T.; Orienti, M.; Nakamura, M.; Nagai, H.; Kino, M.; Giroletti, M.; Hada, K.; Bruni, G.; Kovalev, Y.Y.; et al. A wide and collimated radio jet in 3C84 on the scale of a few hundred gravitational radii. Nat. Astron. 2018, 2, 472–477. [Google Scholar] [CrossRef] [Green Version]
- Nagai, H.; Suzuki, K.; Asada, K.; Kino, M.; Kameno, S.; Doi, A.; Inoue, M.; Kataoka, J.; Bach, U.; Hirota, T.; et al. VLBI Monitoring of 3C 84 (NGC 1275) in Early Phase of the 2005 Outburst. Publ. Astron. Soc. Japan 2010, 62, L11. [Google Scholar] [CrossRef]
- Suzuki, K.; Nagai, H.; Kino, M.; Kataoka, J.; Asada, K.; Doi, A.; Inoue, M.; Orienti, M.; Giovannini, G.; Giroletti, M.; et al. Exploring the Central Sub-parsec Region of the γ-Ray Bright Radio Galaxy 3C 84 with VLBA at 43 GHz in the Period of 2002–2008. Astrophys. J. 2012, 746, 140. [Google Scholar] [CrossRef]
- Madejski, G.G.; Sikora, M. Gamma-Ray Observations of Active Galactic Nuclei. Annu. Rev. Astron. Astrophys. 2016, 54, 725–760. [Google Scholar] [CrossRef]
- Rani, B. Radio Galaxies—The TeV Challenge. Galaxies 2019, 7, 23. [Google Scholar] [CrossRef]
- Rieger, F.; Levinson, A. Radio Galaxies at VHE Energies. Galaxies 2018, 6, 116. [Google Scholar] [CrossRef]
- Kadowaki, L.H.S.; de Gouveia Dal Pino, E.M.; Singh, C.B. The Role of Fast Magnetic Reconnection on the Radio and Gamma-ray Emission from the Nuclear Regions of Microquasars and Low Luminosity AGNs. Astrophys. J. 2015, 802, 113. [Google Scholar] [CrossRef]
- Britzen, S.; Fendt, C.; Eckart, A.; Karas, V. A new view on the M 87 jet origin: Turbulent loading leading to large-scale episodic wiggling. Astron. Astrophys. 2017, 601, A52. [Google Scholar] [CrossRef] [Green Version]
- Acciari, V.A.; Aliu, E.; Arlen, T.; Bautista, M.; Beilicke, M.; Benbow, W.; Bradbury, S.M.; Buckley, J.H.; Bugaev, V.; Butt, Y.; et al. Radio Imaging of the Very-High-Energy γ-Ray Emission Region in the Central Engine of a Radio Galaxy. Science 2009, 325, 444. [Google Scholar] [CrossRef]
- Abramowski, A.; Acero, F.; Aharonian, F.; Akhperjanian, A.G.; Anton, G.; Balzer, A.; Barnacka, A.; Barres de Almeida, U.; Becherini, Y.; Becker, J.; et al. The 2010 Very High Energy γ-Ray Flare and 10 Years of Multi-wavelength Observations of M 87. Astrophys. J. 2012, 746, 151. [Google Scholar] [CrossRef]
- Hada, K.; Giroletti, M.; Kino, M.; Giovannini, G.; D’Ammando, F.; Cheung, C.C.; Beilicke, M.; Nagai, H.; Doi, A.; Akiyama, K.; et al. A Strong Radio Brightening at the Jet Base of M 87 during the Elevated Very High Energy Gamma-Ray State in 2012. Astrophys. J. 2014, 788, 165. [Google Scholar] [CrossRef]
- Kadler, M.; Eisenacher, D.; Ros, E.; Mannheim, K.; Elsässer, D.; Bach, U. The blazar-like radio structure of the TeV source IC 310. Astron. Astrophys. 2012, 538, L1. [Google Scholar] [CrossRef] [Green Version]
- HESS Collaboration; Abdalla, H.; Abramowski, A.; Aharonian, F.; Ait Benkhali, F.; Akhperjanian, A.G.; Andersson, T.; Angüner, E.O.; Arrieta, M.; Aubert, P.; et al. H.E.S.S. discovery of very high energy γ-ray emission from PKS 0625-354. Mon. Not. R. Astron. Soc. 2018, 476, 4187–4198. [Google Scholar] [CrossRef]
- Tavecchio, F.; Ghisellini, G. On the spine-layer scenario for the very high-energy emission of NGC 1275. Mon. Not. R. Astron. Soc. 2014, 443, 1224–1230. [Google Scholar] [CrossRef] [Green Version]
- De Angelis, A.; Mallamaci, M. Gamma-ray astrophysics. Eur. Phys. J. Plus 2018, 133, 324. [Google Scholar] [CrossRef]
- Sikora, M.; Madejski, G. Blazars; American Institute of Physics Conference Series; Aharonian, F.A., Völk, H.J., Eds.; American Institute: New York, NY, USA, 2001; Volume 558, pp. 275–288. [Google Scholar] [CrossRef]
- Aleksić, J.; Alvarez, E.A.; Antonelli, L.A.; Antoranz, P.; Asensio, M.; Backes, M.; Barres de Almeida, U.; Barrio, J.A.; Bastieri, D.; Becerra González, J.; et al. Detection of very-high energy γ-ray emission from <ASTROBJ>NGC 1275</ASTROBJ> by the MAGIC telescopes. Astron. Astrophys. 2012, 539, L2. [Google Scholar] [CrossRef]
- MAGIC Collaboration; Ansoldi, S.; Antonelli, L.A.; Arcaro, C.; Baack, D.; Babić, A.; Banerjee, B.; Bangale, P.; Barres de Almeida, U.; Barrio, J.A.; et al. Gamma-ray flaring activity of NGC1275 in 2016-2017 measured by MAGIC. Astron. Astrophys. 2018, 617, A91. [Google Scholar] [CrossRef]
- Strauss, M.A.; Huchra, J.P.; Davis, M.; Yahil, A.; Fisher, K.B.; Tonry, J. A Redshift Survey of IRAS Galaxies. VII. The Infrared and Redshift Data for the 1.936 Jansky Sample. Astrophys. J. Suppl. 1992, 83, 29. [Google Scholar] [CrossRef]
- Ade, P.A.; Aghanim, N.; Arnaud, M.; Ashdown, M.; Aumont, J.; Baccigalupi, C.; Banday, A.J.; Barreiro, R.B.; Bartlett, J.G.; Bartolo, N.; et al. Planck 2015 results-xiii. cosmological parameters. Astron. Astrophys. 2016, 594, A13. [Google Scholar]
- Shepherd, M.C. Difmap: An Interactive Program for Synthesis Imaging. Bull. Am. Astron. Soc. 1997, 125, 987–989. [Google Scholar]
- Efron, B. Bootstrap methods: Another look at the jackknife. Ann. Stat. 1979, 7, 1–26. [Google Scholar] [CrossRef]
- Pashchenko, I.N. Using the bootstrap to assess uncertainties of VLBI results—I. The method and image-based errors. Mon. Not. R. Astron. Soc. 2019, 482, 1955–1965. [Google Scholar] [CrossRef]
- Caproni, A.; Abraham, Z. Can long-term periodic variability and jet helicity in 3C 120 be explained by jet precession? Mon. Not. R. Astron. Soc. 2004, 349, 1218–1226. [Google Scholar] [CrossRef] [Green Version]
- Britzen, S.; Fendt, C.; Witzel, G.; Qian, S.J.; Pashchenko, I.N.; Kurtanidze, O.; Zajacek, M.; Martinez, G.; Karas, V.; Aller, M.; et al. OJ287: Deciphering the ‘Rosetta stone of blazars. Mon. Not. R. Astron. Soc. 2018, 478, 3199–3219. [Google Scholar] [CrossRef]
- Abraham, Z. Precession, beaming and the periodic light curve of OJ287. Astron. Astrophys. 2000, 355, 915–921. [Google Scholar]
- Abraham, Z. Beaming in Jets with Evolving Relativistic Features. Blazar Demogr. Phys. 2001, 227, 108. [Google Scholar]
- McCrea, W.H. Relativistic beaming. Mon. Not. R. Astron. Soc. 1972, 157, 359. [Google Scholar] [CrossRef]
- Blandford, R.D.; Königl, A. Relativistic jets as compact radio sources. Astrophys. J. 1979, 232, 34–48. [Google Scholar] [CrossRef]
- Fabian, A.C.; Sanders, J.S.; Allen, S.W.; Canning, R.E.A.; Churazov, E.; Crawford, C.S.; Forman, W.; Gabany, J.; Hlavacek-Larrondo, J.; Johnstone, R.M.; et al. A wide Chandra view of the core of the Perseus cluster. Mon. Not. R. Astron. Soc. 2011, 418, 2154–2164. [Google Scholar] [CrossRef]
- Dunn, R.J.H.; Fabian, A.C.; Sanders, J.S. Precession of the super-massive black hole in NGC 1275 (3C 84)? Mon. Not. R. Astron. Soc. 2006, 366, 758–766. [Google Scholar] [CrossRef] [Green Version]
- Levenberg, K. A method for the solution of certain problems in least squares. Quat. J. Appl. Math. 1944, 27, 164–168. [Google Scholar] [CrossRef]
- Marquardt, D.W. An Algorithm for Least-Squares Estimation of Nonlinear Parameters. J. Soc. Ind. Appl. Math. 1963, 11, 431–441. [Google Scholar] [CrossRef]
- Lister, M.L.; Cohen, M.H.; Homan, D.C.; Kadler, M.; Kellermann, K.I.; Kovalev, Y.Y.; Ros, E.; Savolainen, T.; Zensus, J.A. MOJAVE: Monitoring of Jets in Active Galactic Nuclei with VLBA Experiments. VI. Kinematics Analysis of a Complete Sample of Blazar Jets. Astron. J. 2009, 138, 1874–1892. [Google Scholar] [CrossRef]
- Britzen, S.; Fendt, C.; Böttcher, M.; et al. Astron. Astrophys. 2019. submitted.
- Edelson, R.A.; Krolik, J.H. The Discrete Correlation Function: A New Method for Analyzing Unevenly Sampled Variability Data. Astrophys. J. 1988, 333, 646. [Google Scholar] [CrossRef]
- Emmanoulopoulos, D.; McHardy, I.M.; Papadakis, I.E. Generating artificial light curves: revisited and updated. Mon. Not. R. Astron. Soc. 2013, 433, 907–927. [Google Scholar] [CrossRef] [Green Version]
- Rasmussen, C.E.; Williams, C.K.I. Gaussian Processes for Machine Learning; MIT Press: Cambridge, MA, USA, 2006. [Google Scholar]
- Foreman-Mackey, D.; Hogg, D.W.; Lang, D.; Goodman, J. emcee: The MCMC Hammer. Publ. Astron. Soc. Pac. 2013. [Google Scholar] [CrossRef]
- Ambikasaran, S.; Foreman-Mackey, D.; Greengard, L.; Hogg, D.W.; O’Neil, M. Fast Direct Methods for Gaussian Processes. IEEE Trans. Pattern Anal. Mach. Intell. 2015. [Google Scholar] [CrossRef]
- Mattox, J.R.; Bertsch, D.L.; Chiang, J.; Dingus, B.L.; Digel, S.W.; Esposito, J.A.; Fierro, J.M.; Hartman, R.C.; Hunter, S.D.; Kanbach, G.; et al. The Likelihood Analysis of EGRET Data. Astrophys. J. 1996, 461, 396. [Google Scholar] [CrossRef]
- Falceta-Gonçalves, D.; Caproni, A.; Abraham, Z.; Teixeira, D.M.; de Gouveia Dal Pino, E.M. Precessing Jets and X-ray Bubbles from NGC 1275 (3C 84) in the Perseus Galaxy Cluster: A View from Three-dimensional Numerical Simulations. Astrophys. J. Lett. 2010, 713, L74–L78. [Google Scholar] [CrossRef]
- Tanada, K.; Kataoka, J.; Arimoto, M.; Akita, M.; Cheung, C.C.; Digel, S.W.; Fukazawa, Y. The Origins of the Gamma-Ray Flux Variations of NGC 1275 Based on Eight Years of Fermi-LAT Observations. Astrophys. J. 2018, 860, 74. [Google Scholar] [CrossRef] [Green Version]
- Asada, K.; Kameno, S.; Shen, Z.Q.; Horiuchi, S.; Gabuzda, D.C.; Inoue, M. The Expanding Radio Lobe of 3C 84 Revealed by VSOP Observations. Publ. Astron. Soc. Japan 2006, 58, 261–270. [Google Scholar] [CrossRef] [Green Version]
- Katz, J.I. A Precessing Disk in OJ 287? Astrophys. J. 1997, 478, 527–529. [Google Scholar] [CrossRef]
- Pringle, J.E. Self-induced warping of accretion discs: non-linear evolution and application to AGN. Mon. Not. R. Astron. Soc. 1997, 292, 136–147. [Google Scholar] [CrossRef] [Green Version]
- Minkowski, R. Optical Investigations of Radio Sources (Introductory Lecture); van de Hulst, H.C., Ed.; Radio astronomy; Cambridge University Press: Cambridge, UK, 1957; Volume 4, p. 107. [Google Scholar]
- Kent, S.M.; Sargent, W.L.W. Ionization and excitation mechanisms in the filaments around NGC 1275. Astrophys. J. 1979, 230, 667–680. [Google Scholar] [CrossRef]
- Donahue, M.; Trauger, J. STScI-2003-14. 2003. [Google Scholar]
- Liu, F.K.; Chen, X. Evolution of Supermassive Black Hole Binaries and Acceleration of Jet Precession in Galactic Nuclei. Astrophys. J. 2007, 671, 1272–1283. [Google Scholar] [CrossRef] [Green Version]
- Dutson, K.L.; Edge, A.C.; Hinton, J.A.; Hogan, M.T.; Gurwell, M.A.; Alston, W.N. A non-thermal study of the brightest cluster galaxy NGC 1275—the Gamma-Radio connection over four decades. Mon. Not. R. Astron. Soc. 2014, 442, 2048–2057. [Google Scholar] [CrossRef]
- Marscher, A.P.; Gear, W.K. Models for high-frequency radio outbursts in extragalactic sources, with application to the early 1983 millimeter-to-infrared flare of 3C 273. Astrophys. J. 1985, 298, 114–127. [Google Scholar] [CrossRef]
- Fuhrmann, L.; Larsson, S.; Chiang, J.; Angelakis, E.; Zensus, J.A.; Nestoras, I.; Krichbaum, T.Â.P.; Ungerechts, H.; Sievers, A.; Pavlidou, V.; et al. Detection of significant cm to sub-mm band radio and γ-ray correlated variability in Fermi bright blazars. Mon. Not. R. Astron. Soc. 2014, 441, 1899–1909. [Google Scholar] [CrossRef] [Green Version]
- Ramakrishnan, V.; Hovatta, T.; Nieppola, E.; Tornikoski, M.; Lähteenmäki, A.; Valtaoja, E. Locating the γ-ray emission site in Fermi/LAT blazars from correlation analysis between 37 GHz radio and γ-ray light curves. Mon. Not. R. Astron. Soc. 2015, 452, 1280–1294. [Google Scholar] [CrossRef]
- Max-Moerbeck, W.; Hovatta, T.; Richards, J.L.; King, O.G.; Pearson, T.J.; Readhead, A.C.S.; Reeves, R.; Shepherd, M.C.; Stevenson, M.A.; Angelakis, E.; et al. Time correlation between the radio and gamma-ray activity in blazars and the production site of the gamma-ray emission. Mon. Not. R. Astron. Soc. 2014, 445, 428–436. [Google Scholar] [CrossRef] [Green Version]
- Abdo, A.A.; Ackermann, M.; Ajello, M.; Asano, K.; Baldini, L.; Ballet, J.; Barbiellini, G.; Bastieri, D.; Baughman, B.M.; Bechtol, K.; et al. Fermi Discovery of Gamma-ray Emission from NGC 1275. Astrophys. J. 2009, 699, 31–39. [Google Scholar] [CrossRef]
- Fukazawa, Y.; Shiki, K.; Tanaka, Y.; Itoh, R.; Takahashi, H.; Imazato, F.; D’Ammando, F.; Ojha, R.; Nagai, H. X-Ray and GeV Gamma-Ray Variability of the Radio Galaxy NGC 1275. Astrophys. J. 2018, 855, 93. [Google Scholar] [CrossRef]
- Aleksić, J.; Ansoldi, S.; Antonelli, L.A.; Antoranz, P.; Babic, A.; Bangale, P.; Barres de Almeida, U.; Barrio, J.A.; Becerra González, J.; Bednarek, W.; et al. Contemporaneous observations of the radio galaxy NGC 1275 from radio to very high energy γ-rays. Astron. Astrophys. 2014, 564, A5. [Google Scholar] [CrossRef]
- Benbow, W.; VERITAS Collaboration. Highlights from the VERITAS AGN Observation Program. In Proceedings of the 34th International Cosmic Ray Conference (ICRC2015), The Hague, The Netherlands, 30 July–6 August 2015; Volume 34, p. 821. [Google Scholar]
- Ahnen, M.L.; Ansoldi, S.; Antonelli, L.A.; Antoranz, P.; Babic, A.; Banerjee, B.; Bangale, P.; Barres de Almeida, U.; Barrio, J.A.; Becerra González, J.; et al. Deep observation of the NGC 1275 region with MAGIC: search of diffuse γ-ray emission from cosmic rays in the Perseus cluster. Astron. Astrophys. 2016, 589, A33. [Google Scholar] [CrossRef]
- Acciari, V.A.; Ansoldi, S.; Antonelli, L.A.; Arbet Engels, A.; Arcaro, C.; Baack, D.; Babić, A.; Banerjee, B.; Bangale, P.; Barres de Almeida, U.; et al. Constraining dark matter lifetime with a deep gamma-ray survey of the Perseus galaxy cluster with MAGIC. Phys. Dark Univ. 2018, 22, 38–47. [Google Scholar] [CrossRef] [Green Version]
- Sanders, J.S.; Fabian, A.C. Hard X-ray emission from the core of the Perseus cluster and the thermal content of the radio bubbles. In Heating Versus Cooling in Galaxies and Clusters of Galaxies; Böhringer, H., Pratt, G.W., Finoguenov, A., Schuecker, P., Eds.; Springer: Berlin/Heidelberg, Germany, 2007; p. 74. [Google Scholar] [CrossRef]
- Dosopoulou, F.; Antonini, F. Dynamical Friction and the Evolution of Supermassive Black Hole Binaries: The Final Hundred-parsec Problem. Astrophys. J. 2017, 840, 31. [Google Scholar] [CrossRef] [Green Version]
- Lu, J.F. α-Disks and the precession of extragalactic jets. Acta Astrophys. Sin. 1992, 12, 9. [Google Scholar] [CrossRef]
- Blandford, R.D.; Znajek, R.L. Electromagnetic extraction of energy from Kerr black holes. Mon. Not. R. Astron. Soc. 1977, 179, 433–456. [Google Scholar] [CrossRef]
- Blandford, R.D.; Payne, D.G. Hydromagnetic flows from accretion disks and the production of radio jets. Mon. Not. R. Astron. Soc. 1982, 199, 883–903. [Google Scholar] [CrossRef]
- Naab, T.; Ostriker, J.P. Theoretical Challenges in Galaxy Formation. Annu. Rev. Astron. Astrophys. 2017, 55, 59–109. [Google Scholar] [CrossRef]
- Begelman, M.C.; Blandford, R.D.; Rees, M.J. Massive black hole binaries in active galactic nuclei. Nature 1980, 287, 307–309. [Google Scholar] [CrossRef]
- Merritt, D.; Milosavljević, M. Massive Black Hole Binary Evolution. Liv. Rev. Relat. 2005, 8, 8. [Google Scholar] [CrossRef]
- Komossa, S.; Burwitz, V.; Hasinger, G.; Predehl, P.; Kaastra, J.S.; Ikebe, Y. Discovery of a Binary Active Galactic Nucleus in the Ultraluminous Infrared Galaxy NGC 6240 Using Chandra. Astrophys. J. Lett. 2003, 582, L15–L19. [Google Scholar] [CrossRef]
- Kun, E.; Gabányi, K.É.; Karouzos, M.; Britzen, S.; Gergely, L.Á. A spinning supermassive black hole binary model consistent with VLBI observations of the S5 1928+738 jet. Mon. Not. R. Astron. Soc. 2014, 445, 1370–1382. [Google Scholar] [CrossRef]
- Qian, S.J.; Kudryavtseva, N.A.; Britzen, S.; Krichbaum, T.P.; Gao, L.; Witzel, A.; Zensus, J.A.; Aller, M.F.; Aller, H.D.; Zhang, X.Z. A Possible Periodicity in the Radio Light Curves of 3C 454.3. Chin. J. Astron. Astrophys. 2007, 7, 364–374. [Google Scholar] [CrossRef] [Green Version]
- Caproni, A.; Abraham, Z.; Motter, J.C.; Monteiro, H. Jet Precession Driven by a Supermassive Black Hole Binary System in the BL Lac Object PG 1553+113. Astrophys. J. Lett. 2017, 851, L39. [Google Scholar] [CrossRef] [Green Version]
- Treister, E.; Schawinski, K.; Urry, C.M.; Simmons, B.D. Major Galaxy Mergers Only Trigger the Most Luminous Active Galactic Nuclei. Astrophys. J. Lett. 2012, 758, L39. [Google Scholar] [CrossRef]
- Ramos Almeida, C.; Tadhunter, C.N.; Inskip, K.J.; Morganti, R.; Holt, J.; Dicken, D. The optical morphologies of the 2 Jy sample of radio galaxies: evidence for galaxy interactions. Mon. Not. R. Astron. Soc. 2011, 410, 1550–1576. [Google Scholar] [CrossRef]
- Chiaberge, M.; Gilli, R.; Lotz, J.M.; Norman, C. Radio Loud AGNs are Mergers. Astrophys. J. 2015, 806, 147. [Google Scholar] [CrossRef]
- Richards, J.L.; Max-Moerbeck, W.; Pavlidou, V.; King, O.G.; Pearson, T.J.; Readhead, A.C.S.; Reeves, R.; Shepherd, M.C.; Stevenson, M.A.; Weintraub, L.C.; et al. Blazars in the Fermi Era: The OVRO 40 m Telescope Monitoring Program. Astrophys. J. Suppl. 2011, 194, 29. [Google Scholar] [CrossRef]
- Lister, M.L.; Aller, M.F.; Aller, H.D.; Hodge, M.A.; Homan, D.C.; Kovalev, Y.Y.; Pushkarev, A.B.; Savolainen, T. MOJAVE. XV. VLBA 15 GHz Total Intensity and Polarization Maps of 437 Parsec-scale AGN Jets from 1996 to 2017. Astrophys. J. Suppl. 2018, 234, 12. [Google Scholar] [CrossRef]
| 1. | |
| 2. | |
| 3. | available from the Fermi-LAT data server at https://fermi.gsfc.nasa.gov/ssc/data/access/. |
| 4. |
Figure 1.
Two maps of 3C84 observed at 6 cm wavelength and taken from [11]. The map on the left shows the source structure in 1973.0 and the map on the right in 1974.1.
Figure 1.
Two maps of 3C84 observed at 6 cm wavelength and taken from [11]. The map on the left shows the source structure in 1973.0 and the map on the right in 1974.1.

Figure 2.
(a) A map of 3C 84 with the Gaussian components superimposed showing the structure in 15 GHz VLBA observations (January 2000). (b) a map of the central region of 3C 84 with the Gaussian components superimposed ((January 2000). (c) 17 yr later the same central region is not one chain of components any more but the overall structure is broader as the morphology has evolved (April 2017).

Figure 3.
All the jet component positions of all the re-analyzed epochs are shown. We mark with a box (cyan) those components that belong to the upper lobe. The box in red marks the components that belong to the central region (zoom-in in Figure 4). The blue box marks the region with the lower lobe structure components.

Figure 4.
Jet components within the central region of 3C 84 between 1999.99 and 2017.65 (those within the red box in Figure 3.
Figure 4.
Jet components within the central region of 3C 84 between 1999.99 and 2017.65 (those within the red box in Figure 3.
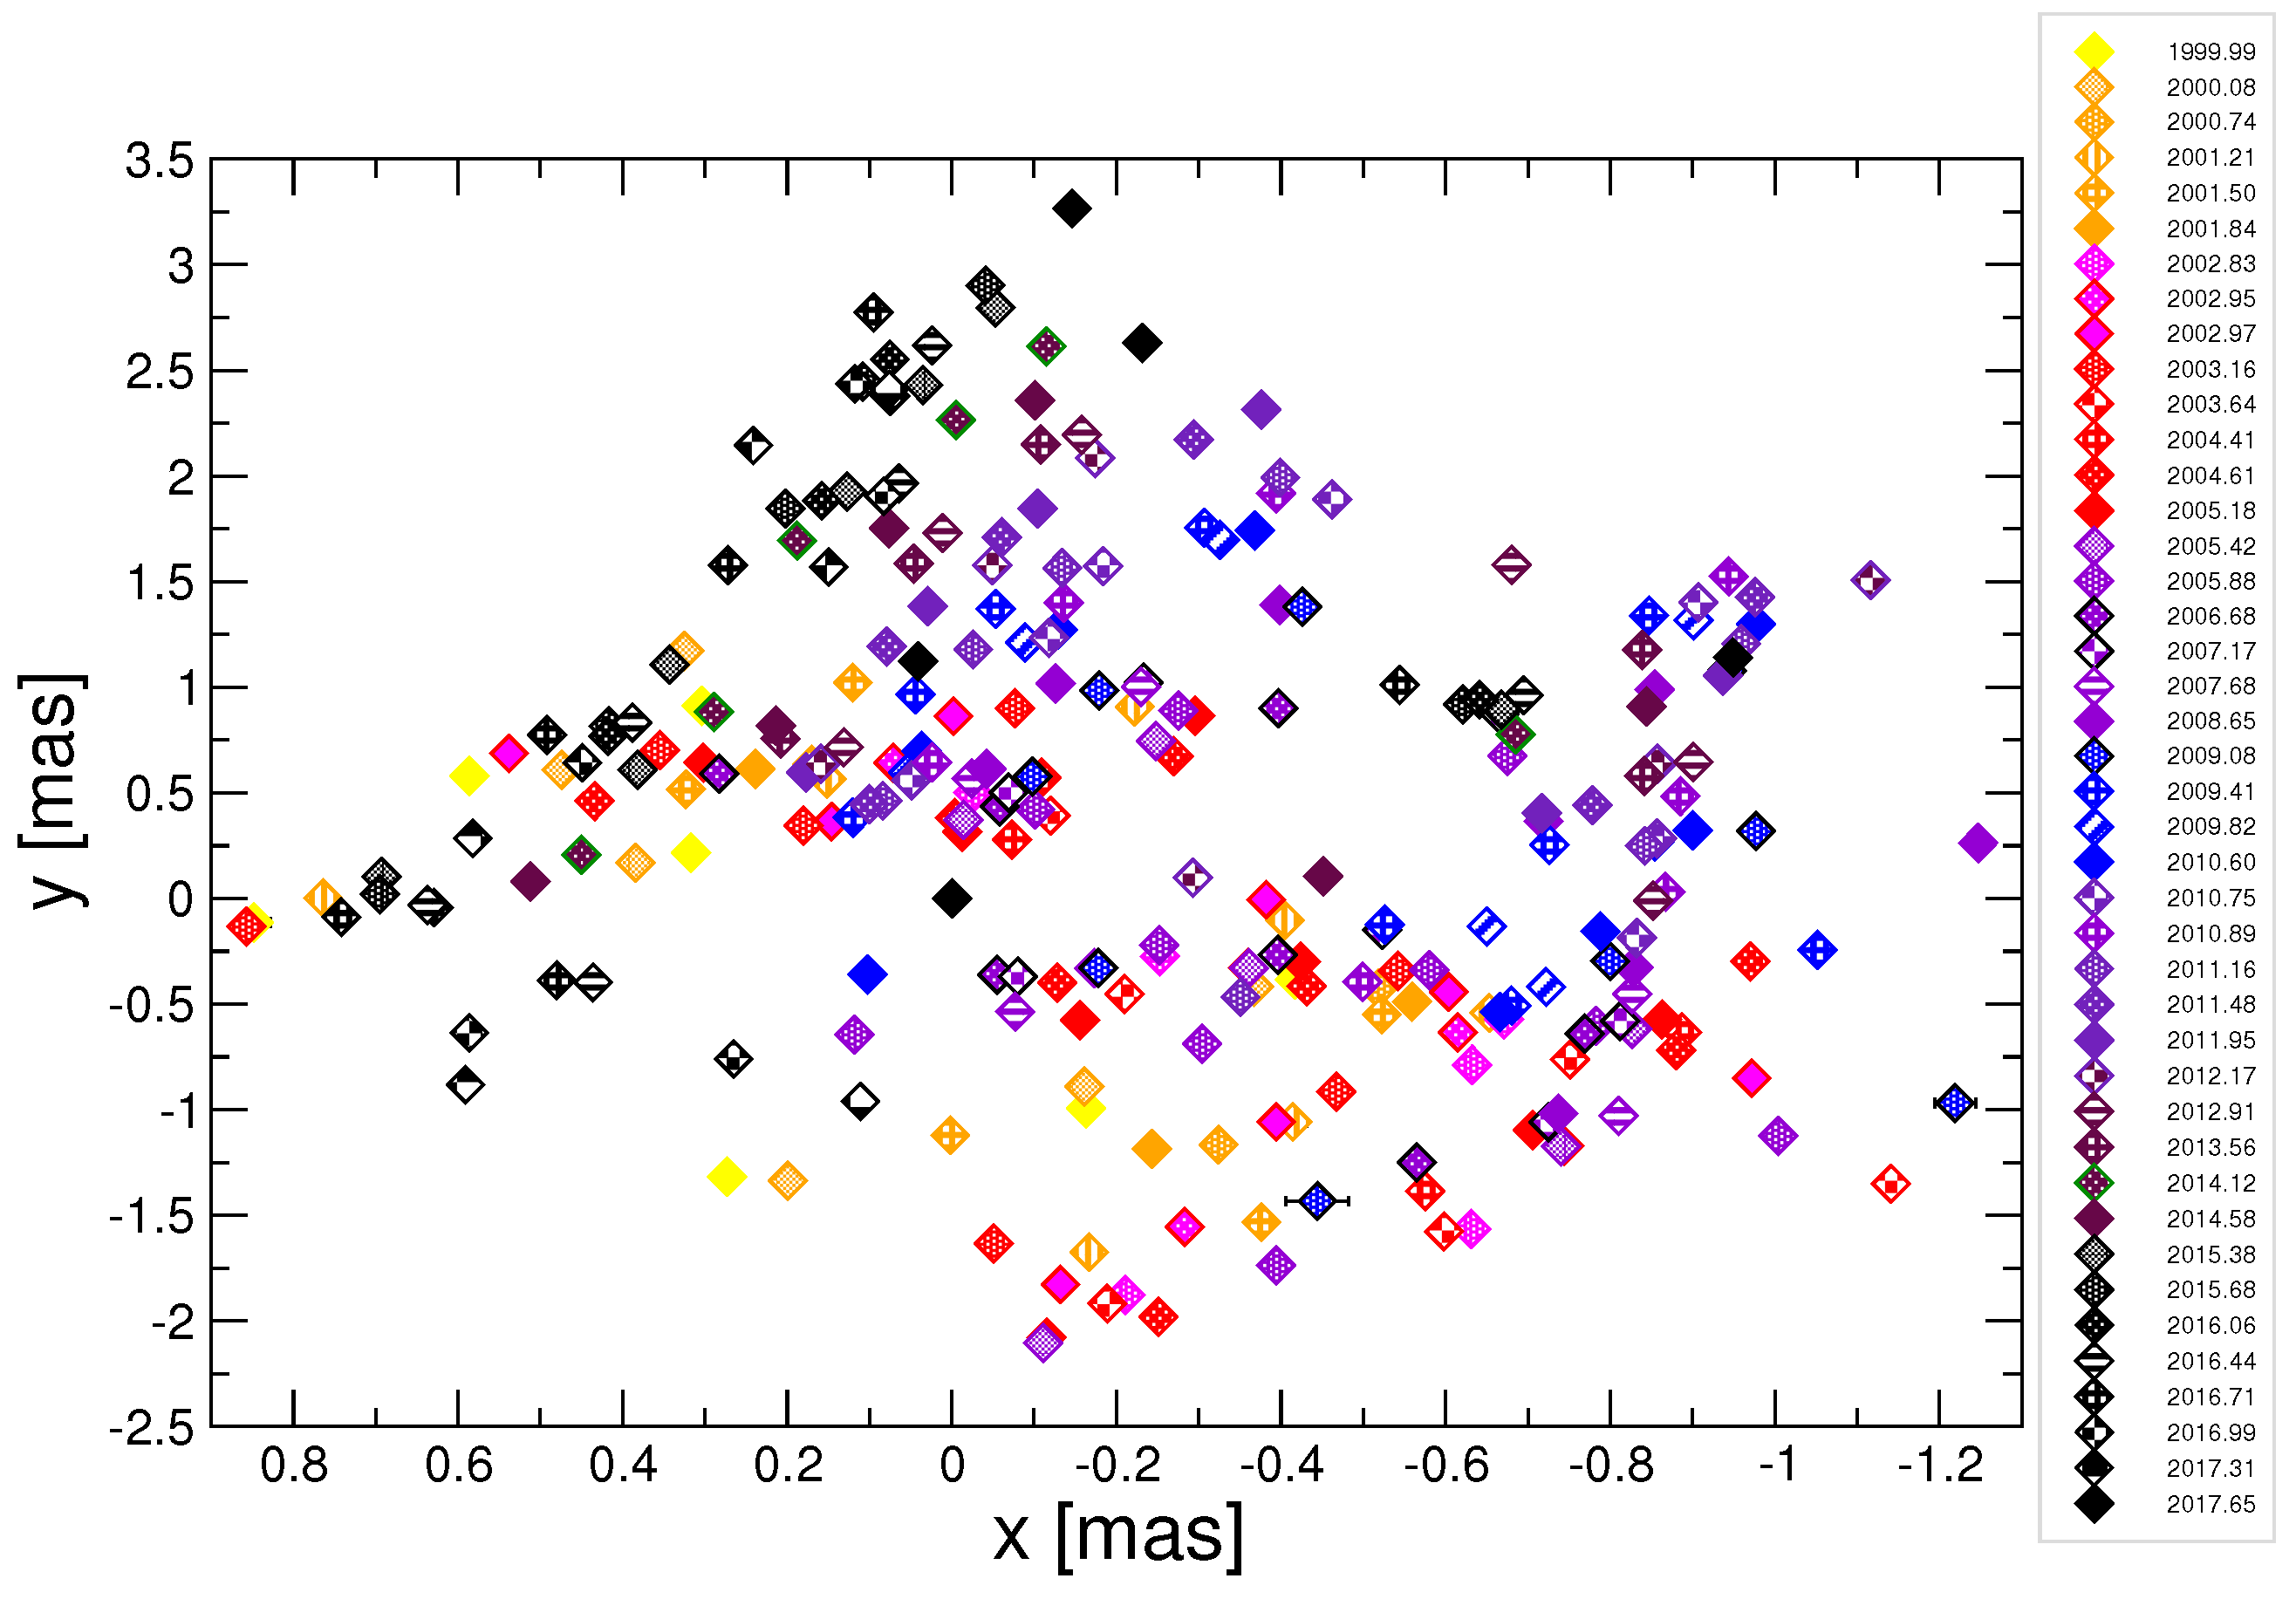
Figure 5.
(a) Average values for the data in yearly intervals shown in Figure 4. To indicate the amount of source structure that moved, we show the uncertainties as well. The green arrows indicate the direction of the precessing motion. (b) The same relation as in (a) but averaged over two years in time. (c) Flux-density weighted average values in yearly intervals and averaged in two years in (d). The TeV flare observed by the MAGIC collaboration [30] occurs at the time of the projected reversal of the precessing motion—between the last two data points (dark blue and black).

Figure 6.
A zoom into the cyan box from Figure 3. An arrow is superimposed which indicates the general trend of motion (from grey to yellow). Again, there is some hint for the most recent data points to move “backwards” (indicated by the small orange arrow).
Figure 6.
A zoom into the cyan box from Figure 3. An arrow is superimposed which indicates the general trend of motion (from grey to yellow). Again, there is some hint for the most recent data points to move “backwards” (indicated by the small orange arrow).

Figure 7.
The flux-densities of the upper lobe, lower lobe, central region, and the reference component. The flux density of the central region is the brightest part of 3C 84.
Figure 7.
The flux-densities of the upper lobe, lower lobe, central region, and the reference component. The flux density of the central region is the brightest part of 3C 84.

Figure 8.
The jet precession model with the initial parameter bounds according to X-ray data, see also Table 1. (a) The model with two unequal flux-density peaks and the longer precession period of ∼88 years. (b) The model with two equal flux-density peaks and the shorter precession period of ∼41 years. The goodness of fit is nearly identical for the two models.
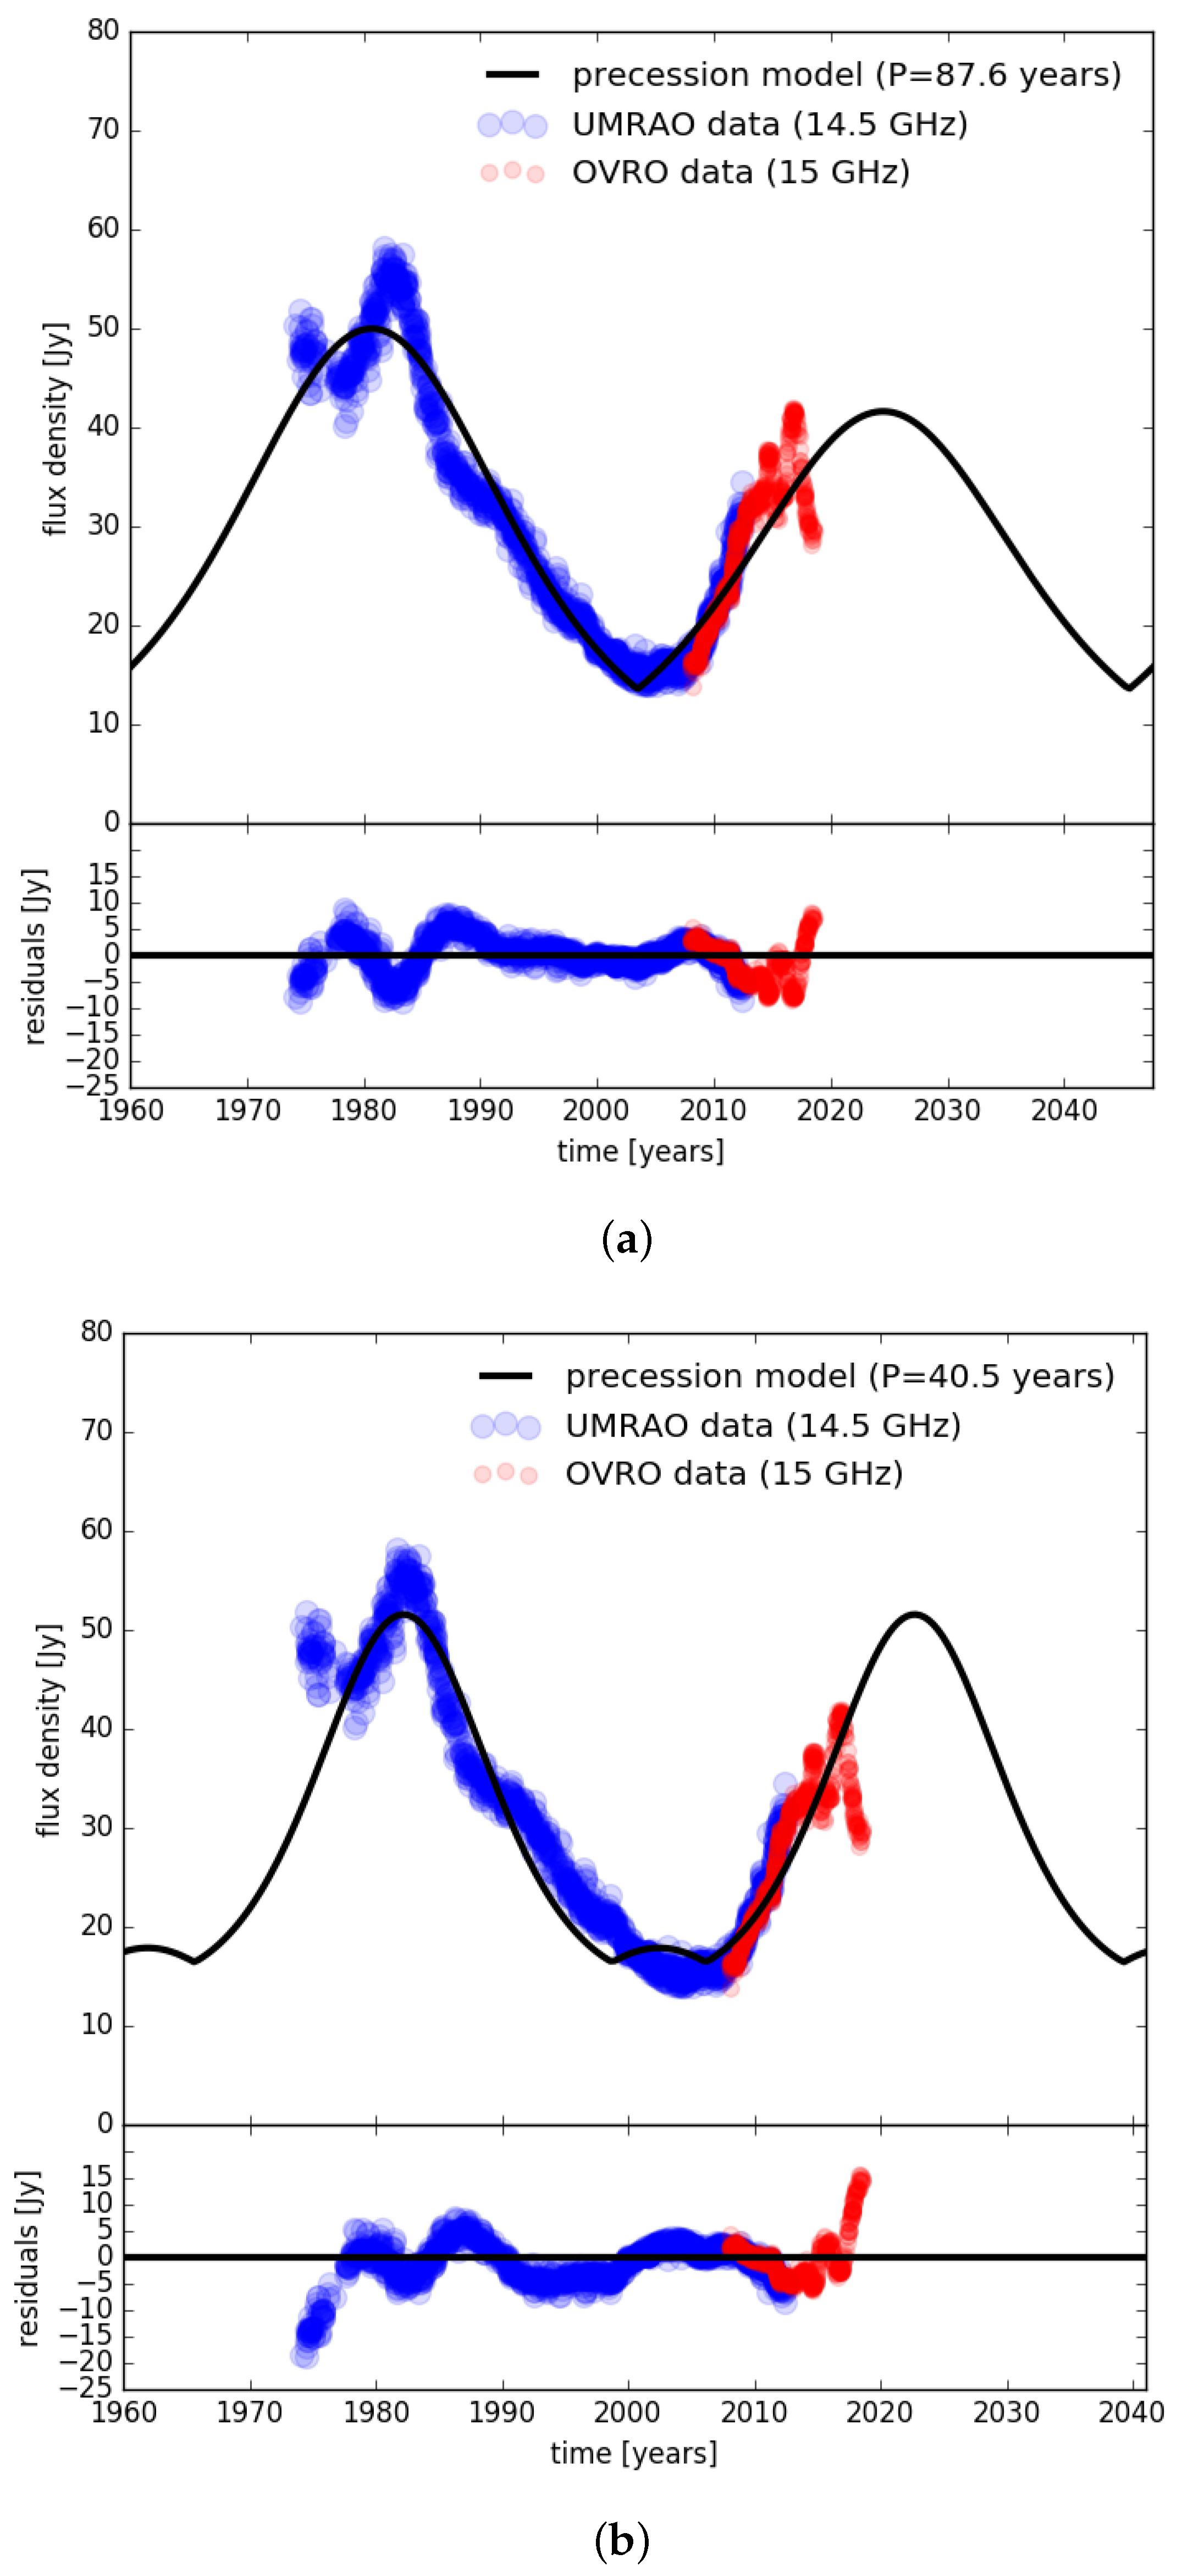
Figure 9.
(a) Temporal evolution of the jet viewing angle based on three precession models labelled according to different precession periods of 41, 88, and 101 years. The dotted horizontal line stands for the viewing angle inferred by Lister et al. [46] from the MOJAVE survey (2002–2007). (b) Temporal evolution of the apparent velocity which remains below 0.4c (for the precession model with 41 yr). (c) Temporal evolution of the Doppler factor which is less than 1.5 for all the precession models.

Figure 10.
(a) OVRO monitoring data (green) and gamma-ray data from the Fermi satellite (violet). The red vertical line marks the time of the TeV flare [30]. (b) Superposition of the OVRO and Fermi data (mean-subtracted and time-shifted). (c) Significance analysis of the DCF results. The blue shaded region corresponds to a range of the possible DCF-peaks that occur due to a chance at 3 level. It was obtained using realizations of the noise-like light curves according to [49]. Black points and error bars shows the obtained DCF. (d) Distribution of the Cross-Correlation Function (CCF) peaks obtained using realizations of the Gaussian Processes fitted to the radio and gamma data. (e) Mean DCF and corresponding simultaneous 68%-confidence band obtained using realizations of the Gaussian processes fitted to the original radio and gamma data sets. Red lines describe the procedure used to obtain the uncertainty of the DCF maximum. (c–e) show the results of a correlation analysis (based on the DCF-routine by [48]). (f,g) show the realizations of the fitted Gaussian Processes obtained from the posterior distribution of the hyperparameters for radio (f) and gamma (g) light-curves.
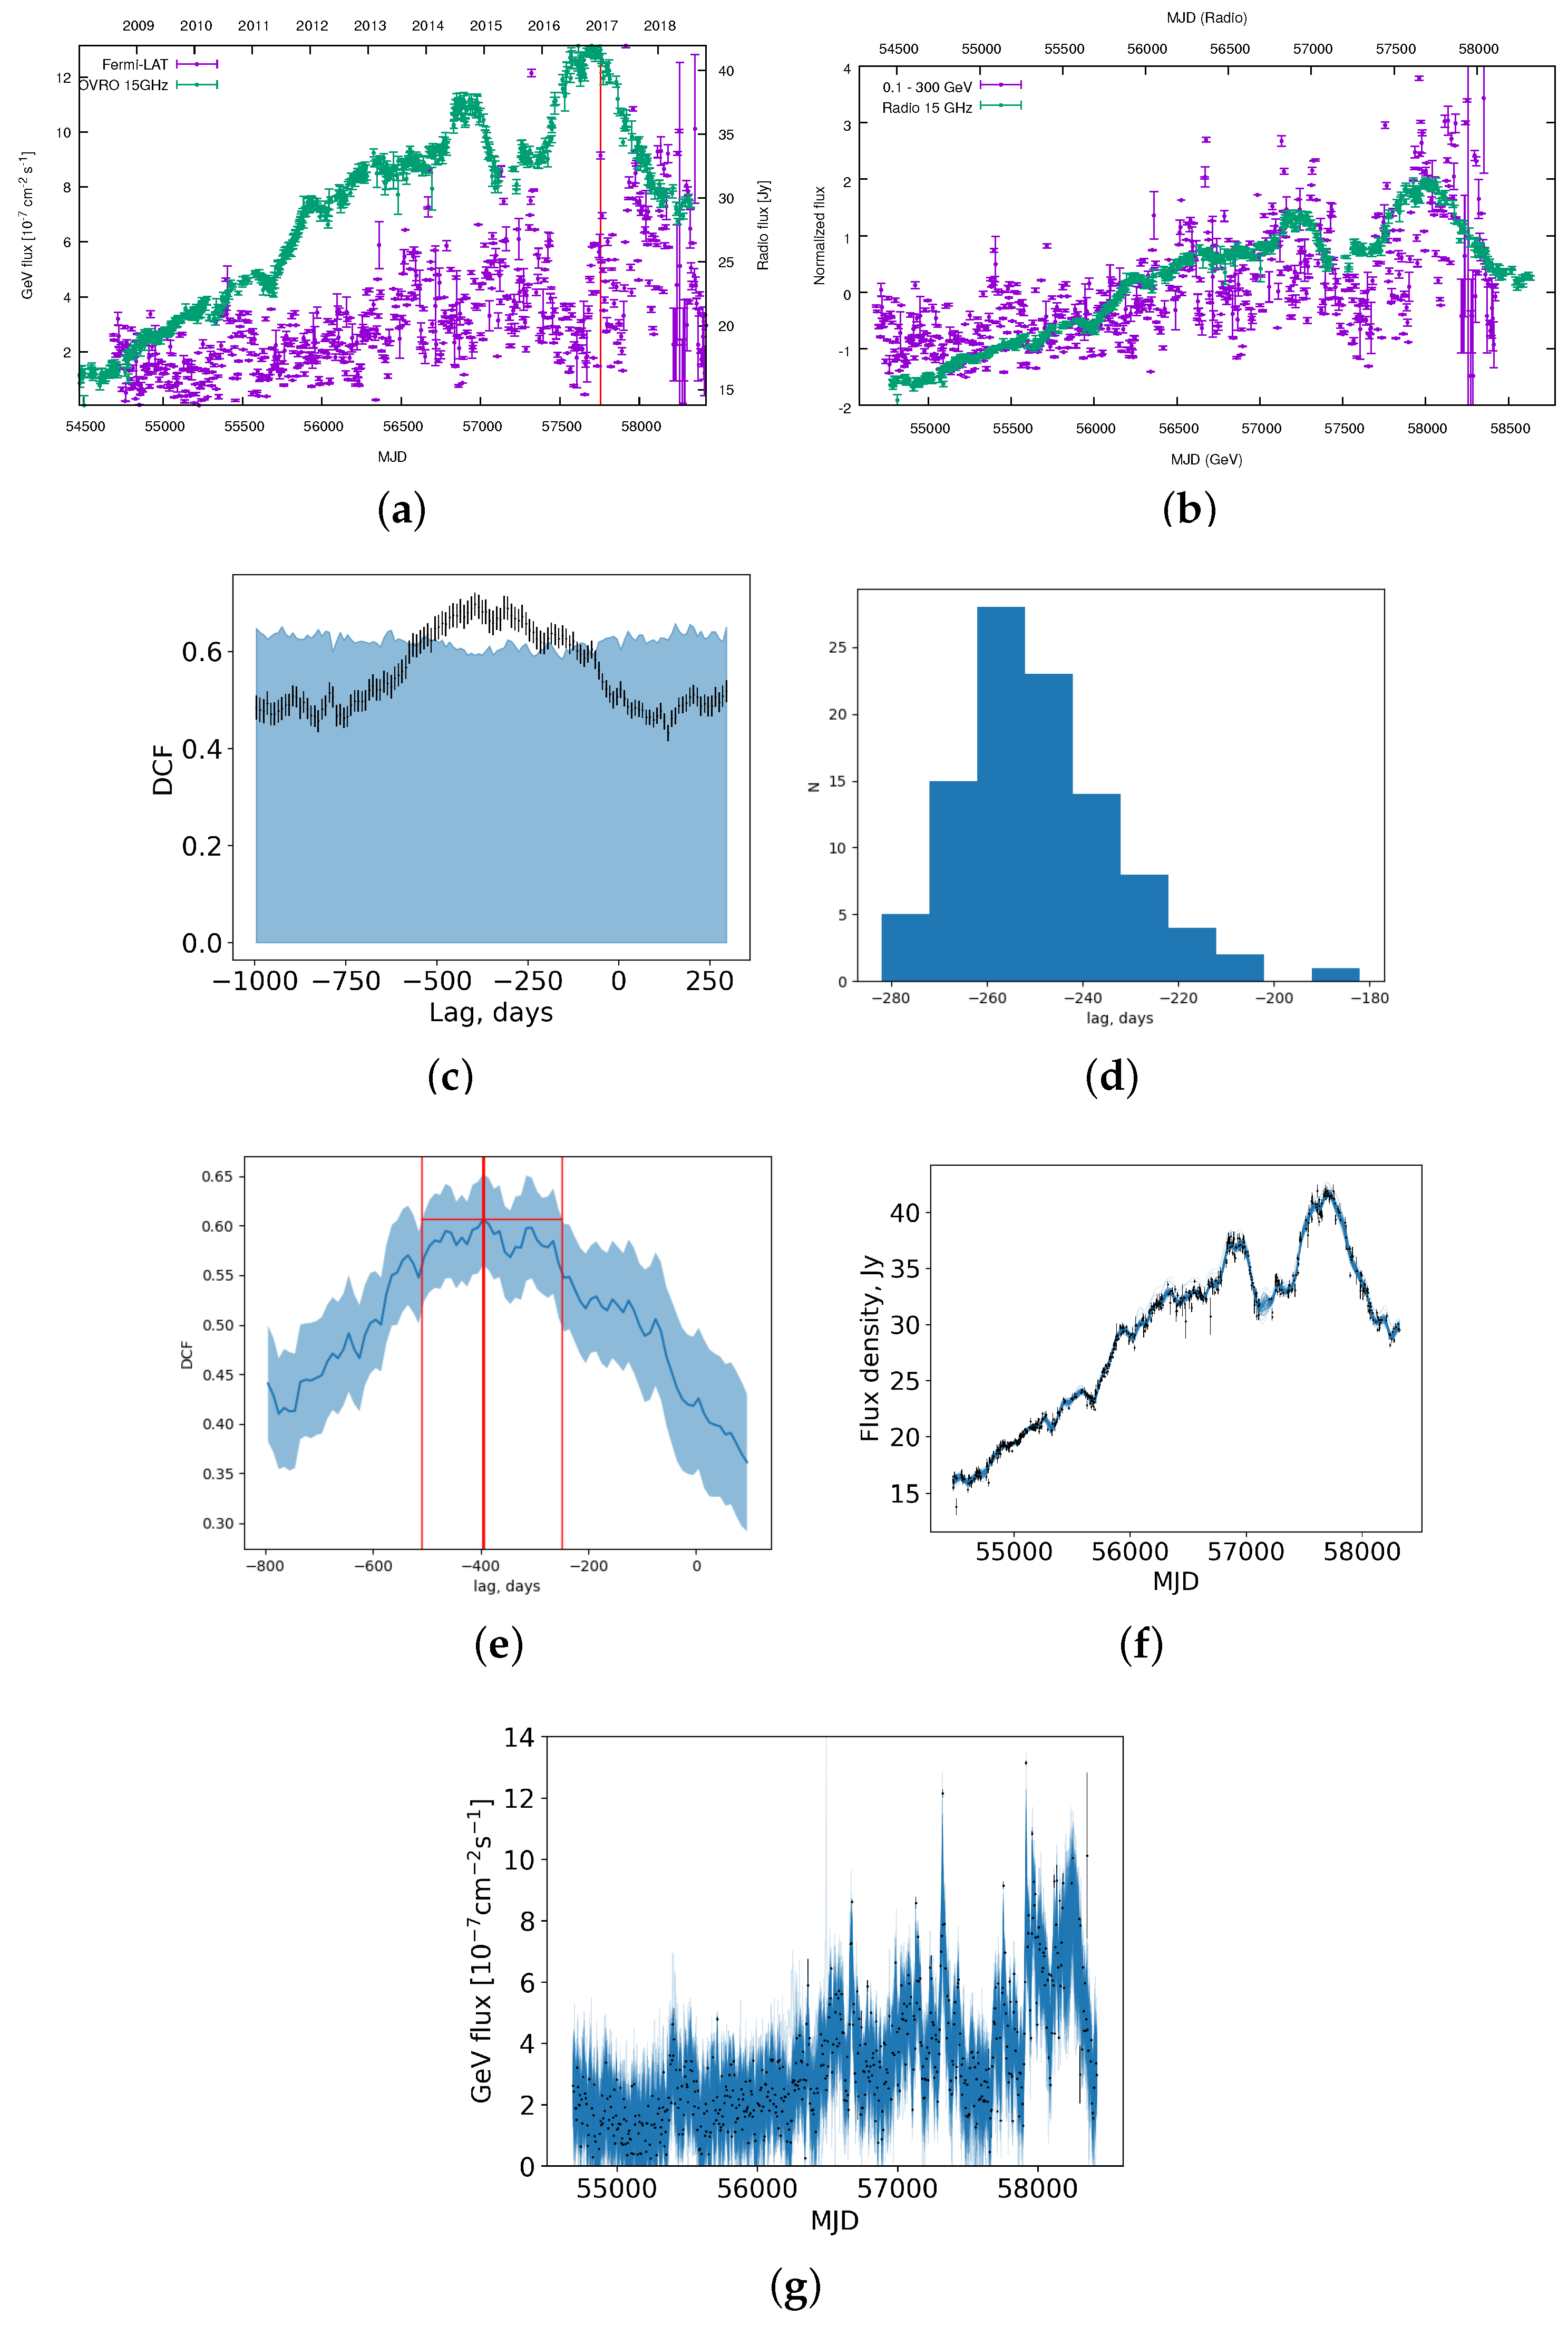
Figure 11.
The normalized Doppler-beaming factor as a function of the precession phase for three different precession solutions indicated in the key according to the precession period (see Table 1 and Table 2 for details).


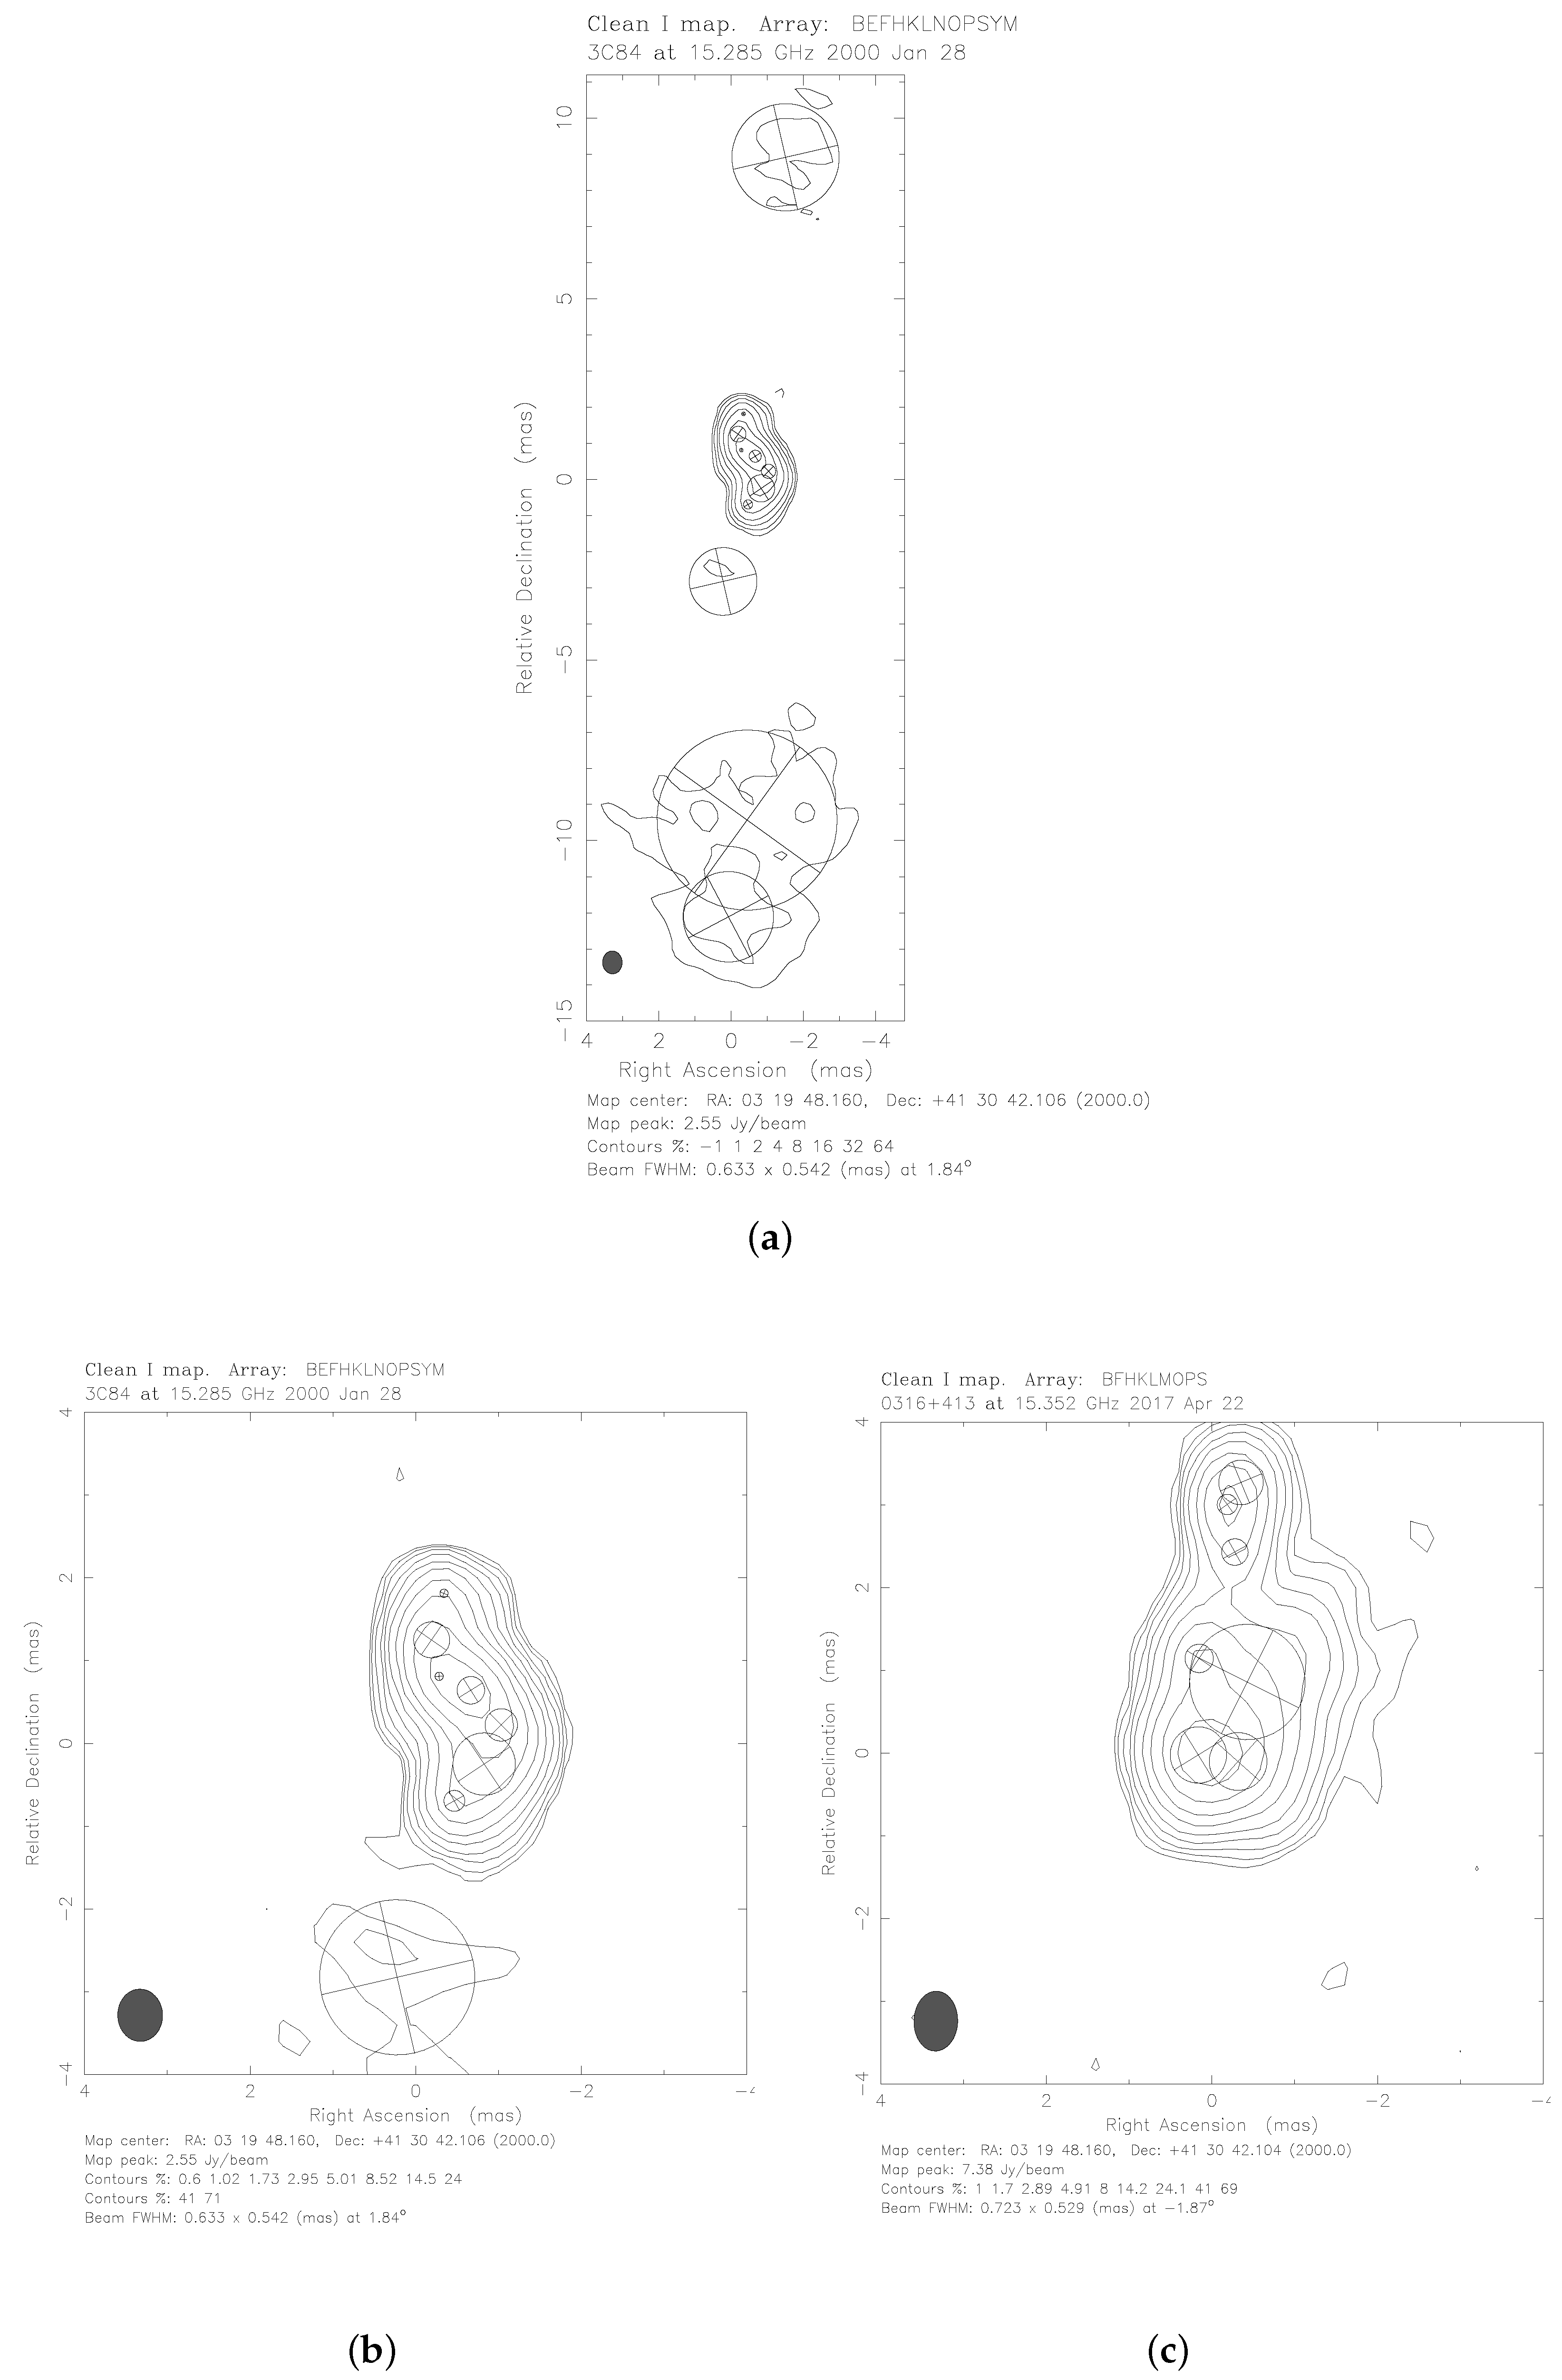
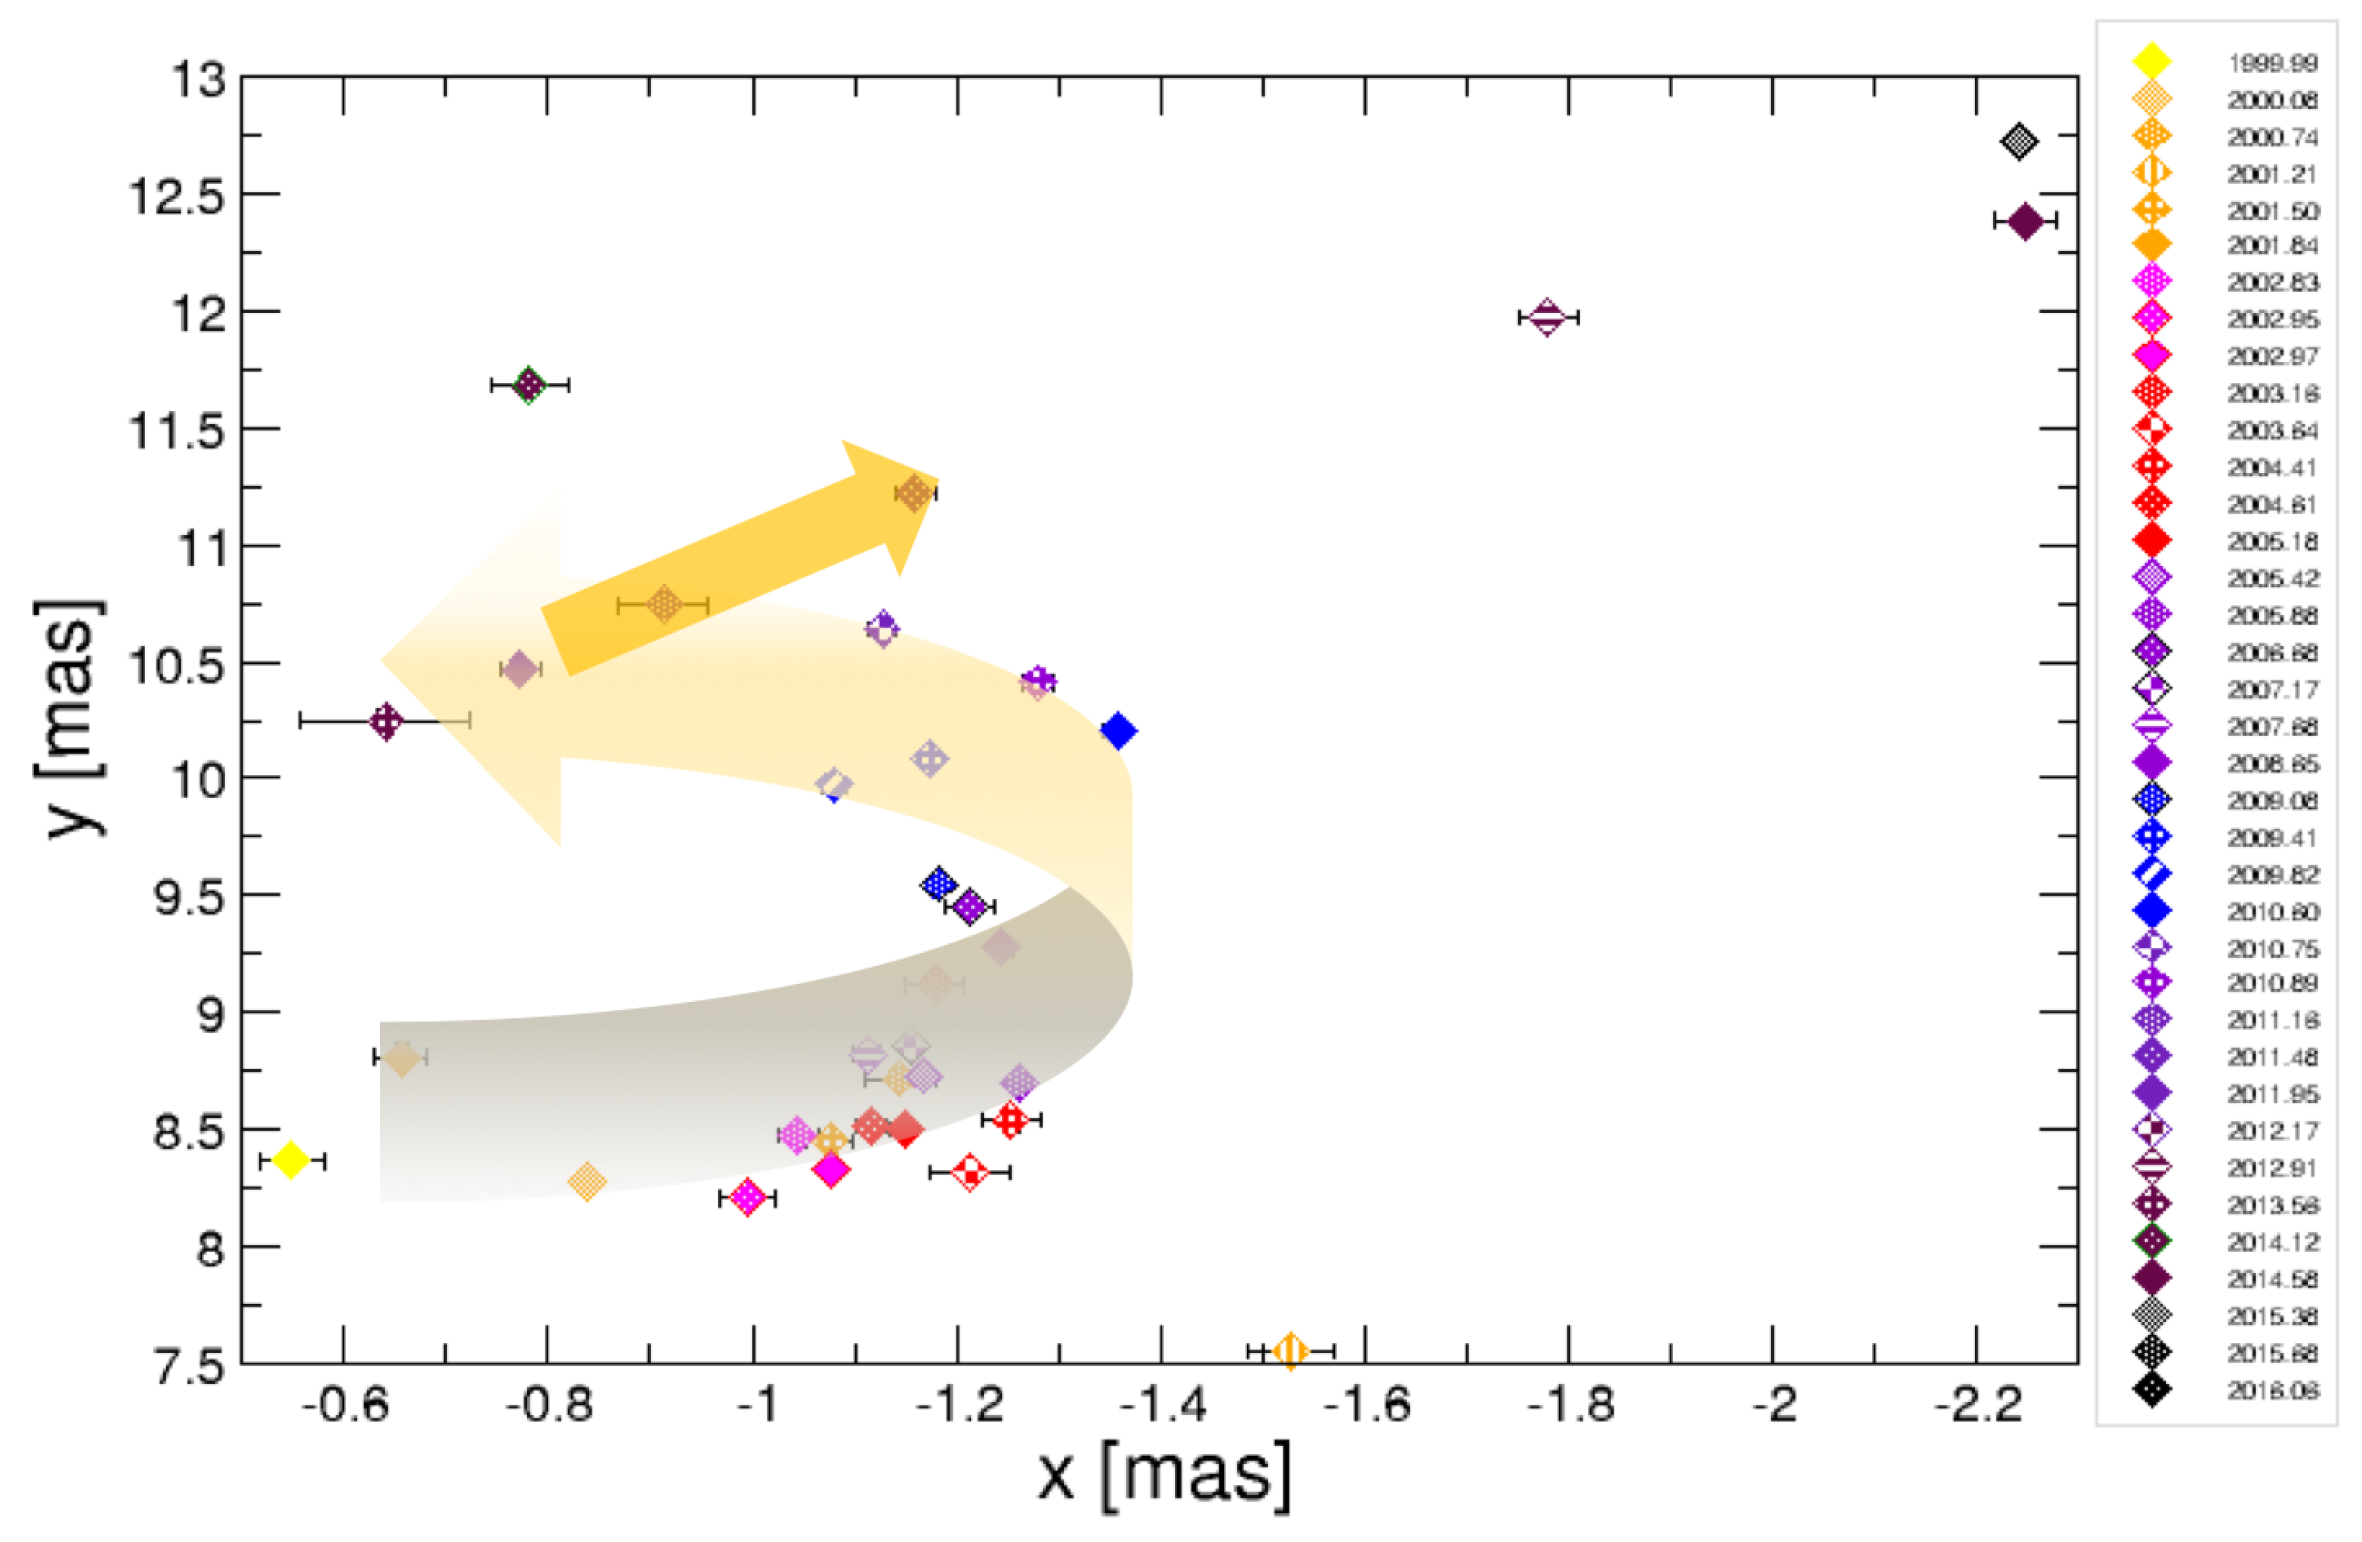
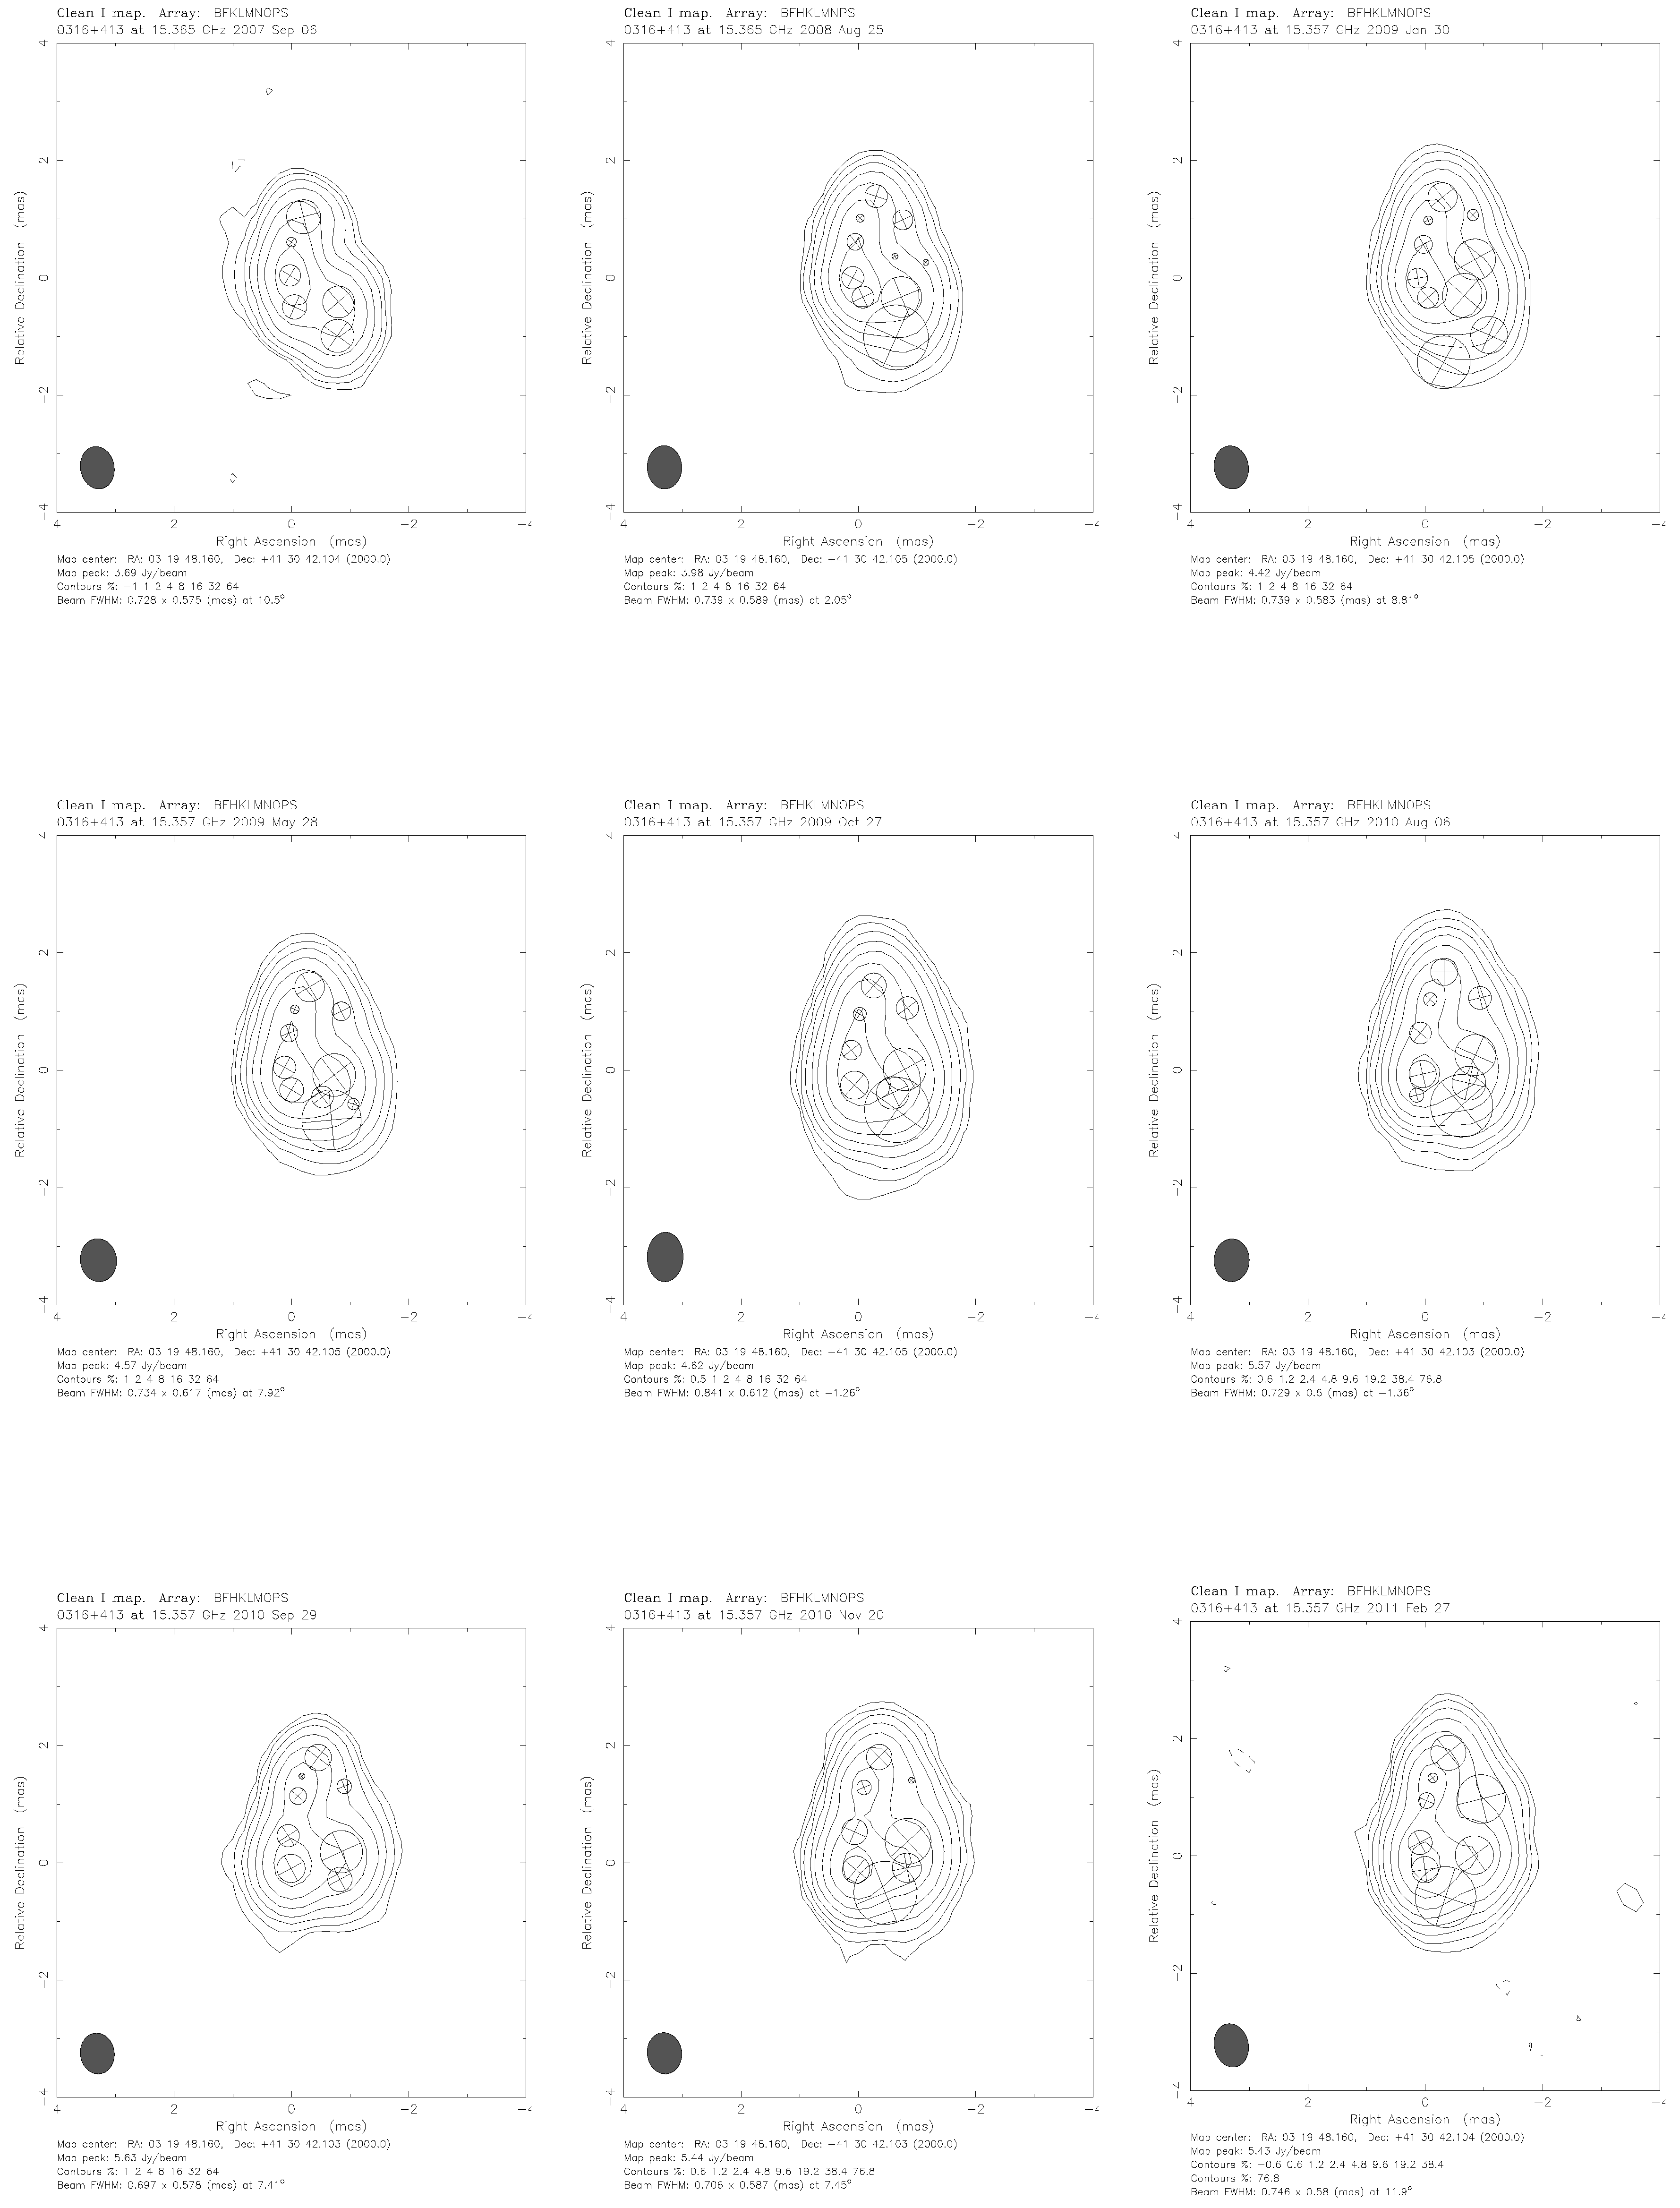
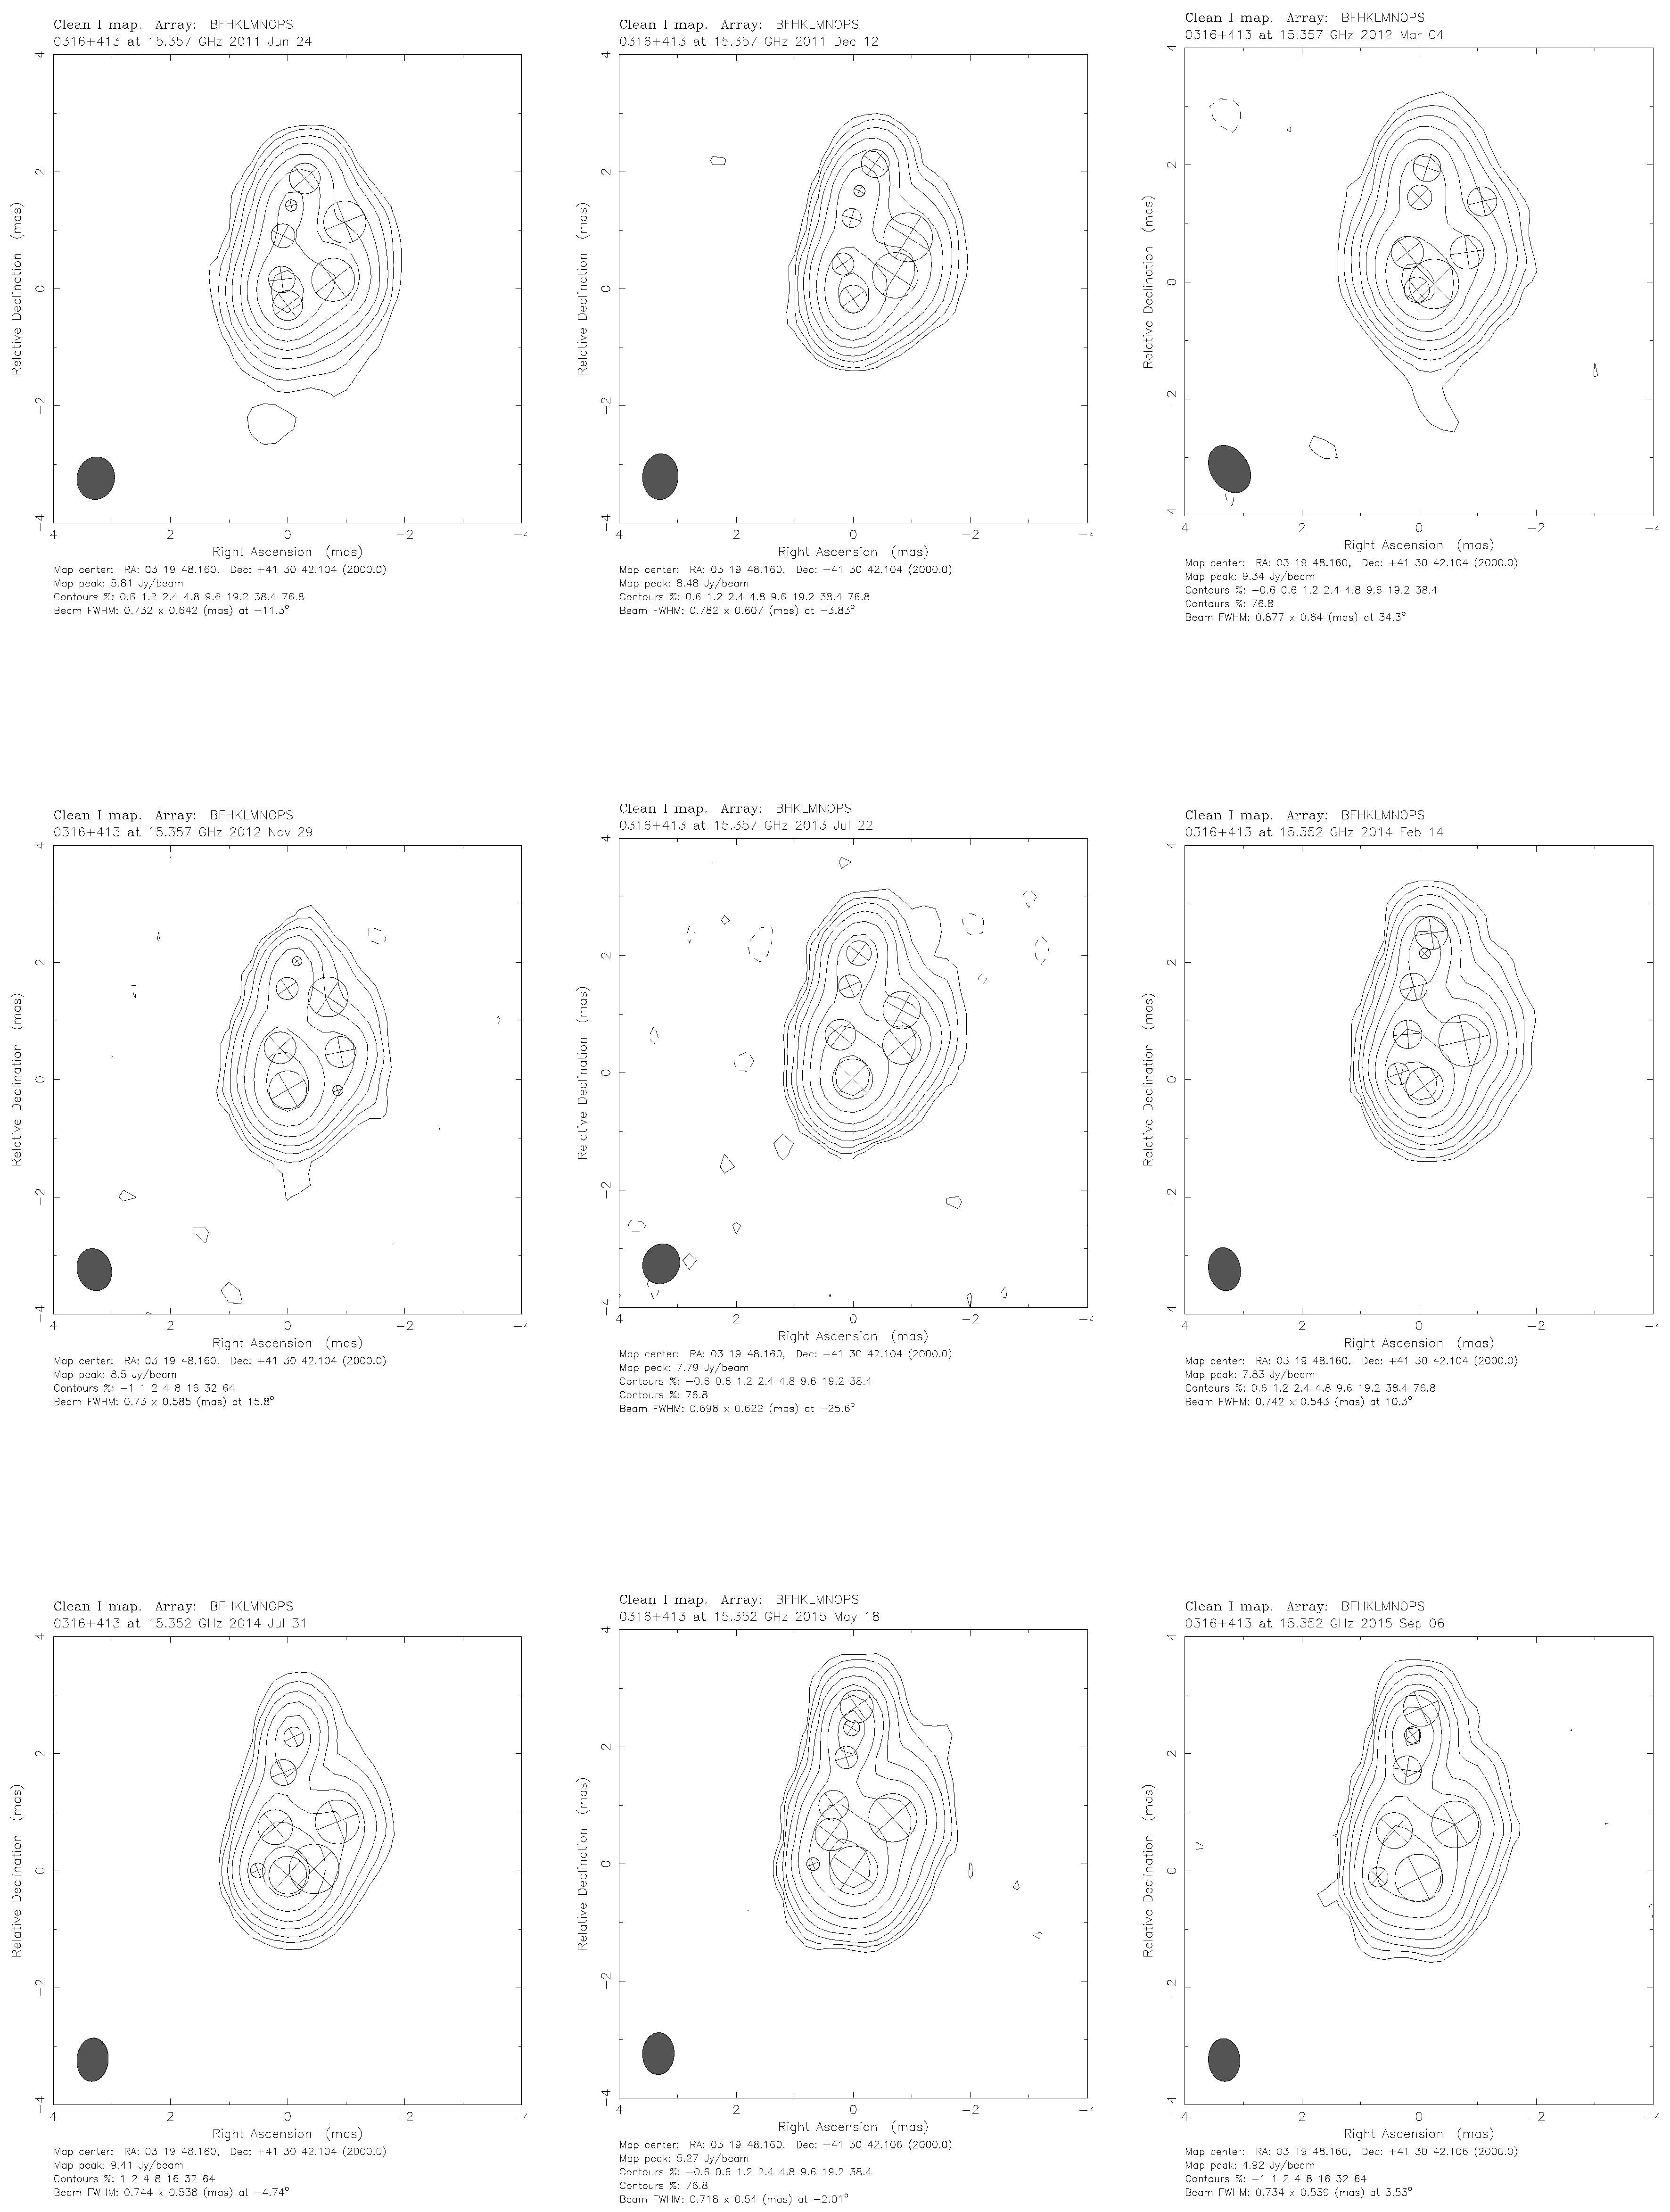
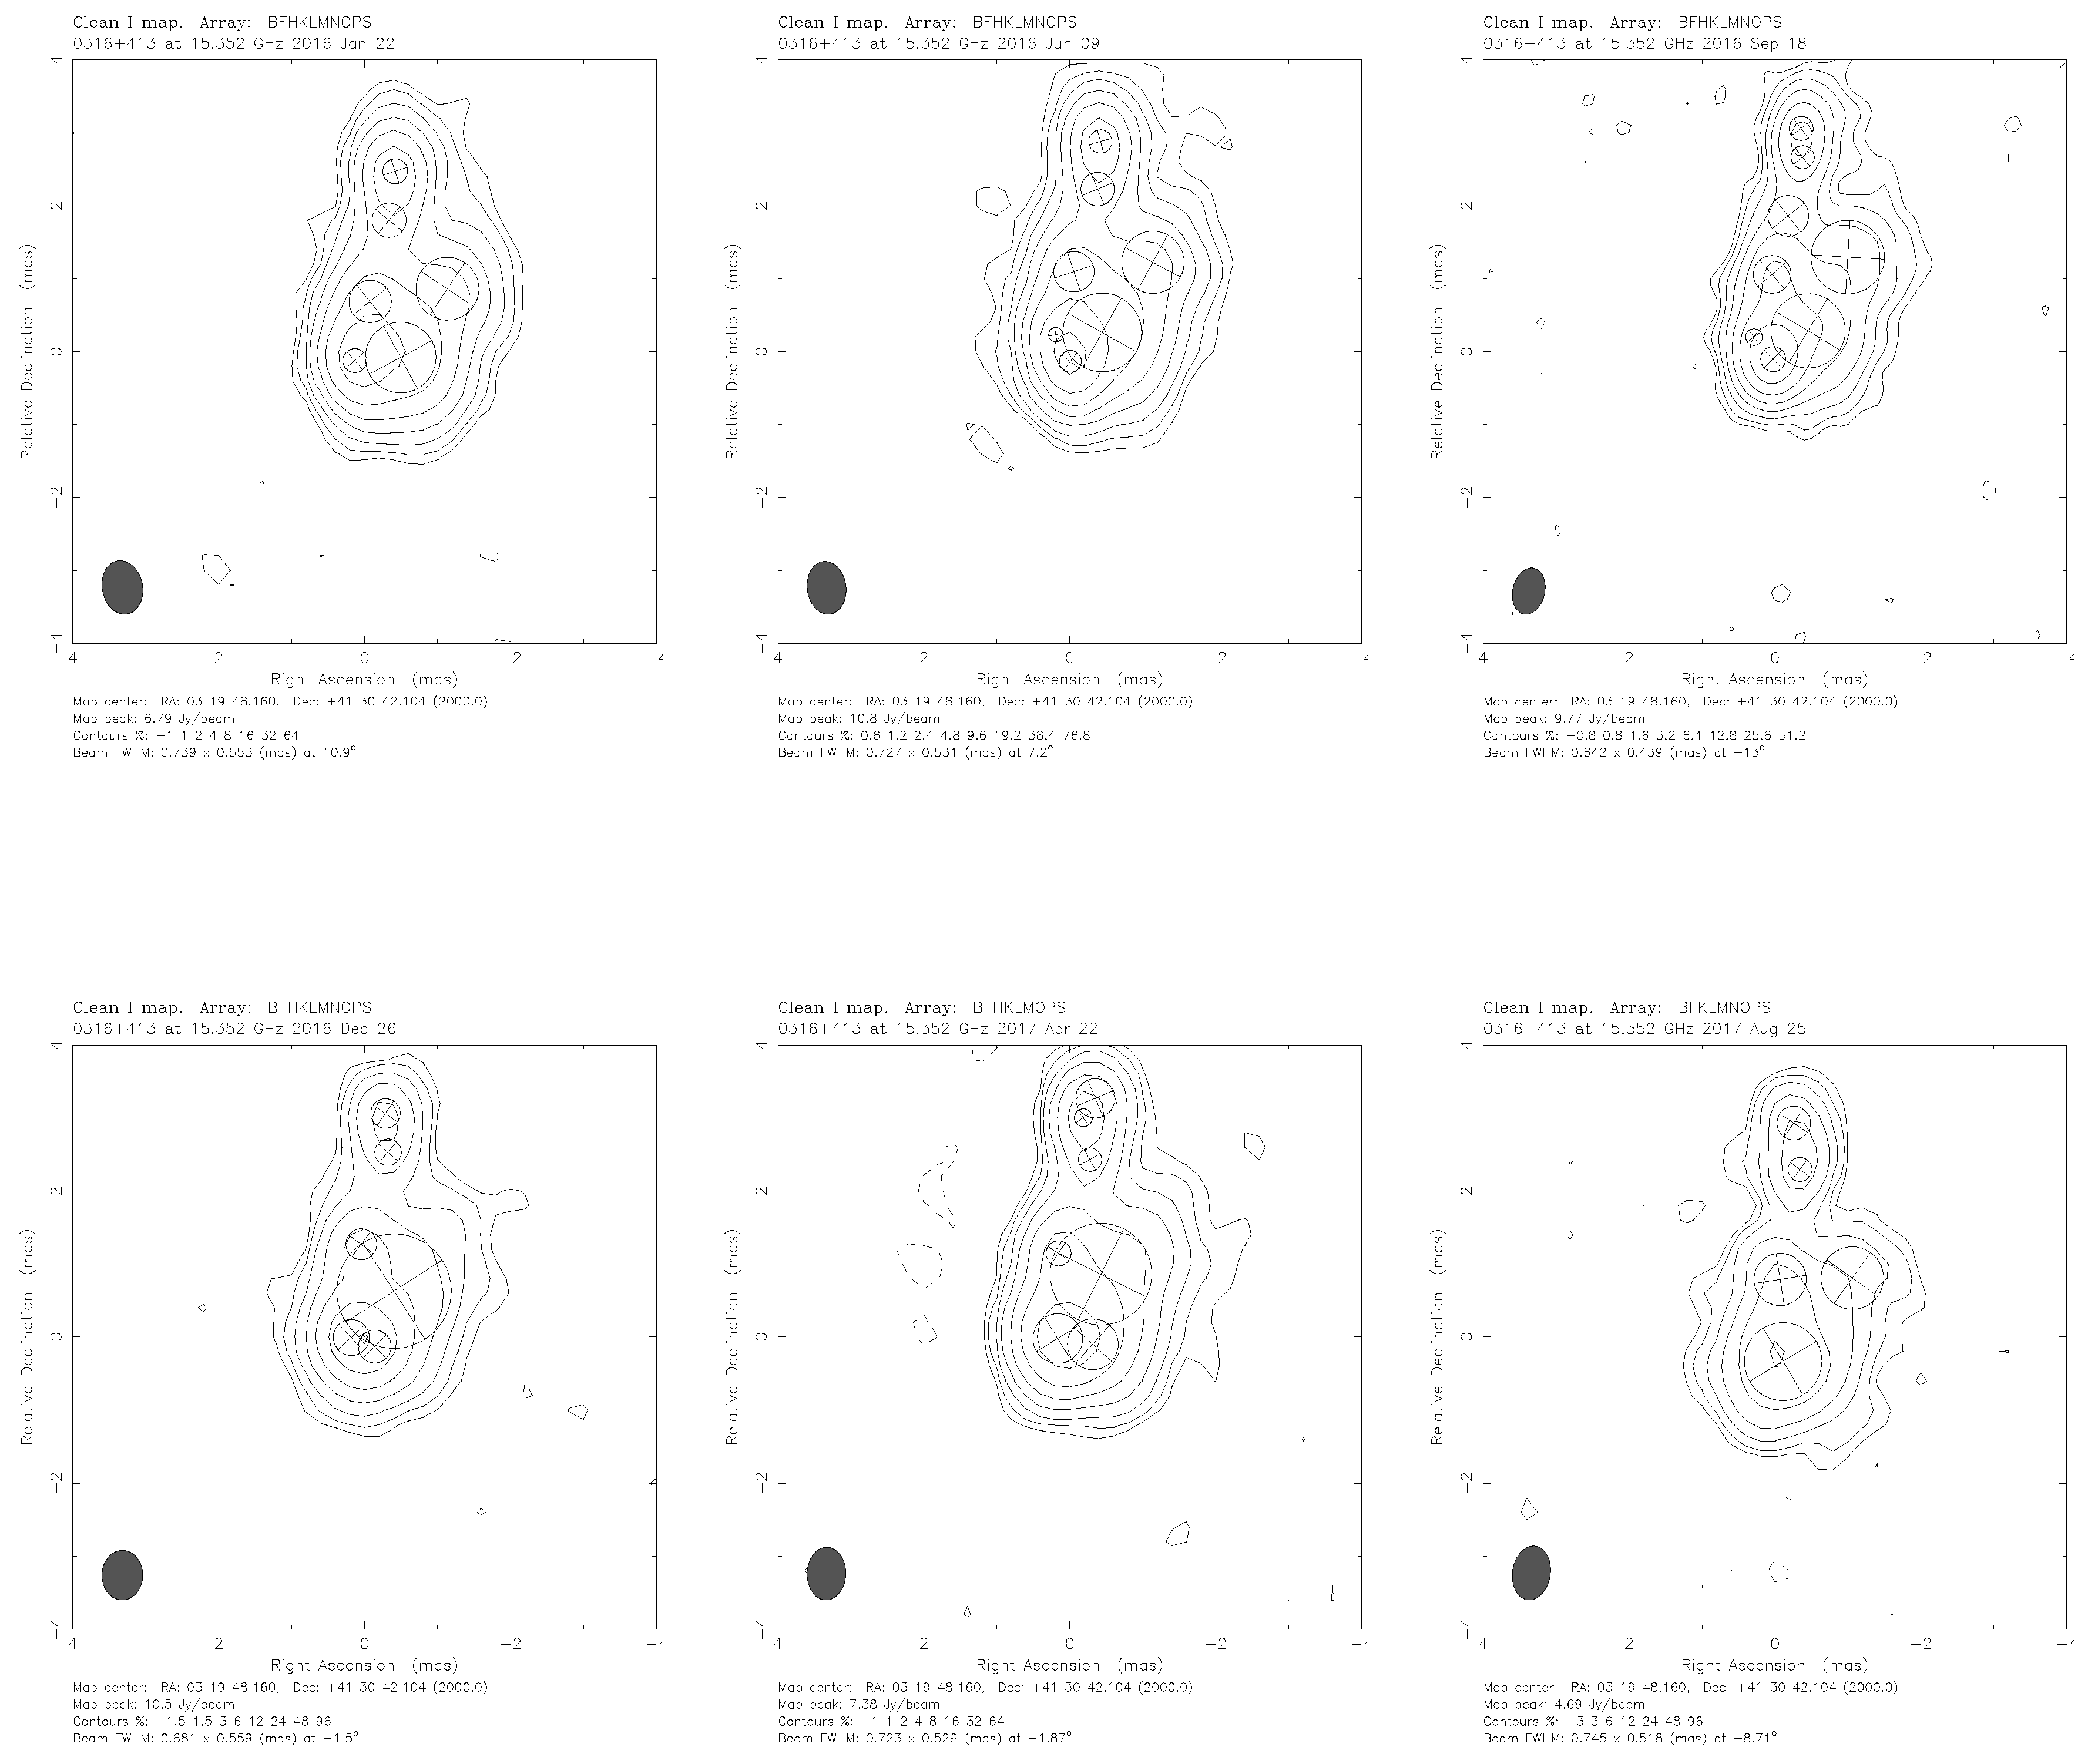
Table 1.
Table of fitted parameters in the precession model with the initial parameter bounds as indicated in the third column. The first column contains the parameter name, the second column lists the notation, the third one contains the initial bounds for the Levenberg–Marquardt algorithm [44,45], and the fourth and the fifth columns contain the fitted values for the longer and the shorter precession periods, respectively.
| Parameter | Notation | Initial Bounds | Pprec ≃ 88 yr | Pprec ≃ 44 yr |
|---|---|---|---|---|
| Intrinsic jet flux density | ||||
| Exponent of Doppler boosting | ||||
| Reference epoch | ||||
| Precession period | ||||
| Lorentz factor | ||||
| Half-opening angle of the precession cone | ||||
| Viewing angle of the precession axis | ||||
| Position angle of the precession axis |
Table 2.
Table of fitted parameters in the precession model with the broadened initial parameter bounds. The first column contains the parameter name, the second column lists the notation, the third one contains the initial bounds for the Levenberg–Marquardt algorithm, and the fourth column contains the fitted values.
| Parameter | Notation | Initial Bounds | Fitted Value |
|---|---|---|---|
| Intrinsic jet flux density | |||
| Exponent of Doppler boosting | |||
| Reference epoch | |||
| Precession period | |||
| Lorentz factor | |||
| Half-opening angle of the precession cone | |||
| Viewing angle of the precession axis | |||
| Position angle of the precession axis |
© 2019 by the authors. Licensee MDPI, Basel, Switzerland. This article is an open access article distributed under the terms and conditions of the Creative Commons Attribution (CC BY) license (http://creativecommons.org/licenses/by/4.0/).
Share and Cite
MDPI and ACS Style
Britzen, S.; Fendt, C.; Zajaček, M.; Jaron, F.; Pashchenko, I.; Aller, M.F.; Aller, H.D. 3C 84: Observational Evidence for Precession and a Possible Relation to TeV Emission. Galaxies 2019, 7, 72. https://doi.org/10.3390/galaxies7030072
AMA Style
Britzen S, Fendt C, Zajaček M, Jaron F, Pashchenko I, Aller MF, Aller HD. 3C 84: Observational Evidence for Precession and a Possible Relation to TeV Emission. Galaxies. 2019; 7(3):72. https://doi.org/10.3390/galaxies7030072
Chicago/Turabian StyleBritzen, Silke, Christian Fendt, Michal Zajaček, Frédéric Jaron, Ilya Pashchenko, Margo F. Aller, and Hugh D. Aller. 2019. "3C 84: Observational Evidence for Precession and a Possible Relation to TeV Emission" Galaxies 7, no. 3: 72. https://doi.org/10.3390/galaxies7030072
Note that from the first issue of 2016, this journal uses article numbers instead of page numbers. See further details here.