Engine Oil Degradation in the Real-World Bus Fleet Test Based on Two Consecutive Operational Intervals


1
Department of Power Engineering and Transportation, Faculty of Production Engineering, University of Life Sciences in Lublin, Głeboka 28, 20-612 Lublin, Poland
2
Department of Quality and Safety of Industrial Products, Cracow University of Economics, Sienkiewicza 4, 30-033 Kraków, Poland
3
Department of Road and Urban Transport, Faculty of Operation and Economic of Transport and Communications, University of Zilina, Univerzitna 1, 010 26 Zilina, Slovakia
*
Author to whom correspondence should be addressed.
Lubricants 2024, 12(3), 101; https://doi.org/10.3390/lubricants12030101
Submission received: 15 February 2024
/
Revised: 6 March 2024
/
Accepted: 14 March 2024
/
Published: 19 March 2024
(This article belongs to the Special Issue Advances in Tribochemistry)
Abstract
:The literature on the subject and the results of numerous research experiments indicate that single replacement cycles do not reflect the actual state of oil quality in the context of its degradation. Monitoring the operational quality of the oil in several successive stages allows for a more accurate diagnosis of the optimal oil change time. Therefore, it was decided to investigate the relationship between two consecutive periods of changing the operating oil in an engine. Comparative tests of seven buses included in the fleet were carried out. An important division criterion was taken into account—the operation of city and intercity buses. The HDXRF instrumental chemical analysis method was used to determine changes in the content of abrasive metals, and additives in engine oils. Additionally, the oxidation, nitration, sulfonation, and soot content were assessed using infrared spectroscopy (FTIR) based on the ASTM E2414-10 standard and kinematic viscosity at 40 °C and 100 °C using a Stabinger viscometer according to ASTM D7042. The course of these changes was analyzed in terms of their dynamics. The comparative study aimed to identify trends and sources of differences between the tested oils, as well as to demonstrate the number of exceedances of limit values for the selected parameters.
1. Introduction
Buses are the most frequently used means of public transport in the European Union. The European Automobile Manufacturers Association (ACEA) reports [1] that in 2023, 55.7% of all journeys in the EU were made by this type of public transport, which corresponded to serving 32.1 billion passengers annually with city and intercity bus journeys. Buses are very popular due to their availability, flexibility, and relatively low price. They can be used in most cities and towns in the EU, and their connection networks are often dense and adapted to the needs of residents.
The ecological awareness of society is constantly growing, and the pressure to reduce exhaust emissions is growing [2,3]. In this case, buses are a means of transport with a much lower environmental impact than passenger cars. However, in 2023, in the entire European Union, only 1.4% of the bus fleet was electrified, and additionally, 67.3% of all new buses sold in the EU were powered by diesel fuel. This means that electric buses still constitute only a fraction of the bus market in the EU.
According to research, there are ways to reduce fuel consumption and exhaust emissions in trucks using conventional technologies. The main purpose of these technologies is to improve the diesel engine’s efficiency and reduce the vehicle’s power demand during road transport [4,5,6]. One way to minimize exhaust emissions is by using exhaust gas aftertreatment technology. However, these solutions can be harmful to engine oil and require work under more challenging conditions and with higher levels of pollution [7,8,9,10]. In a study conducted by Macian et al. [11], eight low-viscosity oils were tested on city buses with different engine technologies, and it was confirmed that using this type of oil resulted in reducing fuel consumption without significantly increasing engine wear.
Another way to reduce exhaust emissions is to implement fleet management systems [12,13,14,15]. These systems allow, among other things, the monitoring fuel consumption and exhaust emissions in vehicles. They can be used to identify areas where changes can be made to reduce negative environmental impacts. One such area is monitoring the condition of engine oil [16,17].
Oil degradation is a natural process as a result of which oil loses its functional properties over time [18,19,20]. The high temperature during engine operation causes oil oxidation, which leads to its decomposition [21]. Engine oil is also exposed to high pressures, diluting the oil and reducing its viscosity. However, impurities generated during operation, such as metal particles, soot, unburnt fuel, or water, lead to the deterioration of the oil’s properties, including its viscosity and lubrication ability [22]. Oil degradation has a negative impact on the engine, leading to excessive engine wear, increased emissions, and reduced efficiency. The rate of engine oil degradation is influenced by the vehicle’s operating conditions—factors such as the dust concentration in the intake air, the ambient temperature, and load play a significant role. Operating conditions that are especially harsh and can accelerate oil degradation include driving distances shorter than 8 km, both at low ambient temperatures and at high ambient temperatures exceeding 35 °C. Driving on dusty roads, covered with mud, snow, or ice, or driving with a roof rack, or trailer, or in mountainous terrain are also considered difficult conditions. Additionally, long-term driving with frequent stops and starts or long periods of engine idling are classified as harsh conditions, which are typical of city buses’ driving conditions.
Monitoring the condition of engine oil, understood as a type of preventive maintenance, allows fleet managers to make appropriate decisions before a failure occurs based on the data obtained, their detailed analysis using computer tools, and the detection of change trends [23,24,25,26]. Laboratory methods allow for obtaining detailed information on the physico-chemical properties of lubricating oil. Service companies use them to identify engine problems and to determine the optimal oil change interval, while research laboratories identify the impact of oil on engine wear and exhaust emissions [27]. A physical analysis allows the determination of properties such as the viscosity, total acid number (TAN), total base number (TBN), flash point, and freezing point [28,29]. A chemical analysis allows you to determine the chemical composition of engine oil. This allows for the identification of impurities in the oil, such as metal particles, fuel or water content, as well as the manner of wear of additives as a result of specific engine operating conditions.
The presented work examines the hypothesis of whether oil degradation in buses operated in urban traffic is higher than in non-urban operation. The justification for differentiating operating conditions into engine oil degradation in this case are factors such as: frequent stops and starts, which cause higher operating temperatures of the engine and oil, as well as the higher traffic intensity in the city, which consequently translates into a longer engine operating time at idle speed. In addition, air pollution in cities is higher, which causes it to enter the oil and accelerate the degradation rate.
Therefore, this article presents a comparative analysis of the engine oils from seven buses included in the vehicle fleet. The aim of the article was to investigate the relationship between two consecutive engine oil change intervals in real operating conditions. The assessment concerned the selected physicochemical properties of the lubricating oil, such as its viscosity at 40 °C and 100 °C, viscosity index, oxidation, nitro-oxidation, sulfonation, and its content of impurities in the form of soot and abrasive metals. The comparative study aimed to identify trends and sources of differences between the tested oils.
Analyzing used engine oil from actual buses allows for a more realistic assessment of the oil’s performance over time. That is why the presented study’s novelty lies in its focus on real-world conditions and its aim to optimize engine oil change intervals for buses based on practical use data from two consecutive oil change intervals.
2. Materials and Methods
2.1. Materials
The field test performed included seven diesel-powered buses in real driving conditions. The vehicles were used in urban and intercity conditions. Samples for testing were taken during regular oil change intervals ranging about 30,000 km. Such an interval represents the mileage recommended by the vehicle manufacturer. All buses were lubricated with the same, fully synthetic SAE 10W40 oil, the parameters and specifications are presented in Table 1.
Detailed data on the mileage of individual engine oils are presented in Table 2. This research used 14 samples of used engine oils to determine the changes in physicochemical properties and the degree of engine wear (indirect assessment through engine oil analysis) during two replacement cycles, which were dictated by different operating conditions. In several cases, this interval was both extended (by a maximum of approximately 6000 km) and shortened (in one bus by approximately 12,000 km). Additionally, the last two columns of the table provide information on the amount of oil refills made during a specific oil interval and the number of days before the oil change, indicating when the refills were actually made.
2.2. Vehicle Characteristics
Figure 1 presents the bus models participating in this research. The subjects of this study were seven buses, including two SOR buses, operated in intercity conditions, and five Solaris buses, operated in typical urban conditions. The reference points in the presented study were the operating conditions of the vehicles belonging to the vehicle fleet in order to check the factors influencing the engine oil degradation process. Table 3 shows the engine specifications for each bus.
The FPT N67 and Cummins B6.7 power units are 6-cylinder in-line diesel engines. Both engines meet the EURO VI exhaust emission standard, and the exhaust system is equipped with a DPF and SCR (Selective Catalytic Reduction) filter. The weight of the FPT N67 engine is 530 kg, and the Cummins B6.7 weighs 522 kg. The dimensions of the engines are 1100 × 782 × 924 mm, resp. 1097 × 788 × 921 mm. Photos of both engines are presented in Figure 2.
2.3. Operating Conditions
As the authors have already pointed out, the vehicle operating conditions also influence the rate of engine oil degradation. The suburban bus lines had to overcome significant hills during operation—the PD489IA bus covered 345 m of elevation in the overall line distance of 15.2 km, and the PD310IA bus covered 473 m of elevation in the overall line distance of 22 km. The remaining buses were operated in typical urban conditions, where there were no significant elevation differences.
2.4. Methods
The analysis of the direction and intensity of the changes in the kinematic viscosity parameters at 40 °C and 100 °C of the tested samples was performed using an SVM Stabinger model 3001 viscometer (Anton Paar GmbH, Graz, Austria) according to the ASTM D7042 standard.
The FTIR method was used to determine the degree of oxidation, nitration, sulfonation, and the soot content using a Thermo Nicolett IS5 apparatus (Thermo Fisher Scientific, Waltham, MA, USA) based on the ASTM 2412 standard. A number of parameters of the fresh and used engine oils were examined by comparing their FTIR spectra. The levels of individual bands for used oils were determined not directly from their spectra, but from difference spectra, i.e., spectra resulting from a mathematical operation: the spectrum of used oil minus the spectrum of fresh oil.
The content of trace elements in engine oils was analyzed using a multi-element analyzer HD Maxine (XOS, East Greenbush, NY, USA). The analyzer uses high-resolution X-ray fluorescence (HDXRF) to determine the trace elements in liquid samples in hydrocarbon matrices. To take measurements, the device was first calibrated. Then, the oil sample was mixed and heated to 40 °C before being loaded into a measuring cup using prolene foil. Using an automatic pipette, 1 mL of oil was placed in a measuring cup. The test was carried out in triplicate, and the results were presented as an average.
Changes in the dispersing properties of used oils were assessed based on the blotter spot test. A few drops of a representative oil sample were applied to a piece of chromatographic paper (ion exchange paper—model SG81) and, after drying, the appearance of the stain was observed. The obtained result was then read twice—after 1 h and after 24 h.
3. Results and Discussion
3.1. Rheological Properties
Figure 3 and Figure 4 present the results of the percentage changes in relation to the fresh oil for the kinematic viscosity at 40 °C and 100 °C of all tested oils.
Looking at Figure 3, showing the percentage changes in the kinematic viscosity at 40 °C, it is worth noting that all intercity buses exceeded the critical percentage change in viscosity of ±15% of the value for fresh oil. Moreover, it was observed that all oils used in urban and interurban conditions, except for one case (PD724HF), recorded viscosity decreases. The increase in viscosity in this case of the bus number PD724HF was associated with obtaining the highest values for the degree of oxidation of all the tested oils. In the group of vehicles operated in intercity conditions, the average percentage change for viscosity at 40 °C decreased by 18.1%, and for city buses by 8.6%. In the group of city buses, large differences were observed—one critical value for the PD654GN bus (the highest overall mileage of 354,777 km), four warning values and five acceptable values. However, looking at the relationship between intervals in individual city buses, an upward trend was observed in the second operating cycle. In the case of the sample marked PD382GY_2, an 8.8% smaller decrease than in the case of the first tested interval was recorded. In this case, the authors believe that the reason for this state of affairs is the increase in the number of fresh oil refills during operation by 7 L between the examined periods (3 L were refilled in the first cycle, and 10 L in the second). The average percentage change in viscosity in the tested vehicles operated in urban conditions that exceeded the assumed interval of 30,000 km was −9.6% (an average of 6.4 L of oil refills). On the other hand, the average percentage change in vehicles that finished their oil interval before reaching 30,000 km was −7.7% (an average 4 L of oil refills).
Moving on to the percentage changes in viscosity at 100 °C, which are presented in Figure 4, also in this case, all intercity buses exceeded the assumed limit value of the parameter (±15%), and the decreases amounted to an average of 16.8%, while for the group of city buses, no exceedances were recorded at the borderline value, and the average decrease in the group was 9.4%. In this case, it is difficult to say clearly whether the reason for this state of affairs is the design of the engine in SOR buses or the issue of intercity driving conditions, which may come as a surprise when compared to urban conditions, which are generally considered to be more difficult for the oil to work within. In city buses that exceeded the interval assumed by the manufacturer (30,000 km), an average percentage change of −10.3% was recorded in relation to fresh oil, which is a warning value (±10%). However, in the case of buses with an interval of less than 30,000 km, the percentage change for this parameter was −8.52%, which is an acceptable condition.
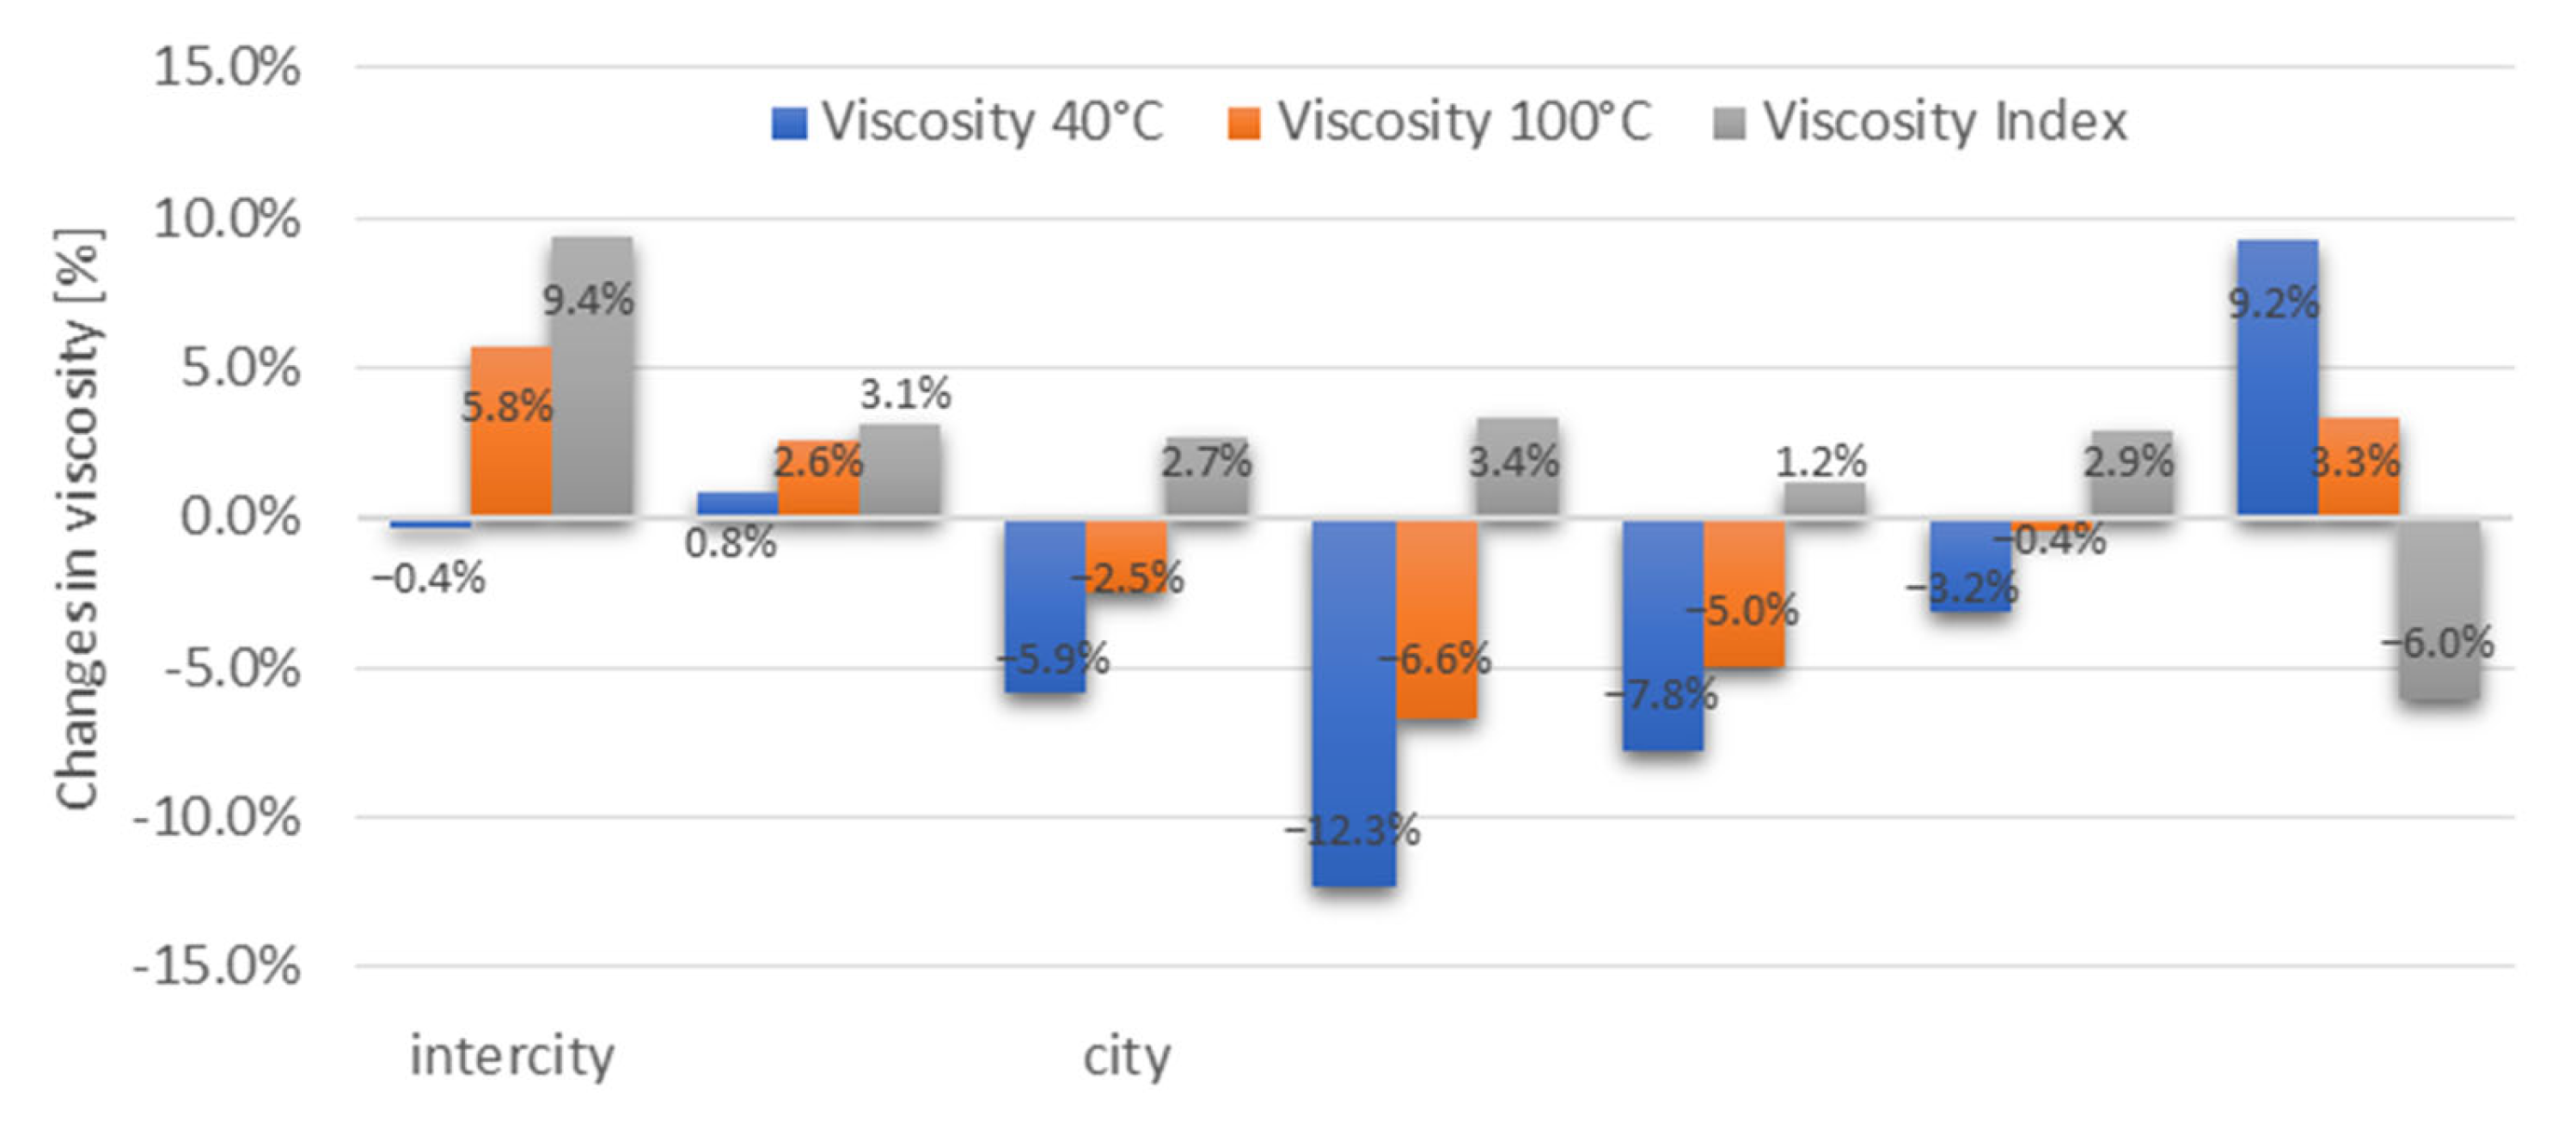
Figure 5 presents the rheological parameters of oils from the perspective of changes at individual replacement intervals in order to detect potential trends in changes. Looking at the viscosity index, the largest increase of 9.4% between the first and second interval was observed for the PD489IA bus. In the case of the viscosity parameter at 40 °C, in most cases, decreases are observed, on average by 5.9% in relation to the first replacement intervals. In one case (PD382GY), a 9.2% increase in viscosity was recorded. Observing the trends in viscosity changes at 100 °C, an increase in this parameter is visible in the group of intercity buses, by an average of 4.2%. However, in city buses there is a visible downward trend between the first and second oil interval, by an average of 3.6%. Similarly to the viscosity at 40 °C, there was also a 3.3% increase in viscosity for the PD382GY bus.
3.2. Impurities
Changes in soot content measured with an infrared spectrometer were read in two places on the spectrum. The absorption bands responsible for confirming this type of contamination are ~2000 cm−1 and ~3980 cm−1. The slope of the curve between two points in the tested oils is presented in Figure 6.
The results of the soot content in individual oils are presented in Figure 7. It was observed that the highest values came from buses operated in intercity conditions. The measured average soot content (reading in ~2000 cm−1 plus reading ~3980 cm−1 divided by 2) was 43% higher in intercity buses and amounted to 0.313 [abs/0.1 mm], while in city buses it was 0.179 [abs/0.1 mm]. However, looking at the relationship between the two oil change intervals in individual vehicles, it was observed that the soot content gradually increased with the increase in the overall mileage of the vehicle. The highest change in the vehicle used in intercity conditions was observed for PD310IA, where the difference between the first and second interval was 36%. In the case of the city buses, the highest change was 40% for the PD724HF bus and 25% for the vehicle marked PD382GY. In the remaining cases, changes between intervals oscillated on average around 0.008 [abs/0.1 mm]. Looking through the prism of exceeding the mileage recommended by the manufacturer (30,000 km), in the case of city buses, the average soot value in the tested vehicles was 0.219 [abs/0.1 mm], while in the case of maintaining the recommended mileage, this value was 36% lower and the average value was 0.139 [abs/0.1 mm].
Table 4, below, presents images of all the oil stains made by placing one drop on a chromatography paper. The drawing shows the appearance of the stains in two time periods, after one hour and after 24 h.
Table 5 compares the results of the blotter spot test with the results obtained from the FTIR spectrometer regarding the soot content. The blotter spot test confirmed the results obtained from the FTIR test. The blackest spots, indicating high soot content, were also visible in the case of intercity buses. However, in the case of the 310IA vehicle, the first interval shows that the oil stain is slightly lighter. On the other hand, in city buses, despite the higher overall mileage of the vehicles, oil stains significantly indicate the better preservation of the oil’s dispersing properties. The paper test showed that the best dispersing properties were retained by the PD496HG bus oil, which was also confirmed by the lowest soot content in the FTIR test.
It was difficult to determine the impact of oil refills on the decrease of soot content in individual vehicles due to the procedure made during operation. Four vehicles with similar overall mileages were observed, including two city vehicles with an approximately 250,000 km mileage. PD496HG_2 required 3 L of refill and had a soot content of 0.091 [abs/0.1 mm], while the vehicle PD382GY_2 needed 10 L of refill and had a soot content of 0.148 [abs/0.1 mm]. Two intercity vehicles with a mileage of 30,000 km were also observed. The first vehicle, PD489IA, had no refills and had a soot content of 0.246 [abs/0.1 mm]. The second vehicle, PD310IA, required 5 L of refills and had a soot content of 0.232 [abs/0.1 mm].
Figure 8 presents the FTIR interferogram showing the bands between ~3100–3550 cm−1 responsible for the detection of contaminants in oil.
It was observed that PD724HF’s oil had the largest surface area, followed by that of PD310IA, PD489IA, PD724HF_2, PD654GN_2, and PD382GY_2. Also, in this case, it corresponded highly with the blotter spot test, where oils such as those from PD724HF, PD724HF_2, and PD382GY_2 fared particularly poorly. It is worth noting that the oil change time in the case of PD724HF was 4000 km shorter than recommended by the manufacturer. The view of the discussed oil spots is presented in Table 6.
3.3. Elemental Analysis
The conducted elemental analysis confirmed the high content of metallic pulp in the oil samples with the highest levels of soot. The highest levels of metals originating from engine wear, such as iron (Fe) and copper (Cu), were recorded for intercity buses. The average iron content in intercity buses was 94 ppm and was 52% higher than in buses operating in the city (the average in the group was 45 ppm). Copper in the engine is used, among others, in rings and bushings, while iron, as the main structural element in the engine, is used in cylinder liners, the crankshaft, rolling bearings and valves [30]. When comparing two intervals in both intercity buses, a high content of iron and copper was observed in their first intervals from a new status, which in this case indicated the process of the running-in of these engine components. In the next interval, there was a significant decrease (by 80%) in the content of this element, although it was still at a high level when compared to other buses that were operated in urban conditions (the average in the group of city buses was 0.9 ppm). In the remaining cases of city buses, it was difficult to capture the trend and direction due to the large differences between individual intervals. However, in terms of exceeding the manufacturer’s recommended oil mileage, it was observed that in the group of city buses, the average iron content was 50 ppm. Thus, the iron content was 22% higher than that in the cases of vehicles in which the oil was changed before the assumed interval (average in the group 39 ppm). Table 7 presents the concentrations of the abrasive metals and additives in the tested oils.
Figure 9 shows the percentage changes in additives for the tested intervals of individual vehicles. Calcium is used as a detergent in oils to neutralize acids and keep the engine clean. The largest decrease in calcium content in the oil between the first and second intervals was observed in the PD382GY city bus. For intercity buses, all the elements responsible for oil additives increased between the first two intervals from the new status. This can be explained by the use of oil refills and the low operational mileage of the tested vehicles. Zinc and phosphorus are multifunctional additives used for anti-wear, anti-seize, anti-friction, anti-corrosion, and antioxidant properties. The largest decreases between intervals in these elements were also observed in the PD382GY city bus. Moreover, this bus showed the highest increase in iron content between the two intervals. The PD496HG and PD724HF vehicles had the most stable changes. Sulfur, on the other hand, is found in mineral oils as a component of oil bases. Due to this, it is present in almost all oils, but in varying amounts. Along with phosphorus, sulfur is a component of most additives that increase wear and corrosion resistance. It is often combined with calcium and zinc. Once again, the largest decreases between intervals in the sulfur content were observed in the PD382GY city bus.
3.4. Engine Oil Degradation Processes
In the further part of the analysis of the oils, they were assessed regarding the degree of oxidation, nitro-oxidation, and sulfonation, and their values are presented in Table 8.
Figure 10 shows an image of the spectra in the area responsible for nitro-oxidation (wavenumber ~1630 cm−1) and oxidation (wavenumber ~1720 cm−1). The average content of this parameter for the group of city buses was 0.107 [abs/0.1 mm], while looking through the prism of the recommended mileage by the vehicle manufacturer, buses that exceeded the assumed interval were characterized by a nitro-oxidation degree of 0.140 [abs/0.1 mm] which was 47% higher than in the cases of buses that followed the recommendations. Moreover, the lowest level (0.047 [abs/0.1 mm]) was recorded by the oil from the vehicle marked PD496HG_2 with an oil mileage of 29,000 km, while the second best result was 0.049 [abs/0.1 mm] for the PD382GY vehicle with a low oil mileage compared to the rest of the samples (18,275 km). Moreover, it was also observed that oil samples from intercity buses with the highest amount of soot did not show any problems with nitro-oxidation (the average in this group was 0.016 [abs/0.1 mm]. The highest level (0.237 [abs/0.1 mm]) was observed for the second oil interval in vehicles marked PD724HF and PD382GY. This is another signal of a strong correlation with the results obtained in the blotter spot test, presented in Table 6. These two oils showed a significant problem in the areas of nitro-oxidation. The third worst result turned out to be the oil from the first interval of the vehicle described above, i.e., PD724HF, while the problem with nitro-oxidation was not proven for the first interval of the PD382GY vehicle. When combining this issue with the number of oil refills made during operation, the assessment of the situation becomes more complex. The worst case of oil in terms of the nitro-oxidation parameter (PD382GY_2) required three times more oil refills than in the first interval. Additionally, the last refill before sampling took place in a shorter period of time (18 days) than in the case of the first interval (66 days)—which would indicate that the oil should remain in a better condition.
After analyzing the levels of oxidation in the tested samples, it was found that there is a similar relationship between the degree of nitro-oxidation and the oxidation level. The most heavily oxidized oils were observed for the vehicle marked PD724HF in both tested oil intervals (0.249 [abs/0.1 mm] for the first, 0.330 [abs/0.1 mm] for the second) and for the second interval in the PD382GY vehicle 0.318 [abs/0.1 mm]. The average oxidation degree in the group of intercity vehicles was 0.151 [abs/0.1 mm], which was 36% lower than in the cases of the city buses (average 0.236 [abs/0.1 mm]). When comparing the individual intervals in the tested vehicles, the largest difference in the degree of oxidation between the first and second was observed for the PD382GY bus (an increase of 46%), while the smallest increase (an increase of 1%) was observed for PD587HG. In the group of intercity buses, there was an increase of 3% for PD489IA, while for the second vehicle, PD310IA, the increase between the first and second interval was 34%. In the group of city buses, two cases of decreased oxidation were observed for PD496HG (−2%) and PD654GN (−7%), respectively. The average oxidation degree for vehicles that exceeded the oil interval assumed by the manufacturer was 0.260 [abs/0.1 mm], which was 19% higher than in vehicles that met the recommended interval.
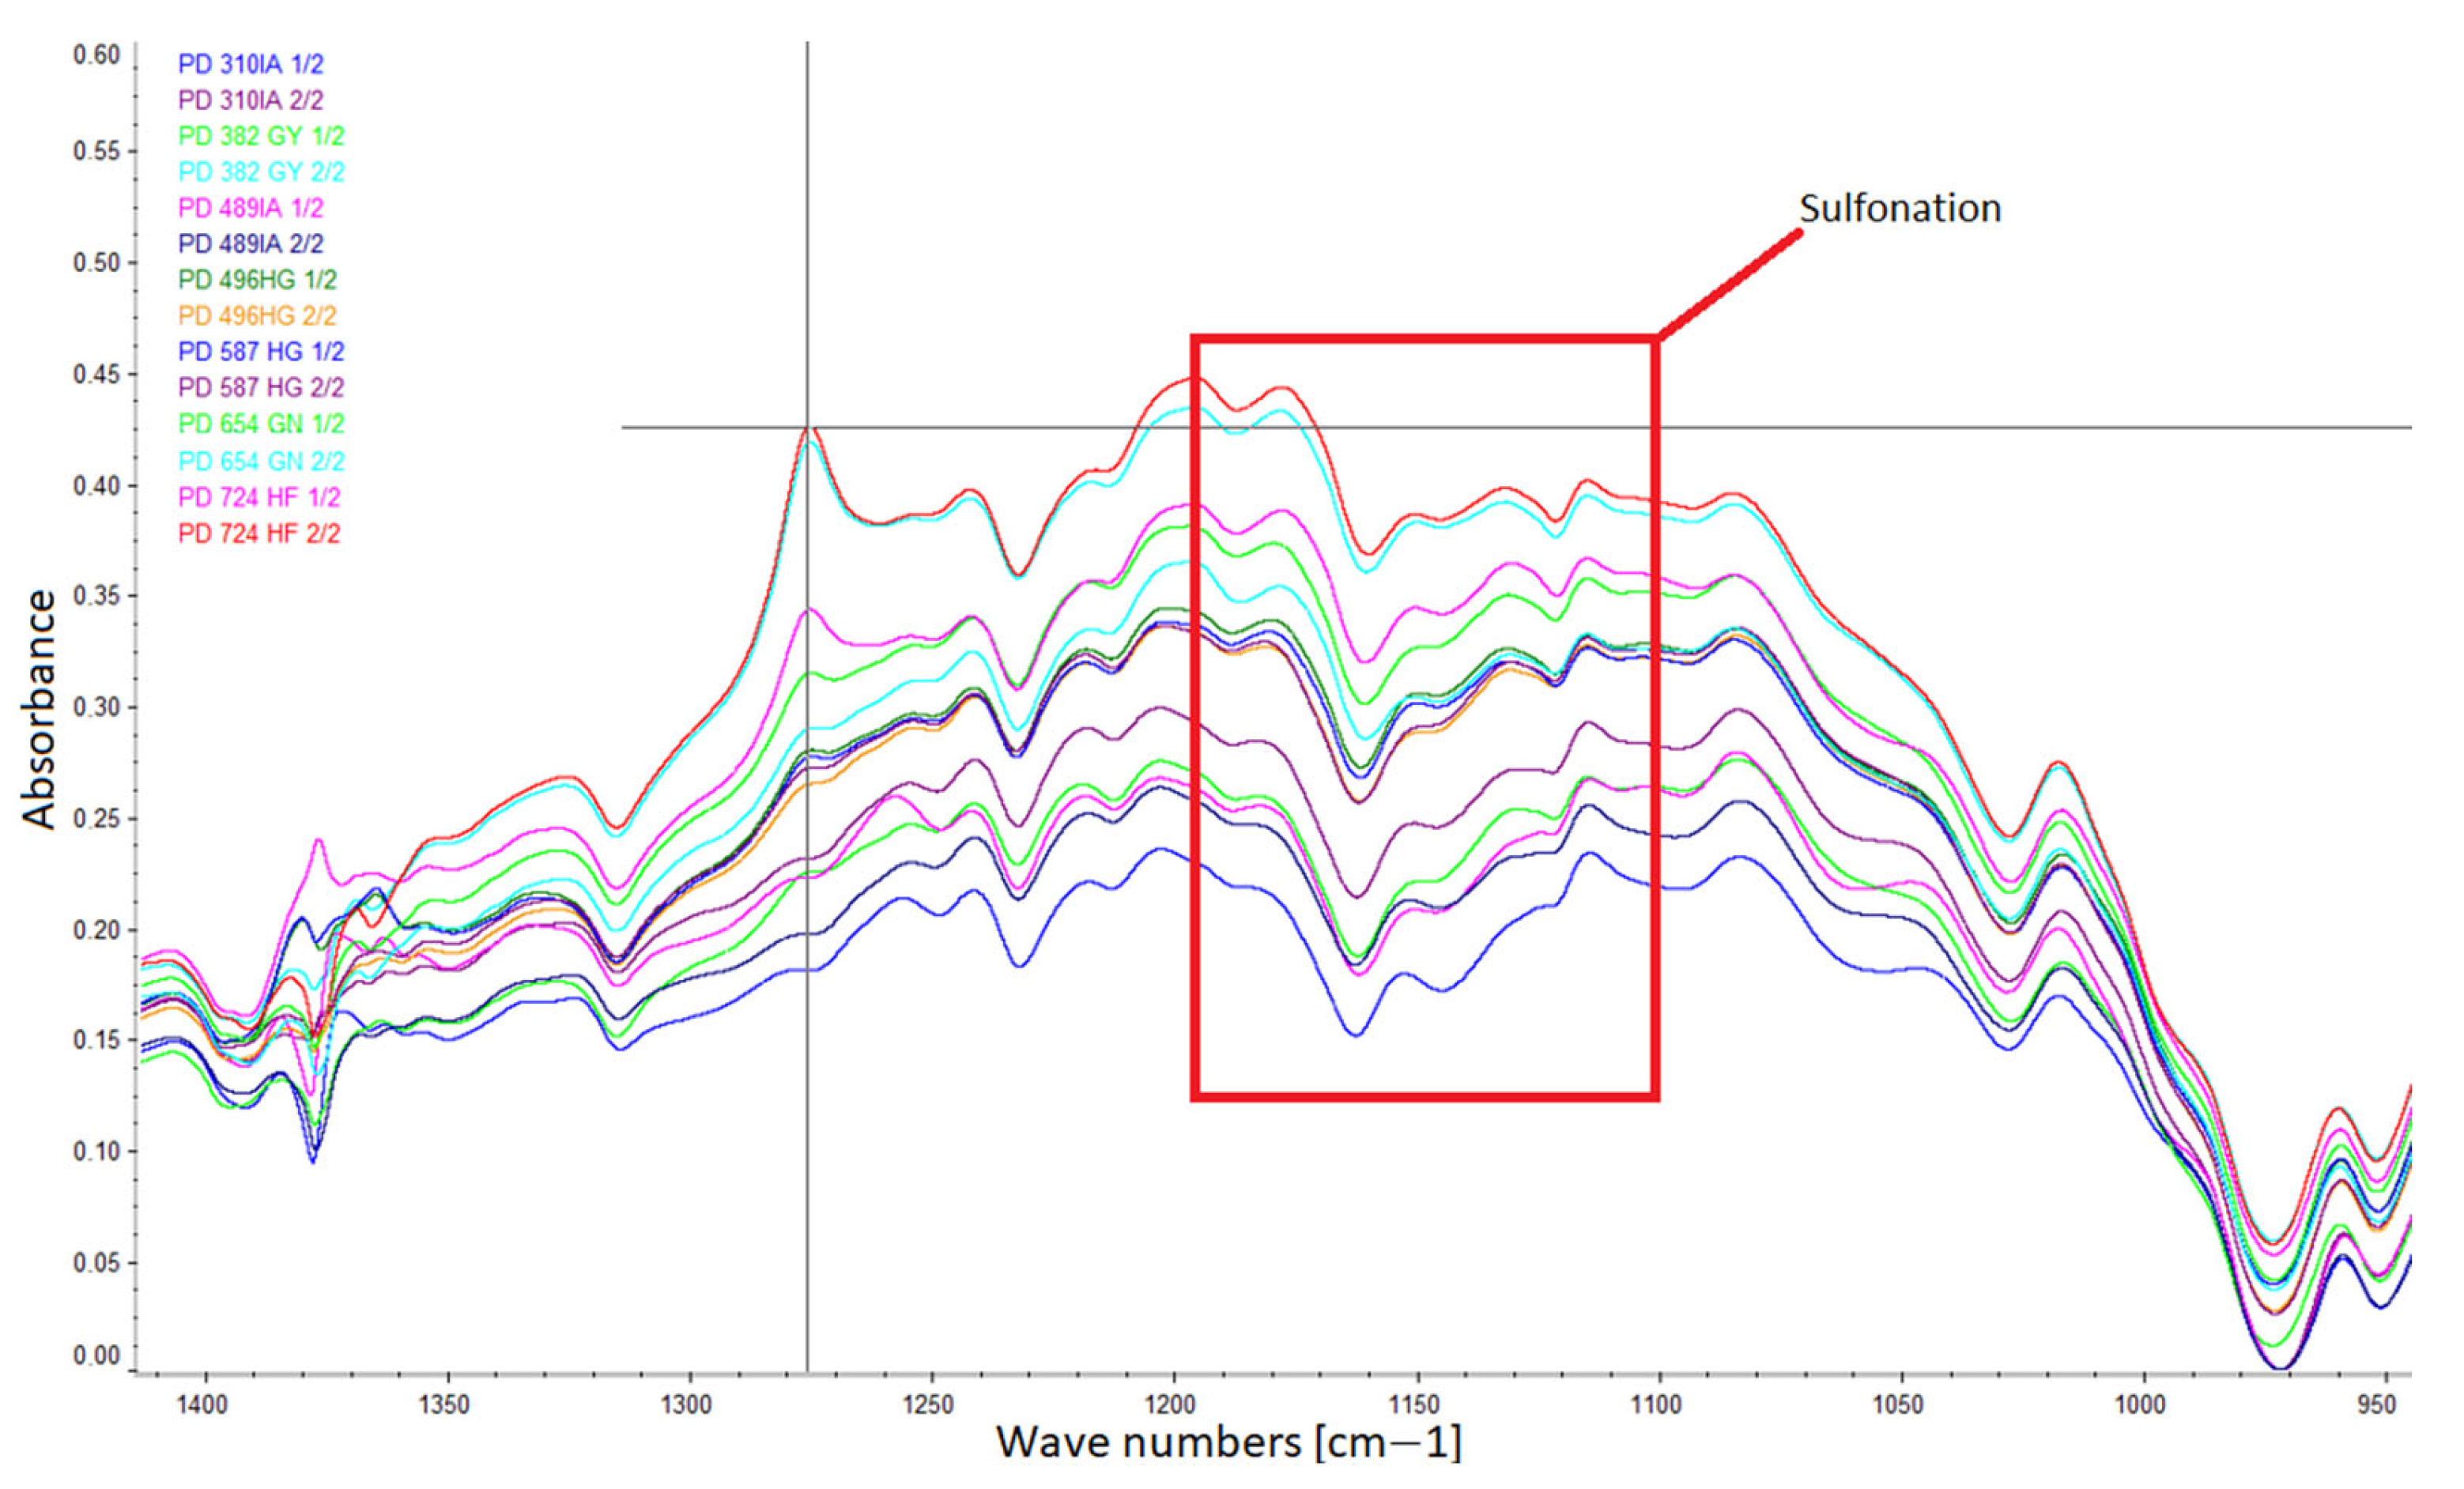
Figure 11 shows an image of the spectra in the area responsible for sulfonation (wavenumbers ~1114 cm−1, ~1150 cm−1, ~1181 cm−1). The measured average sulfonation content (the reading in ~1114 cm−1, plus the reading in ~1150 cm−1, plus the reading in ~1181 cm−1, divided by 3) was 39% lower in intercity buses and amounted to 0.147 [abs/0.1 mm], while in city buses it was 0.204 [abs/0.1 mm]. The highest degree of sulfonation (0.267 [abs/0.1 mm]) was observed for the PD724HF_2 bus operated in urban conditions, while the lowest value (0.119 [abs/0.1 mm]) was observed for PD310IA operated in intercity conditions. The average sulfonation degree for vehicles that exceeded the oil interval assumed by the manufacturer was 0.223 [abs/0.1 mm], which was 25% higher than in vehicles that met the recommended interval.
Figure 12 shows the percentage changes in the degree of oxidation, nitration, sulfonation, and iron between the tested intervals of the individual vehicles. The PD382GY bus had the highest changes in oil degradation processes between the first and second intervals. In this case, the degree of nitration in the second interval increased by 78% compared to the first, the degree of sulfonation by 50%, and the degree of oxidation by 46%. Such large changes in oil degradation processes translated into an increase in the engine wear visible in the iron concentration by 35%. The PD654GN and PD489IA vehicles showed the most stable changes. However, a 49% reduction in the nitration degree, and a reduction in sulfonation by 10% in the second interval was observed for the PD496HG vehicle. During the first interval, 7 L of oil were added, while in the second interval, the engine only required 3 L of oil. However, such a large decrease in the nitration degree in the PD496HG vehicle did not transfer into a visible decrease in the iron concentration in the oil (41 ppm in the first interval, 40 ppm in the second interval).
4. Conclusions
Comparative tests carried out on seven buses included in the vehicle fleet enabled an accurate diagnosis of the degree of degradation of lubricating oils and the trend of changes in their actual driving conditions. The search for the relationship between two successive engine oil replacement periods allowed the conclusion that there are no grounds to extend oil intervals in the tested vehicles.
In the group of city buses, exceeding the oil interval recommended by the manufacturer resulted in entering a warning state for the oil viscosity parameter. However, the cases of buses in which the assumed interval was maintained allowed them to remain in an acceptable condition. The remaining oil parameters tested also showed that exceeding the mileage of 30,000 km has a negative impact on the quality of the oil and the condition of the engine—the soot content is 36% higher and the iron content is 22% higher than in the cases of vehicles in which the oil was changed before the assumed interval. Also, the levels of oxidation, sulfonation, and nitro-oxidation in this type of situation showed higher values—by 19% for oxidation, 25% for sulfonation, and 47% for nitro-oxidation, respectively.
Chromatographic paper made it possible to differentiate the samples in terms of their content of soot and large impurities. After comparing the paper test with the oil parameters obtained in the FTIR tests and elemental XRF analysis, the high consistency of the results was obtained. To sum up, the authors emphasize the high usefulness of the blotter spot tests for the initial and quick determination of the quality of used oil, and recommend the use of them regularly by service personnel.
During the research, it was found that there were significant differences between the two oil change intervals, both in the same bus and between different types. These differences were particularly noticeable in the group of city buses. Moreover, the authors’ hypothesis regarding the assumption of more difficult operating conditions for oil in urban environments and, therefore, a greater degree of the degradation of its parameters, was negatively verified in the presented research. The experimental results of rheological parameters of engine oils used in intercity conditions indicate that it is necessary to either verify the interval or change the type of oil for this group of vehicles. In all four cases, the viscosity limits at 40 °C and 100 °C were exceeded.
Results obtained from two consecutive periods of changing the operating oil in the engine give a broader perspective than relying on just one source of information. Results obtained from single replacement cycles mark limitations in current practices relying solely on time or mileage intervals.
The authors acknowledge the limited research on intercity buses and consider their findings preliminary. They recommend conducting a more extensive study on engine oil degradation that includes a larger sample of vehicles operating in both urban and intercity conditions and adding an on-board diagnostic (OBD) data logger to vehicles’ logger to provide valuable data on speed, engine operating temperature, load/altitude, and operating time to confirm the conclusions drawn in this article.
5. Limitations
There are further research plans to use an OBD data logger to provide valuable data on engine temperature changes in real operating conditions, as well as the engine operation time, mileage, fuel consumption, average speed, and idle ratio. Because in the present work the authors had limited data from the adopted procedure on actual working conditions, correlating data from an OBD to anomalies in oil condition markers such as the degree of oxidation or fuel dilution could lead to additional findings on oil aging phenomena.
Author Contributions
Conceptualization, W.G.; methodology, A.W. and W.G.; validation, W.G. and A.W.; formal analysis, W.G.; investigation, W.G. and A.W.; resources, B.Š.; data curation, B.Š.; writing—original draft preparation, W.G. and A.W.; writing—review and editing, A.W.; visualization, W.G., A.W., and B.Š.; supervision, A.W.; project administration, B.Š.; funding acquisition, B.Š. All authors have read and agreed to the published version of the manuscript.
Funding
This research was funded by the VEGA project 1/0426/22. Quantification of the impact of road transport on the environment in urban areas. This research was funded by the KEGA project 041ŽU-4/2022. Implementation of students in the teaching process through the implementation of practical measurements in the form of driving and laboratory tests of road vehicles using multimedia tools. This research was funded by the project of institutional research of the Faculty of Operation and Economics of Transport and Communications, University of Žilina no. 2/KCMD/2023.
Data Availability Statement
The data presented in this study are available on request from the corresponding author.
Conflicts of Interest
The authors declare no conflicts of interest.
References
- ACEA. Fact Sheet: Buses; ACEA—European Automobile Manufacturers’ Association: Brussels, Belgium, 2023. [Google Scholar]
- Macian, V.; Tormos, B.; Miró, G.; Pérez, T. Assessment of Low-Viscosity Oil Performance and Degradation in a Heavy Duty Engine Real-World Fleet Test. Proc. Inst. Mech. Eng. Part J J. Eng. Tribol. 2016, 230, 729–743. [Google Scholar] [CrossRef]
- European Commission. Reducing CO2 Emissions from Heavy-Duty Vehicles. Available online: https://climate.ec.europa.eu/eu-action/transport/road-transport-reducing-co2-emissions-vehicles/reducing-co2-emissions-heavy-duty-vehicles_en (accessed on 11 February 2024).
- International Council on Clean Transportation. A Roadmap for Heavy-Duty Engine CO2 Standards within the European Union Framework. Available online: https://theicct.org/publication/a-roadmap-for-heavy-duty-engine-co2-standards-within-the-european-union-framework/ (accessed on 11 February 2024).
- Norris, J.; Escher, G. Heavy Duty Vehicles Technology Potential and Cost Study. Int. Counc. Clean Transp. 2017. Available online: https://theicct.org/publications/heavy-duty-vehicles-technology-potential-and-cost-study (accessed on 11 February 2024).
- Van Dam, W.; Kleijwegt, P.; Torreman, M.; Parsons, G. The Lubricant Contribution to Improved Fuel Economy in Heavy Duty Diesel Engines; SAE: Melbourne, Australian, 2009; p. 2009-01-2856. [Google Scholar]
- Rahnejat, H. Tribology and Dynamics of Engine and Powertrain: Fundamentals, Applications and Future Trends; Elsevier: Amsterdam, The Netherlands, 2010; ISBN 1-84569-993-9. [Google Scholar]
- Lakshminarayanan, P.; Nayak, N.S. Critical Component Wear in Heavy Duty Engines; John Wiley & Sons: Hoboken, NJ, USA, 2011; ISBN 0-470-82885-4. [Google Scholar]
- Wong, V.W.; Tung, S.C. Overview of Automotive Engine Friction and Reduction Trends–Effects of Surface, Material, and Lubricant-Additive Technologies. Friction 2016, 4, 1–28. [Google Scholar] [CrossRef]
- Gołębiowski, W.; Wolak, A.; Zając, G. The Influence of the Presence of a Diesel Particulate Filter (DPF) on the Physical and Chemical Properties as Well as the Degree of Concentration of Trace Elements in Used Engine Oils. Pet. Sci. Technol. 2019, 37, 746–755. [Google Scholar] [CrossRef]
- Macián, V.; Tormos, B.; Bastidas, S.; Pérez, T. Improved Fleet Operation and Maintenance through the Use of Low Viscosity Engine Oils: Fuel Economy and Oil Performance. Eksploat. Niezawodn.—Maint. Reliab. 2020, 22, 201–211. [Google Scholar] [CrossRef]
- de Jonge, B.; Scarf, P.A. A Review on Maintenance Optimization. Eur. J. Oper. Res. 2020, 285, 805–824. [Google Scholar] [CrossRef]
- Hamasha, M.M.; Bani-Irshid, A.H.; Al Mashaqbeh, S.; Shwaheen, G.; Al Qadri, L.; Shbool, M.; Muathen, D.; Ababneh, M.; Harfoush, S.; Albedoor, Q. Strategical Selection of Maintenance Type under Different Conditions. Sci. Rep. 2023, 13, 15560. [Google Scholar] [CrossRef] [PubMed]
- Kučera, M.; Kopčanová, S.; Sejkorová, M. Lubricant Analysis as the Most Useful Tool in the Proactive Maintenance Philosophies of Machinery and Its Components. Manag. Syst. Prod. Eng. 2020, 28, 196–201. [Google Scholar] [CrossRef]
- Pichler, J.; Maria Eder, R.; Besser, C.; Pisarova, L.; Dörr, N.; Marchetti-Deschmann, M.; Frauscher, M. A Comprehensive Review of Sustainable Approaches for Synthetic Lubricant Components. Green Chem. Lett. Rev. 2023, 16, 2185547. [Google Scholar] [CrossRef]
- Raposo, H.; Farinha, J.T.; Fonseca, I.; Galar, D. Predicting Condition Based on Oil Analysis—A Case Study. Tribol. Int. 2019, 135, 65–74. [Google Scholar] [CrossRef]
- Wakiru, J.M.; Pintelon, L.; Muchiri, P.N.; Chemweno, P.K. A Review on Lubricant Condition Monitoring Information Analysis for Maintenance Decision Support. Mech. Syst. Signal Process. 2019, 118, 108–132. [Google Scholar] [CrossRef]
- Agocs, A.; Nagy, A.L.; Ristic, A.; Tabakov, Z.M.; Raffai, P.; Besser, C.; Frauscher, M. Oil Degradation Patterns in Diesel and Petrol Engines Observed in the Field—An Approach Applying Mass Spectrometry. Lubricants 2023, 11, 404. [Google Scholar] [CrossRef]
- Dörr, N.; Brenner, J.; Ristić, A.; Ronai, B.; Besser, C.; Pejaković, V.; Frauscher, M. Correlation between Engine Oil Degradation, Tribochemistry, and Tribological Behavior with Focus on ZDDP Deterioration. Tribol. Lett. 2019, 67, 62. [Google Scholar] [CrossRef]
- Sakamoto, K.; Mizutani, F.; Shimomura, M.; Yama, K.; Matsunaga, T.; Lee, S.-S. Evaluation of Engine Oil Degradation Based on Viscosity and Transmitted Light Intensity Measurements. Sens. Actuators Phys. 2023, 361, 114597. [Google Scholar] [CrossRef]
- Shinde, H.M.; Bewoor, A.K. Evaluating Petrol Engine Oil Deterioration through Oxidation and Nitration Parameters by Low-Cost IR Sensor. Appl. Petrochem. Res. 2020, 10, 83–94. [Google Scholar] [CrossRef]
- Uy, D.; Simko, S.J.; Carter, R.O.; Jensen, R.K.; Gangopadhyay, A.K. Characterization of Anti-Wear Films Formed from Fresh and Aged Engine Oils. Wear 2007, 263, 1165–1174. [Google Scholar] [CrossRef]
- Mendes, C.; Raposo, H.; Ferraz, R.; Farinha, J.T. The Economic Management of Physical Assets: The Practical Case of an Urban Passenger Transport Company in Portugal. Sustainability 2023, 15, 11492. [Google Scholar] [CrossRef]
- Martins, A.; Fonseca, I.; Farinha, J.T.; Reis, J.; Cardoso, A.J.M. Maintenance Prediction through Sensing Using Hidden Markov Models—A Case Study. Appl. Sci. 2021, 11, 7685. [Google Scholar] [CrossRef]
- Nagy, A.L.; Agocs, A.; Ronai, B.; Raffai, P.; Rohde-Brandenburger, J.; Besser, C.; Dörr, N. Rapid Fleet Condition Analysis through Correlating Basic Vehicle Tracking Data with Engine Oil FT-IR Spectra. Lubricants 2021, 9, 114. [Google Scholar] [CrossRef]
- Rodrigues, J.; Costa, I.; Farinha, J.T.; Mendes, M.; Margalho, L. Predicting Motor Oil Condition Using Artificial Neural Networks and Principal Component Analysis. Eksploat. Niezawodn. 2020, 22, 440–448. [Google Scholar] [CrossRef]
- Gołębiowski, W.; Zając, G.; Sejkorová, M.; Wolak, A. Assessment of Oil Change Intervals in Urban Buses Based on the Selected Physicochemical Properties of Used Engine Oils. Combust. Engines 2024, 196, 15–23. [Google Scholar] [CrossRef]
- Sejkorová, M.; Šarkan, B.; Veselík, P.; Hurtová, I. FTIR Spectrometry with PLS Regression for Rapid TBN Determination of Worn Mineral Engine Oils. Energies 2020, 13, 6438. [Google Scholar] [CrossRef]
- Al Sheikh Omar, A.; Salehi, F.M.; Farooq, U.; Neville, A.; Morina, A. Effect of Zinc Dialkyl Dithiophosphate Replenishment on Tribological Performance of Heavy-Duty Diesel Engine Oil. Tribol. Lett. 2022, 70, 24. [Google Scholar] [CrossRef] [PubMed]
- Hönig, V.; Procházka, P.; Obergruber, M.; Kučerová, V.; Mejstřík, P.; Macků, J.; Bouček, J. Determination of Tractor Engine Oil Change Interval Based on Material Properties. Materials 2020, 13, 5403. [Google Scholar] [CrossRef]
Figure 1.
Buses: SOR CN 10,5 (a) and Solaris Urbino 10,5 (b).

Figure 2.
Engine N67 (a) and B6.7 (b).

Figure 3.
Percentage changes in the kinematic viscosity at 40 °C of the tested oil samples.

Figure 4.
Percentage changes in the kinematic viscosity at 100 °C of the tested oil samples.

Figure 5.
Changes in viscosity between oil intervals.

Figure 6.
FTIR spectrum—soot content in oil.

Figure 7.
Soot content in the tested oil samples (reading in ~2000 cm−1 + reading in ~3980 cm−1)/2).
Figure 7.
Soot content in the tested oil samples (reading in ~2000 cm−1 + reading in ~3980 cm−1)/2).

Figure 8.
FTIR spectrum—the amount of impurities in the tested oils.

Figure 9.
Changes in additives between oil intervals.

Figure 10.
FTIR spectrum—nitro-oxidation and oxidation levels in the tested oils.

Figure 11.
FTIR spectrum—sulfonation levels in the tested oils.

Figure 12.
Changes in degradation between oil intervals.


Table 1.
Properties of the new engine oil used in this research.
| New Oil Properties | Value | |
|---|---|---|
| Oil specifications | SAE viscosity classification | 10W40 |
| ACEA | E7, E9 | |
| API | CK-4 | |
| Physicochemical properties | Kinematic viscosity at 40 °C [mm2/s] | 94 |
| Kinematic viscosity at 100 °C [mm2/s] | 14.9 | |
| Viscosity index | 165 | |
| Total base number (TBN) | 9.5 | |
| Elemental composition | Calcium (Ca) [mg/kg] | 1047 |
| Phosphor (P) [mg/kg] | 971 | |
| Sulfur (S) [mg/kg] | 3011 | |
| Zinc (Zn) [mg/kg] | 1194 | |
Table 2.
Characteristics of the obtained engine oil samples.
| Sample Information Section | Oil Refills Section | ||||||
|---|---|---|---|---|---|---|---|
| No. | Sample Code | Bus Model | Operating Conditions | Bus Mileage [km] | Mileage Since Last Oil Change [km] | Amount of Oil Refilled [L] | Number of Days before Oil Sample Collecion |
| 1 | PD489IA | SOR E6 Low | intercity | 30,000 | 30,000 | 0 | -- |
| 2 | PD489IA_2 | SOR E6 Low | intercity | 60,000 | 30,000 | 3 | 4 |
| 3 | PD310IA | SOR E6 | intercity | 28,524 | 28,524 | 5 | 16 |
| 4 | PD310IA_2 | SOR E6 | intercity | 62,000 | 33,476 | 7 | 44 |
| 5 | PD496HG | Solaris E6 | city | 213,000 | 30,000 | 7 | 33 |
| 6 | PD496HG_2 | Solaris E6 | city | 242,000 | 29,000 | 3 | 28 |
| 7 | PD724HF | Solaris E6 | city | 185,000 | 26,000 | 4 | 118 |
| 8 | PD724HF_2 | Solaris E6 | city | 220,740 | 35,740 | 3 | 43 |
| 9 | PD587HG | Solaris E6 | city | 220,900 | 31,900 | 7 | 12 |
| 10 | PD587HG_2 | Solaris E6 | city | 248,000 | 27,100 | 3 | 40 |
| 11 | PD654GN | Solaris E6 | city | 295,000 | 34,000 | 5 | 3 |
| 12 | PD654GN_2 | Solaris E6 | city | 354,577 | 30,777 | 7 | 19 |
| 13 | PD382GY | Solaris E6 | city | 252,200 | 18,275 | 3 | 66 |
| 14 | PD382GY_2 | Solaris E6 | city | 285,000 | 35,000 | 10 | 18 |
Table 3.
Engine specifications of the research objects.
| Vehicle Brand | SOR | Solaris | Solaris |
|---|---|---|---|
| Type | CN 10,5 | Urbino 10,5 | Urbino 10,5 |
| Type of bus | Intercity | City | City |
| Registration numbers | PD489IA PD310IA | PD382GY, PD587HG, PD724HF, PD496HG | PD654GN |
| Year of production | 2022 | 2020 | 2018 |
| Engine manufacturer | FPT INDUSTRIAL | CUMMINS ENGINE | CUMMINS ENGINE |
| Engine model | N67 | B6.7 | B6.7 |
| Displacement | 6728 | 6700 | 6700 |
| Engine power/rpm | 184 kW/2500 rpm | 182 kW/2100 rpm | 204 kW/2100 rpm |
| Maximum torque/rpm torque | 950 Nm/1400 rpm | 1000 Nm/1000 rpm | 1100 Nm/1000 rpm |
| Emission class | 595/2009*2018/932D (EURO VI) | 595/2009*2018/932D (EURO VI) | 595/2009*627/2014C (EURO VI) |
| Transmision/degrees | Automatic/6 | Automatic/4 | Automatic/4 |
| Tank capacity | 255 L | 310 L | 310 L |
| Oil pan capacity | 15 L | 28 L | 28 L |
Table 4.
Blotter spot tests of oil samples.
| Exploitation Conditions | Intercity | City | ||||||
|---|---|---|---|---|---|---|---|---|
| Bus no. | PD489IA | PD496HG | PD587HG | PD382GY | ||||
| Interval | I | II | I | II | I | II | I | II |
| One drop (after 1 h) |  | |||||||
| One drop (after 24 h) | ||||||||
| Bus no. | PD310IA | PD724HF | PD654GN | |||||
| Interval | I | II | I | II | I | II | ||
| One drop (after 1 h) |  | |||||||
| One drop (after 24 h) | ||||||||
Table 5.
Characteristics of changes in dispersing properties in intercity and city buses.
| Exploitation Conditions | Intercity | City | ||
|---|---|---|---|---|
| Bus no. | PD489IA ** | PD496HG * | ||
| Overal mileage [km] | 30,000 | 60,000 | 213,000 | 242,000 |
| Mileage since last oil change [km] | 30,000 | 30,000 | 30,000 | 29,000 |
| Blotter spot test (single drop after 24 h) |  | |||
| Bus no. | PD310IA ** | PD382GY */** | ||
| Overal mileage [km] | 28,524 | 60,000 | 252,200 | 285,000 |
| Mileage since last oil change [km] | 28,524 | 30,000 | 18,275 * | 35,000 ** |
| Blotter spot test (single drop after 24 h) |  | |||
* Examples of good engine oil properties after a specific mileage of exploitation; ** Examples of bad engine oil properties after a specific mileage of exploitation.
Table 6.
Examples of the most contaminated oils in the blotter spot test.
| Sample | PD724HF | PD724HF_2 | PD382GY_2 |
|---|---|---|---|
| Overal mileage [km] | 185,000 | 220,740 | 285,000 |
| Mileage since last oil change [km] | 26,000 | 35,740 | 35,000 |
| Blotter spot test (three drops after 24 h) |  | ||
Table 7.
Concentrations of abrasive metals and additives in the tested oils.
| Sample Data | Abrasive Metals | Additives | |||||||
|---|---|---|---|---|---|---|---|---|---|
| Operating Condition | Sample Code | Overal Mileage [km] | Mileage on Oil [km] | Cu [ppm] | Fe [ppm] | P [ppm] | Zn [ppm] | Ca [ppm] | S [ppm] |
| ± SD | ± SD | ± SD | ± SD | ± SD | ± SD | ||||
| Intercity | PD489IA | 30,000 | 30,000 | 170 ± 0.58 | 114 ± 0.58 | 844 ± 12.12 | 1164 ± 0.58 | 1062 ± 6.43 | 2414 ± 10.15 |
| PD489IA_2 | 60,000 | 30,000 | 33.2 ± 0.21 | 76.73 ± 0.80 | 896 ± 6.11 | 1206 ± 2.08 | 1114 ± 3.79 | 2574 ± 12.10 | |
| PD310IA | 28,524 | 28,524 | 155.67 ± 0.58 | 95.08 ± 0.24 | 840 ± 18.25 | 1158 ± 3.06 | 1026 ± 4.93 | 2352 ± 9.50 | |
| PD310IA_2 | 62,000 | 33,476 | 32.24 ± 0.24 | 92.26 ± 0.23 | 879 ± 5.77 | 1215 ± 2.65 | 1112 ± 1.53 | 2450 ± 25.24 | |
| City | PD496HG | 213,000 | 30,000 | 1.2 ± 0.09 | 41.18 ± 0.56 | 908 ± 26.03 | 1202 ± 1.53 | 1104 ± 4.58 | 2663 ± 18.93 |
| PD496HG_2 | 242,000 | 29,000 | 1.16 ± 0.06 | 39.85 ± 0.24 | 919 ± 23.12 | 1226 ± 0.58 | 1115 ± 3.00 | 2659 ± 6.11 | |
| PD724HF | 185,000 | 26,000 | 0.88 ± 0.06 | 41.16 ± 0.32 | 841 ± 31.90 | 1125 ± 1.53 | 1004 ± 6.66 | 2481 ± 19.40 | |
| PD724HF_2 | 220,740 | 35,740 | 0.94 ± 0.05 | 51.3 ± 0.33 | 834 ± 13.75 | 1116 ± 1.73 | 978 ± 1.15 | 2360 ± 4.04 | |
| PD587HG | 220,900 | 31,900 | 1.62 ± 0.01 | 47.16 ± 0.38 | 924 ± 24.01 | 1231 ± 2.65 | 1116 ± 3.79 | 2707 ± 18.33 | |
| PD587HG_2 | 248,000 | 27,100 | 1.33 ± 0.06 | 43.02 ± 0.32 | 870 ± 4.73 | 1211 ± 1.53 | 1027 ± 4.16 | 2454 ± 5.69 | |
| PD654GN | 295,000 | 34,000 | 0.67 ± 0.03 | 58.12 ± 0.11 | 862 ± 10.02 | 1147 ± 0.58 | 1032 ± 3.61 | 2558 ± 18.52 | |
| PD654GN_2 | 354,777 | 30,777 | 0.63 ± 0.11 | 51.67 ± 3.60 | 824 ± 12.06 | 1132 ± 1.53 | 1014 ± 25.71 | 2540 ± 17.01 | |
| PD382GY | 252,200 | 18,275 | 0.61 ± 0.03 | 28.4 ± 0.29 | 936 ± 5.86 | 1187 ± 0.58 | 1117 ± 12.49 | 2781 ± 18.45 | |
| PD382GY_2 | 285,000 | 35,000 | 0.88 ± 0.05 | 43.63 ± 0.08 | 871 ± 17.62 | 1164 ± 0.58 | 1027 ± 8.74 | 2486 ± 7.55 | |
—arithmetic average, SD—Standard deviation
Table 8.
Concentrations of abrasive metals in the tested oils.
| Operating Condition | Sample Code | Overal Mileage [km] | Mileage on Oil [km] | Oxidation | Nitration | Sulfonation |
|---|---|---|---|---|---|---|
| [abs/0.1 mm] | [abs/0.1 mm] | [abs/0.1 mm] | ||||
| Intercity | PD489IA | 30,000 | 30,000 | 0.147 | 0.017 | 0.145 |
| PD489IA_2 | 60,000 | 30,000 | 0.151 | 0.016 | 0.150 | |
| PD310IA | 28,524 | 28,524 | 0.122 | 0.013 | 0.119 | |
| PD310IA_2 | 62,000 | 33,476 | 0.185 | 0.019 | 0.173 | |
| City | PD496HG | 213,000 | 30,000 | 0.211 | 0.070 | 0.190 |
| PD496HG_2 | 242,000 | 29,000 | 0.207 | 0.047 | 0.179 | |
| PD724HF | 185,000 | 26,000 | 0.249 | 0.150 | 0.215 | |
| PD724HF_2 | 220,740 | 35,740 | 0.330 | 0.227 | 0.267 | |
| PD587HG | 220,900 | 31,900 | 0.212 | 0.071 | 0.195 | |
| PD587HG_2 | 248,000 | 27,100 | 0.215 | 0.054 | 0.191 | |
| PD654GN | 295,000 | 34,000 | 0.228 | 0.087 | 0.202 | |
| PD654GN_2 | 354,777 | 30,777 | 0.214 | 0.088 | 0.196 | |
| PD382GY | 252,200 | 18,275 | 0.171 | 0.049 | 0.146 | |
| PD382GY_2 | 285,000 | 35,000 | 0.318 | 0.226 | 0.254 |
Disclaimer/Publisher’s Note: The statements, opinions and data contained in all publications are solely those of the individual author(s) and contributor(s) and not of MDPI and/or the editor(s). MDPI and/or the editor(s) disclaim responsibility for any injury to people or property resulting from any ideas, methods, instructions or products referred to in the content. |
© 2024 by the authors. Licensee MDPI, Basel, Switzerland. This article is an open access article distributed under the terms and conditions of the Creative Commons Attribution (CC BY) license (https://creativecommons.org/licenses/by/4.0/).
Share and Cite
MDPI and ACS Style
Gołębiowski, W.; Wolak, A.; Šarkan, B. Engine Oil Degradation in the Real-World Bus Fleet Test Based on Two Consecutive Operational Intervals. Lubricants 2024, 12, 101. https://doi.org/10.3390/lubricants12030101
AMA Style
Gołębiowski W, Wolak A, Šarkan B. Engine Oil Degradation in the Real-World Bus Fleet Test Based on Two Consecutive Operational Intervals. Lubricants. 2024; 12(3):101. https://doi.org/10.3390/lubricants12030101
Chicago/Turabian StyleGołębiowski, Wojciech, Artur Wolak, and Branislav Šarkan. 2024. "Engine Oil Degradation in the Real-World Bus Fleet Test Based on Two Consecutive Operational Intervals" Lubricants 12, no. 3: 101. https://doi.org/10.3390/lubricants12030101
Note that from the first issue of 2016, this journal uses article numbers instead of page numbers. See further details here.