Optimizing Load Capacity Predictions in Gas Foil Thrust Bearings: A Novel Full-Ramp Model


School of Mechanical Engineering, Beijing Institute of Technology, Beijing 100081, China
*
Author to whom correspondence should be addressed.
Lubricants 2024, 12(3), 76; https://doi.org/10.3390/lubricants12030076
Submission received: 6 February 2024
/
Revised: 24 February 2024
/
Accepted: 26 February 2024
/
Published: 27 February 2024
Abstract
:Gas film thickness significantly influences the performance prediction of Gas Foil Thrust Bearings (GFTB). However, the Classical Model (CM) for GFTBs exhibits inaccuracies in describing gas film thickness. In this paper, we explore the differences in the details of gas film thickness modeling and propose a Parallel Segmentation Model (PSM), which fixes the errors of the CM in describing the gas film thickness in the ramp section, and a Full-Ramp Model (FRM), to which a more realistic description of the gas film in the flat section is also added. Comparative analysis, utilizing a publicly available test dataset based on the open-source GFTB structure, establishes that the FRM surpasses the CM and PSM in accurately predicting load capacity. In-depth analysis shows that the location of the minimum gas film thickness for determining the load capacity is located at the innermost circle of the free end of the top foil, whereas the FRM is subjected to the same load with a larger film thickness at this location, which may be due to the unique geometry of the top foil of the FRM. Subsequently, employing the FRM, a parametric study explores load capacity in GFTB, considering variables such as ramp height, top foil thickness, bump foil stiffness, ramp section extent, and top foil area. The results demonstrate that GFTB load capacity exhibits a linear increase with the expansion of the top foil area. Moreover, the load capacity increases with augmented top foil thickness and bump foil stiffness, albeit at a decreasing rate. Additionally, an increase in ramp section extent initially enhances load capacity, reaching a maximum value before declining. Similarly, an increase in ramp height initially augments load capacity, attaining a maximum before subsequent diminution.
1. Introduction
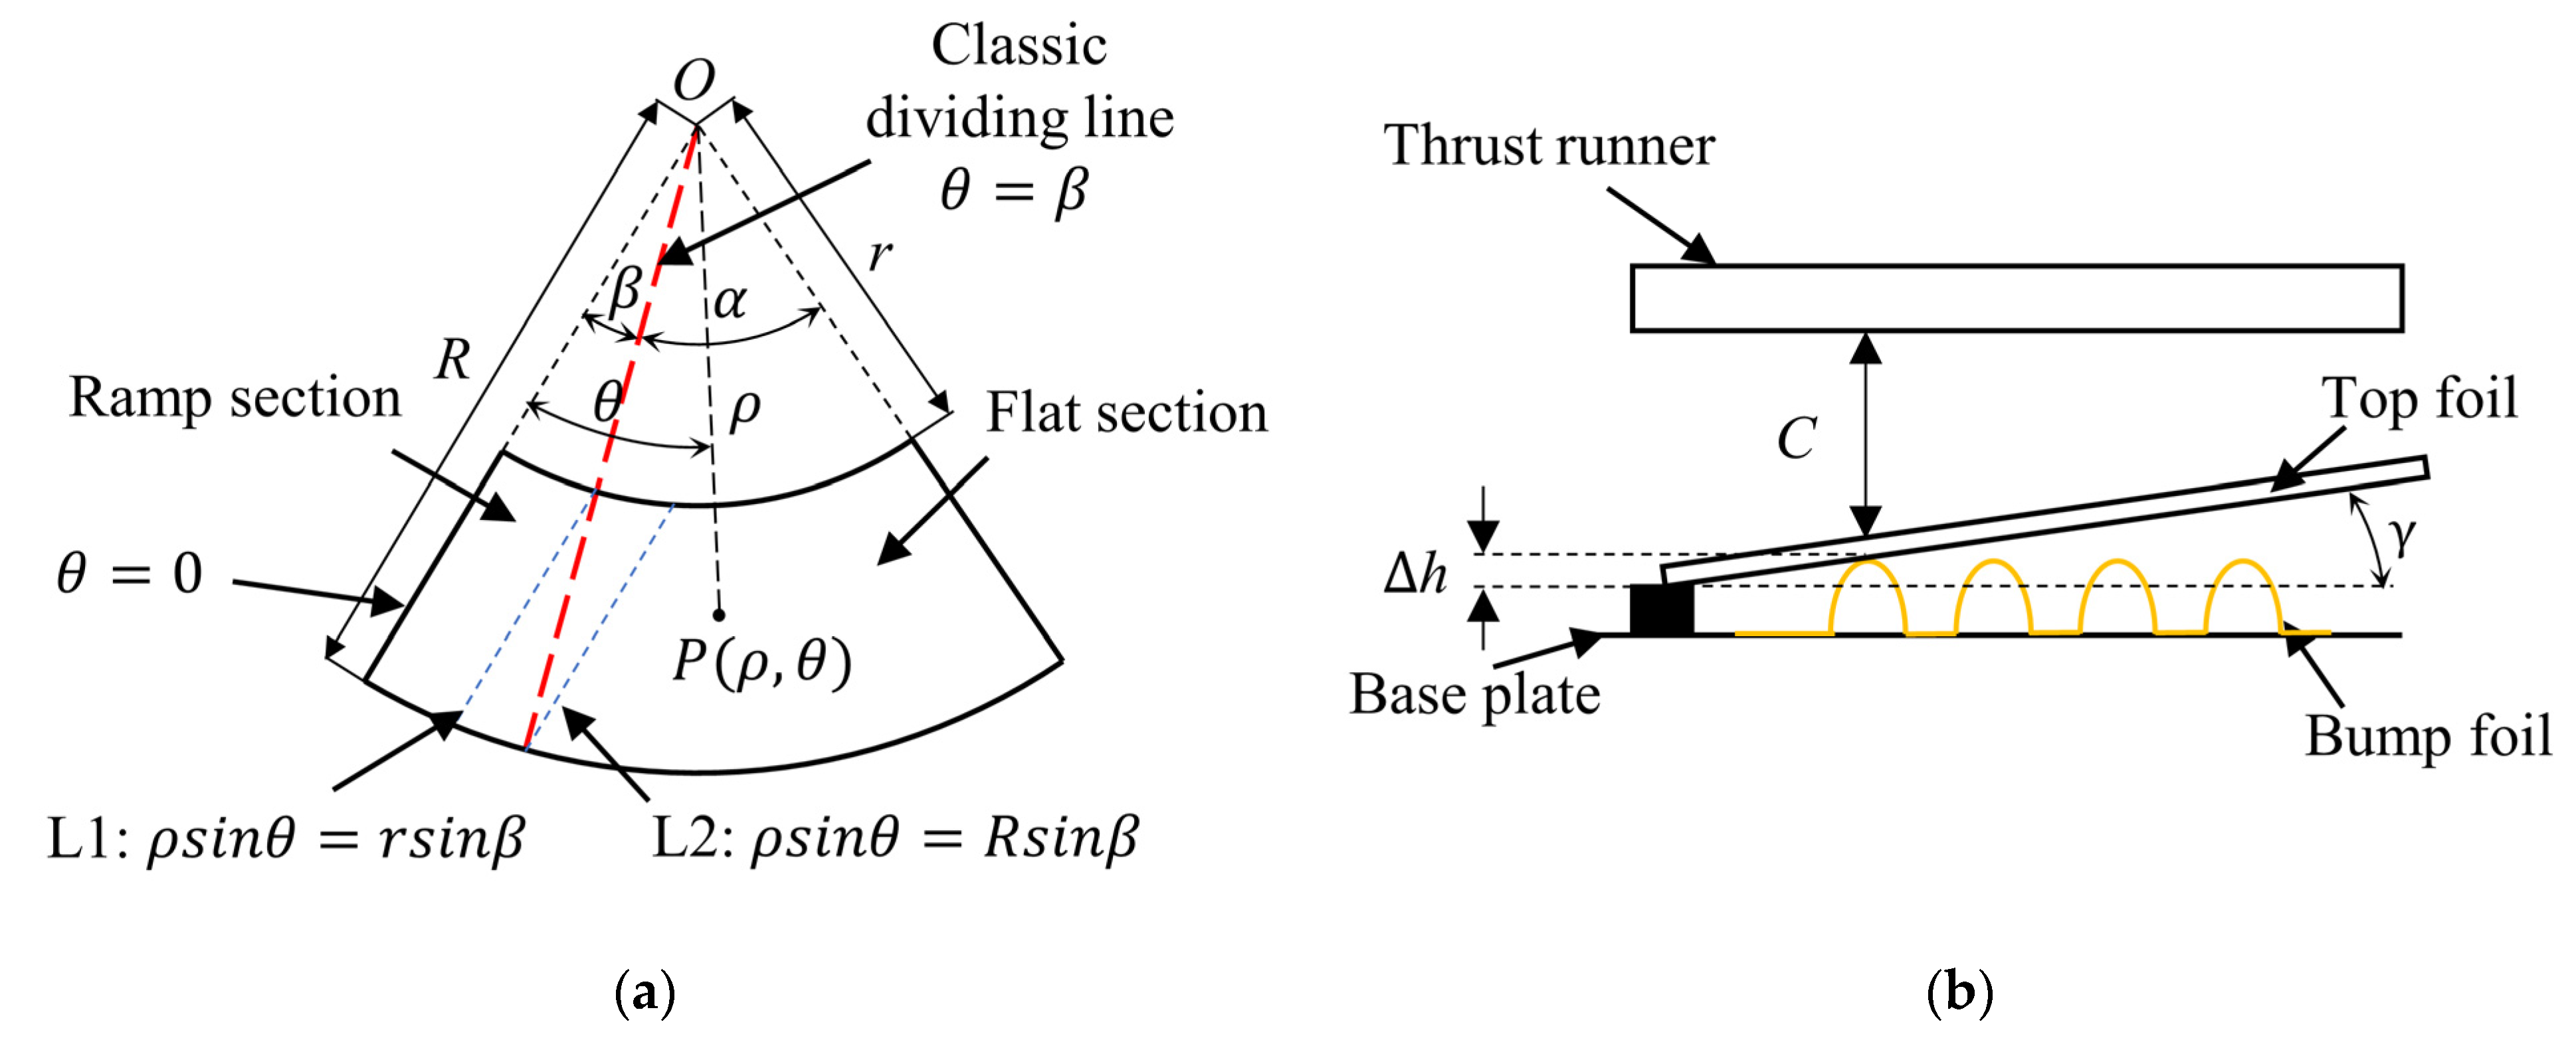
The integral role of gas foil bearings (GFB) within oil-free turbomachinery encompasses two crucial components: gas foil journal bearings (GFJB) [1,2,3,4,5], responsible for radial forces, and gas foil thrust bearings (GFTB) [6,7,8,9,10], dedicated to axial forces. The Classical Model (CM) for GFTB, depicted in Figure 1, comprises top foils, bump foils, and a base plate for fixation. The top foil can be divided into a ramp section and a flat section according to its shape. The distance between the ramp section of the top foil and the base plate changes gradually, which pressurizes the gas through the wedge effect, while the distance between the flat section and the base plate remains unchanged, which is used to maintain the gas pressure after pressurization. The bump foil consists of a series of corrugated projections used to provide support for the top foil. Most GFTB ramp sections do not have bump foil support [11,12,13,14,15,16], mainly because the ramp height ∆h is mostly in the range of tens to hundreds of micrometers (excessive ramp height can weaken the load capacity of the GFTB [17,18]), and the bump foil projections are generally press molded, which makes it difficult to control the smooth transition of the bump crests with precision.
Numerous GFTBs are characterized using this model [19,20,21,22,23,24,25]. However, the CM presents an idealized representation. Firstly, dividing the entire top foil into a ramp and a flat section through a bending process is impractical, given the precision required for the typically small dimensions of the ramp height (tens to hundreds of micrometers) and the top foil thickness (hundreds of micrometers). Even if precision bending were achievable, the resulting ramp and flat sections would essentially be two parts of the same foil formed by the bending process. As the top foil is an annular sector, the radial edges of the sector cannot be simultaneously parallel to the base plate after bending, as illustrated in Figure 2. This complicates top foil fixation to the base plate, and attempting to forcibly weld one side to the base plate results in uneven outer and inner rim heights.
Consequently, the CM’s theoretical validity does not align with practical top foil structures. To address this, a common solution involves mounting the top foil directly onto the base plate at an inclined angle, bypassing the need for precision bends, a configuration referred to in this paper as the Full-Ramp Model (FRM). There are differences between GFTBs manufactured in this simplified way and the CM, one obvious difference is the absence of a flat section for the FRM, how this affects performance is unclear and it has been shown that this mounting leads to unanticipated wear [21]. On the other hand, the CM assumes uniform gas film thickness at points sharing the same angular coordinates on the top foil, a notion inconsistent with reality. For the CM, the gas film thickness is most widely described as [20]
where HC is the gas film thickness in the CM; C is the nominal clearance, defined as the distance from the flat section to the thrust runner; ∆h is the ramp height; θ is the angular coordinate; β is the ramp section extent; α is the flat section extent; and δ is the top foil deformation.
The gas film thickness HC in Equation (1) is radius-independent, assuming that points with the same angular coordinate possess identical gas film thickness before deformation. However, given the inclined mounting of the top foil, points on the same straight line parallel to the fixed edge should share the same gas film thickness, introducing a gas film thickness discrepancy in the ramp section between the CM and real GFTBs. The implications of this discrepancy in predictions remain unclear.
To address these issues, we developed three models to assess their impact on predicted results: the CM, adhering to classical gas film thickness definition; the Parallel Segmentation Model (PSM), retaining the flat section and rectifying gas film thickness description errors in the CM’s ramp section; and the FRM, which eliminates the flat section and designates the entire top foil plane as a ramp instead. By comparing predictions with publicly available test data of the open-source GFTB structure, discrepancies between CM, PSM, and FRM predictions are analyzed, shedding light on the reasons behind these differences. Then, the load capacity of GFTB is parametrically investigated using FRM.
2. GFTB Mathematical Model
2.1. Gas Film Thickness Model
Given the structural symmetry in the GFTB, the analysis focuses on a single top foil for simplicity. To rectify the gas film thickness error present in the CM within the ramp section, it is imperative to correct the dividing line between the ramp and flat sections in the CM. As described earlier, points along a line parallel to the fixed edge of the top foil share the same height. Thus, in this study, line segments L1 and L2, parallel to the fixing edge, are designated as the real dividing lines on both sides of the classical ramp/flat dividing line, as illustrated in Figure 3a.
In the polar coordinate system, denoted by ρ and θ for radius and angular coordinates respectively. Let r be the inner radius of the top foil and R be the outer radius of the top foil, then the gas film thickness with line segment L1 as the real dividing line can be expressed as
Similarly, if the real dividing line is located at the line L2, the gas film thickness can be expressed as
Another easy way to think of the segmentation method is to take a line parallel to the fixed edge of the top foil as the real dividing line over the midpoint of the distance between L1 and L2, then, the gas film thickness can be expressed as
Collectively, models utilizing a ramp/flat section dividing line parallel to the fixed edge of the top foil are referred to as PSMs. Notably, numerous segmentation methods exist, but for the purpose of this paper, the segmentation closest to the CM’s definition of gas film thickness is chosen. When employing PSM, the bump foil coverage area undergoes changes due to alterations in the flat section. In this study, the bump foil coverage region of PSM is uniformly positioned beneath the flat section of the top foil.
In contrast, the top foil of the FRM is mounted on the base plate at an inclined angle (denoted as γ), and the bump foil covers an area consistent with the CM, as depicted in Figure 3b. It is easy to verify that the top foil is in point contact with the bump foil at this time, and the contact point is located at the inner circle of the fixed end of the bump foil, and the rest of the position of the top foil is overhanging. Given the absence of a flat section in the FRM, the definitions of nominal clearance, ramp height, flat section, and ramp section do not exist. To facilitate subsequent comparisons, the definitions of these parameters are introduced into the FRM and they are harmonized with the other models. The nominal clearance C of the FRM is defined as the distance from the undeformed bump foil to the thrust runner minus the top foil thickness, as shown in Figure 3b; the ramp height of the FRM uses the inclination angle γ between the top foil and the base plate, as an intermediate variable, defined as ; and the flat section of the FRM is defined as the area covered by the bump foil, while the ramp section is defined as the remaining area of the top foil. According to the above definition, the gas film thickness of the FRM can be expressed as
According to Equation (5), the error analysis of the gas film thickness of the FRM can be performed by defining the error as
The GFTB is assumed to be a regular configuration with . For region , the partial derivative of the error ε is expressed as
Clearly, the error ε in region is monotonically decreasing in the polar radius and polar angle, with a minimal value equal to , located at point . For region , since , it is easy to see that the minima value of the error is equal to , located at point .
In summary, the maximum value of the absolute value of the error ε is
Equation (8) shows that the larger the ratio R/r and , the larger the error.
2.2. Thin-Film Lubrication Model
Within the realm of thin-film lubrication, the adoption of the Reynolds equation, replacing the Navier-Stokes (N-S) equation, is deemed valid and sufficiently accurate under specific conditions. The following assumptions guide this application:
- (1)
- The flow is assumed to be laminar, the gas pressure is constant in the direction of the gas film thickness, and the gas velocity along that direction is zero.
- (2)
- The gas is treated as an ideal gas with constant viscosity.
- (3)
- The effect of inertial force is neglected.
- (4)
- There is no relative sliding on the bearing surface.
The dimensionless Reynolds equation can be expressed as
where the dimensionless gas film pressure , the dimensionless polar radius , the dimensionless gas film thickness , and the bearing number are expressed as
where pa is the ambient pressure, is the viscosity, and ω is the thrust runner rotational speed.
The dimensionless gas film thickness can be expressed as
where is the dimensionless top foil deformation, denoted by
where K is the foil structure stiffness per area, expressed as
where KTF is the top foil stiffness and KBF is the bump foil stiffness.
The determination of the top foil stiffness, KTF, involves employing the finite element method, treating the top foil as a shell. Regarding the bump foil stiffness, KBF, in the flat section, it can be modeled using linear stiffness equations, such as those proposed by Walowit [26] or Iordanoff [21], and is considered zero in the ramp section. Notably, as the GFTB configuration in this study is based on an open-source model, the corresponding bump foil stiffness has been previously established in other studies. In the subsequent parametric study, the bump foil stiffness will be varied across a wide range, and precise computation of the exact values is not imperative.
In the case of the FRM, a significant portion of the top foil remains uncontacted by the bump foil in the unloaded state. Consequently, the bump foil does not contribute stiffness when the top foil is not in contact with it. As a result, the foil structure stiffness per area for the FRM is presented as a segmented function of the gas film thickness, expressed as
Given the substantial deformations exhibited by the top foil of the FRM, finite element calculations employ the Green strain, rather than the Cauchy strain, to accommodate these pronounced deformations [27].
3. Comparison with Publicly Available Datasets
Dickman [28] published experimental results based on open-source bearing configurations (address: http://rave.ohiolink.edu/etdc/view?acc_num=case1270153301, accessed on 1 January 2024), and his test data have become the de facto standard for model predictions. Details of the configuration and manufacturing method of such GFTBs can be found in Ref [29]. However, crucial parameters, such as ramp height, were absent from the experimental GFTB data. To address these omissions, this paper utilizes empirical parameters provided by San Andrés [30], who employed the CM’s gas film thickness description and applied it to a GFTB with parameters akin to those used by Dickman [28].
In this section, the calculated results of CM, PSM, and FRM are compared with the experimental data of Dickman [28], and the calculated results of CM are compared with the predictions given by San Andrés [30] to validate the model’s accuracy.
The parameters of the GFTB are shown in Table 1.
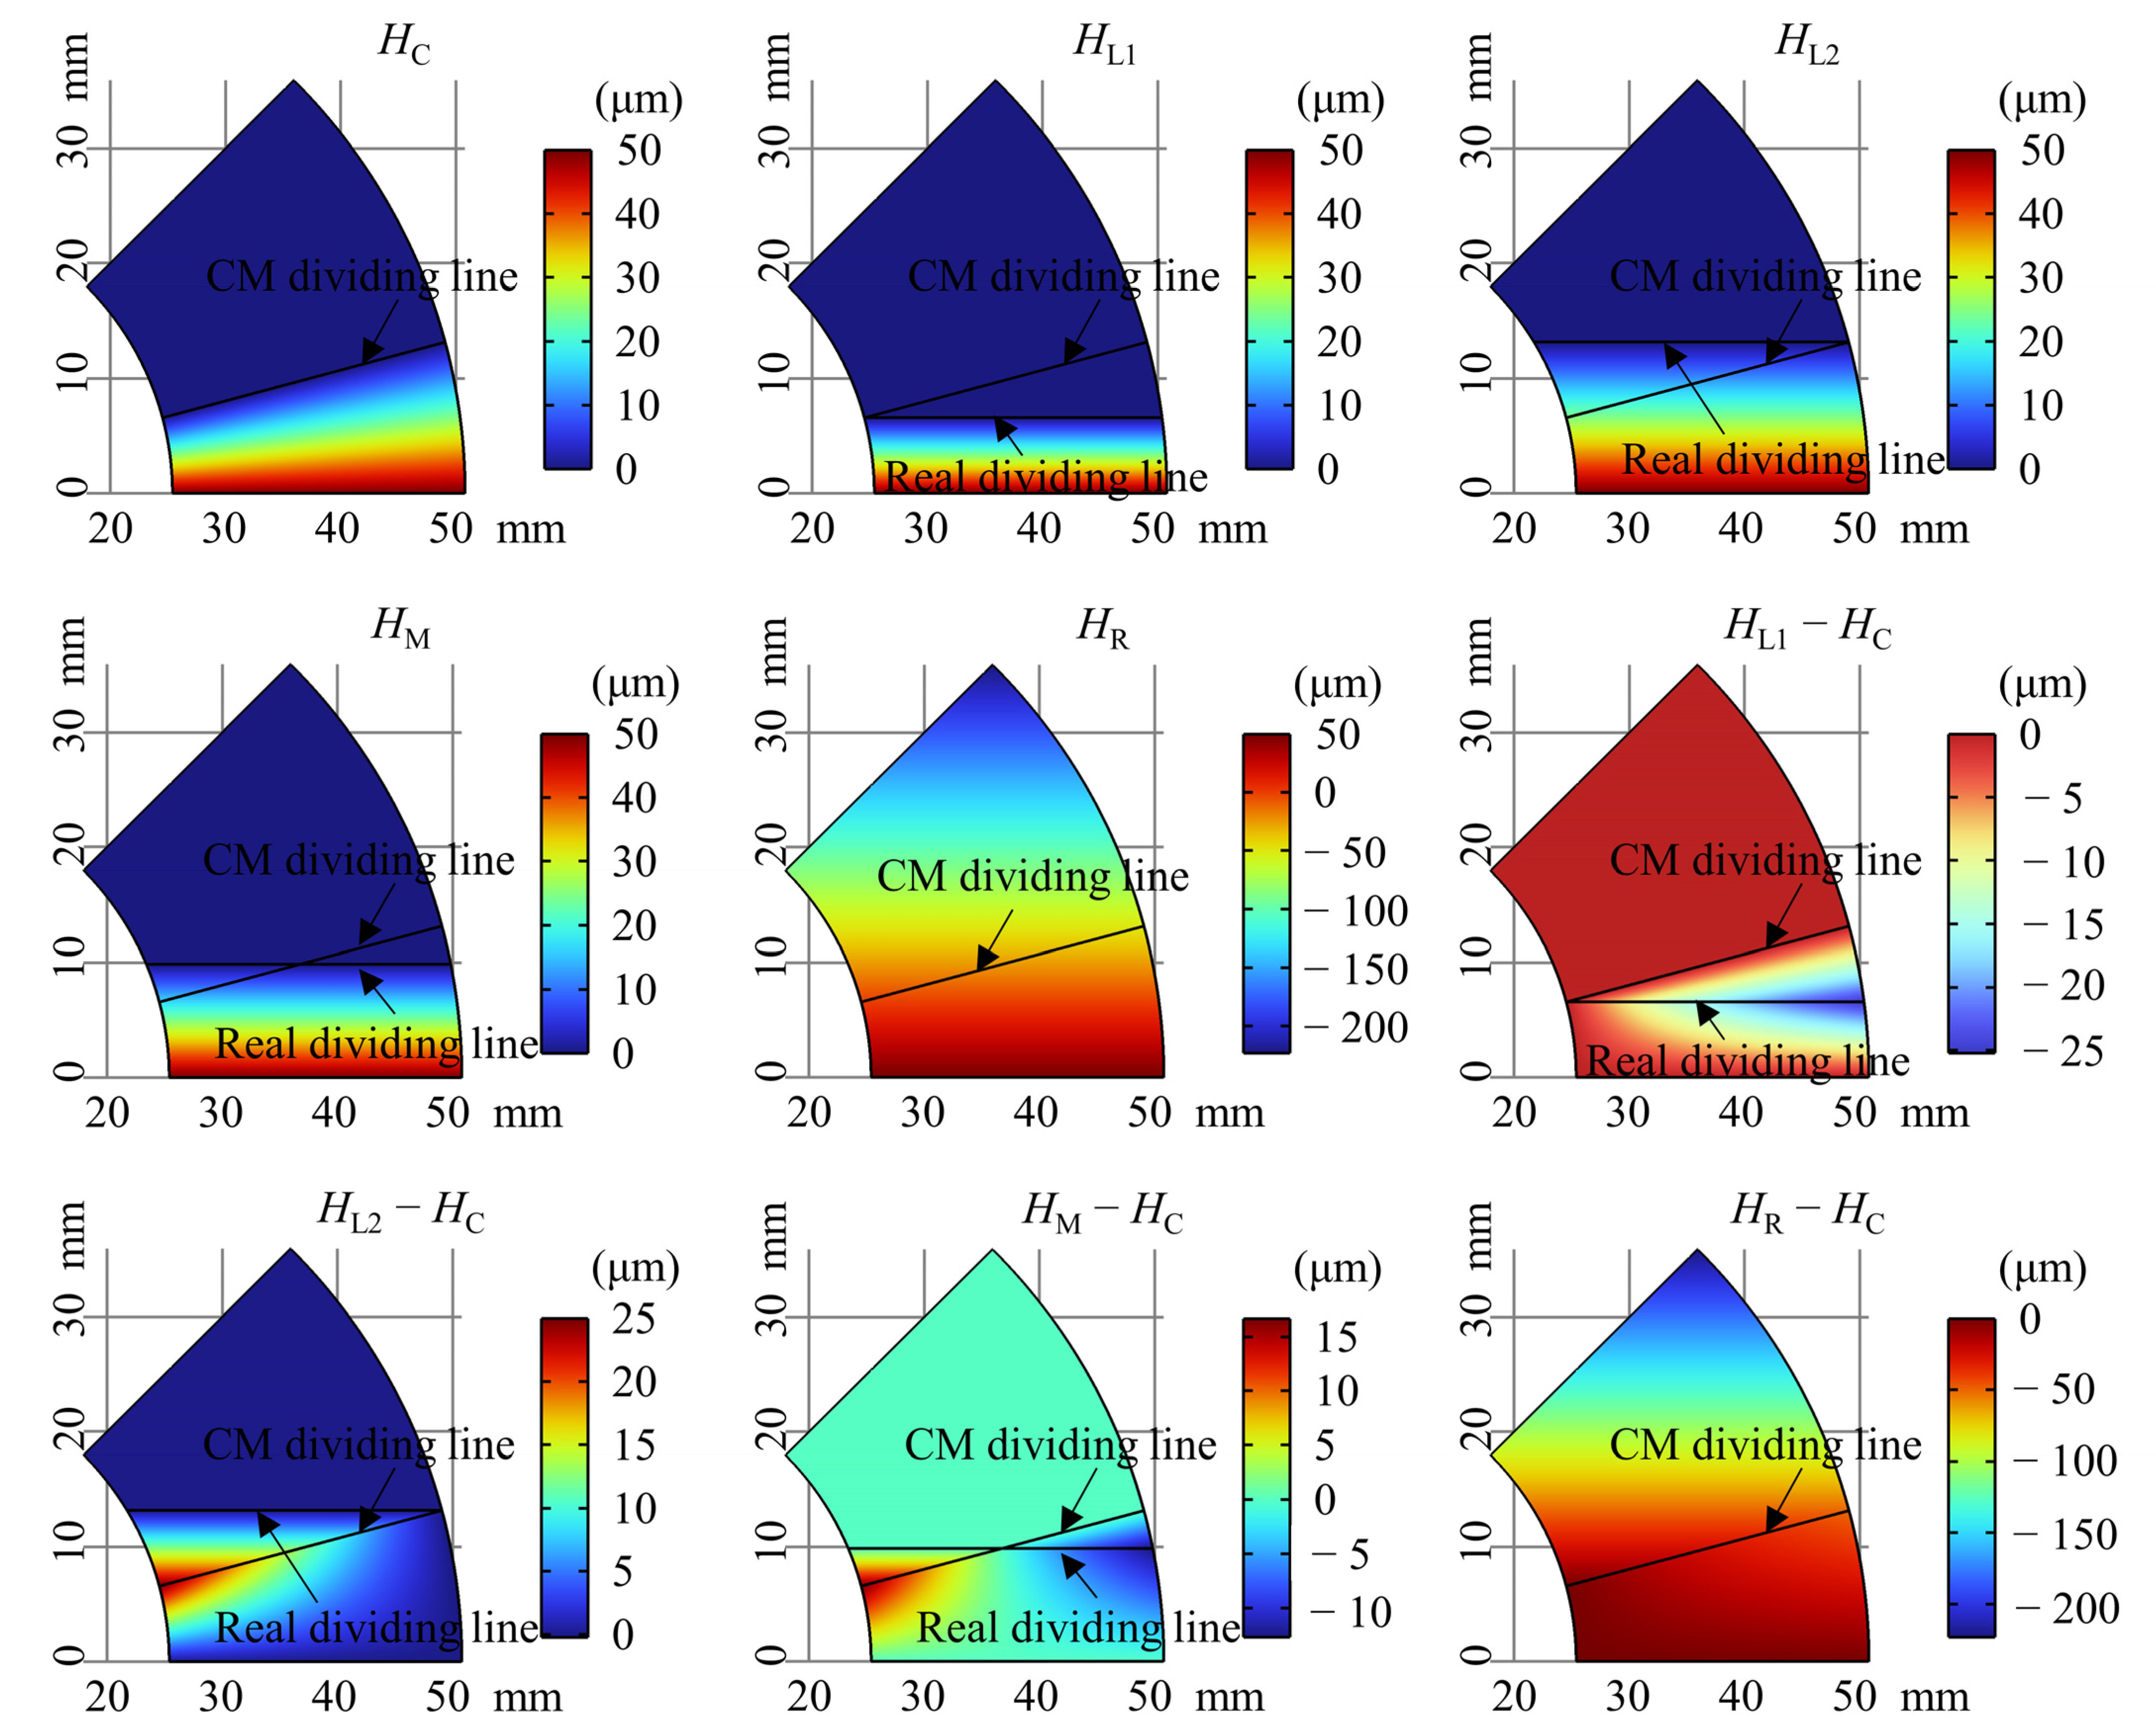
The gas film thickness and error for each model at C = 0, Load = 0 are shown in Figure 4. It can be seen that the gas film thickness of the corrected model conforms to the real situation where the gas film thicknesses on the line segments parallel to the fixed edges are equal. There is a negative gas film thickness in the FRM, which means that the top foil is in contact with the thrust disk.
In the three PSMs, the model employing L1 as the real dividing line exhibits consistently negative error, with the maximum absolute error situated at the outermost circle of the real dividing line. Conversely, the model utilizing L2 as the real dividing line demonstrates consistently positive error, with the maximum absolute error located at the innermost circle of the classical dividing line. The model employing the centerline of L1 and L2 as the real dividing line manifests negative error in the inner half circle and positive error in the outer half circle, with the maximum absolute error positioned at the innermost circle of the classical dividing line. Among the PSMs, the model with the midline of L1 and L2 as the real dividing line exhibits the smallest absolute error. Thus, this model is chosen as a representative for further comparison with the CM and FRM.
The gas film thickness error of the FRM starkly contrasts with that of the PSMs, with the maximum absolute error exceeding 200 μm at a ramp height of 50 μm, surpassing four times the ramp height, and the maximum absolute error point is located at the outermost circle of the free end of the top foil. This discrepancy is consistent with the analysis of Equation (8).
We compared the variation of drag torque with load predicted in this paper with the test data published by Dickman [28]. The results are shown in Figure 5, where BNB001, BNB003, and BNB004 are the three tested GFTBs with the same design parameters manufactured by Dickman [28]. However, due to manufacturing and heat treatment factors, there may be slight errors between the actual parameters and the design parameters. The calculations start with a large nominal clearance and then gradually reduce the nominal clearance to simulate the gradual loading process and obtain the corresponding load and drag torque. It can be seen that all three models have good agreement with the test results at low speeds and low loads, with CM predicting the most accurate drag torque, and PSM and FRM predicting smaller drag torque than CM. However, at high speeds or high loads, the three models do not perform well, which may be due to the increase in temperature at high speeds or high loads, and the thermal effect has not been taken into account in the model of this paper.
Figure 6 shows the relationship between drag torque and rotational speed at different loads. The results are similar to Figure 5 in that there is good agreement with the Dickman [28] test results at low speeds and low loads, and the accuracy of the CM prediction is better than that of the FRM and PSM. Nonetheless, all three models falter at high speeds or high loads.
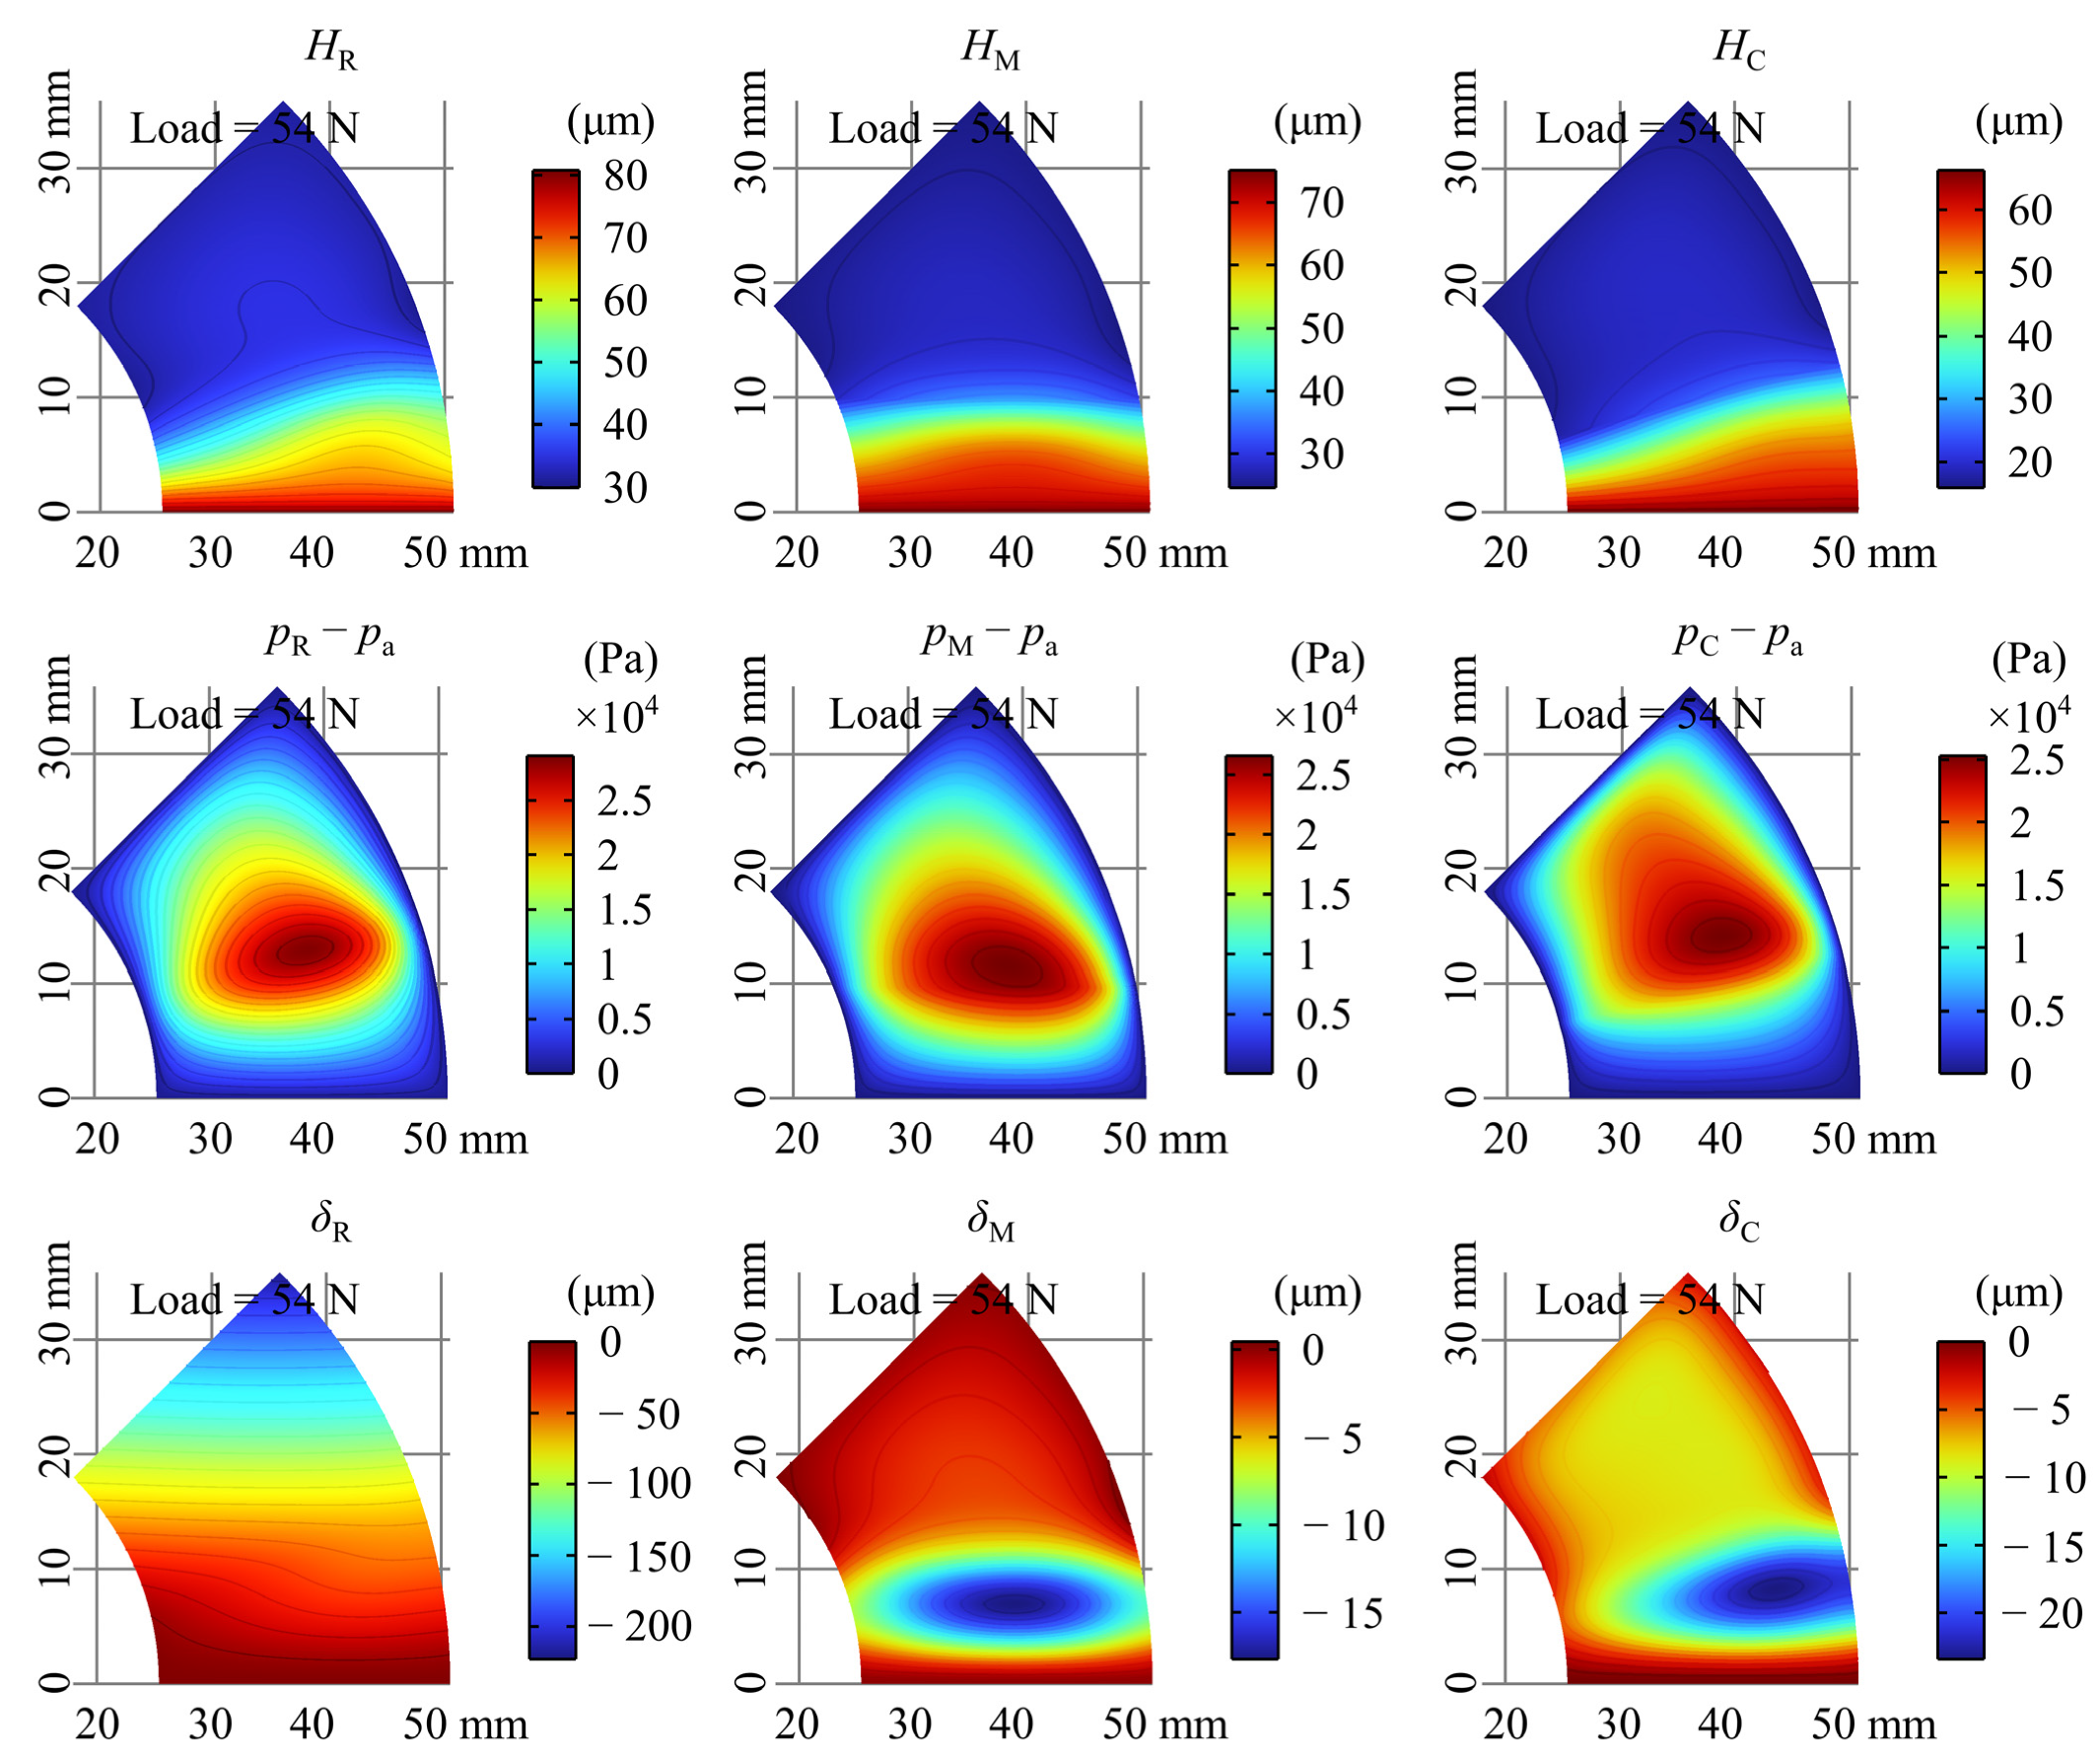
Figure 7 shows the gas film thickness, relative pressure, and top foil deformation for ω = 20 kRPM, Load = 54 N. The minimum gas film thickness predicted by FRM is the largest, followed by PSM, and CM is the smallest for the same load, which can explain why FRM predicts smaller drag torque for the same load, since smaller gas film thickness means larger fluid friction loss.
Pressure peaks for all models occur at the ramp/flat section demarcation. FRM and PSM exhibit more concentrated and larger peak pressures compared to CM.
For the top foil deformation, the location of the maximum deformation for CM is located close to the ramp section near the outside, while the maximum deformation of the top foil for PSM is located in the center of the ramp section, and this difference reflects the effect of the error in the description of the gas film thickness in the ramp section for CM. The maximum deformation of FRM is located in the outermost circle of the free end of the top foil, which is in line with the characteristics of the FRM, which is in the overhang in the initial state and thus has the largest deformation.
Figure 8 shows the variation of minimum film thickness with increasing load for different models at 20 kRPM. The FRM predicts the largest minimum film thickness at the same load, which is consistent with our previous analysis.
Figure 9 shows the load capacity predicted in this paper compared to the Dickman [28] test data and San Andrés [30] predictions. The load when the minimum film thickness is equal to 5 μm is called the load capacity of the GFTB, and this method of judging the load capacity based on the minimum film thickness has been widely used [18]. The minimum film thickness of 5 μm was obtained by dichotomization, where the minimum film thickness was judged after each calculation, and then the nominal clearance C was adjusted using the dichotomization strategy until the error between the obtained minimum film thickness and 5 μm was less than 0.001 μm, then it was judged to reach the load capacity. It is worth noting that in the test by Dickman [28], a load capacity error of 30% was observed even for bearings with identical design parameters, which may originate from subtle differences in manufacturing and heat treatment. Neglecting the inaccuracy of prediction due to thermal effects at high speeds [28], the FRM exhibits an accuracy that far exceeds the rest of the models at low and medium speeds. On the other hand, the predicted load capacity of the CM in this paper is very close to that of San Andrés [30], which verifies the correctness of the model in this paper. From Figure 9b, it can be found that even with a reduced judgment criterion (e.g., minimum film thickness of 3 μm is taken as the load capacity), the increase in the load capacity predicted is very limited, and there is still a large gap with the experimental results, which illustrates the shortcomings of the CM in predicting the load capacity.
Now, let us explore the differences between the FRM and the other models to try to explain why it predicts the load capacity more accurately. Figure 10 displays the gas film thickness, relative pressure, and top foil deformation at the load capacity at ω = 20 kRPM, and “Avg” in Figure 10 represents the average value of the gas film thickness in the flat section. It can be observed that, unlike at low loads, there are two peaks of pressure, located at the middle of the free end of the top foil and at the ramp/flat section demarcation line near the outer rim of the top foil, which is caused by the compressibility of the gas [30]. Even though the load capacity of FRM is greater than that under CM and PSM, the average film thickness of FRM is still greater than that of CM and PSM when the load capacity is reached, which may imply that FRM is less susceptible to thermal failure under heavy loads. As the low load, the location of the maximum deformation of the top foil is located in the ramp section for both CM and PSM, and the maximum deformation of the top foil is located at the outermost circle of the free end for FRM.
Another finding is that the location of the minimum film thickness for all models is located at the innermost circle of the free end of the top foil, and it can be assumed that the gas film thickness at this point determines the load capacity.
The region where the FRM satisfies with increasing load at ω = 20 kRPM is shown in Figure 11, and this expression implies that the top foil starts to compress the bump foil. This evolution explains to some extent the reason for the larger and more accurate load capacity predicted by the FRM, and it can be noted that the locations where the gas film thickness is smaller after a certain load (blue areas) are all located around the high pressure region of Figure 10. This phenomenon is related to two reasons: on the one hand, the higher pressure in the center region of the top foil makes it subjected to more compressive deformations, and the lower pressure and therefore lower deformations around it, which has the same hero for all models. On the other hand, if a flat plate is pressed with a concentrated force, it will bulge around the concentrated force and the minimum film thickness is related to this phenomenon, where the top foil will bulge around the high pressure gas. The rest of the models except FRM have the top foil at that position initially in contact with the bump foil, and are therefore more susceptible to this bulging around the concentrated force phenomenon. This bulging reduces the minimum film thickness, which results in their predicted load capacity being lower compared to the real situation.
4. Parametric Study of the Load Capacity
Load capacity stands as a pivotal metric in GFTB design. Given the high consistency between the FRM’s predicted load capacity and test results, a parametric study of GFTB load capacity was conducted utilizing the FRM. Several factors were considered to significantly affect the load capacity of the FRM, namely ramp height, top foil thickness, bump foil stiffness, ramp section extent, and top foil area, which are explored in this section. Parameter values were selected based on experience, avoiding extremes that lack practical significance.
4.1. Ramp Height
Figure 12 shows the variation of GFTB load capacity with ramp height at ω = 20 kRPM. Parametric calculations of ramp height ranged from 18 μm to 100 μm in 2 μm intervals. The characteristics of CM-based GFTB load capacity with ramp height have been published by Kim [18] in a previous study, which concluded that the load capacity increases rapidly and then decreases slowly as the ramp height increases, which is in agreement with the prediction of the FRM. The peak load capacity predicted by the FRM occurs at the ramp height of 28 μm. Before that, the load capacity increases rapidly with the increase of ramp height, and after the ramp height is greater than 28 μm, the load capacity decreases slowly with the increase of ramp height.
4.2. Top Foil Thickness
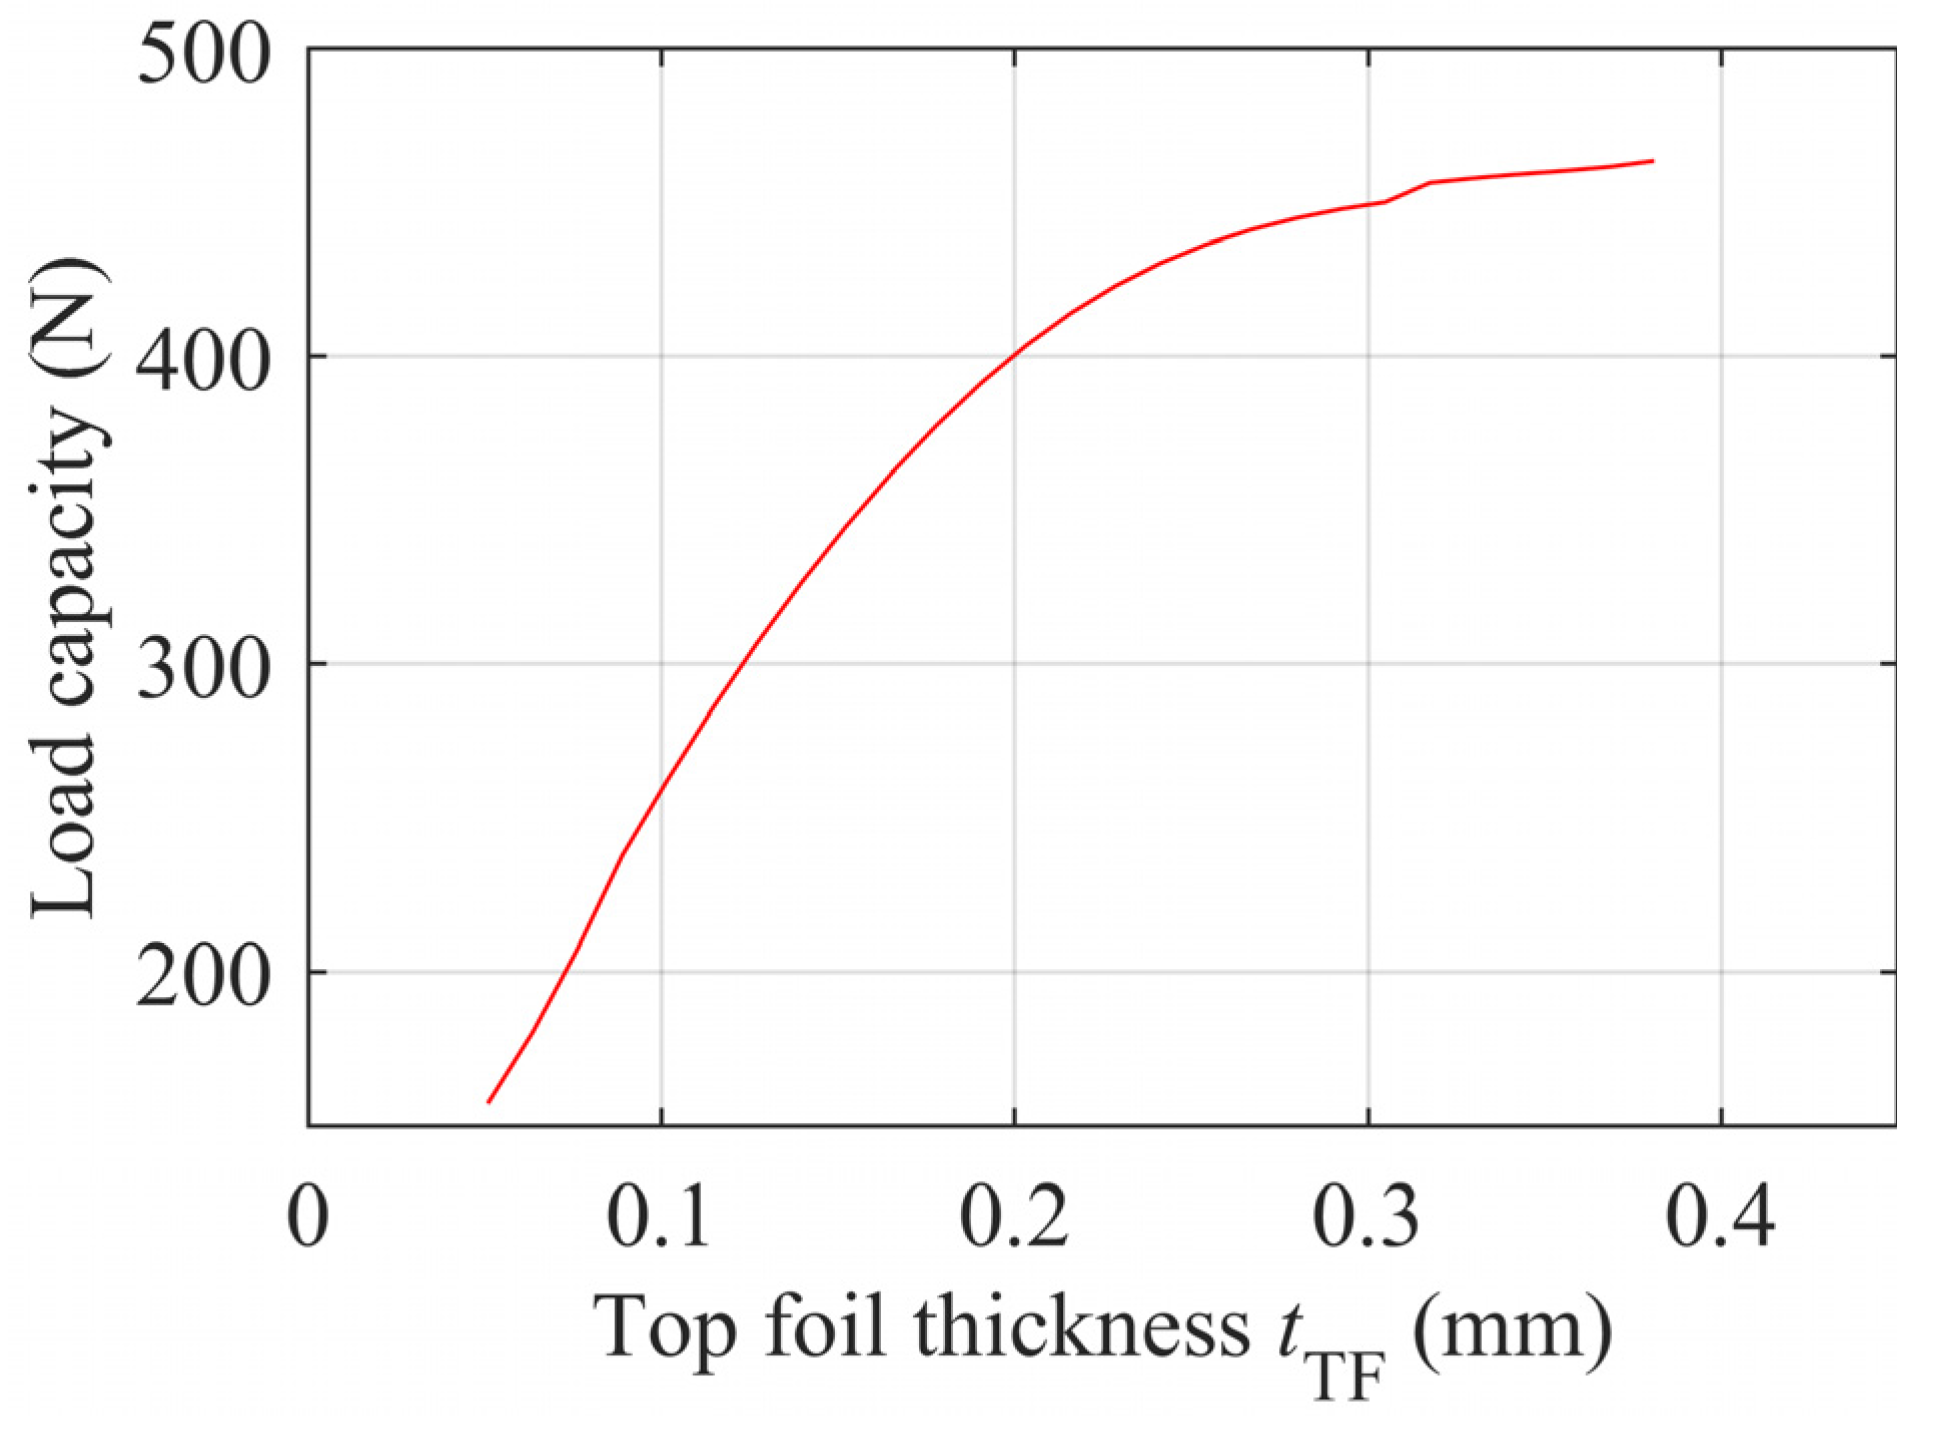
Figure 13 shows the variation of FRM load capacity with top foil thickness at ω = 20 kRPM. Parametric calculations of top foil thickness ranged from 0.0508 mm to 0.3810 mm with a 0.0127 mm interval. Results indicate that load capacity increases with top foil thickness. Up to 0.2 mm, load capacity grows rapidly, followed by a significant decrease in the rate of increase.
4.3. Bump Foil Stiffness
The elasticity of the bump foil is the main feature that distinguishes GFTBs from classical plain bearings. Figure 14 shows the variation of GFTB load capacity with bump foil stiffness. Parametric calculations of bump foil stiffness ranged from 2.25 N/mm3 to 64.4 N/mm3 at 0.33 N/mm3 intervals. Results demonstrate an increase in load capacity with bump foil stiffness, albeit with a decreasing rate of increase.
4.4. Ramp Section Extent
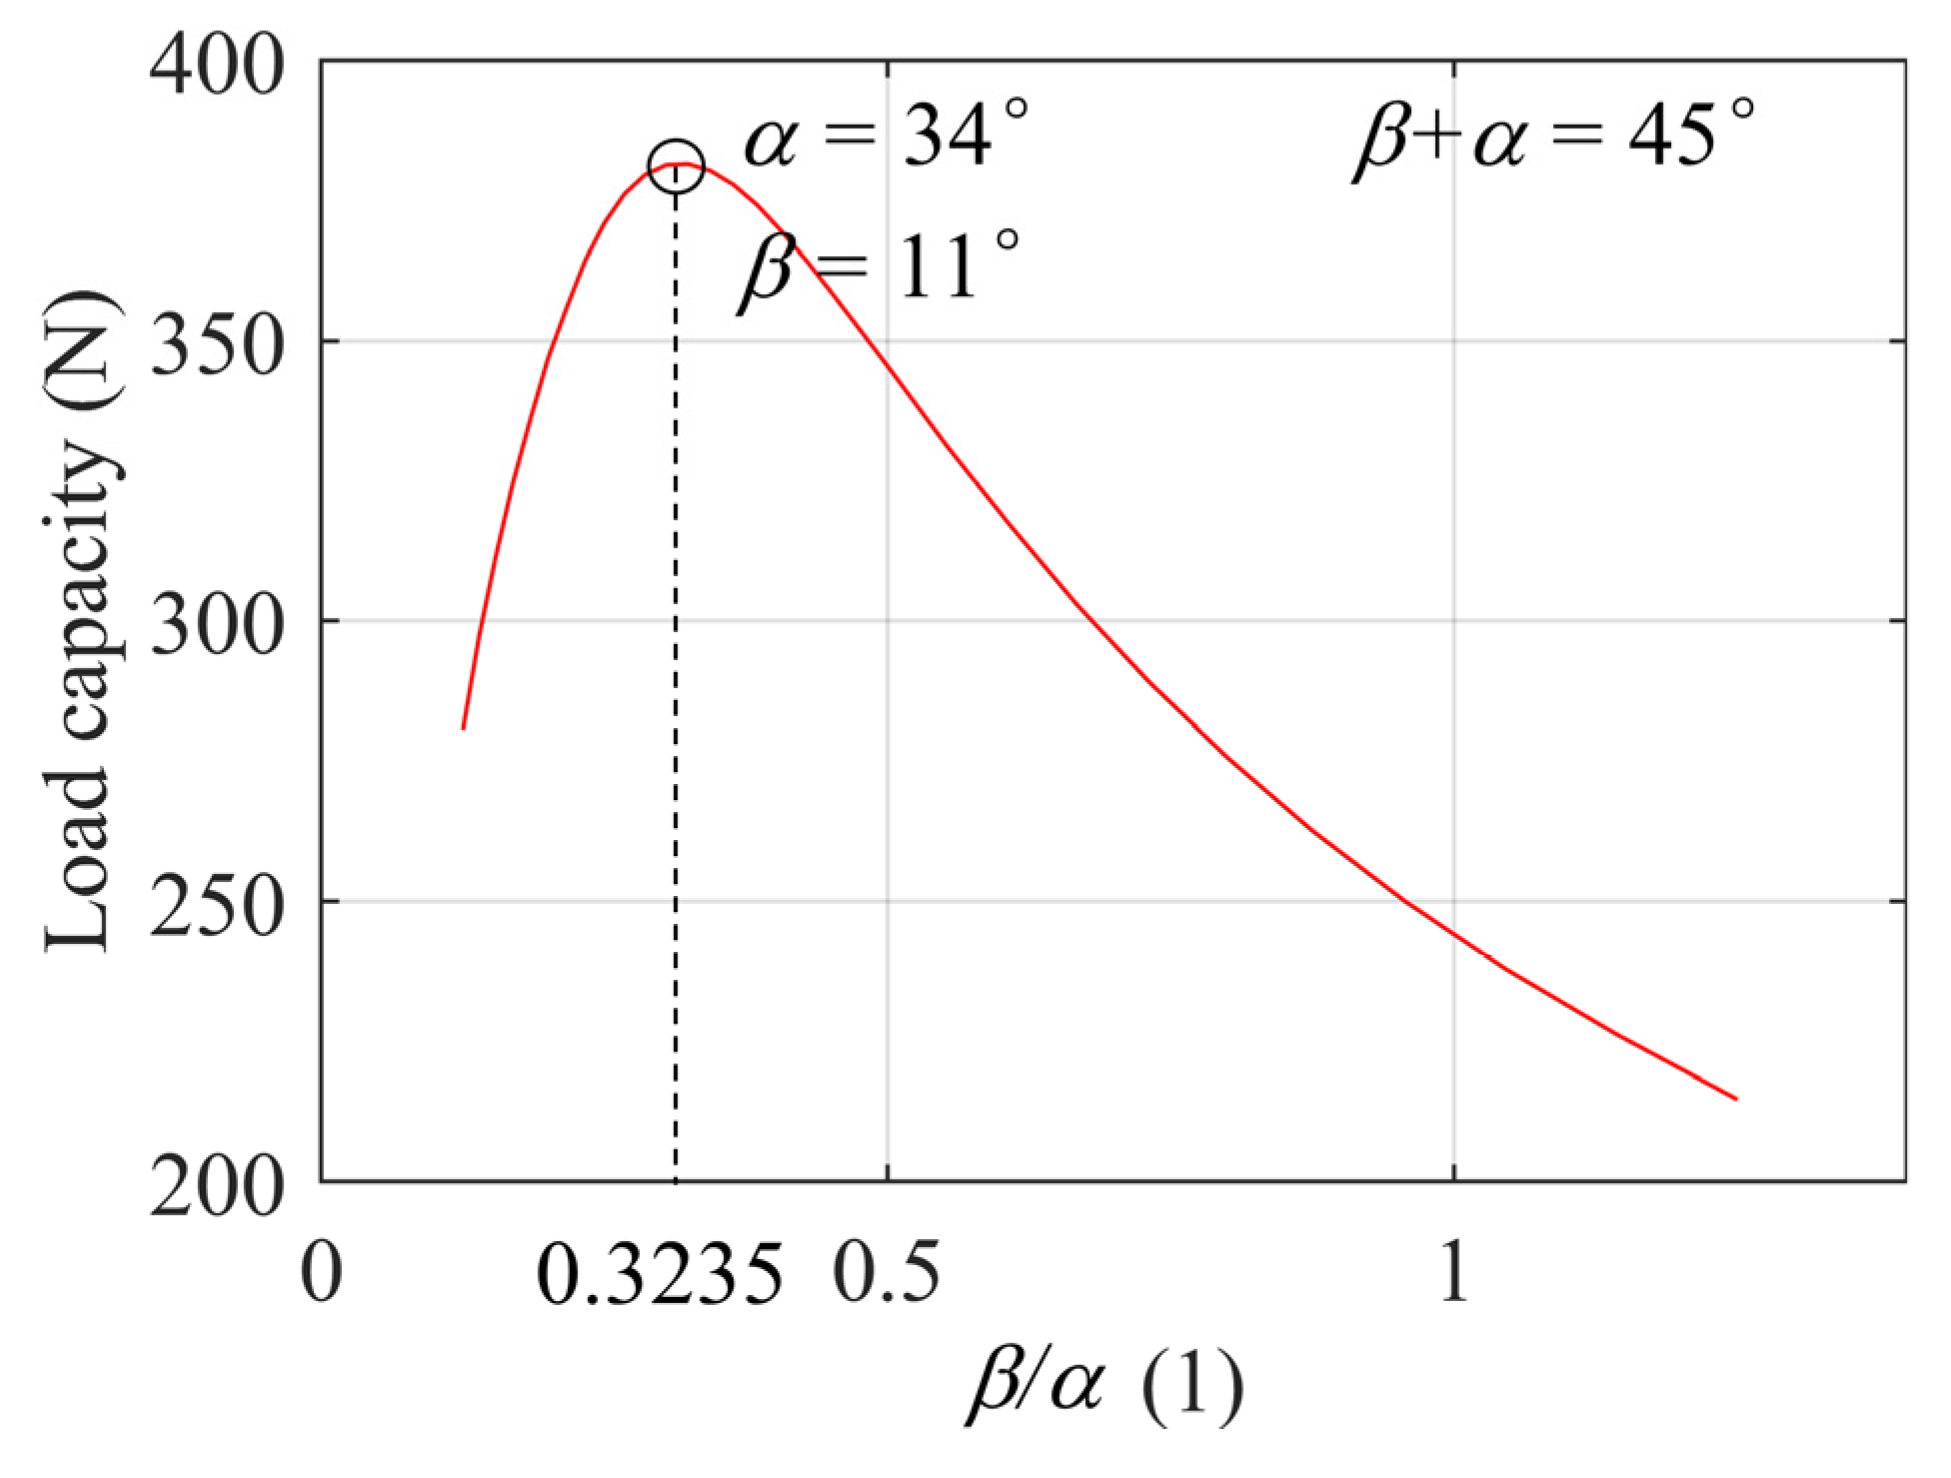
Figure 15 shows the variation of GFTB load capacity with ramp section extent. While keeping the total circumferential angle of individual top foils constant at 45 degrees, the ramp section extent ranged from 5 degrees to 25 degrees in 0.5 degree intervals. The peak load capacity predicted by the FRM occurs at a ramp section extent of 11 degrees, with rapid increases observed before this point and slower decreases thereafter.
4.5. Top Foil Area
The most common practice for requirements where greater load capacity is desired is to increase the bearing area. With a constant shaft radius, increasing the outer radius of the top foil is a reasonable option. Figure 16 shows the variation of the GFTB load capacity with the top foil outer radius and area. With the inner radius of the top foil held constant at 25.4 mm, the parametric calculation of the outer radius ranged from 38.1 mm to 76.2 mm with a 1.905 mm interval. The area covered by the bump foil also varies with the increase of the top foil area. The calculation results show that the load capacity of the GFTB increases linearly with the increase in the top foil area.
5. Conclusions
In this study, we delved into the intricacies of GFTB performance prediction, focusing particularly on the critical factor of gas film thickness. Our efforts led to the development of two novel models, the PSM, and the FRM, aimed at rectifying gas film thickness errors present in the CM across both the ramp and flat sections. Our analysis, incorporating experimental data and a parametric study based on an open-source configuration of GFTB, yielded several noteworthy conclusions:
(1) The mounting of the top foil directly on the base plate at an inclined angle revealed a significant discrepancy between the gas film thickness defined by the CM and the actual situation. This discrepancy could exceed several times the ramp height.
(2) The prediction accuracy for load capacity was notably superior in the FRM compared to CM and PSM. At identical rotational speeds, FRM consistently predicted the highest load-carrying capacity, followed by PSM, while CM trailed behind. The critical point of minimum film thickness was consistently identified at the innermost circle of the free end of the top foil when load capacity was reached.
(3) When the top foil is mounted directly on the base plate at an inclined angle, the GFTB load capacity increases linearly with the increase of the top foil outer radius. It also increases with the increase of top foil thickness, but the rate of increase decreases gradually. Additionally, it increases with the increase of bump foil stiffness, but the rate of increase decreases gradually. Furthermore, it increases first and then decreases with the increase of ramp section extent as well as with increase of ramp height.
In light of the current study’s findings, our developed models hold significant potential for further refinement and integration with other conditions to enhance predictive accuracy. Future research directions may include incorporating more complex bump foil models, considering thermal effects, rarefied effects, and other environmental factors to provide even more comprehensive predictions.
Author Contributions
Conceptualization, M.Y.; Methodology, M.Y.; Software, Y.Z. and C.Z.; Resources, X.L.; Writing—original draft, M.Y.; Writing—review & editing, X.L. All authors have read and agreed to the published version of the manuscript.
Funding
This research received no external funding.
Data Availability Statement
Data are contained within the article.
Conflicts of Interest
The authors declare no conflict of interest.
References
- Peng, J.-P.; Carpino, M. Calculation of Stiffness and Damping Coefficients for Elastically Supported Gas Foil Bearings. J. Tribol. 1993, 115, 20–27. [Google Scholar] [CrossRef]
- Heshmat, H. Advancements in the performance of aerodynamic foil journal bearings—High-speed and load capability. J. Tribol.-Trans. ASME 1994, 116, 287–295. [Google Scholar] [CrossRef]
- Dellacorte, C.; Valco, M. Load capacity estimation of foil air journal bearings for oil-free turbomachinery applications. Tribol. Trans. 2000, 43, 795–801. [Google Scholar] [CrossRef]
- Ying, M.; Liu, X.; Zhang, C.; Wang, X.; Liu, Y.; Zhang, Y. The Two-Pad: A Novel Gas Foil Bearing for Fuel Cell Vehicles. Int. J. Energy Res. 2023, 2023, 5521171. [Google Scholar] [CrossRef]
- Ying, M.; Liu, X.; Zhang, Y.; Zhang, C. Impact of Gas Foil Bearings, Labyrinth Seals, and Impellers on the Critical Speed of Centrifugal Compressors for Fuel Cell Vehicles: A Comprehensive Investigation. Lubricants 2023, 11, 532. [Google Scholar] [CrossRef]
- Park, D.; Kim, C.; Jang, G.; Lee, Y. Theoretical considerations of static and dynamic characteristics of air foil thrust bearing with tilt and slip flow. Tribol. Int. 2008, 41, 282–295. [Google Scholar] [CrossRef]
- Conboy, T. Real-Gas Effects in Foil Thrust Bearings Operating in the Turbulent Regime. J. Tribol.-Trans. ASME 2013, 135, 031703. [Google Scholar] [CrossRef]
- Samanta, P.; Murmu, N.C.; Khonsari, M.M. The evolution of foil bearing technology. Tribol. Int. 2019, 135, 305–323. [Google Scholar] [CrossRef]
- Gao, Q.; Sun, W.; Zhang, J. Optimal design of top-foil wedge shape for a specific multi-layer gas foil thrust bearing by considering aerodynamic and thermal performances. Therm. Sci. Eng. Prog. 2023, 44, 102060. [Google Scholar] [CrossRef]
- Guan, H.; Li, J.; Wei, K.; Zou, H. Rotordynamics of a rotor radially and axially supported by active bump-type foil bearings and bump-type thrust foil bearings. Mech. Syst. Signal Process. 2024, 208, 110995. [Google Scholar] [CrossRef]
- Gad, A.; Kaneko, S. A New Structural Stiffness Model for Bump-Type Foil Bearings: Application to Generation II Gas Lubricated Foil Thrust Bearing. J. Tribol.-Trans. ASME 2014, 136, 041701. [Google Scholar] [CrossRef]
- Gad, A.M.; Kaneko, S. Tailoring of the bearing stiffness to enhance the performance of gas-lubricated bump-type foil thrust bearing. Proc. Inst. Mech. Eng. Part J J. Eng. Tribol. 2016, 230, 541–560. [Google Scholar] [CrossRef]
- Liu, X.; Li, C.; Du, J.; Nan, G. Thermal Characteristics Study of the Bump Foil Thrust Gas Bearing. Appl. Sci. 2021, 11, 4311. [Google Scholar] [CrossRef]
- Chen, R.; Zhao, Y.; Yao, J.; Wang, Z. Research on the performance of foil thrust bearings under dynamic disturbances. Tribol. Int. 2022, 174, 107744. [Google Scholar] [CrossRef]
- Xu, Z.; Li, C.; Du, J.; Li, J.; Wang, Y. Load-carrying characteristics of bump-type gas foil thrust bearings. Int. J. Mech. Sci. 2023, 244, 108080. [Google Scholar] [CrossRef]
- Xu, F.; Chu, J.; Sha, L. Air foil thrust bearings with top foil sagging: Theoretical predictions and experiments. Tribol. Int. 2023, 177, 107995. [Google Scholar] [CrossRef]
- Kim, T.H.; Lee, T.W. Design Optimization of Gas Foil Thrust Bearings for Maximum Load Capacity. In Proceedings of the ASME Turbo Expo 2015: Turbine Technical Conference and Exposition, Montreal, QC, Canada, 15–19 June 2015. [Google Scholar] [CrossRef]
- Kim, T.H.; Park, M.; Lee, T.W. Design Optimization of Gas Foil Thrust Bearings for Maximum Load Capacity. J. Tribol. 2017, 139, 031705. [Google Scholar] [CrossRef]
- Lee, Y.; Kim, T.; Kim, C.; Kim, T. Thrust Bump Air Foil Bearings with Variable Axial Load: Theoretical Predictions and Experiments. Tribol. Trans. 2011, 54, 902–910. [Google Scholar] [CrossRef]
- Heshmat, C.; Xu, D.; Heshmat, H. Analysis of gas lubricated foil thrust bearings using coupled finite element and finite difference methods. J. Tribol.-Trans. ASME 2000, 122, 199–204. [Google Scholar] [CrossRef]
- Iordanoff, I. Analysis of an aerodynamic compliant foil thrust bearing: Method for a rapid design. J. Tribol. 1999, 121, 816–822. [Google Scholar] [CrossRef]
- Gad, A.M.; Kaneko, S. Performance characteristics of gas-lubricated bump-type foil thrust bearing. Proc. Inst. Mech. Eng. Part J J. Eng. Tribol. 2015, 229, 746–762. [Google Scholar] [CrossRef]
- Lehn, A.; Mahner, M.; Schweizer, B. A thermo-elasto-hydrodynamic model for air foil thrust bearings including self-induced convective cooling of the rotor disk and thermal runaway. Tribol. Int. 2018, 119, 281–298. [Google Scholar] [CrossRef]
- Hu, H.; Feng, M. Influence of wedge shape on the performance of air foil thrust bearings. Ind. Lubr. Tribol. 2021, 73, 23–32. [Google Scholar] [CrossRef]
- Feng, K.; Liu, L.-J.; Guo, Z.-Y.; Zhao, X.-Y. Parametric study on static and dynamic characteristics of bump-type gas foil thrust bearing for oil-free turbomachinery. Proc. Inst. Mech. Eng. Part J J. Eng. Tribol. 2016, 230, 944–961. [Google Scholar] [CrossRef]
- Walowit, J.A.; Anno, J.N. Modern Developments in Lubrication Mechanics; Applied Science Publishers: London, UK, 1975. [Google Scholar]
- de Borst, R.; Crisfield, M.A. (Eds.) Nonlinear Finite Element Analysis of Solids and Structures, 2nd ed.; Wiley: Hoboken, NJ, USA, 2012; ISBN 978-0-470-66644-9. [Google Scholar]
- Dickman, J.R. An Investigation of Gas Foil Thrust Bearing Performance and Its Influencing Factors. Master Thesis, Case Western Reserve University, Cleveland, OH, USA, 2010. [Google Scholar]
- Dykas, B.; Bruckner, R.; DellaCorte, C.; Edmonds, B.; Prahl, J. Design, Fabrication, and Performance of Foil Gas Thrust Bearings for Microturbomachinery Applications. J. Eng. Gas Turbines Power-Trans. ASME 2009, 131, 012301. [Google Scholar] [CrossRef]
- San Andrés, L.; Ryu, K.; Diemer, P. Prediction of Gas Thrust Foil Bearing Performance for Oil-Free Automotive Turbochargers. J. Eng. Gas Turbines Power 2015, 137, 032502. [Google Scholar] [CrossRef]
Figure 1.
GFTB classical model: (a) assembly, (b) top foil.

Figure 2.
A top foil defined by the CM located in three-dimensional space.

Figure 3.
Analysis of real GFTB model: (a) PSM, (b) FRM.

Figure 4.
Gas film thickness and error at C = 0, Load = 0.

Figure 5.
Drag torque versus load: (a) ω = 40.1 kRPM, (b) ω = 21 kRPM.

Figure 6.
Drag torque versus speed: (a) Load = 179 N, (b) Load = 54 N.

Figure 7.
Gas film thickness, relative pressure, and top foil deformation in ω = 20 kRPM, Load = 54 N.
Figure 7.
Gas film thickness, relative pressure, and top foil deformation in ω = 20 kRPM, Load = 54 N.

Figure 8.
Minimum film thickness versus load in ω = 20 kRPM.

Figure 9.
Load capacity: (a) compare with Dickman [28] test data, (b) compare with San Andrés [30] prediction in ω = 21 kRPM.

Figure 10.
Gas film thickness, relative pressure, and top foil deformation in ω = 20 kRPM, max load capacity.
Figure 10.
Gas film thickness, relative pressure, and top foil deformation in ω = 20 kRPM, max load capacity.

Figure 11.
Region of with increasing load in ω = 20 kRPM.

Figure 12.
Load capacity versus ramp height in ω = 20 kRPM.

Figure 13.
Load capacity versus top foil thickness in ω = 20 kRPM.

Figure 14.
Load capacity versus bump foil stiffness in ω = 20 kRPM.

Figure 15.
Load capacity versus ramp section extent in ω = 20 kRPM.

Figure 16.
Load capacity versus top foil area in ω = 20 kRPM.


| Parameters | Value |
|---|---|
| Bearing outer radius, R | 50.8 mm |
| Bearing inner radius, r | 25.4 mm |
| Number of pads, N | 6 |
| Ramp section extent, β | 15° |
| Flat section extent, α | 30° |
| Top foil thickness, tTF | 0.1524 mm |
| Top foil Young’s modulus, E | 214 GPa |
| Top foil Poisson’s ratio, v | 0.29 |
| Bump pitch, s0 | 5.0 mm |
| Bump half length, l0 | 1.6 mm |
| Bump height, hBF | 0.5 mm |
| Bump foil thickness, tBF | 0.102 mm |
| Bump foil stiffness, KBF | 6.44 N/mm3 |
| Structural loss factor, μ | 0.2 |
| Ramp height, ∆h | 50 μm |
| Air temperature, T | 65 °C |
| Ambient pressure, pa | 1 atm |
Disclaimer/Publisher’s Note: The statements, opinions and data contained in all publications are solely those of the individual author(s) and contributor(s) and not of MDPI and/or the editor(s). MDPI and/or the editor(s) disclaim responsibility for any injury to people or property resulting from any ideas, methods, instructions or products referred to in the content. |
© 2024 by the authors. Licensee MDPI, Basel, Switzerland. This article is an open access article distributed under the terms and conditions of the Creative Commons Attribution (CC BY) license (https://creativecommons.org/licenses/by/4.0/).
Share and Cite
MDPI and ACS Style
Ying, M.; Liu, X.; Zhang, Y.; Zhang, C. Optimizing Load Capacity Predictions in Gas Foil Thrust Bearings: A Novel Full-Ramp Model. Lubricants 2024, 12, 76. https://doi.org/10.3390/lubricants12030076
AMA Style
Ying M, Liu X, Zhang Y, Zhang C. Optimizing Load Capacity Predictions in Gas Foil Thrust Bearings: A Novel Full-Ramp Model. Lubricants. 2024; 12(3):76. https://doi.org/10.3390/lubricants12030076
Chicago/Turabian StyleYing, Ming, Xinghua Liu, Yue Zhang, and Chongbin Zhang. 2024. "Optimizing Load Capacity Predictions in Gas Foil Thrust Bearings: A Novel Full-Ramp Model" Lubricants 12, no. 3: 76. https://doi.org/10.3390/lubricants12030076
Note that from the first issue of 2016, this journal uses article numbers instead of page numbers. See further details here.