Cold-Flow Properties of Estolides: The Older (D97 and D2500) versus the Mini-(D5773 and D5949) Methods
by
 , , , and
Grigor B. Bantchev
1,* ,
,
Helen Ngo
2,
Yunzhi Chen
1,
DeMichael D. Winfield
1 and
Steven C. Cermak
1 1
United States Department of Agriculture, Agricultural Research Service, National Center for Agricultural Utilization Research, Bio-Oils Research Unit, Peoria, IL 61604, USA
2
United States Department of Agriculture, Agricultural Research Service, Sustainable Biofuels and Co-Products Research Unit, Eastern Regional Research Center, Wyndmoor, PA 19038, USA
*
Author to whom correspondence should be addressed.
Lubricants 2024, 12(5), 141; https://doi.org/10.3390/lubricants12050141
Submission received: 22 February 2024
/
Revised: 14 April 2024
/
Accepted: 18 April 2024
/
Published: 23 April 2024
Abstract
:There is growing research on developing new and sustainable lubricants. Sustainable lubricants with adequate cold-flow properties are of particular interest for many applications. One limitation of the established methods for measuring cold flow properties is the large volume needed to test samples. This makes initial screening of many hard-to-synthesize samples difficult. In the current study, we compared the results of the older, widely accepted ASTM methods D97 (pour point, PP) and D2500 (cloud point, CP) to the newer, smaller-volume, and easier-to-perform methods D5949 and D5773 for bio-based base oils (estolides and iso-estolides). The CP results were in good agreement for less colored samples, but D5773 gave lower values for some darker (Gardner color >8) samples, especially esters. The D5949 showed a tendency to report slightly higher PP, especially for the lower values. Viscosities and densities in a wide temperature range (15 to 120 °C) were also measured. The surface tensions were estimated by a literature group method. Viscosity and density effects can only partially explain the differences in the PP values from the two methods. In conclusion, the newer mini-methods are an acceptable substitution when larger volumes are not accessible, unless the sample is too dark.
1. Introduction
The use of petroleum-based products is associated with undesirable climate change, [1] pollution [2], and depletion of petroleum [3]. The desire to mitigate these effects and to stimulate the farm economy motivates the search for novel bio-based fuels, lubricants, and polymers.
The development of bio-based lubricants is under active research (Scopus returned >250 articles when searching for ((bio-based or bio-based or soybean or palm or corn or cooking) and lubricant) in 2023 vs. 126 in 2013). We excluded the term “biolubricants”, often used with a similar meaning to “bio-based lubricants” [4,5,6,7]. The “biolubricant” term can be confusing, since it is used to describe lubricants in biological systems [8] or environmentally acceptable lubricants (EAL) [9] both of which may be totally petroleum-based. While the bio-based lubricants are often assumed to be EAL, actual testing and evaluation is needed. Vegetable oils exhibit better lubricity (lower coefficient of friction and lower wear), better biodegradability, and lower carbon dioxide emission profile than mineral oils. On the other hand, they either have high melting points or low oxidative stability [5,6,7,10,11]. As esters, vegetable oils have lower hydrolytic stability than mineral oils [5,6,7,10,11]. Good biodegradability is a disadvantage for recirculated emulsion-based metalworking fluid applications, where microbial growth is a major issue [12].
The vegetable oils from the most available sources contain 16- and 18-carbon atoms fatty acids. The saturated fatty acids are the main contributor to the poor low-temperature properties, while unsaturated fatty acids with one or more double bonds are prone to oxidation [13]. The oleic acid with one double bond is the best “compromise” fatty acid, which leads to the interest in high-oleic oils [14,15,16,17]. Nevertheless, even these oils lack sufficient performance for most of the applications. Transesterifications of the glycerol moiety with methanol, diol, or polyol are some of the simplest chemical transformations on vegetable oils. They were utilized to broaden the viscosity range and improve the cold-flow properties and oxidation stability [4]. Still, transesterifications have limited effect on the cold-flow properties and oxidative stability of vegetable oil. Due to this, reacting of the double bonds is often included as part of bio-based lubricant synthesis [5,6,7,15,16,17,18,19,20,21,22,23,24,25,26,27,28,29,30,31,32,33,34]. The bio-based lubricants and related materials are used to some extent in almost every application [5,6,7,24,35,36].
Chemical transformations of vegetable oils are investigated to find novel bio-based lubricant candidates, but many new structures lack the needed cold-flow properties [20]. The development of a new product is a complicated process, requiring screening of many candidates. The initial (bio-)chemical process for the synthesis of a new compound is usually carried out on a small scale and is not well optimized. This requires that the tests for evaluation of their properties for practical use be conducted on the smallest possible scale.
Important characteristics of a lubricant are its cold-flow properties. Usually, it is characterized by the cloud point (CP) and the pour point (PP) [37]. Widely accepted methods for their determinations are the ASTM (American Society for Testing and Materials) method D97 for PP [38] and D2500 for CP [39]. The CP is defined as the first temperature at which haziness or crystals appear. The PP is the temperature at which the lubricant stops moving when tilted. Since most lubricants are mixtures of flexible molecules, initially only a fraction of the lubricant crystalizes. Typically, the PP is due to the growing 3D crystal network trapping the rest of the lubricant [40], but in some cases the flow can stop due to the increase in viscosity with the decrease of temperature [37]. The chemical transformations often have hard-to-predict effects on the cold-flow properties—for example, longer chain lengths worsen the cold-flow properties of polyol esters but improve the one of products of ring-opened epoxidized VO [41].
The older methods, D97 and D2500, require 50 mL of lubricant or fuel for evaluation. Both methods are manual but have automated analogs—for example, D6892 and D5551. While the automated versions reduce human subjectivity and labor, they still require large sample volumes. Some researchers [42] have modified the methods by utilizing smaller test tubes and volumes but have not studied how the change influences the results.
ASTM has approved methods for evaluating PP and CP that require smaller volumes of tested material. In the current manuscript, we will compare ASTM methods D5949 [43] and D5773 [44] to D97 and D2500, respectively. In the new methods, a determination of both PP and CP values requires a 150 μL sample. This is much less compared to the older D97 and D2500 methods, which also require 50 mL each.
An alternative way to test the could-flow properties is by use of differential scanning calorimetry (DSC), but there is no ASTM standard method, and no consistent correlation has been derived. Noel [45] reported the DSC onset temperature to be ~5 °C lower than the CP determined by D2500 for 11 types of petroleum oils and two types of fuels having a wide CP range (from −60 to +60 °C). Dunn demonstrated two different linear relationships between CP and the onset temperature of soybean biodiesel, depending on whether it is winterized or not [46]. Despite that, Leggieri et al. [47] assumed the CP to be equivalent to the onset temperature. The DSC exothermic peak during cooling is associated with the PP, but for vegetable oils, differences as big as 17 °C are reported. Additionally, ambiguity arises when two or more peaks are detected [48].
Estolides are a wide class of bio-based materials [23]. The estolides can be formed using different monounsaturated fatty acids, different “capping” acid, alcohol, or degree of oligomerization (estolide number, or EN). Recently, some estolides were successfully commercialized as lubricants [24]. Even though some estolide products are superior to petroleum products, problems exist in their wide adoption, so research on improving their synthesis and properties continues [25,26,27,28,29,30,31,32,33]. While some estolides have excellent cold-flow properties, other estolides do not [26], which highlights the need to find an optimum structure. Being able to determine the cold-flow properties from a small-volume sample will decrease the efforts needed to synthesize and screen novel estolides and select the most promising candidates.
It is known that the CP and PP values depend on the testing procedure [43,49]. For example, bio-based hydraulic fluid with PP of −20 °C froze when kept at −15 °C for 72 h [50]. Similarly, bio-based base oil with 1% PP depressant had a PP of −30 °C but solidified after being stored for 7 days at −25 °C [51]. Rheological determination of the cold-flow properties of petroleum oil is reported to depend on the gap between the rotating disks [52]. As mentioned above, the correlations between the cold-flow properties determined by D2500 or D97 and DSC depend on the type of the tested material. The testing procedure also influences the results [45,46,52]. There is currently a gap in understanding how to correlate the cold-flow properties results from one method to another and to on-field exploitation [38,39,43,44].
In the current manuscript, we report a comparison of the automated D97 and D2500 analogs to the mini-methods D5949 and D5773, where all the samples were estolide-free acids or estolide 2-ethylhexyl esters. Most of the data from the automated D97 and D2500 analogs were reported earlier [26], while the data from the D5949 and D5773 methods, as well the viscosity and density data, have not been reported previously. The aim is to determine the utility of the mini methods as a substitute for the macro methods in the evaluations of estolides. The results can be used to find potential sources of deviation between the methods and better understand the cold-flow measurement.
2. Materials and Methods
The oleic estolides are synthesized by the two-step procedure [34] (See Scheme 1). In the first step, a mixture of oleic acid, a capping saturated fatty acid, and a catalyst (perchloric acid) are heated to form oligomeric estolide acids. Afterwards, the estolide acids are distilled to remove the unreacted fatty acids and lactone by-products. In the second step, the estolide acids are esterified with 2-ethylhexanol to form estolide 2-ethylhexyl esters (estolide 2EH esters). The oleic–oleic estolide is synthesized without a saturated fatty acid. Due to the strong acid catalyst, the double bond migrates along the fatty acid chain and isomerizes from cis- to trans- [34].
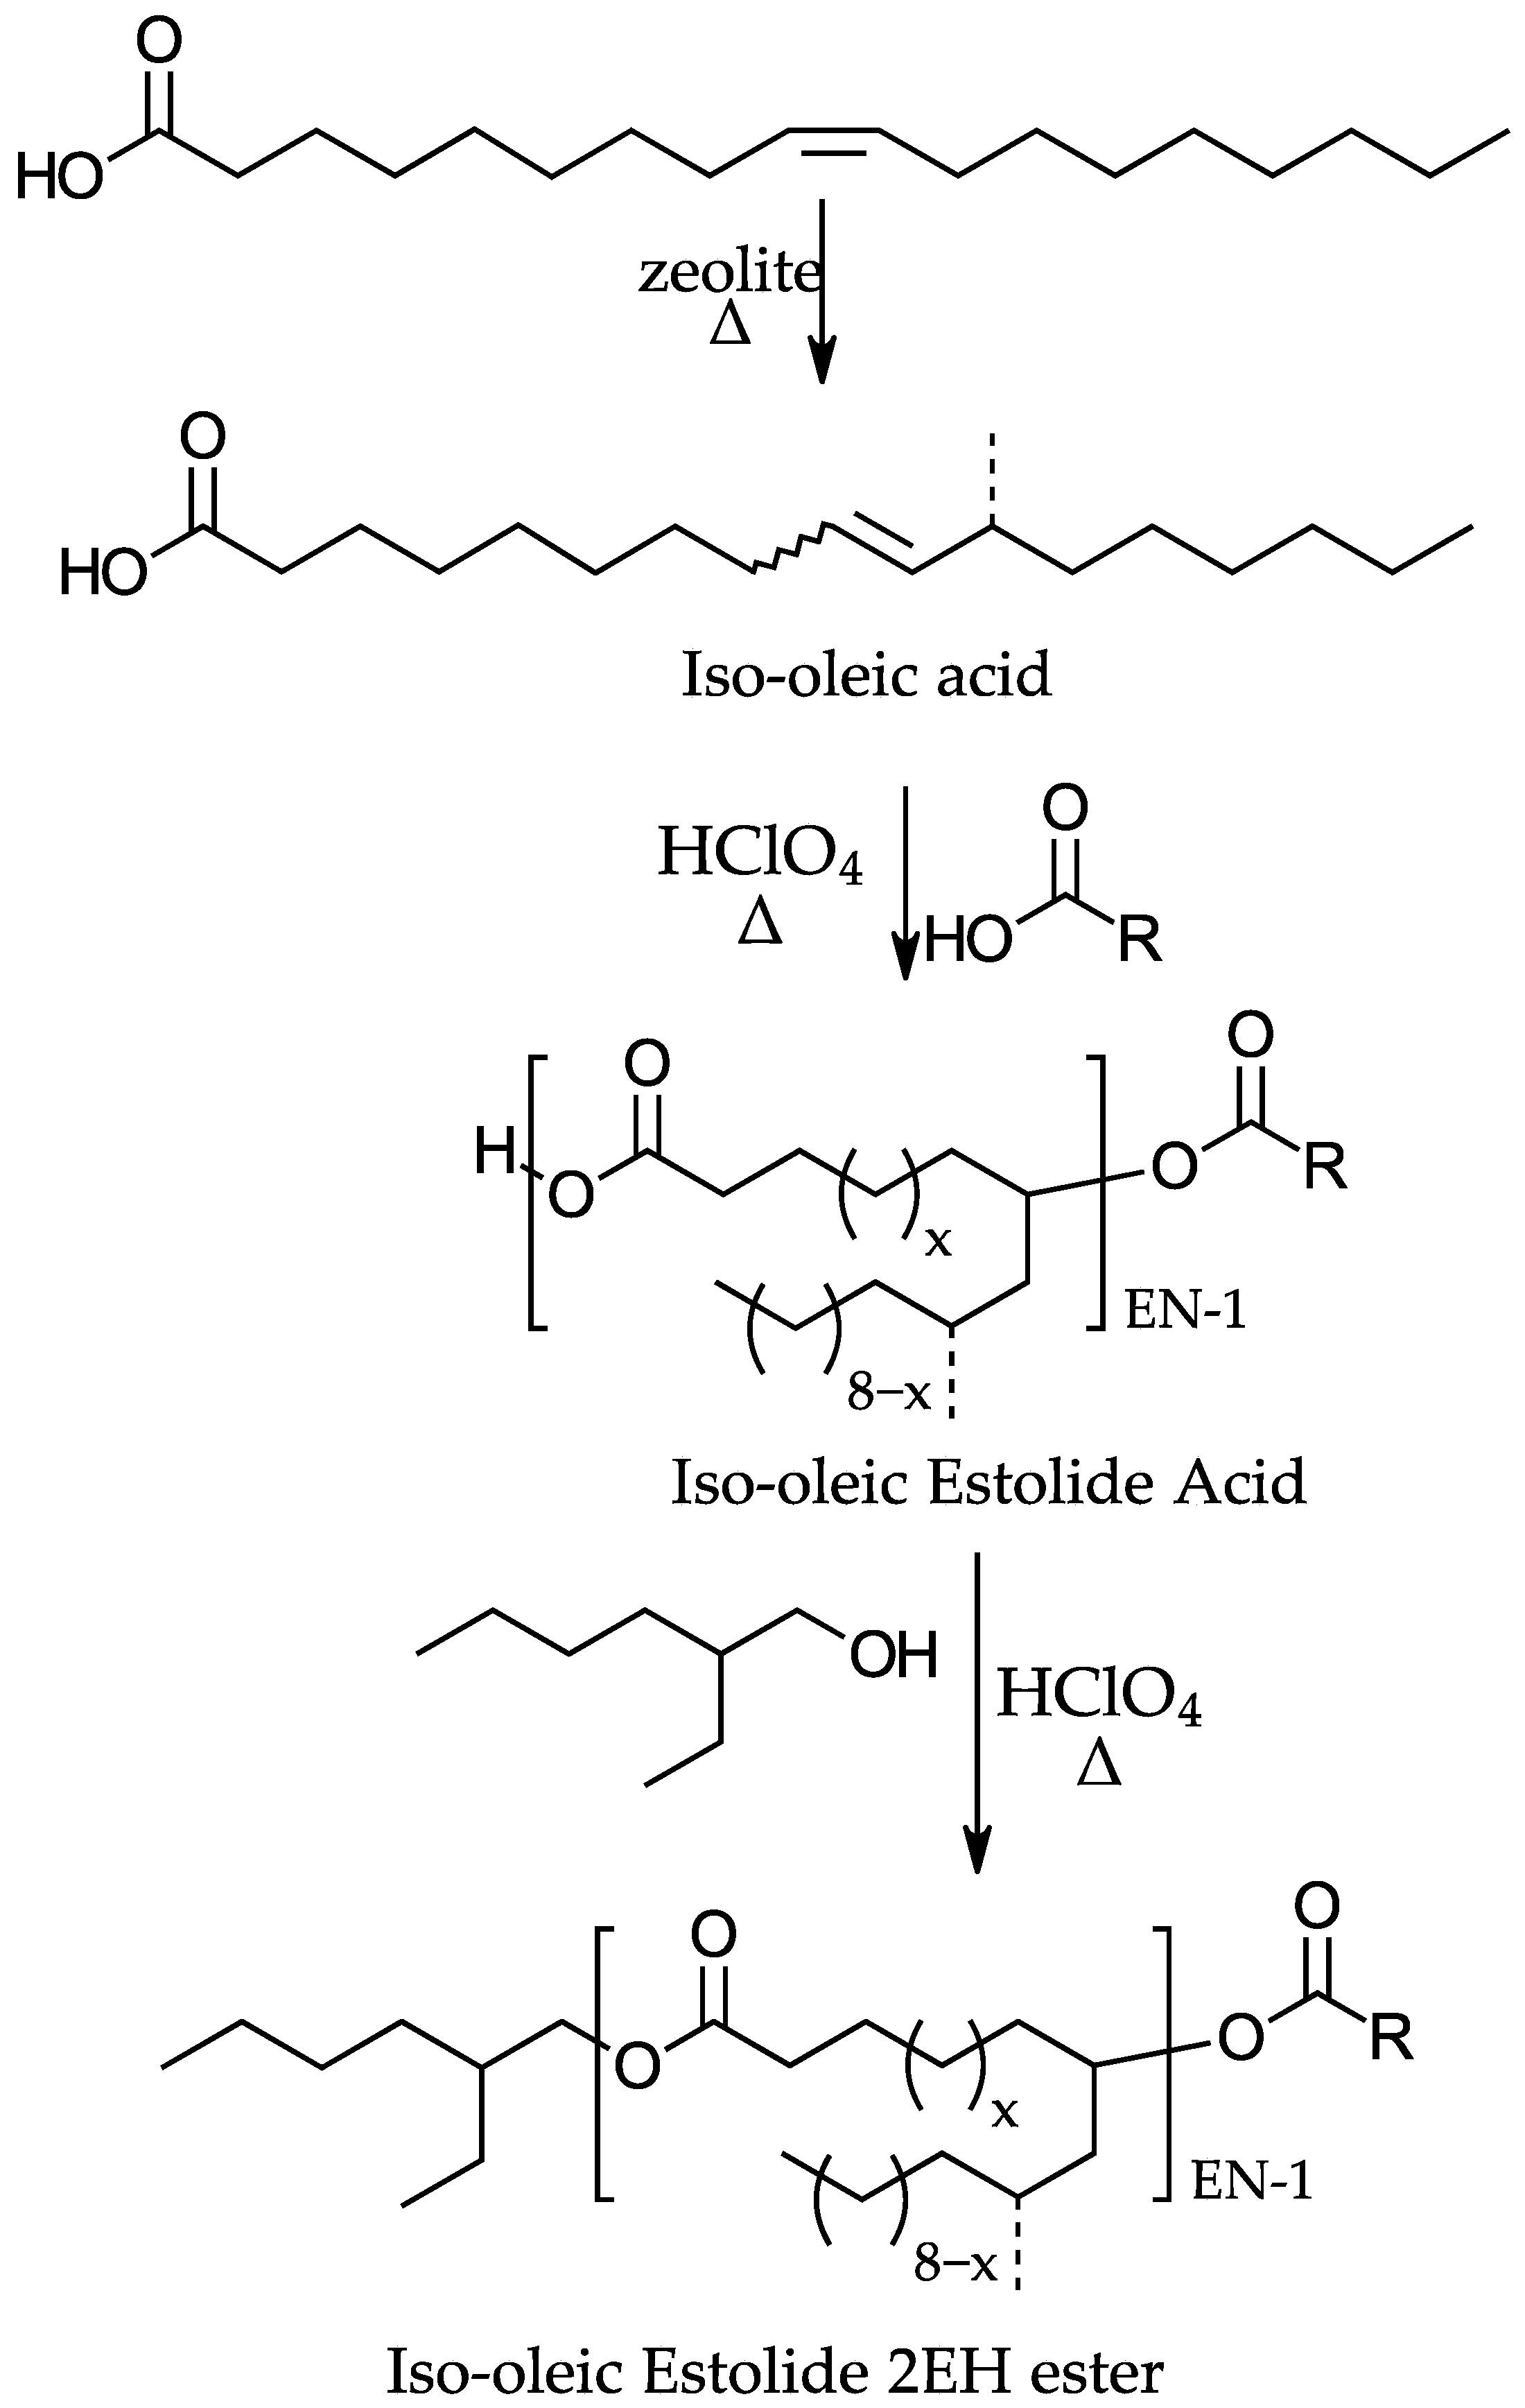
Iso-oleic acid was synthesized by isomerization of oleic acid with a zeolite catalyst [53]. In this process, the main product is a fatty acid where the end methyl group has migrated to the middle of the carbon chain. Afterwards, the iso-oleic acid was used to form iso-oleic estolide acids and iso-oleic 2EH esters, following the synthetic procedure analogous to the one for the oleic estolides [26] (Scheme 2).
The samples are denoted by the same convention, indicating their starting materials, as in [26]: “I” for “iso-oleic”, “O” for “oleic”, “Cx” for saturated linear fatty acids with a total of x carbon atoms in the molecule, and “Coco” for a mixture of fatty acids obtained from coconut oil (containing predominantly C12 saturated fatty acid). If the sample acronym contains “2EH”, it indicates that the estolide was esterified with 2-ethylhexanol, otherwise it was an estolide-free acid. Further characterization of the estolides is reported in the previous publication [26].
The CP according to ASTM D2500, PP according to ASTM D97, Gardner color, and estolide numbers were taken from the previous publication [26]. The previously unreported data for the dark-colored I-Coco and I-Coco-2EH before charcoal cleaning (both having Gardner color of 17) were also used. These samples are labeled with (17) after the acronym. The CP (D2500) and PP (D97) of I-Coco(17) were −33.3 and −36 °C, while for I-Coco-2EH(17) were −13.0 and −33 °C.
The CP according to ASTM D5773-21 and PP according to ASTM D5949-16 (at 3 °C resolution) were collected in duplicate on a Phase Technologies 70Xi instrument (Phase Analyzer Company, LTD, Richmond, BC, Canada). The average value and the standard deviations are reported.
The dynamic viscosity and density data were collected using a SVM3001 viscometer (Anton-Paar USA Inc, Ashland, VA, USA), following a modification of the ASTM method D7042 [54]. The modification was that the sample was injected into the measuring chambers at 15 °C, and the instrument was programmed to measure viscosities and densities at 15, 20, 25, 30, 40, 50, 60, 70, 80, 90, 100, 110, and 120 °C. The injections and the following measurements were carried out in triplicate. Afterwards, the viscosity data were fitted to three temperature–viscosity models: Avramov–Milchev [55], Mauro–Yue–Ellison–Gupta–Allan [56], and Vogel–Fulcher–Tammann–Hesse [57] as described previously [58]. The Avramov–Milchev (AM) model fitted the best most of the datasets, despite that the differences between the models were small. Due to this, AM model parameters are reported here and were used for further analysis. The AM viscosity–temperature dependence can be represented as:
In Equation (1), is the dynamic viscosity in mPa∙s, , , and are fitting constants, and is the absolute temperature in Kelvins.
The inverse density data were fitted to a quadratic equation:
In Equation (2), is the density in g/cm3 as a function of temperature in °C, while , , and are fitting constants. is a temperature in the middle of the data range, which makes the fitting more convenient. The dependence in Equation (2) is taken from Elbro et al. 1991 [59]. Afterwards, the Equations (1) and (2) were used to extrapolate the viscosities and densities at low temperatures.
Parachor and surface tension were estimated by using the group-contribution methods described in the book of van Krevelen [60]. The group compositions of the estolides and estolide esters were calculated using the estolide number from Biresaw et al. [26], assuming uniform composition of the chemical structures, i.e., most of the groups had non-integer numbers for participation in the molecules. This assumption is equivalent to an idealized mixing rule, with no interaction between different-sized molecules in the mixtures.
3. Results
3.1. CP and PP Results
The summary of the CP and PP results is reported in Table 1. The CP and PP values are reported ± the standard deviation. Two samples (II and I-C10) failed both attempts of measurements of the CP values. Two samples out of 32 had a difference >1.3 °C between the two CP ASTM D5773 measurements, which is in line with the repeatability statement of the method (one result of 20 measurements being >1.3 °C) [44]. None of the repeats of the PP measurements deviated from the first one by more than 3 °C, which is the resolution of the measurements.
3.2. CP Correlations
All the values measured with ASTM D5773 were lower than the corresponding values, measured with D2500 (Figure 1). While most of the differences were less than 5 °C, there were some bigger differences, with the biggest slightly exceeding 28 °C. Both methods measure formation of crystals by optical methods, so the detection can be influenced by the color of the fluid. This is illustrated in Figure 2, where the difference in the CP temperatures from the two methods (ΔCP = CP(D2500)-CP(D5773)) is plotted as a function of the Gardner color of the estolide. For Gardner color 8 and below, ΔCP is small (<5 °C). For Gardner colors ≥9, some of the results show big deviations. Here, there is a difference between estolide-free acids and estolide 2EH esters. Out of twenty-five samples with Gardner color ≥9, ten had ΔCP >5 °C. Nine out of those ten were 2EH esters, and only one was free acid. For the fifteen samples with Gardner color ≥9 and ΔCP <5 °C, two were 2EH esters, and thirteen were free acids. Using contingency table calculations with Yates’s adjustment [61], we obtain the probability that the deviation in CP values for esters to be different than the one for acids by a chance p ≈ 0.0075. This indicates that the estolide acids and estolide esters form different kinds of crystals upon cooling. The estolide ester crystals are probably smaller, so a darker Gardner color makes it easier to obscure them. The estolide acids have a more polar carboxylic acid group, which probably causes the formation of bigger and easier to detect crystals, even in dark-colored conditions.
3.3. PP Correlations
Figure 3 illustrates the principles of the two PP methods. In both methods, flow of the sample is measured, so viscosity should be expected to influence the results. In ASTM D97, gravitation is the main driving force—the test method cannot be performed without the gravitational force. The higher density leads to stronger gravitational pull, thus increasing the flow and lowering the PP. In D5949, gravitation plays a minor, or even negligible, role due to the smaller sample. The flow of the sample is caused by air flow. If the gravitation influences D5949 results, it should increase PP. In both methods, the sample-air interface is increased when the sample flows, so surface tension can be a factor in reducing the propensity of the sample to flow. Typically, the surface tension phenomena are more pronounced at small scales, so we should expect the surface tension effects to be more important in D5949. The above logic suggests that three simple sample properties can influence the measured value of PP: viscosity (), density () (by its relation to the gravitational force), and surface tension (). In the previous sentence, we used “simple” in the sense of easy to measure or predict (as demonstrated below). The PP is known typically to be caused by gelation, or network formation of the wax crystals [23,62], but such events are more complicated to model or predict.
3.3.1. ASTM D5949—D97 Correlations
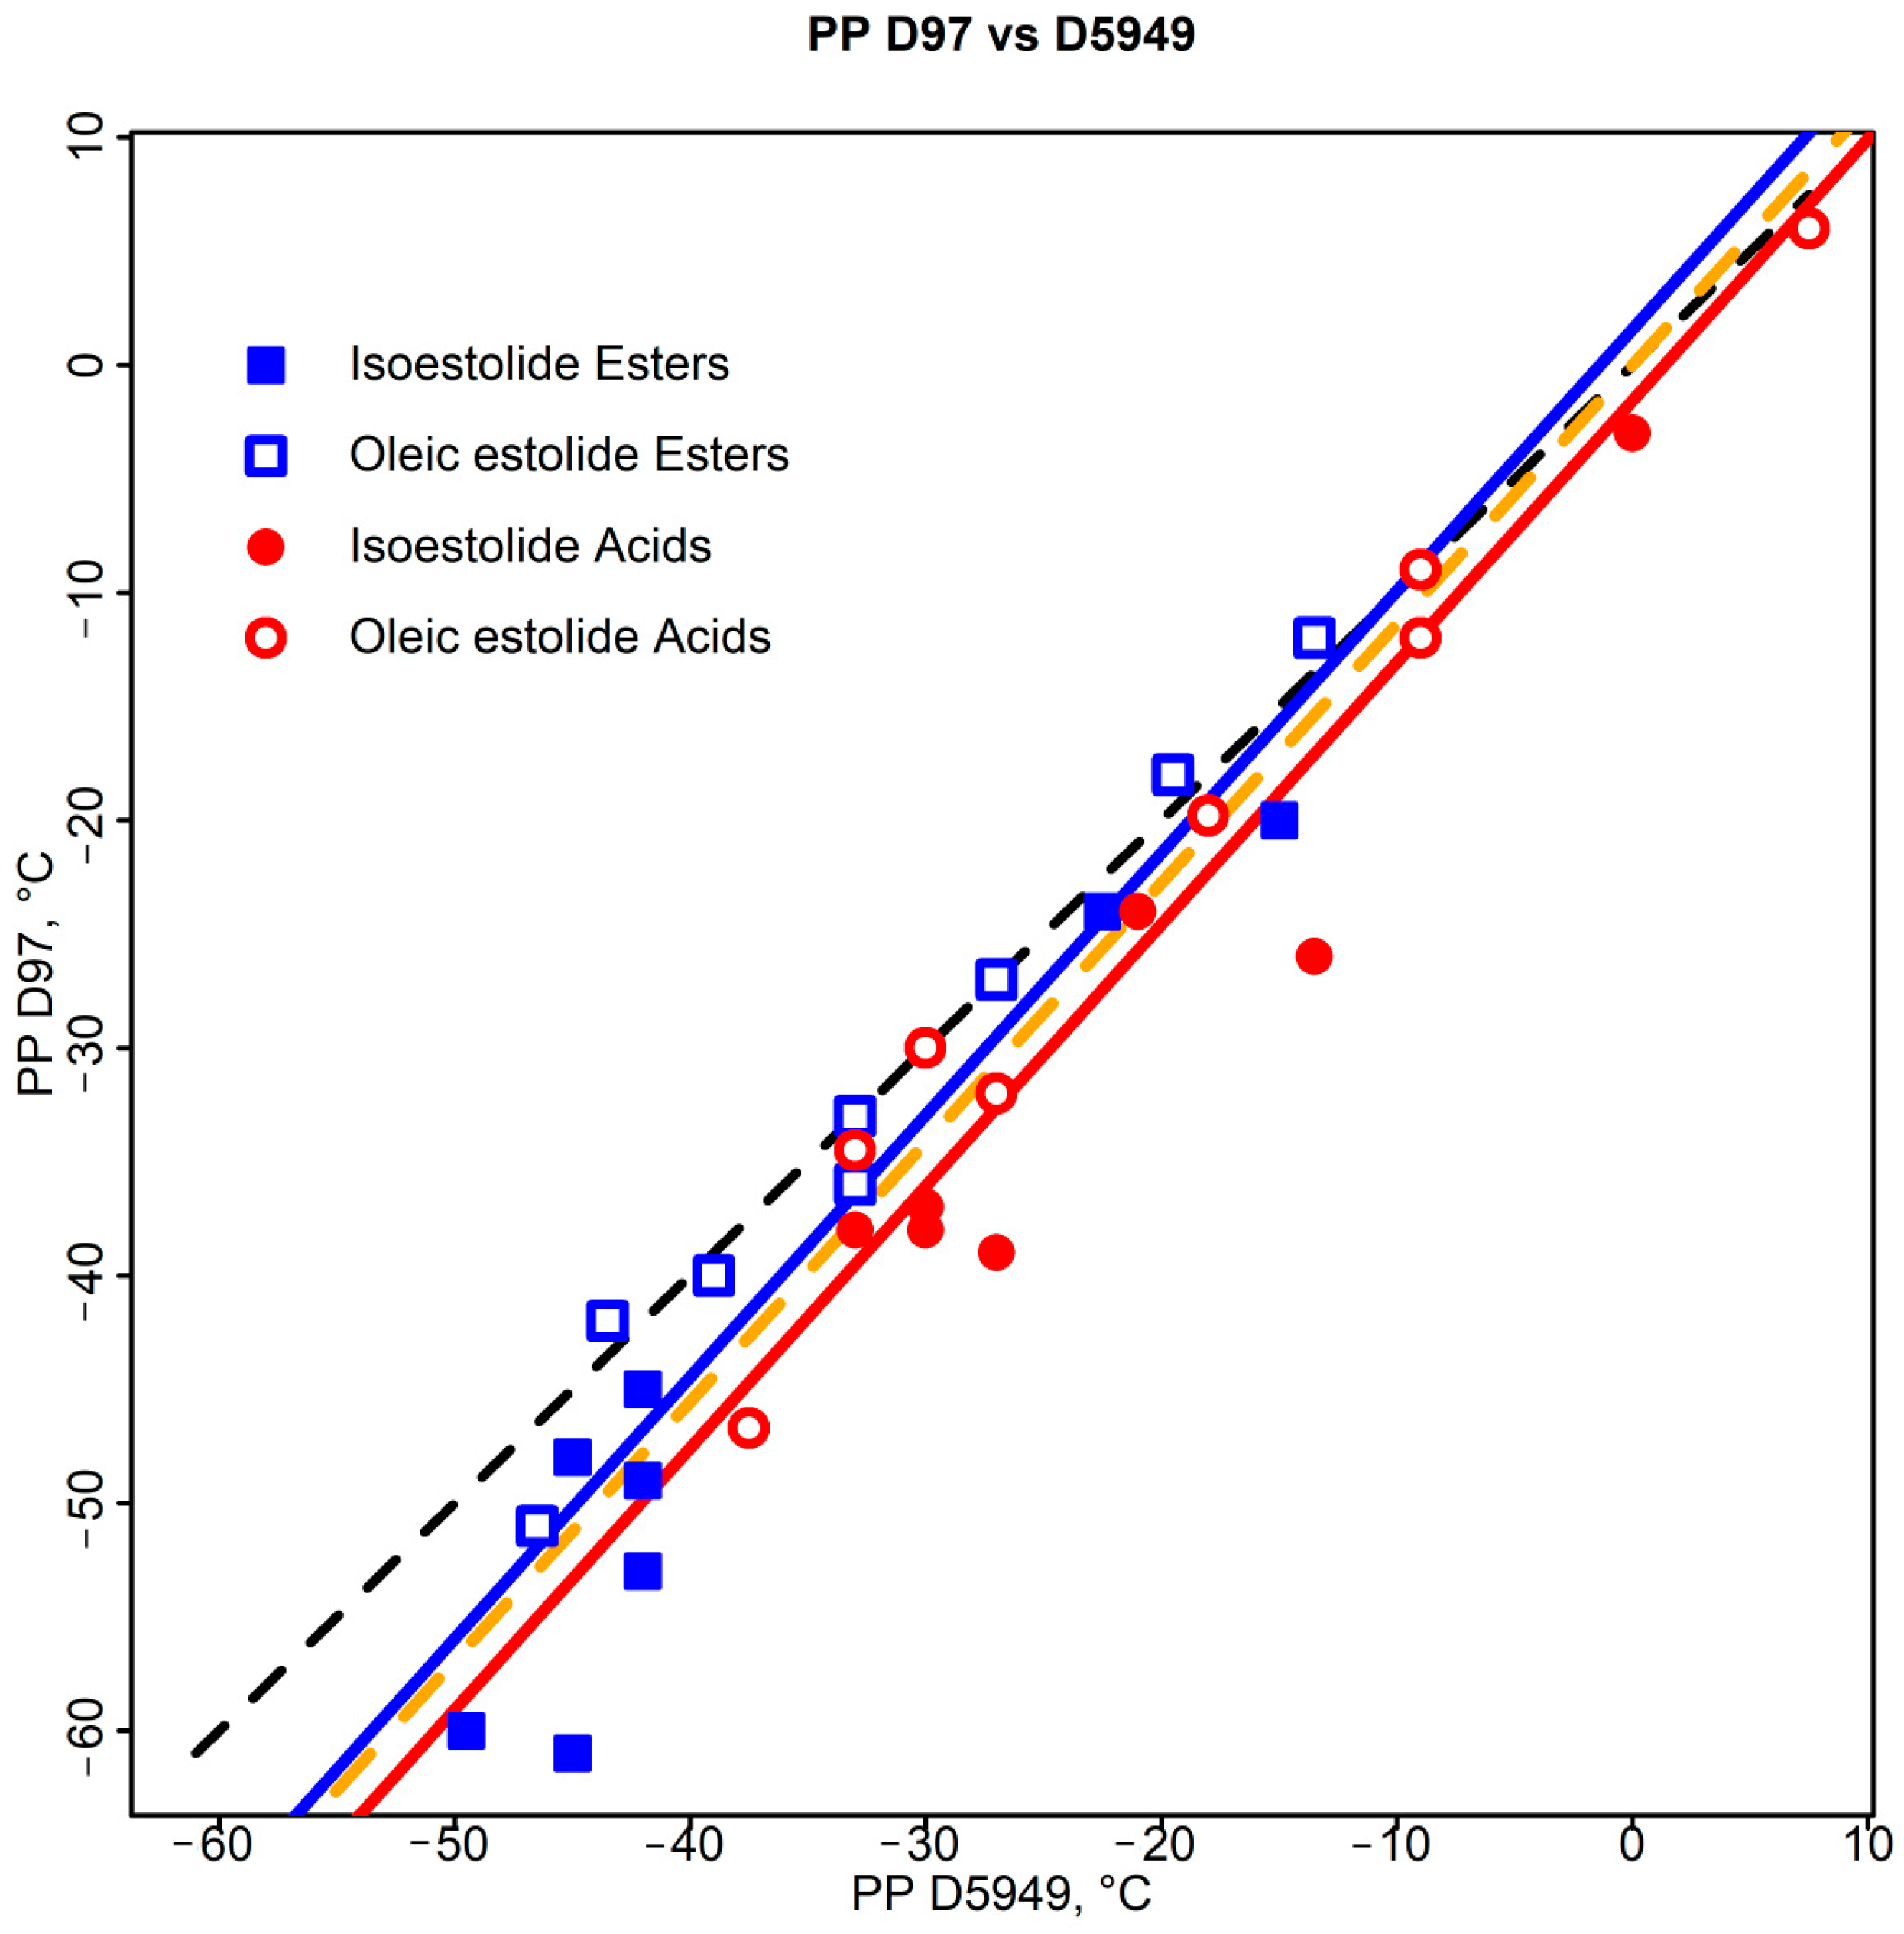
The comparison of the two methods can be seen in Figure 4. Equation (3) shows the best fit of the data. The tendency was for D97 to report slightly lower PP, as seen by the >1 coefficient. Introducing an intercept or quadratic term was not statistically significant. Accounting for acids vs. esters in the Equation (4), using the variable = 0.5 for esters and = −0.5 for acids was statistically significant (p = 0.036 < 0.05). The acid–ester difference of 3.1 °C is slightly higher than the resolutions of the methods (3 °C).
3.3.2. Viscosity–PP Correlations
The result of the viscosity measurements at 15 to 120 °C, summarized by the AM fitting parameters, are reported in Table 2.
The PP measurements determine when the tested material stops flowing. For lubricants, it is usually because the high-melting components form a 3D-crystal network, which traps the liquid phase. Rarely, the pour point in lubricants is observed without crystal network, but because the lubricant viscosity has increased [37]. The theory of glass materials defines a solid-like glass state as being achieved when the viscosity of the fluid raises above a high value, such as 1012 Pa∙s [56]. Extrapolating the viscosity data (Table 2 and Equation (1)) to the temperatures of the PP values resulted in a wide range of viscosities, both for D97 (0.7 to 416 Pa∙s) and for D5949 (0.8 to 201 Pa∙s). This indicates that the extrapolated viscosity values cannot be used for prediction of PP obtained by either method.
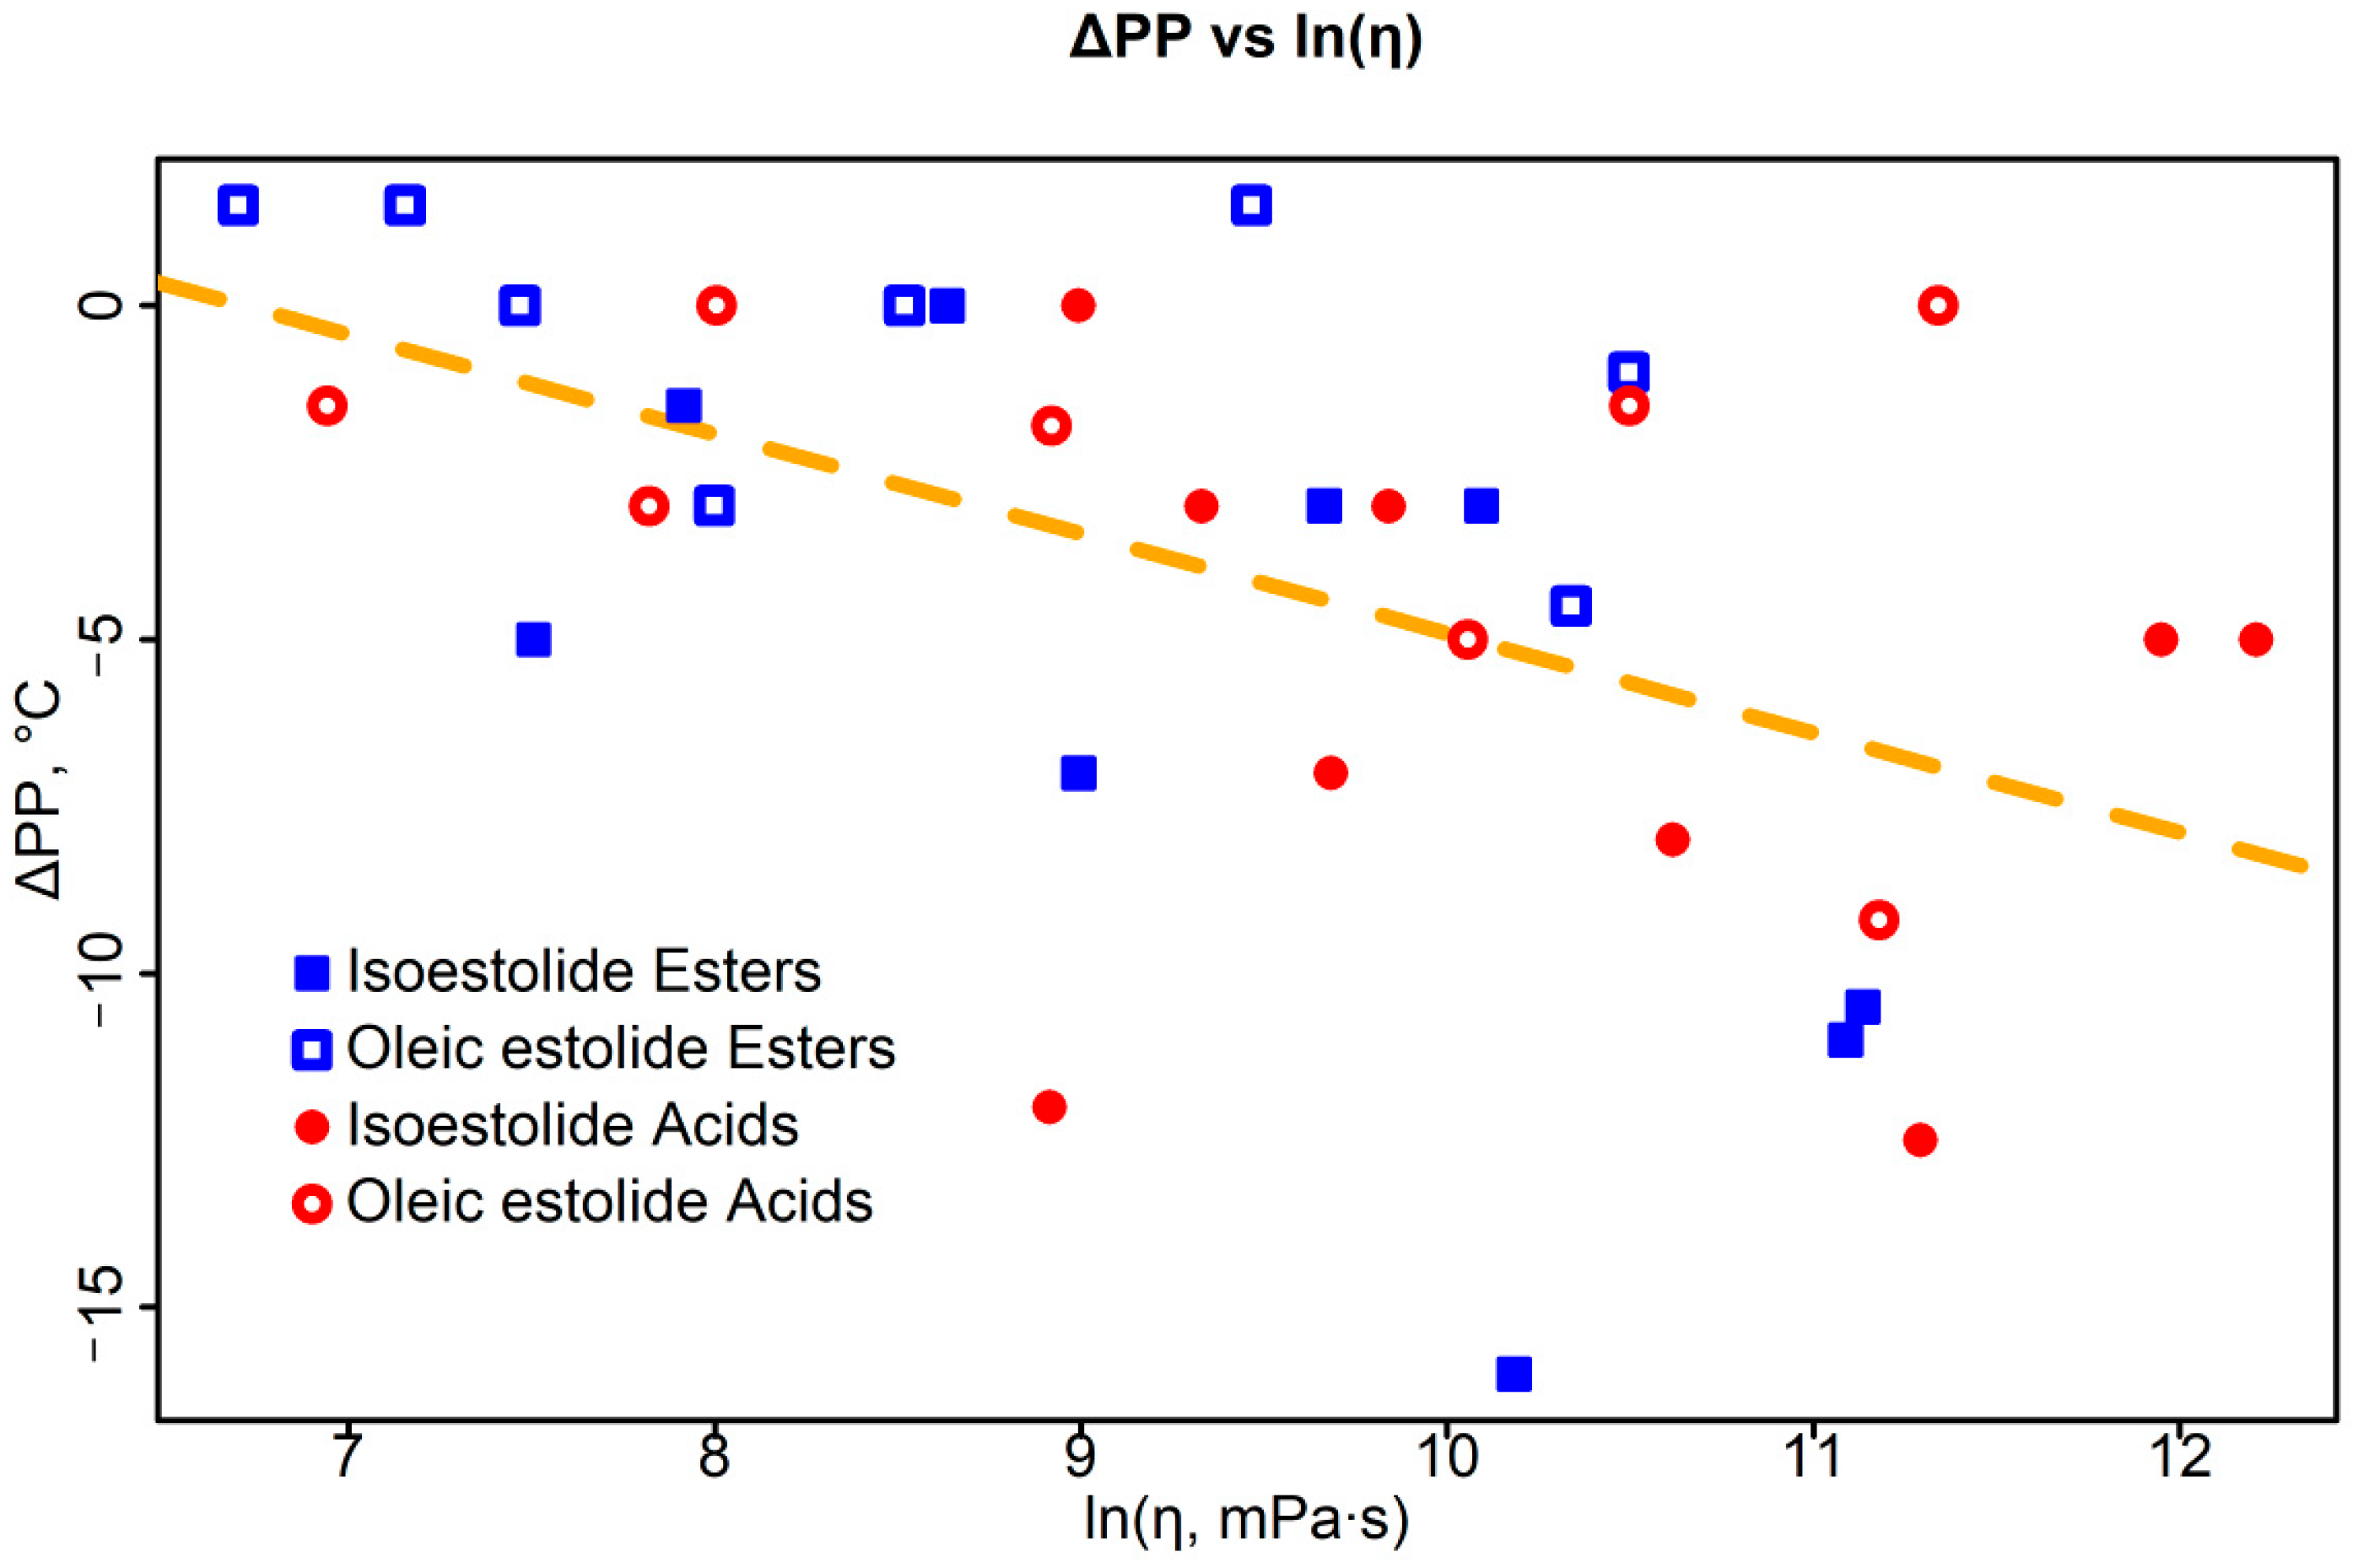
The main idea of this study is to find a method to predict D97 values from the D5949 method. Figure 5 shows the ΔPP = PP(D5949)-PP(D97) values as a function of the ln(η), where the sample viscosity is calculated at the PP(D5949). While there is a correlation between the two values, it is very weak and cannot be used to reliably adjust the values from the micro- to the macro-method.
3.3.3. Density and Surface Tension–PP Correlations
Table 3 shows the density descriptors (Equation (2)) and calculated molecular weight (), parachor (), and surface tension (). was calculated (Equation (5)) with the group contribution method of Mumford and Philips (Table 8.1 in Ref. [60]):
In Equation (5), , , , and are the number of the carbon atoms, hydrogen atoms, carboxylic groups, and carbon–carbon double bonds in the molecules, respectively. According to the group-contribution model for the parachor, the surface tension then can be calculated as a function of temperature, .
Combining Equations (2), (5), and (6), we can estimate the surface tension as a function of temperature. Table 3 includes the surface tension values at the PP, determined by D5949.
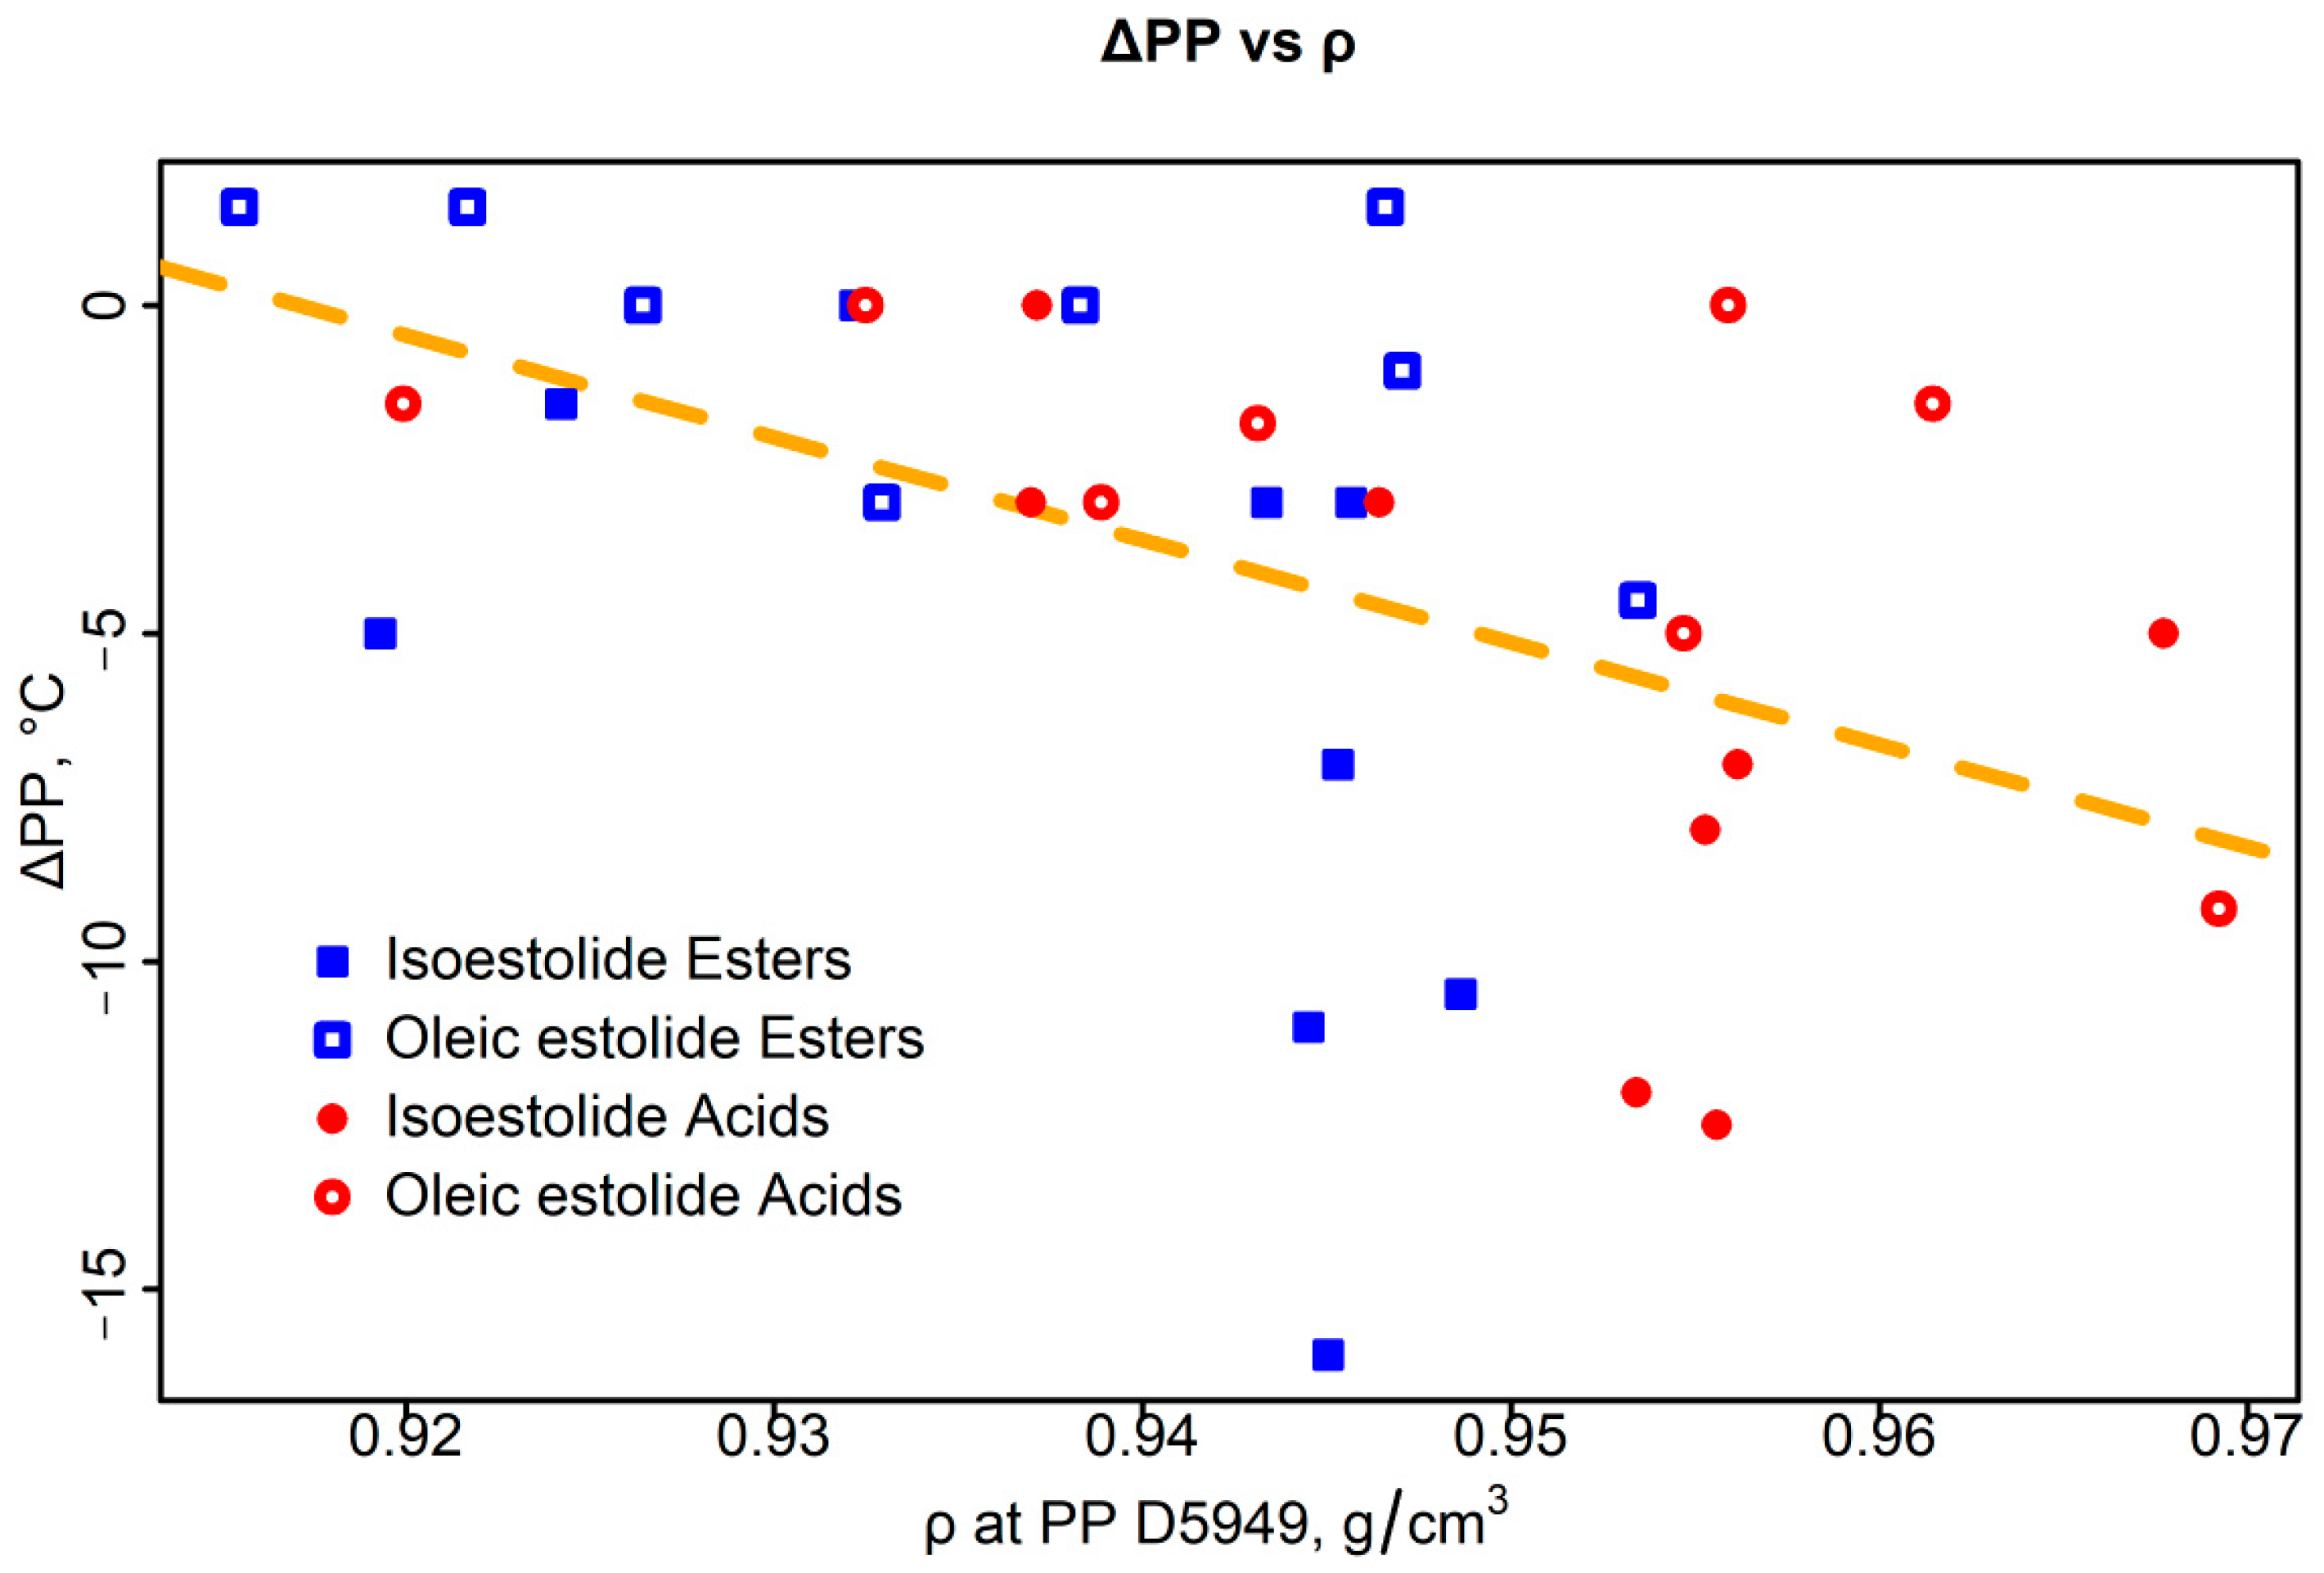
Figure 6 shows the ΔPP = PP(D97)-PP(D5949) presented as a function of the estimated density at the PP from D5949. Most values from D5949 agree with D97 to within 3 °C (the precision with which the PP values are reported) if the density is below 0.944 g/cm3. For higher densities, the discrepancies grow. As discussed above, the higher densities should be expected to decrease the PP determined by D97 compared to D5949 by increasing the gravitational pull. Figure 6 indicates this to be the case.
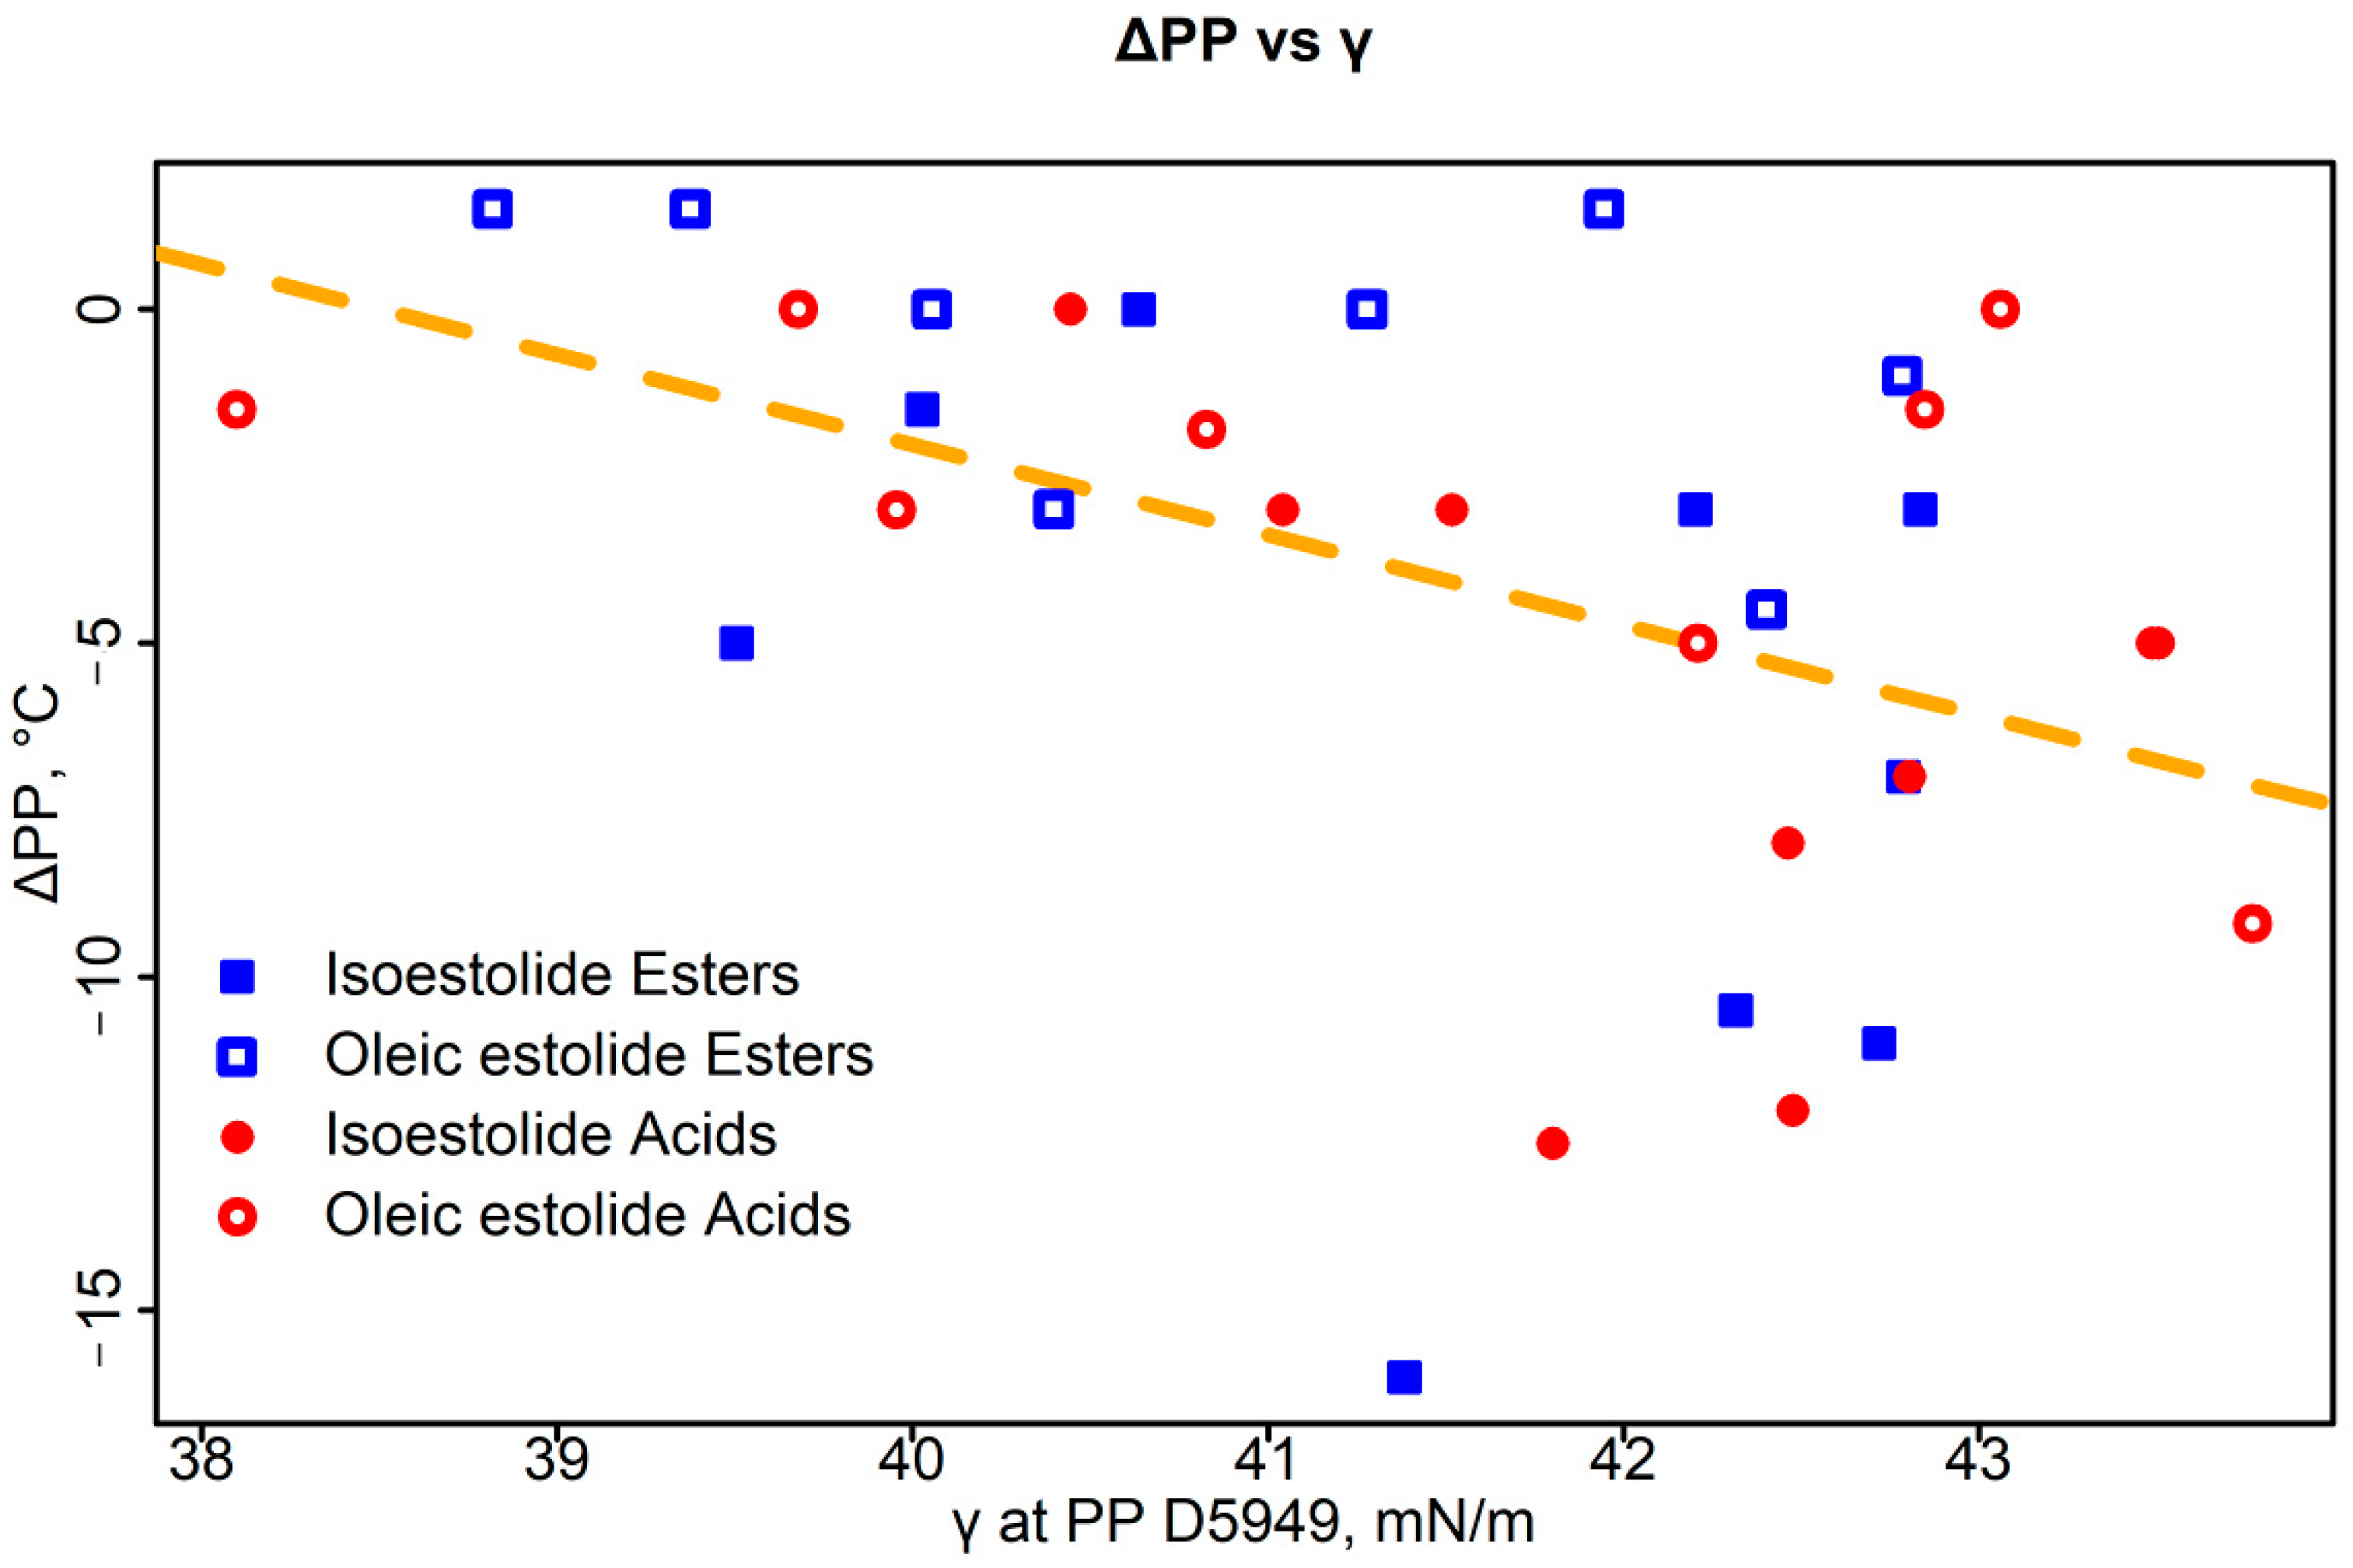
The other option is surface tension. Figure 7 displays the ΔPP = PP(D97)-PP(D5949) as a function of the estimated surface tension. The deviations should be expected to grow more positive with the increase in surface tension due to the stronger suppression of surface motion in D5949. Figure 7 shows that this is not the case, ruling out the surface tension as a strong contributor to discrepancies in the two methods. The observed correlation between the surface tension and the ΔPP is probably due to the strong correlation between surface tension and the density (Equation (6)).
4. Discussion
Coutinho and Daridon [63] discussed different methods for measuring the CP of crude petroleum oils and the possible sources of variation. Their opinion was that the presence of small amounts of long-chain paraffins is the leading source of discrepancies between the results of the different methods. One of their conclusions was that the CP of petroleum fuels should be consistent across the different methods, due to the lack of high-molecular weight components. Dunn et al. [46,64,65,66,67] had previously compared the automatic to manual methods for CP (D5773 vs. D2500) and PP (D5949 vs. D97) for biodiesel (fatty acid alkyl esters) and biodiesel in petroleum diesel samples from different sources. The CP by D5773 on average was higher than the CP by D2500 by ~2 °C. The largest reported deviation of 9 °C was observed for an opaque sample, corroborating the present data. The CP values of the estolides in the current study were very well correlated for samples with low Gardner color. The discrepancies arose for darker samples, most probably due to differences in the thickness of the oil that was monitored in the two methods. The differences between the mini- and macro-methods for CP and PP in the current study depended on the chemistry (esters vs. free acids), so the results should not be generalized for all types of lubricants.
Another possibility for discrepancies is surface or confinement effects. n-Alkanes are reported to freeze at air-alkanes surfaces at temperatures below the bulk freezing temperature [68]. Deposition of solid materials on the surface and interfaces is mentioned in ASTM methods D5773 and D5949 for one kerosene sample. Hammami et al. [69] also mentioned the possibility of surface depositions for crude petroleum oils. Surface-induced freezing of alkanes and fatty acid is a topic of active research [70]. Paiva et al. [52] reported that in rheological measurements of petroleum, if the gap between disks is 2 mm or larger, the reported wax precipitation temperature (WPT) is very close to the PP, while for gaps less than 2 mm, WPT is higher than PP. Since the depth of the lubricant in the D5949 method is very close to 2 mm, confinement effects may be expected to lead to elevated PP values from the D5949 method. Since this is not the case (Figure 4), we can conclude that estolides do not experience confinement effects on the length scales that distort the mini-method.
The PP values showed a systematic trend for D97 values being lower than D5949 values. To some extent, this could be due to the viscosity or density effect on the measurements. The deviations are in the opposite direction than expected if the surface tension had a major effect. The density, viscosity, and surface tension, despite being weakly correlated to the deviations, cannot reliably predict them. Regardless of that, D5949 can be used for screening estolide samples—the correlation with D97 for relatively high-PP (>−20 °C) samples is good. Since most non-synthetic mineral base oils have PP > −20 °C [71], a bio-based candidate with PP < −20 °C, should be considered for larger-scale evaluations, irrespective of the exact PP value.
5. Conclusions
We correlated the cloud point (CP) and pour point (PP) of estolides as determined by macro- (ASTM D2500 and D97) and micro- (D5773 and D5949) methods.
We investigated the effect of several parameters: viscosity, density, estimated surface tension type of end group (acid vs. ester), and Gardner color on the differences between the results from the micro- and macro-methods.
The poor correlation between PP and extrapolated viscosity suggests that the PP for estolides is due to a 3D-crystal network, as opposed to a spatially uniform viscosity increase.
The extrapolated viscosity and density had a low predictive power for the differences in the results by the different methods.
As a conclusion, the small-volume CP method (D5773) can be used instead of D2500 for estolide samples with low (<9) Gardner color. Higher Gardner color can lead to lower CP values, especially for estolide esters. The small-volume PP method (D5949) tends to yield slightly higher values than D97 for estolides, but the agreement is sufficiently good enough to be used as a screening tool when larger volumes are not available.
We speculate that the different sensitivities of the macro- and micro- CP methods towards esters vs. acids stems from the different affinity towards aggregation. At the current stage, we lack sufficient data for a firm conclusion, but this seems like an important venue to investigate further. Further testing is needed to see how the results correlate for other classes of (prospective) lubricants, as well as for oil treated with pour-point depressants.
Author Contributions
Conceptualization, formal analysis, and writing—original draft preparation, G.B.B.; material preparations, Y.C., H.N. and S.C.C.; writing—review and editing, Y.C., H.N., D.D.W. and S.C.C. All authors have read and agreed to the published version of the manuscript.
Funding
This work was funded as part of the in-house research of the Agricultural Research Service of the United States Department of Agriculture.
Data Availability Statement
Dataset available on request from the authors.
Acknowledgments
The authors acknowledge Xiaozhou (Linda) Cao, Amber L. Durham, and Karen Wagner for their technical assistance.
Conflicts of Interest
The authors declare no conflicts of interest.
Disclaimer
Mention of trade names or commercial products in this publication is solely for the purpose of providing specific information and does not imply recommendation or endorsement by the U.S. Department of Agriculture. USDA is an equal opportunity provider and employer.
References
- Ma, S.; Lei, T.; Meng, J.; Liang, X.; Guan, D. Contributions of key countries, enterprises, and refineries to greenhouse gas emissions in global oil refining, 2000–2021. Innovation 2023, 4, 100361. [Google Scholar] [CrossRef] [PubMed]
- Häder, D.P.; Banaszak, A.T.; Villafañe, V.E.; Narvarte, M.A.; González, R.A.; Helbling, E.W. Anthropogenic pollution of aquatic ecosystems: Emerging problems with global implications. Sci. Total Environ. 2020, 713, 136586. [Google Scholar] [CrossRef]
- Chapman, I. The end of Peak Oil? Why this topic is still relevant despite recent denials. Energy Policy 2014, 64, 93–101. [Google Scholar] [CrossRef]
- Nogales-Delgado, S.; Encinar, J.M.; González, J.F. A Review on biolubricants based on vegetable oils through transesterification and the role of catalysts: Current status and future trends. Catalysts 2023, 13, 1299. [Google Scholar] [CrossRef]
- Sanjurjo, C.; Rodríguez, E.; Viesca, J.L.; Battez, A.H. Influence of molecular structure on the physicochemical and tribological properties of biolubricants: A review. Lubricants 2023, 11, 380. [Google Scholar] [CrossRef]
- Narayana Sarma, R.; Vinu, R. Current status and future prospects of biolubricants: Properties and applications. Lubricants 2022, 10, 70. [Google Scholar] [CrossRef]
- Hamnas, A.; Unnikrishnan, G. Bio-lubricants from vegetable oils: Characterization, modifications, applications and challenges—Review. Renew. Sustain. Energy Rev. 2023, 182, 113413. [Google Scholar] [CrossRef]
- Yang, L.; Zhao, X.; Ma, Z.; Ma, S.; Zhou, F. An overview of functional biolubricants. Friction 2023, 11, 23–47. [Google Scholar] [CrossRef]
- Ruhle, T.; Fies, M. Eco Requirements for Lubricant Additives and Base Stocks. In Lubricant Additives: Chemistry and Applications, 3rd ed.; Rudnick, L.R., Ed.; CRC Press: Boca Raton, FL, USA, 2017; pp. 597–619. [Google Scholar] [CrossRef]
- Rudnick, L.R.; Bartz, W.J. Comparison of Synthetic, Mineral Oil, and Bio-based Lubricant Fluids. In Synthetics, Mineral Oils, and Bio-Based Lubricants, 3rd ed.; Rudnick, L.R., Ed.; CRC Press: Boca Raton, FL, USA, 2020; pp. 359–377. [Google Scholar] [CrossRef]
- Schneider, M.P. Plant-oil-based lubricants and hydraulic fluids. J. Sci. Food Agric. 2006, 86, 1769–1780. [Google Scholar] [CrossRef]
- Rabenstein, A.; Koch, T.; Remesch, M.; Brinksmeier, E.; Kuever, J. Microbial degradation of water miscible metal working fluids. Int. Biodeterior. Biodegrad. 2009, 63, 1023–1029. [Google Scholar] [CrossRef]
- Lawate, S.S.; Lal, K.; Huang, C. Vegetable Oils Structure. In Tribology Data Handbook; Richard Booser, E., Ed.; CRC Press: Boca Raton, FL, USA, 1997; pp. 103–116. [Google Scholar]
- Asadauskas, S.; Perez, J.M.; Duda, J.L. Oxidative stability and antiwear properties of high oleic vegetable oils. Lubr. Eng. 1996, 52, 877–882. [Google Scholar]
- Heggs, R. Industrial uses of high-oleic oils. In High Oleic Oils: Development, Properties, and Uses; Flider, F.J., Ed.; AOCS Press: Urbana, IL, USA, 2021; pp. 245–259. [Google Scholar] [CrossRef]
- Winfield, D.D.; Cermak, S.C.; Evangelista, R.L.; Moser, B.R.; McKinney, J.; Pantalone, V. Evaluation of a high oleic soybean oil variety in lubricant and biodiesel applications. J. Am. Oil Chem. Soc. 2023. [Google Scholar] [CrossRef]
- Winfield, D.D.; Dunn, R.O.; Winkler-Moser, J.K.; Cermak, S.C.; Marks, D.M. Characterization, physical properties, and potential industrial applications of high oleic pennycress oil. Ind. Crops Prod. 2024, 210, 118095. [Google Scholar] [CrossRef]
- Karmakar, G.; Ghosh, P.; Kohli, K.; Sharma, B.K.; Erhan, S.Z. Chemicals from vegetable oils, fatty derivatives, and plant biomass. In Innovative Uses of Agricultural Products and Byproducts; Tunick, M.N., Liu, L., Eds.; ACS: Washington, DC, USA, 2020; pp. 1–31. [Google Scholar] [CrossRef]
- Perez, J.M.; Rudnick, L.R.; Erhan, S.Z.; Sharma, B.K.; Kohli, K. Natural Oils as Lubricants. In Synthetics, Mineral Oils, and Bio-Based Lubricants, 3rd ed.; Rudnick, L.R., Ed.; CRC Press: Boca Raton, FL, USA, 2020; p. 392. [Google Scholar] [CrossRef]
- Sharma, B.K.; Karmakar, G.; Erhan, S.Z. Modified Vegetable Oils for Environmentally Friendly Lubricant Applications. In Synthetics, Mineral Oils, and Bio-Based Lubricants, 3rd ed.; Rudnick, L.R., Ed.; CRC Press: Boca Raton, FL, USA, 2020; pp. 399–430. [Google Scholar] [CrossRef]
- Syahir, A.Z.; Zulkifli, N.W.; Masjuki, H.H.; Kalam, M.A.; Alabdulkarem, A.; Gulzar, M.; Khuong, L.S.; Harith, M.H. A review on bio-based lubricants and their applications. J. Clean. Prod. 2017, 168, 997–1016. [Google Scholar] [CrossRef]
- Bantchev, G.B.; Lorenzo-Martin, C.; Ajayi, O.O. Phosphonates from Lipids—Synthesis and Tribological Evaluation. In Conversion of Renewable Biomass into Bioproducts; ACS: Washington, DC, USA, 2021; pp. 139–156. [Google Scholar] [CrossRef]
- Chen, Y.; Biresaw, G.; Cermak, S.C.; Isbell, T.A.; Ngo, H.L.; Chen, L.; Durham, A.L. Fatty acid estolides: A review. J. Am. Oil Chem. Soc. 2020, 97, 231–241. [Google Scholar] [CrossRef]
- Bredsguard, J.W.; Thompson, T.D.; Cermak, S.C.; Isbell, T.A. Estolides: Bioderived synthetic base oils. In Environmentally Friendly and Biobased Lubricants, 1st ed.; Sharma, B.K., Biresaw, G., Eds.; CRC Press: Boca Raton, FL, USA, 2016; pp. 35–49. [Google Scholar] [CrossRef]
- Isbell, T.A.; Lowery, B.A.; Vermillion, K.; Cermak, S.C. Synthesis and characterization of polyethylene glycol diesters from estolides containing epoxides and diols. J. Am. Oil Chem. Soc. 2020, 97, 409–423. [Google Scholar] [CrossRef]
- Biresaw, G.; Chen, Y.; Chen, L.; Ngo, H.; Wagner, K.; Vermillion, K.E.; Cermak, S.C. Iso-oleic estolide products with superior cold flow properties. Ind. Crops Prod. 2022, 182, 114857. [Google Scholar] [CrossRef]
- Hoong, S.S.; Arniza, M.Z.; Mariam, N.M.; Armylisas, A.H.; Ishak, S.A.; Ismail, T.N.; Yeong, S.K. Synthesis of estolide ester and amide from acetylated polyhydroxy estolide for lubricant base oil. Eur. J. Lipid Sci. Technol. 2020, 122, 2000098. [Google Scholar] [CrossRef]
- Joshi, J.R.; Bhanderi, K.K.; Patel, J.V. A review on bio-lubricants from non-edible oils-recent advances, chemical modifications and applications. J. Indian Chem. Soc. 2023, 100, 100849. [Google Scholar] [CrossRef]
- Thakur, R.; Sanap, P.; Gogate, P.; Pratap, A. Ultrasound-assisted synthesis of oleic estolide: Optimization, process intensification and kinetic study. Chem. Eng. Process.-Process Intensif. 2023, 193, 109533. [Google Scholar] [CrossRef]
- Sanap, P.S.; Bhilpawar, O.V.; Patil, S.S.; Mestri, R.S. Synthesis of Polyol Esters of Estolide and Evaluation of Their Tribological Properties. Available SSRN 2024, 4760749. [Google Scholar] [CrossRef]
- Sanap, P.; Sonawane, D.; Patil, S.; Pratap, A. Optimization of oleic-estolide fatty acid synthesis using response surface methodology and artificial neural networks. Ind. Crops Prod. 2022, 188, 115711. [Google Scholar] [CrossRef]
- de Haro, J.C.; del Prado Garrido, M.; Pérez, Á.; Carmona, M.; Rodríguez, J.F. Full conversion of oleic acid to estolides esters, biodiesel and choline carboxylates in three easy steps. J. Clean. Prod. 2018, 184, 579–585. [Google Scholar] [CrossRef]
- Ewing, T.A.; Blaauw, R.; Li, C.; Venkitasubramanian, P.; Hagberg, E.; van Haveren, J. Synthesis and Applications of Fatty Acid Estolides. In Sustainable Green Chemistry in Polymer Research. Volume 1. Biocatalysis and Biobased Materials, 1st ed.; Cheng, H.N., Gross, R.A., Eds.; ACS: Washington, DC, USA, 2023; pp. 145–161. [Google Scholar] [CrossRef]
- Cermak, S.C.; Isbell, T.A. Synthesis of estolides from oleic and saturated fatty acids. J. Am. Oil Chem. Soc. 2001, 78, 557–565. [Google Scholar] [CrossRef]
- USDA BioPreferred Success Stories. Available online: https://www.biopreferred.gov/BioPreferred/faces/pages/SuccessStories.xhtml (accessed on 6 April 2024).
- Kania, D.; Yunus, R.; Omar, R.; Rashid, S.A.; Jan, B.M. A review of biolubricants in drilling fluids: Recent research, performance, and applications. J. Pet. Sci. Eng. 2015, 135, 177–184. [Google Scholar] [CrossRef]
- Stachowiak, G.W.; Batchelor, A.W. Engineering Tribology; Butterworth Heinemann: Woburn, MA, USA, 2001; p. 36. [Google Scholar]
- ASTM D97-17b; Standard Test Method for Pour Point of Petroleum Products. Annual Book of ASTM Standards (Vol. 05.01). ASTM International: West Conshohocken, PA, USA, 2022; pp. 106–112. [CrossRef]
- ASTM D2500-17a; Standard Test Method for Cloud Point of Petroleum Products and Liquid Fuels. Annual Book of ASTM Standards (Vol. 05.01). ASTM International: West Conshohocken, PA, USA, 2022; pp. 996–1001. [CrossRef]
- Ghosh, P.; Das, M. Study of the influence of some polymeric additives as viscosity index improvers and pour point depressants—Synthesis and characterization. J. Pet. Sci. Eng. 2014, 119, 79–84. [Google Scholar] [CrossRef]
- Chan, C.H.; Tang, S.W.; Mohd, N.K.; Lim, W.H.; Yeong, S.K.; Idris, Z. Tribological behavior of biolubricant base stocks and additives. Renew. Sustain. Energy Rev. 2018, 93, 145–157. [Google Scholar] [CrossRef]
- Chiu, C.W.; Schumacher, L.G.; Suppes, G.J. Impact of cold flow improvers on soybean biodiesel blend. Biomass Bioenergy 2004, 27, 485–491. [Google Scholar] [CrossRef]
- ASTM D5949-16; Standard Test Method for Pour Point of Petroleum Products (Automatic Pressure Pulsing Method). Annual Book of ASTM Standards (Vol. 05.021). ASTM International: West Conshohocken, PA, USA, 2022; pp. 1243–1248. [CrossRef]
- ASTM D5773-21; Standard Test Method for Cloud Point of Petroleum Products and Liquid Fuels (Constant Cooling Rate Method). Annual Book of ASTM Standards (Vol. 05.02). ASTM International: West Conshohocken, PA, USA, 2022; pp. 1114–1120. [CrossRef]
- Noel, F. Thermal analysis of lubricating oils. Thermochim. Acta. 1972, 4, 377–392. [Google Scholar] [CrossRef]
- Dunn, R.O. Thermal analysis of alternative diesel fuels from vegetable oils. J. Am. Oil Chem. Soc. 1999, 76, 109–115. [Google Scholar] [CrossRef]
- Leggieri, P.A.; Senra, M.; Soh, L. Cloud point and crystallization in fatty acid ethyl ester biodiesel mixtures with and without additives. Fuel 2018, 222, 243–249. [Google Scholar] [CrossRef]
- Govindapillai, A.; Jayadas, N.H.; Bhasi, M. Analysis of the pour point of coconut oil as a lubricant base stock using differential scanning calorimetry. Lubr. Sci. 2009, 21, 13–26. [Google Scholar] [CrossRef]
- Wang, S.L.; Flamberg, A.; Kikabhai, T. Select the optimum pour point depressant: Feedstocks and products: A special report. Hydrocarb. Process. 1999, 78, 59–62. Available online: https://search.ebscohost.com/login.aspx?direct=true&db=eih&AN=1639926&site=ehost-live (accessed on 5 April 2024).
- Rhee, I.S.; Velez, C.; Von Bernewitz, K. Evaluation of environmentally acceptable hydraulic fluids. In NLGI Spokesman-Including NLGI Annual Meeting-National Lubricating Grease Institute; National Lubricating Grease Institute: Kansas City, MO, USA, 1996; Volume 60, pp. 28–35. [Google Scholar]
- Adhvaryu, A.; Liu, Z.; Erhan, S.Z. Synthesis of novel alkoxylated triacylglycerols and their lubricant base oil properties. Ind. Crops Prod. 2005, 21, 113–119. [Google Scholar] [CrossRef]
- Paiva, F.L.; Marchesini, F.H.; Calado, V.M.; Galliez, A.P. Wax precipitation temperature measurements revisited: The role of the degree of sample confinement. Energy Fuels 2017, 31, 6862–6875. [Google Scholar] [CrossRef]
- Ngo, H.; Latona, R.; Wagner, K.M.; Nuñez, A.; Ashby, R.; Dunn, R.O. Synthesis and low temperature characterization of iso-oleic ester derivatives. Eur. J. Lipid Sci. Technol. 2016, 118, 1915–1925. [Google Scholar] [CrossRef]
- ASTM D7042-11a; Standard Test Method for Dynamic Viscosity and Density of Liquids by Stabinger Viscometer (and the Calculation of Kinematic Viscosity) Annual Book of ASTM Standards (Vol. 05.02). ASTM International: West Conshohocken, PA, USA, 2012; pp. 186–193. [CrossRef]
- Avramov, I.; Milchev, A. Effect of disorder on diffusion and viscosity in condensed systems. J. Non-Cryst. Solids 1988, 104, 253–260. [Google Scholar] [CrossRef]
- Mauro, J.C.; Yue, Y.; Ellison, A.J.; Gupta, P.K.; Allan, D.C. Viscosity of glass-forming liquids. Proc. Natl. Acad. Sci. USA 2009, 106, 19780–19784. [Google Scholar] [CrossRef] [PubMed]
- Nascimento, M.L.; Aparicio, C. Data classification with the Vogel–Fulcher–Tammann–Hesse viscosity equation using correspondence analysis. Phys. B 2007, 398, 71–77. [Google Scholar] [CrossRef]
- Bantchev, G.B.; Cermak, S.C. Correlating viscosity of 2-ethylhexyl oleic estolide esters to their molecular weight. Fuel 2022, 309, 122190. [Google Scholar] [CrossRef]
- Elbro, H.S.; Fredenslund, A.; Rasmussen, P. Group contribution method for the prediction of liquid densities as a function of temperature for solvents, oligomers, and polymers. Ind. Eng. Chem. Res. 1991, 30, 2576–2582. [Google Scholar] [CrossRef]
- van Krevelen, D.W. Properties of Polymers, 3rd ed.; Elsevier: Amsterdam, The Netherlands, 1990; pp. 227–229. [Google Scholar]
- Box, G.E.P.; Hunter, W.G.; Hunter, J.S. Statistics for Experimenters, 2nd ed.; John Wiley & Sins: New York, NY, USA, 1978; pp. 145–150. [Google Scholar]
- Haley, S.; Newcomb, T.; Vickerman, R. Transmissions and Transmission fluids. In Synthetics, Mineral Oils, and Bio-Based Lubricants, 3rd ed.; Rudnick, L.R., Ed.; CRC Press: Boca Raton, FL, USA, 2020; p. 547. [Google Scholar]
- Coutinho, J.A.; Daridon, J.L. The limitations of the cloud point measurement techniques and the influence of the oil composition on its detection. Pet. Sci. Technol. 2005, 23, 1113–1128. [Google Scholar] [CrossRef]
- Dunn, R. Cold flow properties of biodiesel by automatic and manual analysis methods. J. ASTM Int. 2010, 7, 1–5. [Google Scholar] [CrossRef]
- Wyatt, V.T.; Hess, M.A.; Dunn, R.O.; Foglia, T.A.; Haas, M.J.; Marmer, W.N. Fuel Properties and Nitrogen Oxide Emission Levels of Biodiesel Produced from Animal Fats. J. Am. Oil Chem. Soc. 2005, 82, 585–591. [Google Scholar] [CrossRef]
- Chiou, B.S.; El-Mashad, H.M.; Avena-Bustillos, R.J.; Dunn, R.O.; Bechtel, P.J.; McHugh, T.H.; Imam, S.H.; Glenn, G.M.; Orts, W.J.; Zhang, R. Biodiesel from Waste Salmon Oil. Trans. ASABE 2008, 51, 797–802. [Google Scholar] [CrossRef]
- Dunn, R.O. Cold Flow Properties of Soybean Oil Fatty Acid Monoalkyl Ester Admixtures. Energy Fuels 2009, 23, 4082–4091. [Google Scholar] [CrossRef]
- Ocko, B.M.; Wu, X.Z.; Sirota, E.B.; Sinha, S.K.; Gang, O.; Deutsch, M. Surface freezing in chain molecules: Normal alkanes. Phys. Rev. E 1997, 55, 3164. [Google Scholar] [CrossRef]
- Hammami, A.; Ratulowski, J.; Coutinho, J.A. Cloud points: Can we measure or model them? Pet. Sci. Technol. 2003, 21, 345–358. [Google Scholar] [CrossRef]
- Cholakova, D.; Denkov, N. Rotator phases in alkane systems: In bulk, surface layers and micro/nano-confinements. Adv. Colloid Interf. Sci. 2019, 269, 7–42. [Google Scholar] [CrossRef]
- Mortier, R.M.; Fox, M.F.; Orszulik, S.T. (Eds.) Chemistry and Technology of Lubricants, 3rd ed.; Springer: Dordrecht, The Netherlands, 2010. [Google Scholar]
Scheme 1.
Synthesis of oleic estolides [34]. R is the aliphatic chain of the capping fatty acid. EN is the estolide number.
Scheme 1.
Synthesis of oleic estolides [34]. R is the aliphatic chain of the capping fatty acid. EN is the estolide number.

Scheme 2.
Synthesis of iso-oleic estolides [26,53]. The dashed line symbolizes that iso-oleic acid is a mixture of isomers with varying position of the methyl group. R is the aliphatic chain of the capping fatty acid. EN is the estolide number.

Figure 1.
D5773 values (dots) vs. D2500 values. The black dashed line indicates the equivalence line (D2500 = D5773).
Figure 1.
D5773 values (dots) vs. D2500 values. The black dashed line indicates the equivalence line (D2500 = D5773).

Figure 2.
ΔCP = CP(D2500)-CP(D5773) vs. Gardner color.

Figure 3.
Schematic illustrations of the PP methods (not to scale). (a) D97. The test tube is tilted and the lubricant flows due to gravitation. (b) D5949. The sample is kept horizontal, and the surface is disturbed by air flow. The waves are formed against the gravitation.
Figure 3.
Schematic illustrations of the PP methods (not to scale). (a) D97. The test tube is tilted and the lubricant flows due to gravitation. (b) D5949. The sample is kept horizontal, and the surface is disturbed by air flow. The waves are formed against the gravitation.

Figure 4.
Comparison of D97 vs. D5949. The black dashed line is the equivalence (PP D97 = PP D5949). The dashed orange line is a linear fit through all the datapoints, treated equally (Equation (3)). Red and blue lines are joint fit that accounts for esters/acids by using the “” variable (Equation (4)). p = 0.036 that is statistical noise.

Figure 5.
The viscosity (at PP-D5949) has a low predictive power for the difference in values between D5949 and D97. The dashed orange line is a linear fit through all the datapoints.
Figure 5.
The viscosity (at PP-D5949) has a low predictive power for the difference in values between D5949 and D97. The dashed orange line is a linear fit through all the datapoints.

Figure 6.
The ΔPP presented as a function of the estimated density at the PP from D5949. The dashed orange line is a linear fit through all the datapoints.
Figure 6.
The ΔPP presented as a function of the estimated density at the PP from D5949. The dashed orange line is a linear fit through all the datapoints.

Figure 7.
The ΔPP presented as a function of the estimated surface tension at the PP from D5949. The dashed orange line is a linear fit through all the datapoints.
Figure 7.
The ΔPP presented as a function of the estimated surface tension at the PP from D5949. The dashed orange line is a linear fit through all the datapoints.


Table 1.
CP and PP ± the standard deviation of the values (n = 2) in °C. ΔCP = (CP D2500-CP D5773); ΔPP = (PP D97-D5949).
Table 1.
CP and PP ± the standard deviation of the values (n = 2) in °C. ΔCP = (CP D2500-CP D5773); ΔPP = (PP D97-D5949).
| # | Estolide | CP D5773-21 | PP D5949-16 | ΔCP | ΔPP |
|---|---|---|---|---|---|
| 1 | II | N/A 2 | −27.0 ± 0.0 | N/A | −5.0 |
| 2 | I-C8 | −51.2 ± 2.8 | −33.0 ± 0.0 | 16.4 | −5.0 |
| 3 | I-C10 | N/A | −13.5 ± 2.1 | N/A | −12.5 |
| 4 | I-C12 | −34.5 ± 0.0 | −30.0 ± 0.0 | 2.3 | −8.0 |
| 5 | I-Coco | −18.9 ± 0.7 | −27.0 ± 0.0 | 1.1 | −12.0 |
| 6 | I-C14 | −22.8 ± 0.1 | −21.0 ± 0.0 | 1.8 | −3.0 |
| 7 | I-C16 | −8.9 ± 0.1 | −9.0 ± 0.0 | 0.9 | 0.0 |
| 8 | I-C18 | −0.9 ± 0.2 | 0.0 ± 0.0 | 0.9 | −3.0 |
| 9 | OO | −34.7 ± 0.1 | −30 ± 0.0 | 2.4 | 0.0 |
| 10 | O-C8 | −41.7 ± 0.2 | −37.5 ± 2.1 | 2.0 | −9.2 |
| 11 | O-C10 | −35.4 ± 0.2 | −33.0 ± 0.0 | 1.4 | −1.5 |
| 12 | O-C12 | −31.1 ± 0.1 | −27.0 ± 0.0 | 1.9 | −5.0 |
| 13 | O-Coco | −8.4 ± 0.3 | −9.0 ± 0.0 | 4.1 | −3.0 |
| 14 | O-C14 | −17.9 ± 0.0 | −18.0 ± 0.0 | 1.9 | −1.8 |
| 15 | O-C16 | −8.9 ± 0.1 | −9.0 ± 0.0 | 1.9 | 0.0 |
| 16 | O-C18 | 8.3 ± 0.1 | 7.5 ± 2.1 | 2.0 | −1.5 |
| 17 | II-2EH | −70.1 ± 1.6 | −42.0 ± 0.0 | 28.8 | −11.0 |
| 18 | I-C8-2EH | −33.2 ± 1.1 | −45.0 ± 0.0 | 11.2 | −16.0 |
| 19 | I-C10-2EH | −55.3 ± 0.1 | −49.5 ± 2.1 | 19.6 | −10.5 |
| 20 | I-C12-2EH | −47.4 ± 0.3 | −45.0 ± 0.0 | 22.4 | −3.0 |
| 21 | I-Coco-2EH | −43.2 ± 0.1 | −42.0 ± 0.0 | 20.9 | −3.0 |
| 22 | I-C14-2EH | −32.2 ± 0.2 | −33.0 ± 0.0 | 2.9 | 0.0 |
| 23 | I-C16-2EH | −19.9 ± 0.1 | −22.5 ± 2.1 | 1.6 | −1.5 |
| 24 | I-C18-2EH | −11.1 ± 0.1 | −15.0 ± 0.0 | 1.1 | −5.0 |
| 25 | OO-2EH | −41.2 ± 0.0 | −39.0 ± 0.0 | 3.5 | −1.0 |
| 26 | O-C8-2EH | −47.3 ± 0.0 | −46.5 ± 2.1 | 24.3 | −4.5 |
| 27 | O-C10-2EH | −43.9 ± 0.1 | −43.5 ± 2.1 | 5.6 | 1.5 |
| 28 | O-C12-2EH | −31.5 ± 0.1 | −33.0 ± 0.0 | 2.5 | −3.0 |
| 29 | O-Coco-2EH | −35.0 ± 0.0 | −33.0 ± 0.0 | 22.0 | 0.0 |
| 30 | O-C14-2EH | −26.6 ± 0.1 | −27.0 ± 0.0 | 1.6 | 0.0 |
| 31 | O-C16-2EH | −17.9 ± 0.1 | −19.5 ± 2.1 | 2.9 | 1.5 |
| 32 | O-C18-2EH | −11.5 ± 0.1 | −13.5 ± 2.1 | 2.2 | 1.5 |
| 33 | I-Coco(17) 1 | −34.1 ± 0.3 | −30.0 ± 0.0 | 0.8 | −7.0 |
| 34 | I-Coco-2EH(17) 1 | −43.6 ± 0.1 | −42.0 ± 0.0 | 16.8 | −7.0 |
1 The I-Coco and I-Coco-2EH estolides before treatment to reduce the Gardner color. 2 N/A—not available, the D5773-21 failed to report a value.
Table 2.
Viscosity descriptors and extrapolated viscosities at PP.
| # | Estolide | A 1 | B 1 | β 1 | η @D97 2 | η @D5949 2 |
|---|---|---|---|---|---|---|
| 1 | II | −1.3354 | 120.625 | 2.44909 | 3.1 × 10⁵ | 1.5 × 10⁵ |
| 2 | I-C8 | −1.3714 | 120.249 | 2.48942 | 4.2 × 10⁵ | 2.0 × 10⁵ |
| 3 | I-C10 | −1.3685 | 133.360 | 2.46777 | 4.1 × 10⁵ | 8.0 × 10⁴ |
| 4 | I-C12 | −1.3025 | 110.892 | 2.51037 | 1.2 × 10⁵ | 4.1 × 10⁴ |
| 5 | I-Coco | −1.4422 | 93.463 | 2.44228 | 2.9 × 10⁴ | 7.4 × 10³ |
| 6 | I-C14 | −1.2788 | 112.005 | 2.49754 | 2.6 × 10⁴ | 1.9 × 10⁴ |
| 7 | I-C16 | −1.3031 | 113.672 | 2.47245 | 8.0 × 10³ | 8.0 × 10³ |
| 8 | I-C18 | −1.3921 | 126.289 | 2.45442 | 1.5 × 10⁴ | 1.1 × 10⁴ |
| 9 | OO | −1.0688 | 105.020 | 2.40368 | 8.4 × 10⁴ | 4.1 × 10³ |
| 10 | O-C8 | −1.3253 | 102.086 | 2.44957 | 2.6 × 10⁵ | 7.2 × 10⁴ |
| 11 | O-C10 | −1.4102 | 99.826 | 2.42697 | 4.3 × 10⁴ | 3.6 × 10⁴ |
| 12 | O-C12 | −1.3390 | 101.374 | 2.42637 | 4.2 × 10⁴ | 2.3 × 10⁴ |
| 13 | O-Coco | −1.3877 | 96.290 | 2.41640 | 3.2 × 10³ | 2.5 × 10³ |
| 14 | O-C14 | −1.3513 | 99.189 | 2.42102 | 8.9 × 10³ | 7.5 × 10³ |
| 15 | O-C16 | −1.3590 | 97.412 | 2.41126 | 3.0 × 10³ | 3.0 × 10³ |
| 16 | O-C18 | −1.1424 | 109.987 | 2.52974 | 1.2 × 10³ | 1.0 × 10³ |
| 17 | II-2EH | −0.6125 | 124.540 | 2.82254 | 3.7 × 10⁵ | 6.5 × 10⁴ |
| 18 | I-C8-2EH | −0.7917 | 117.352 | 2.87283 | 3.4 × 10⁵ | 2.6 × 10⁴ |
| 19 | I-C10-2EH | −0.7661 | 119.492 | 2.86565 | 4.0 × 10⁵ | 6.9 × 10⁴ |
| 20 | I-C12-2EH | −0.7951 | 115.409 | 2.86214 | 3.7 × 10⁴ | 2.4 × 10⁴ |
| 21 | I-Coco-2EH | −0.7992 | 110.963 | 2.81811 | 2.3 × 10⁴ | 1.6 × 10⁴ |
| 22 | I-C14-2EH | −0.7670 | 115.659 | 2.86472 | 5.6 × 10³ | 5.6 × 10³ |
| 23 | I-C16-2EH | −0.7489 | 115.710 | 2.82070 | 3.2 × 10³ | 2.7 × 10³ |
| 24 | I-C18-2EH | −0.7663 | 116.903 | 2.79272 | 2.9 × 10³ | 1.8 × 10³ |
| 25 | OO-2EH | −0.5535 | 110.547 | 2.70694 | 4.1 × 10⁴ | 3.6 × 10⁴ |
| 26 | O-C8-2EH | −0.7871 | 108.930 | 2.78823 | 5.9 × 10⁴ | 3.1 × 10⁴ |
| 27 | O-C10-2EH | −0.8400 | 106.214 | 2.80580 | 1.1 × 10⁴ | 1.3 × 10⁴ |
| 28 | O-C12-2EH | −0.8592 | 103.273 | 2.80339 | 4.1 × 10³ | 3.0 × 10³ |
| 29 | O-Coco-2EH | −0.7918 | 106.959 | 2.78660 | 5.0 × 10³ | 5.0 × 10³ |
| 30 | O-C14-2EH | −0.8385 | 102.842 | 2.79330 | 1.8 × 10³ | 1.8 × 10³ |
| 31 | O-C16-2EH | −0.7878 | 104.983 | 2.77360 | 1.1 × 10³ | 1.3 × 10³ |
| 32 | O-C18-2EH | −0.7776 | 104.025 | 2.75936 | 7.2 × 10² | 8.1 × 10² |
| 33 | I-Coco(17) | −1.4220 | 96.128 | 2.42924 | 3.6 × 10⁴ | 1.6 × 10⁴ |
| 34 | I-Coco-2EH(17) | −0.8662 | 101.653 | 2.78441 | 1.9 × 10⁴ | 8.1 × 10³ |
1 Fitting parameters, see Equation (1). 2 Extrapolated values (in mPa∙s), using Equation (1).
Table 3.
Density descriptors (Equation (2)), and estimated MW, parachor (P), and surface tensions () at PP D5949.
Table 3.
Density descriptors (Equation (2)), and estimated MW, parachor (P), and surface tensions () at PP D5949.
| # | b (×104) | c (×107) | t0 | P | MW | 1 | ||
|---|---|---|---|---|---|---|---|---|
| 1 | 1.1187 | 7.97160 | 4.2313 | 62.31 | 1532 | 570 | 0.9547 | 43.5 |
| 2 | 1.1100 | 8.03781 | 4.5781 | 62.31 | 2193 | 826 | 0.9677 | 43.5 |
| 3 | 1.1055 | 7.78824 | 3.8748 | 62.31 | 1958 | 736 | 0.9556 | 41.8 |
| 4 | 1.1243 | 8.29619 | 4.9382 | 63.29 | 1491 | 558 | 0.9553 | 42.5 |
| 5 | 1.1243 | 8.56121 | 5.8704 | 61.05 | 1373 | 513 | 0.9534 | 42.5 |
| 6 | 1.1254 | 8.25076 | 4.7046 | 62.31 | 1512 | 564 | 0.9464 | 41.5 |
| 7 | 1.1255 | 8.19048 | 4.4426 | 62.31 | 1562 | 580 | 0.9371 | 40.4 |
| 8 | 1.1169 | 7.96174 | 3.7581 | 62.31 | 1544 | 572 | 0.9370 | 41.0 |
| 9 | 1.1206 | 8.06205 | 4.1153 | 62.31 | 2207 | 823 | N/A | N/A |
| 10 | 1.1142 | 8.25100 | 4.7752 | 62.31 | 2320 | 874 | 0.9692 | 43.8 |
| 11 | 1.1202 | 8.30260 | 4.8274 | 63.42 | 1876 | 705 | 0.9614 | 42.8 |
| 12 | 1.1214 | 8.27309 | 4.5125 | 62.31 | 1761 | 660 | 0.9547 | 42.2 |
| 13 | 1.1248 | 8.37190 | 4.9172 | 62.31 | 1365 | 510 | 0.9389 | 40.0 |
| 14 | 1.1273 | 8.34030 | 4.4361 | 62.31 | 1631 | 609 | 0.9431 | 40.8 |
| 15 | 1.1313 | 8.37134 | 4.4698 | 61.32 | 1539 | 572 | 0.9325 | 39.7 |
| 16 | 1.1327 | 8.47382 | 2.7545 | 61.32 | 1567 | 580 | 0.9199 | 38.1 |
| 17 | 1.1457 | 8.49367 | 4.9090 | 60.27 | 2242 | 828 | 0.9445 | 42.7 |
| 18 | 1.1528 | 8.81344 | 5.7650 | 62.31 | 1966 | 733 | 0.9450 | 41.4 |
| 19 | 1.1480 | 8.69534 | 5.5415 | 58.33 | 2151 | 800 | 0.9486 | 42.3 |
| 20 | 1.1548 | 8.82528 | 5.6352 | 62.31 | 1864 | 690 | 0.9434 | 42.2 |
| 21 | 1.1493 | 8.80091 | 5.5780 | 62.31 | 1850 | 684 | 0.9457 | 42.8 |
| 22 | 1.1559 | 8.81267 | 5.4968 | 61.32 | 1921 | 709 | 0.9322 | 40.6 |
| 23 | 1.1560 | 8.72107 | 5.2494 | 62.31 | 1777 | 653 | 0.9242 | 40.0 |
| 24 | 1.1546 | 8.63772 | 5.4454 | 62.31 | 1857 | 681 | 0.9193 | 39.5 |
| 25 | 1.1416 | 8.45149 | 4.8747 | 62.31 | 2557 | 947 | 0.9471 | 42.8 |
| 26 | 1.1437 | 8.71584 | 5.5041 | 62.31 | 2708 | 1012 | 0.9535 | 42.4 |
| 27 | 1.1500 | 8.83747 | 5.5966 | 62.31 | 2159 | 803 | 0.9466 | 41.9 |
| 28 | 1.1570 | 8.92684 | 5.6970 | 62.31 | 1841 | 681 | 0.9329 | 40.4 |
| 29 | 1.1493 | 8.75573 | 5.5001 | 62.31 | 2008 | 743 | 0.9383 | 41.3 |
| 30 | 1.1592 | 8.93221 | 5.6568 | 62.31 | 1697 | 625 | 0.9264 | 40.1 |
| 31 | 1.1570 | 8.80172 | 5.2380 | 62.31 | 1882 | 692 | 0.9217 | 39.4 |
| 32 | 1.1591 | 8.80713 | 5.1295 | 62.31 | 1872 | 686 | 0.9155 | 38.8 |
| 33 | 1.1242 | 8.48572 | 5.2812 | 62.31 | 1564 | 585 | 0.9562 | 42.8 |
| 34 | 1.1518 | 9.00052 | 5.9866 | 62.31 | 1839 | 680 | 0.9453 | 42.8 |
1 Estimated at PP from D5949.
Disclaimer/Publisher’s Note: The statements, opinions and data contained in all publications are solely those of the individual author(s) and contributor(s) and not of MDPI and/or the editor(s). MDPI and/or the editor(s) disclaim responsibility for any injury to people or property resulting from any ideas, methods, instructions or products referred to in the content. |
© 2024 by the authors. Licensee MDPI, Basel, Switzerland. This article is an open access article distributed under the terms and conditions of the Creative Commons Attribution (CC BY) license (https://creativecommons.org/licenses/by/4.0/).
Share and Cite
MDPI and ACS Style
Bantchev, G.B.; Ngo, H.; Chen, Y.; Winfield, D.D.; Cermak, S.C. Cold-Flow Properties of Estolides: The Older (D97 and D2500) versus the Mini-(D5773 and D5949) Methods. Lubricants 2024, 12, 141. https://doi.org/10.3390/lubricants12050141
AMA Style
Bantchev GB, Ngo H, Chen Y, Winfield DD, Cermak SC. Cold-Flow Properties of Estolides: The Older (D97 and D2500) versus the Mini-(D5773 and D5949) Methods. Lubricants. 2024; 12(5):141. https://doi.org/10.3390/lubricants12050141
Chicago/Turabian StyleBantchev, Grigor B., Helen Ngo, Yunzhi Chen, DeMichael D. Winfield, and Steven C. Cermak. 2024. "Cold-Flow Properties of Estolides: The Older (D97 and D2500) versus the Mini-(D5773 and D5949) Methods" Lubricants 12, no. 5: 141. https://doi.org/10.3390/lubricants12050141
Note that from the first issue of 2016, this journal uses article numbers instead of page numbers. See further details here.