Friction Coefficient of Wet Clutches as a Function of Service Mileage


School of Engineering, Hangzhou Normal University, 2318 Yuhangtang Road, Hangzhou 311121, China
Lubricants 2024, 12(5), 147; https://doi.org/10.3390/lubricants12050147
Submission received: 22 March 2024
/
Revised: 19 April 2024
/
Accepted: 25 April 2024
/
Published: 26 April 2024
Abstract
:As a core component for efficient variable speed transmission and energy saving, wet clutches are widely used in the transmission systems of energy-saving and new energy vehicles. However, with an increase in the service mileage of the wet clutch, the friction coefficient undergoes alterations. This leads to a deterioration of the control accuracy of the clutch transmission torque, which ultimately has a negative impact on the dynamic characteristics and driving safety of the entire vehicle. In order to understand the service behavior of the friction coefficient in a wet clutch, wet clutches with different service mileages were investigated experimentally and theoretically. The results show that as the service mileage increased, the hydrodynamic lubrication phase was extended. Analyses of the three-dimensional profile of the friction plate and the theoretical simulation of the friction revealed that the edge ridges of the friction pads were flattened. This increased the clutch engagement force when the asperities on the separator and friction plates came into contact.
1. Introduction
As the kernel component of vehicle transmissions and limited slip differentials, the wet clutch is crucial in vehicle transmission systems as it allows the power of the entire vehicle to be cut off [1]. Therefore, the accuracy with which the wet clutch transmission torque is controlled determines the dynamic characteristics and driving safety of the vehicle [2]. However, the torque transmission process in wet clutches is influenced by many factors [3,4,5], especially the variability in clutch temperature [6,7], which makes precise torque control difficult. In practical applications, the precise control of the transmission torque of the wet clutch is based on the test calibration of the friction coefficient in the new clutch. However, the friction coefficient in the wet clutch changes as the service process proceeds [8,9]. This leads to a decrease in the accuracy at which the vehicle’s transmission torque can be controlled, affecting the comfort and safety of the vehicle.
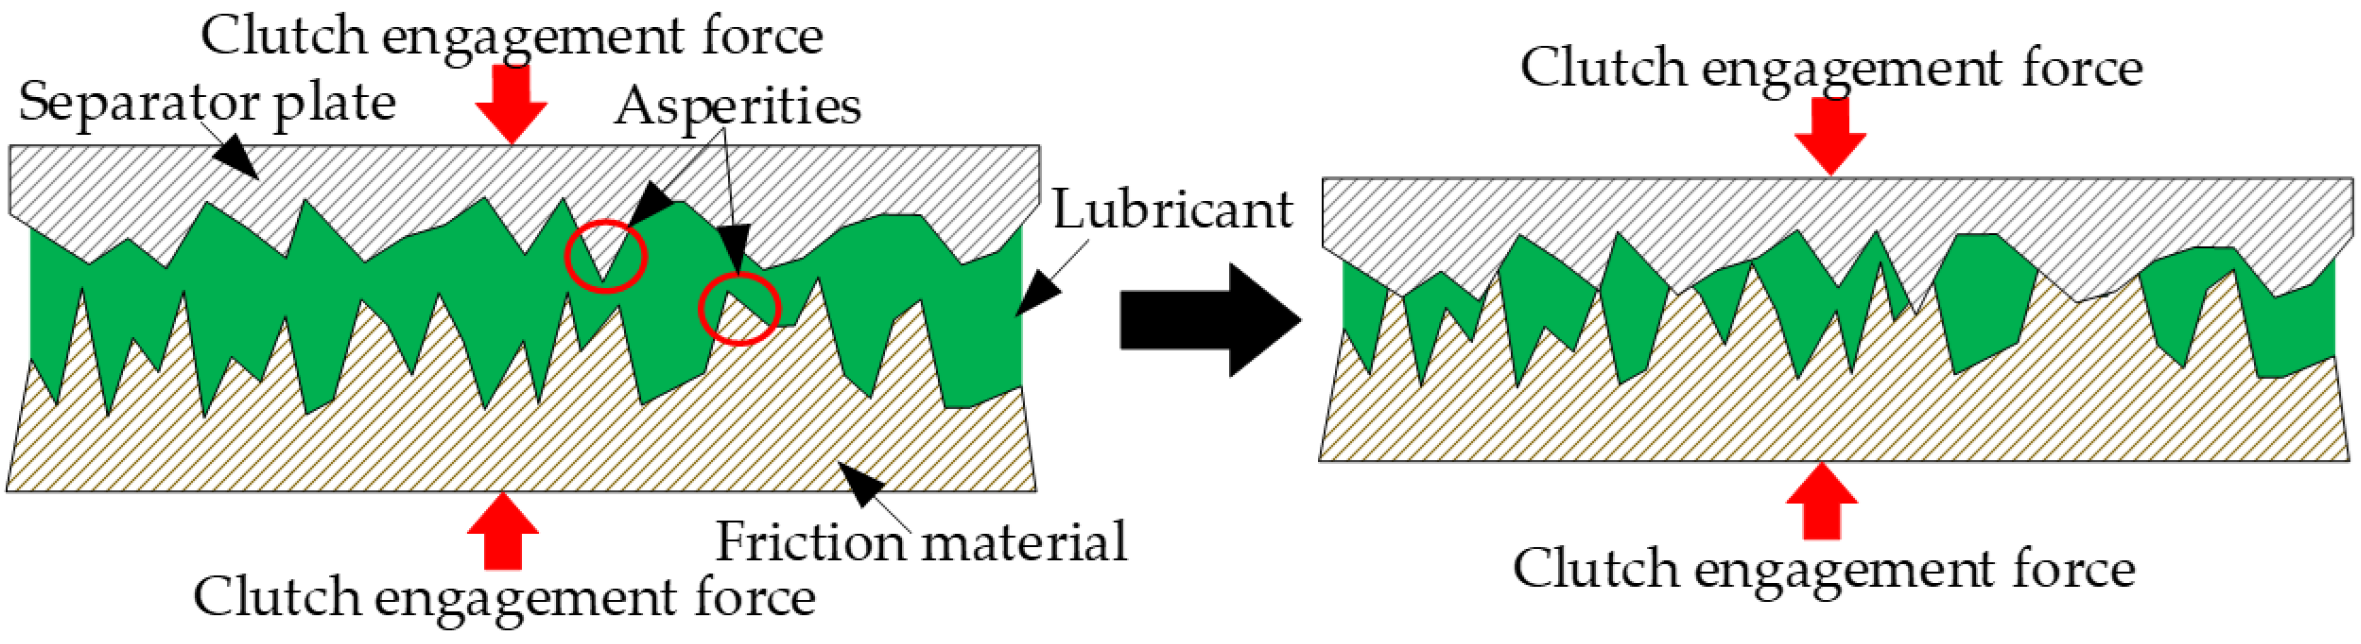
The micro process by which torque is transferred in a wet clutch while it is being engaged is shown in Figure 1. The engagement process mainly consists of two parts: the asperities contact and the lubricant dynamic pressure lubrication. For this reason, Li et al. [10] developed a dynamic torque model for the wet clutch engagement process based on the asperities contact theory and the lubricant dynamic pressure lubrication theory. Bao et al. [11] developed a dynamic torque model for the engagement process of a multi-plate wet clutch based on a single pair of the friction pair. From the dynamic torque model, it can be seen that the internal factors affecting the friction coefficient of wet clutches are mainly the morphological distribution characteristics of the friction pair, the quality of the lubricant, and the properties of the friction material. First, in terms of the morphological distribution characteristics of the friction pair, Chen et al. [12] explored the influence of the different surface asperity shapes of the friction pairs on the friction coefficient of wet clutches. Zhang et al. [13] used the established theoretical model of the wet clutch engagement process to reveal the influence of the surface morphology of the friction pair on the friction coefficient. Based on the fractal theory modeling of real morphology, Chen et al. [14] proposed a dynamic torque theory model for the wet clutch engagement process. Second, in terms of lubricant quality, Li et al. [15] investigated the mechanism of the effect of lubricant on the friction characteristics of wet clutches and found that the lubricant mainly affected the friction coefficient through the formation of calcium carbonate on the friction surface. In addition, Wirkner et al. [16] and Fatima et al. [17] studied the influence of water content and iron filing content in the lubricant on the friction coefficient of wet clutches. Farfán-Cabrera et al. [18] also investigated the influence of bio-lubricants on the friction coefficient of wet clutches. Finally, in terms of the friction material properties, Fei et al. [19] and Zhang et al. [20] respectively studied the influence of phenolic resin content and glass fiber content in friction materials on the friction characteristics of wet clutches.
In addition to the internal factors above-mentioned, the actual external operating conditions will also have an influence on the friction coefficient of the wet clutch. Therefore, Ingram et al. [21] used experiments to investigate the influence of clutch speed difference on the friction coefficient of wet clutches. Ma et al. [22] focused on exploring the influence of lubricant temperature on the friction coefficient of wet clutches. Li et al. [23] experimentally investigated the influence of different operating conditions on the friction coefficient of wet clutches. In addition, based on the experimental data of friction coefficients under different operating conditions, Cui et al. [24] and Wu et al. [25] established a more accurate dynamic model of friction torque. However, the friction coefficient of wet clutches will change as their mileage increases. For this purpose, Ost et al. [26] and Fei et al. [27] experimentally studied the variation in the friction coefficient of wet clutches with the number of repeated engagement cycles. The results showed that the friction coefficient first increased and then decreased, and the engagement stability of wet clutches was reduced. For the drastic change in the friction coefficient of a wet clutch during the running-in process, Voelkel et al. [28] proposed a corresponding test method and investigated the change rule of the friction coefficient. Wang et al. [29] studied the variation in friction coefficient with repeated engagement times of wet clutches under different operating conditions. However, in practical applications, the working conditions of wet clutches are intermittent, rather than a continuous repeated engagement [30]. In addition, when studying the friction coefficient in a wet clutch that was subject to continuous repeated engagement, Ost et al. [26] found that the intermittence in the continuously repeated test changed the friction coefficient in the wet clutch. Therefore, the results derived from the continuous repeated engagement of the wet clutch can be regarded as the fatigue characteristics of the wet clutch. As a result, it cannot accurately reflect the service characteristics of the friction coefficient in wet clutches.
In this study, experimental research on wet clutches with different service mileages was conducted in order to determine the variation in the friction coefficient in a wet clutch throughout its service life. Based on an analysis of the three-dimensional profile of a friction plate and the theoretical analysis of the contact process of a wet clutch, the mechanism responsible for the variation in the friction coefficient in wet clutches as a function of service mileage was revealed.
2. Experiment
2.1. Apparatus
Clutch engagement force (CEF), clutch driven end speed (CDES), clutch active end speed (CAES), lubricant oil temperature (LOT), and friction surface temperature (FST) are some of the important variables that affect the coefficient of friction in wet clutches. In order to thoroughly explore the impact of various factors on the friction coefficient in wet clutches, an experimental wet clutch transmission system was designed, as shown in Figure 2. The experimental system employed the drive motor and dynamometer to imitate the drive source and vehicle load, so that tests on the wet clutch friction characteristics were as close to the real operating conditions. The flywheel of the experimental system was used to simulate the rotational inertia of the vehicle and maintain a stable speed on the load side. The real-time measurement of the FST of the wet clutch was carried out using a thermocouple and slip ring in the test facility. To ensure precise measurement of the friction torque in the wet clutch, a high-precision torque sensor with an accuracy level of 0.05% was employed. The control signals and data acquisition in the experimental system were handled by the dSPACE control system. The main characteristic parameters of the components of the experimental system are shown in Table 1.
2.2. Experimental Subjects
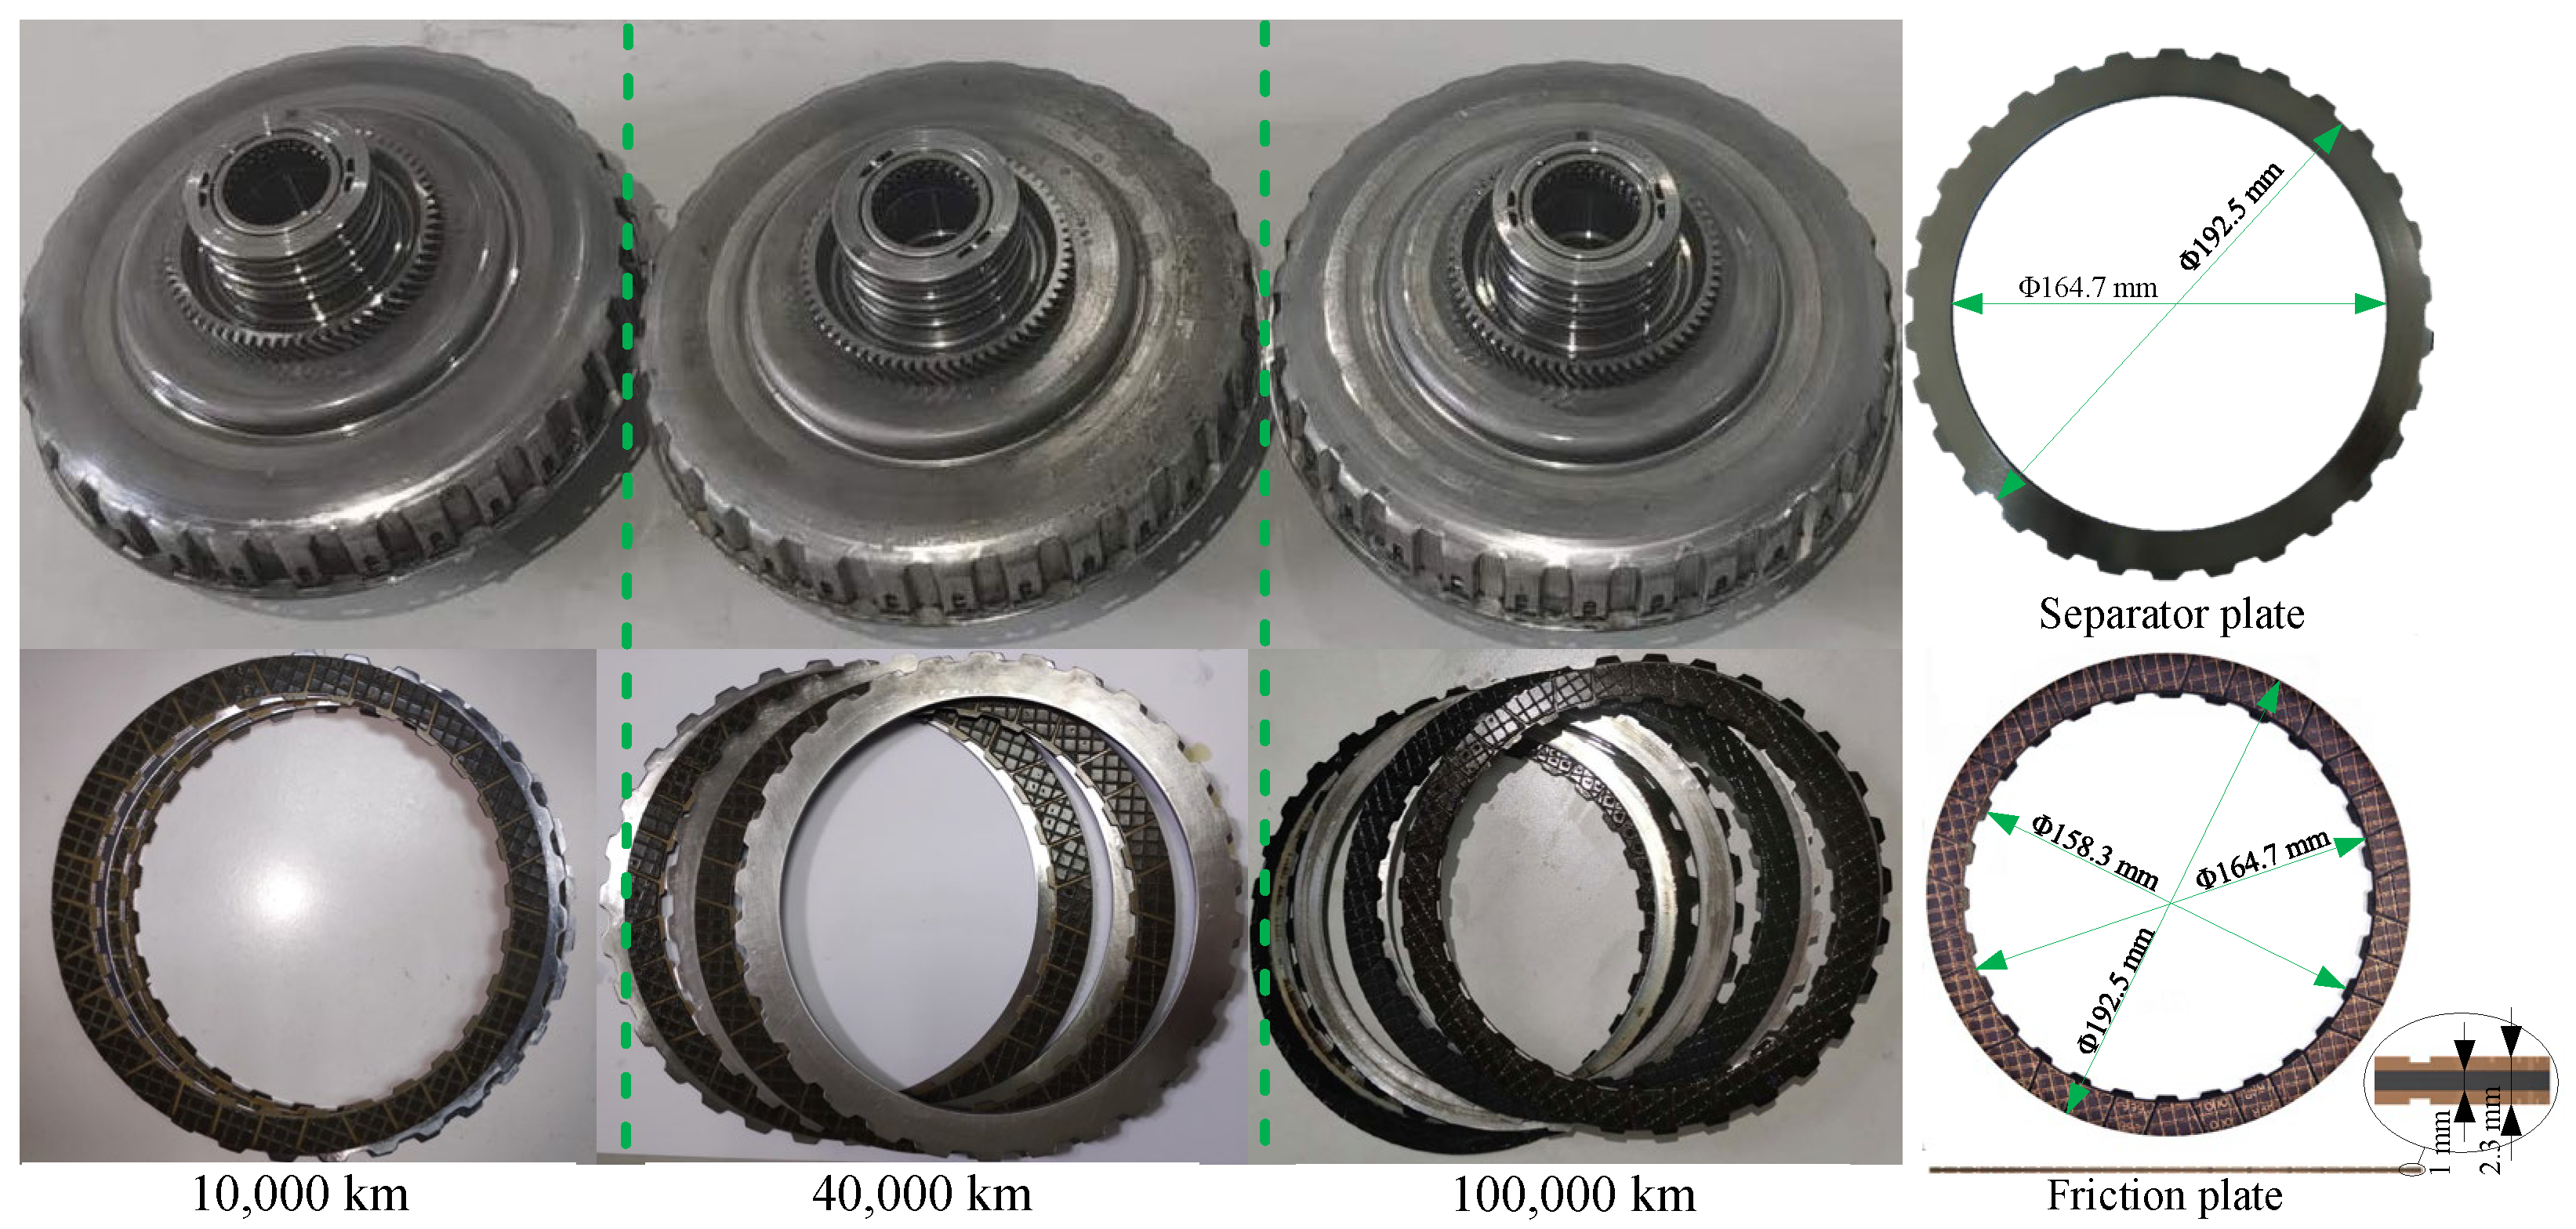
Wet clutches with different service miles were chosen as the experimental study items in order to examine how the friction coefficient of wet clutches varied over service mileage. The service mileages of the clutches were 10,000 km, 40,000 km, and 100,000 km, as shown in Figure 3. The separator plate of the friction pair was composed of cold-rolled carbon steel sheets. The friction plate material was not only made of cold-rolled carbon steel in the middle, but also paper-based friction material on the surface [5]. The primary components of paper-based friction materials include fibers (such as aramid fibers), resins, filler materials (like diatomaceous earth), and friction modifiers (such as carbon particles). In addition, the wet clutch was cooled and lubricated with a commercially available universal transmission lubricant [31]. The three-dimensional structural dimensions of the separator plate and the friction plate are shown in Figure 3, and the nominal torque capacity of the wet clutch is 300 Nm.
2.3. Experimental Methods
To systematically explore the impact of CEF, LOT, CAES, FST, and CDES on the friction coefficient, five sets of experiments were implemented. The aim of this method was to minimize the potential interaction between various factors.
Test (1): Evaluating the influence of CEF and its rate of change on the friction coefficient. The CAES is maintained at 800 rpm through control of the drive motor, while the CDES is regulated to 760 rpm through control of the load motor. The lubricant flow rate between the friction surfaces of the clutch is kept constant at 10 L/min, and the LOT is fixed at 35 °C. By controlling a hydraulic actuator, the CEF increases in various ramps from 0 N to 2800 N. The experimental data collected by dSPACE were plotted by MATLAB 2022b software, and the results are shown in Section 4.1.
Test (2): Evaluating the influence of LOT on the friction coefficient. The CAES is maintained at 800 rpm through control of the drive motor, while the CDES is regulated to 760 rpm through control of the load motor. The hydraulic actuator is controlled with a gradient of 235 N/s to increase the CEF from 0 N to 2800 N. The test is repeated with changes in lubricant temperature determined by adjustments to the temperature control system. The experimental data collected by dSPACE were plotted by MATLAB software, and the results are shown in Section 4.1.
Test (3): Evaluating the influence of CAES on the friction coefficient. The CDES is regulated to 760 rpm through control of the load motor. The lubricant flow rate between the friction surfaces of the clutch is kept constant at 0 L/min, and the LOT is fixed at 35 °C. By controlling a hydraulic actuator, the CEF increases in various ramps from 0 N to 2800 N. The test is repeated by adjusting the drive motor to establish different CAES. The experimental data collected by dSPACE were plotted by MATLAB software, and the results are shown in Section 4.1.
Test (4): Evaluating the influence of FST on the friction coefficient. The CAES is maintained at 800 rpm through control of the drive motor. Meanwhile, the clutch output side is kept stationary throughout the test. The lubricant flow rate between the friction surfaces of the clutch is kept constant at 0 L/min. The hydraulic actuator is employed to maintain the CEF at 1200 N, and the test duration is configured to last for 2 min. The experimental data collected by dSPACE were plotted by MATLAB software, and the results are shown in Section 4.1.
Test (5): Evaluating the influence of CDES on the friction coefficient. The CAES is maintained at 800 rpm through control of the drive motor. The lubricant flow rate between the friction surfaces of the clutch is kept constant at 0 L/min. By controlling the hydraulic actuator, the clutch force is increased from 0 N to 2800 N. The test is repeated by manipulating the load motor to achieve different CDES. The experimental data collected by dSPACE were plotted by MATLAB software, and the results are shown in Section 4.1.
Replace the wet clutch with a different service mileage, and repeat the above test.
3. Theoretical Analysis
In order to further reveal the change mechanism of the friction coefficient with service mileage, a theoretical model was established to analyze the process through which the friction plate and the separator plate become engaged. Because the viscous torque exerted by the lubricant oil film and the friction torque exerted by the asperities are both present in the engagement process, the theoretical model should include a hydrodynamic lubrication model for the lubricant, and an elastic contact model for the asperities.
The contact of the asperities can be transformed into the contact of a smooth plane with an equivalent rough plane, as illustrated in Figure 4. As per the G–W model introduced by Greenwood et al. [32], the real contact area (A) of the asperities on the surface of the friction pair is given by:
where η is the density of the roughness peak distribution, An is the nominal contact area of the friction pair, R is the curvature radius of the asperities, za is the height of the asperities on the rough surface, d is the distance between the reference plane of the rough surface and the ideal rigid plane, σ1 is the root-mean-square (RMS) of the friction plate surface roughness, and σ2 is the RMS of the surface roughness of the separator plate.
According to the Hertz contact theory, the normal bearing capacity (Fa) and friction torque (Ta) of the asperities are given by:
where a is the inner diameter of the friction pair, n is the number of friction surfaces, b is the outer diameter of the friction pair, fc is the friction coefficient of the asperities, r is the radial distance of the clutch friction pair, E1 and ν1 are the elastic modulus and Poisson’s ratio of the asperities on the surface of the friction plate, respectively, and E2 and ν2 are the elastic modulus and Poisson’s ratio of the asperities on the surface of the separator plate, respectively.
The hydrodynamic lubrication model for the lubricant can be derived from the Navier–Stokes equation and the fluid continuity equation. It was assumed that the lubricant was laminar and incompressible, and the speed changes of the lubricant in the radial direction and rotation direction of the clutch were ignored. It was assumed that the oil film pressure remained constant in the thickness direction, and the velocity component of the lubricant in the thickness direction of the oil film was disregarded. The momentum equation and continuity equation of the lubricant in the cylindrical coordinate system can be simplified as follows:
where P is the lubricant oil film bearing pressure, μ is the lubricant dynamic viscosity, ur is the lubricant flow rate in the radius direction of the clutch, uθ is the lubricant flow rate in the rotation direction of the clutch, and ρ is the lubricant density.
The boundary conditions for the lubricant in the thickness direction of the clutch are defined as follows:
where ω1 is the angular velocity of the friction plate, ω2 is the angular velocity of the separator plate, and h is the oil film thickness.
By applying the boundary condition Equation (4) to the momentum equation in Equation (3) and subsequently integrating in the oil film thickness direction, the following results are obtained:
After substituting Equation (5) into the lubricant continuity equation and integrating along the thickness direction of the oil film, the following expression is obtained:
Considering the influence of friction materials on the load bearing characteristics of the lubricant oil film [33], Equation (6) can be modified to obtain:
where do is the thickness of the friction material on the surface of the friction plate and Φ is the permeability of the friction material.
Based on the conditions governing the lubricant distribution along the radial direction of the friction surface, the oil film pressure distribution function (P(r)) and oil film bearing capacity (Fo) can be obtained by integrating Equation (7):
According to the equilibrium condition of the friction surface bearing capacity, the following expression can be derived:
where Pt is the engagement pressure of the friction pair, and Ft is the engagement force of the friction pair.
Combining Equations (2), (8), and (9), the oil film viscosity torque [32] can be derived as:
where Δw is the angular velocity difference between the separator plate and friction plate, and ϕf and ϕfs are the Patir–Cheng flow coefficients [33].
The wet clutch friction coefficient (f) is calculated as follows [31]:
where Tt is the wet clutch transfer torque.
4. Results and Discussion
4.1. Service Characteristics of Wet Clutch Friction Coefficient
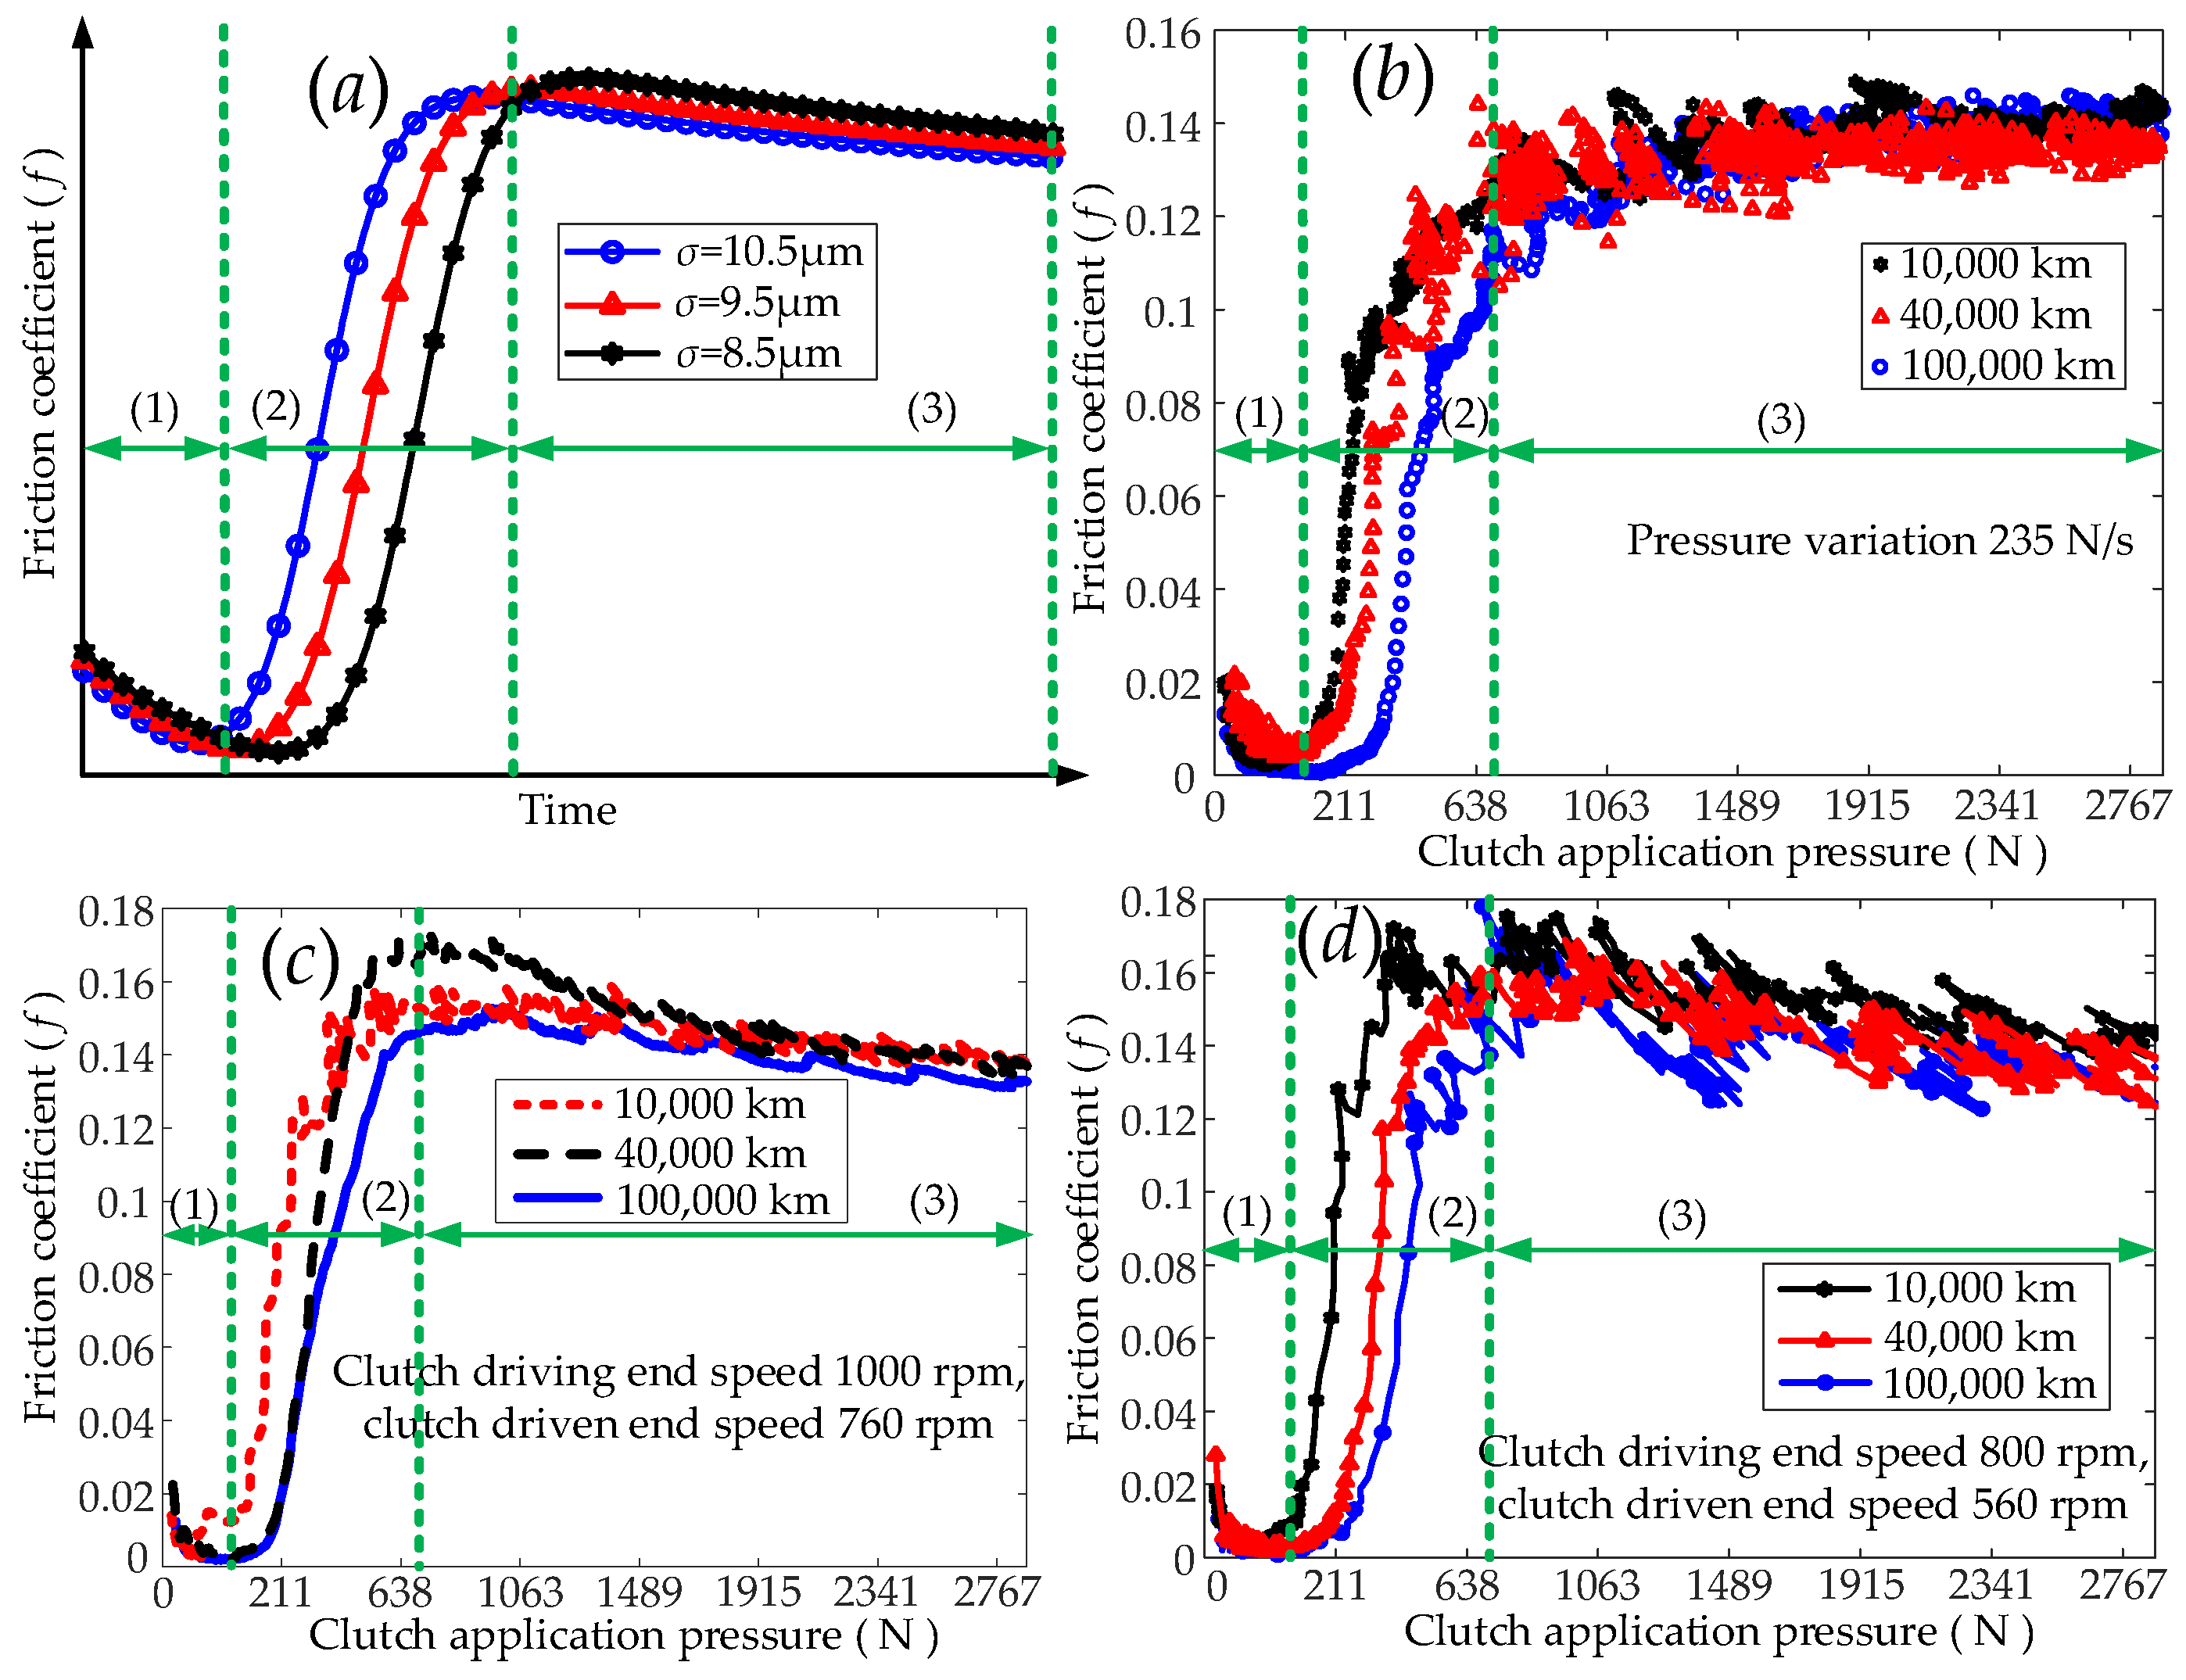
Based on the above tests, the influence of different factors on the friction coefficients of the wet clutches for different service mileages was determined. Figure 5 presents the influence of the CEF on the friction coefficients of the wet clutches for different service mileages. As the clutch engagement force increased, the influence of the CEF on the friction coefficient could be categorized into three stages. The first stage is the hydrodynamic lubrication stage, the second stage involves the asperities on the surfaces of the separator plate and the friction plate moving from initial contact to full contact, and the third stage involves the slow increase in the contact area between the asperities, as shown in Figure 5. When the wet clutch started to engage, the separator plate and the friction plate were filled with lubricant, and the oil film transmitted a viscous torque. At this stage, the value of the friction coefficient was small, and it decreased as the CEF increased. As the CEF further increased, the asperities on the surfaces of the separator plate and the friction plate came into contact and transmitted a friction torque. At this time, both a viscous torque due to the oil film and a friction torque due to the asperities between the separator plate and the friction plate were present. As the CEF increased, the contact area between the asperities on the surfaces of the separator plate and the friction plate increased rapidly until the asperities were in full contact with each other. At this point, the friction coefficient increased significantly. As the CEF continued to increase, the peaks of the asperities on the surfaces of the separator plate and the friction plate deformed. The rate of change of the contact area between the asperities slowed down, and the friction coefficient changed minimally as the CEF increased further. Figure 5 indicates that for the same rate of change in the CEF, as the clutch service mileage increased, the duration of the hydrodynamic lubrication stage between the separator plate and the friction plate increased. Moreover, as the service mileage increased, the CEF increased after the asperities on the surfaces of the separator plate and the friction plate came into contact.
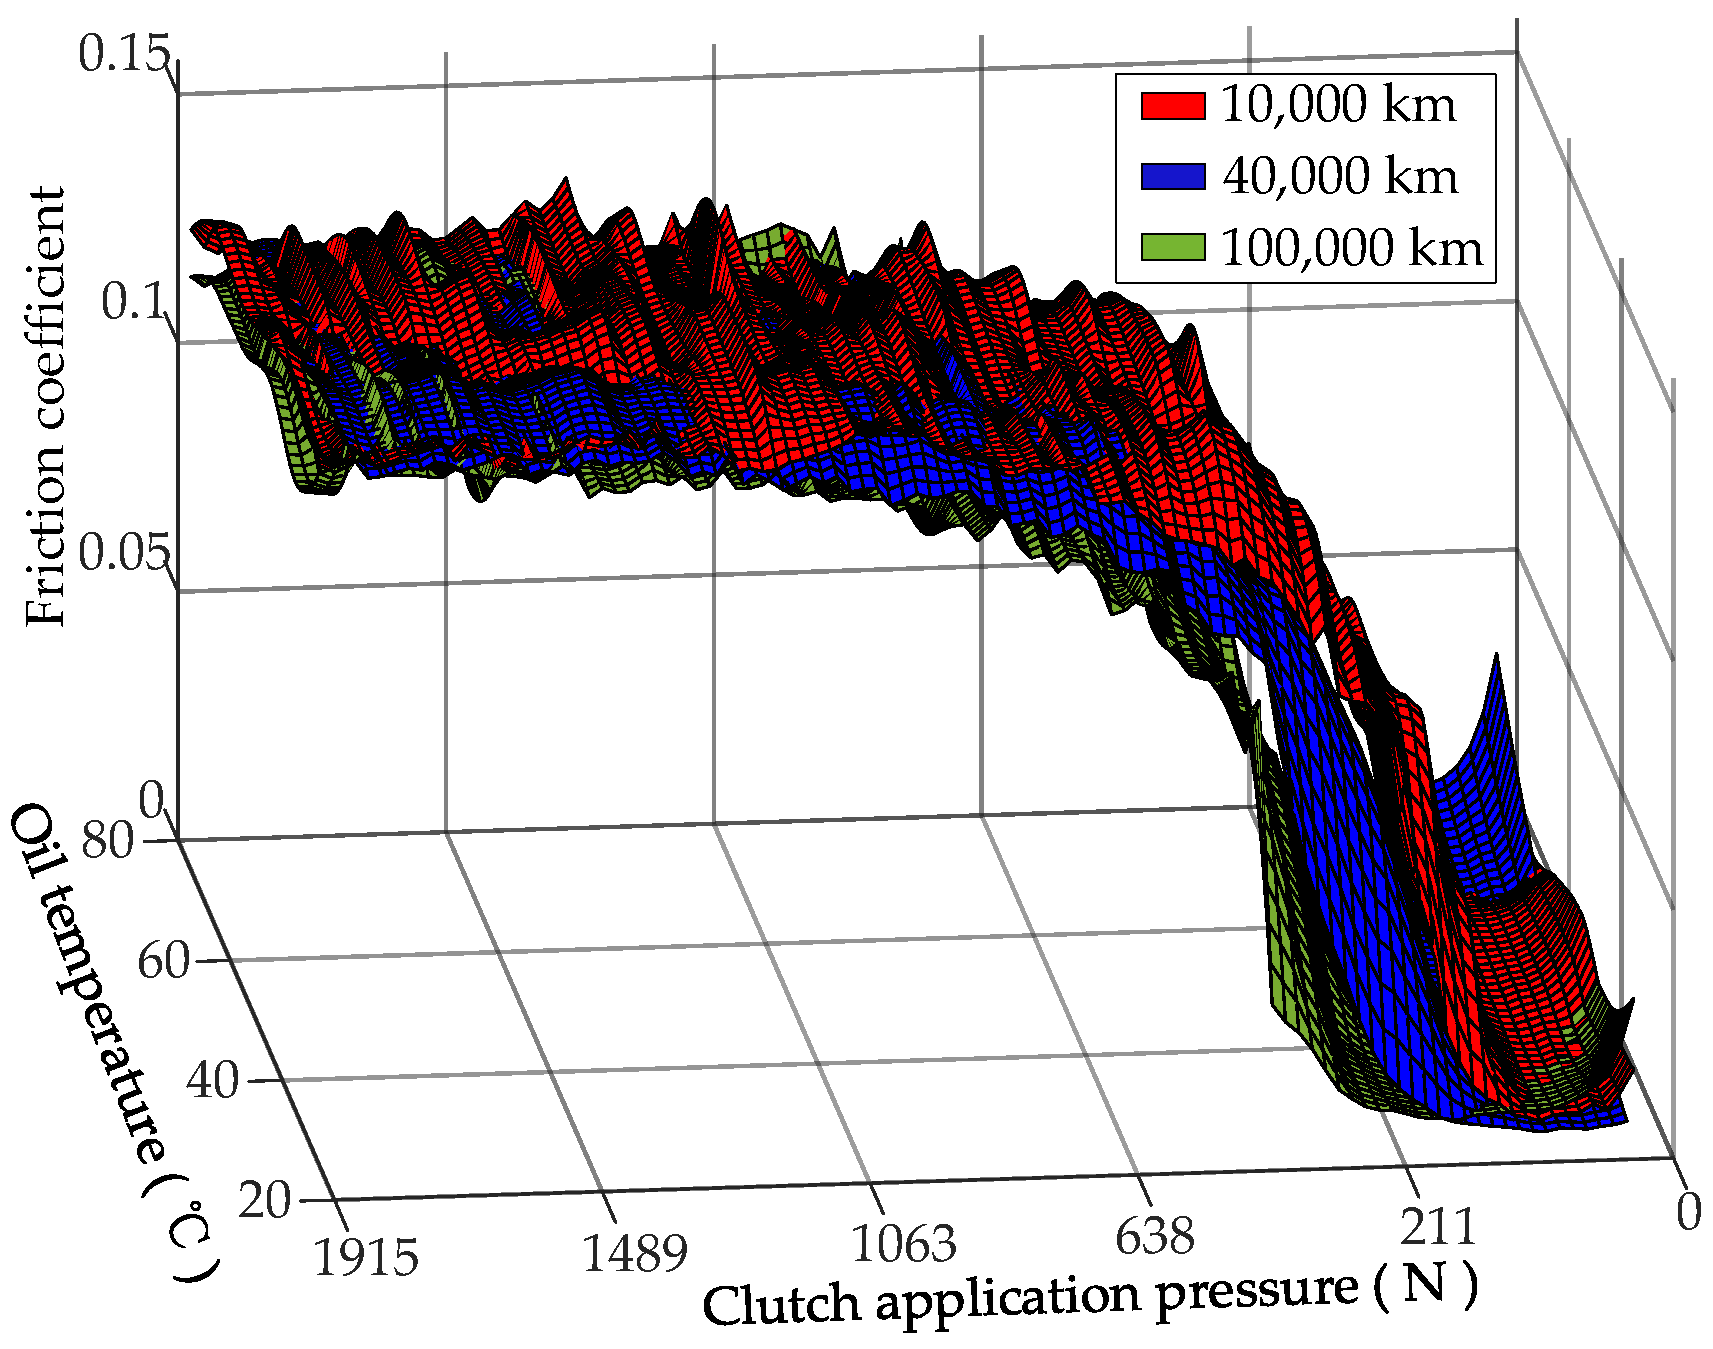
For a range of clutch engagement forces and lubricant temperatures, the variation in the friction coefficients of the wet clutches for different service mileages is shown in Figure 6. For different lubricant temperatures, the trends in the friction coefficients for different service mileages remained basically the same as the CEF increased. The service mileage only affected the variation in the friction coefficient from initial contact to full contact between the asperities on the surfaces of the separator plate and the friction plate. In addition, an increased service mileage caused an increase in the CEF when the asperities came into contact.
Figure 7 shows the influence of the service mileage on the friction coefficient for different CEFs and different CAESs. For a given CAES, as the service mileage increased, the duration of the hydrodynamic lubrication stage between the separator plate and the friction plate increased. However, an increased service mileage had a relatively small effect on the variation in the friction coefficient when the contact area between the asperities on the surfaces of the separator plate and the friction plate increased slowly. As the CEF increased, the influence of the service mileage on the friction coefficient was basically constant for a given CAES.
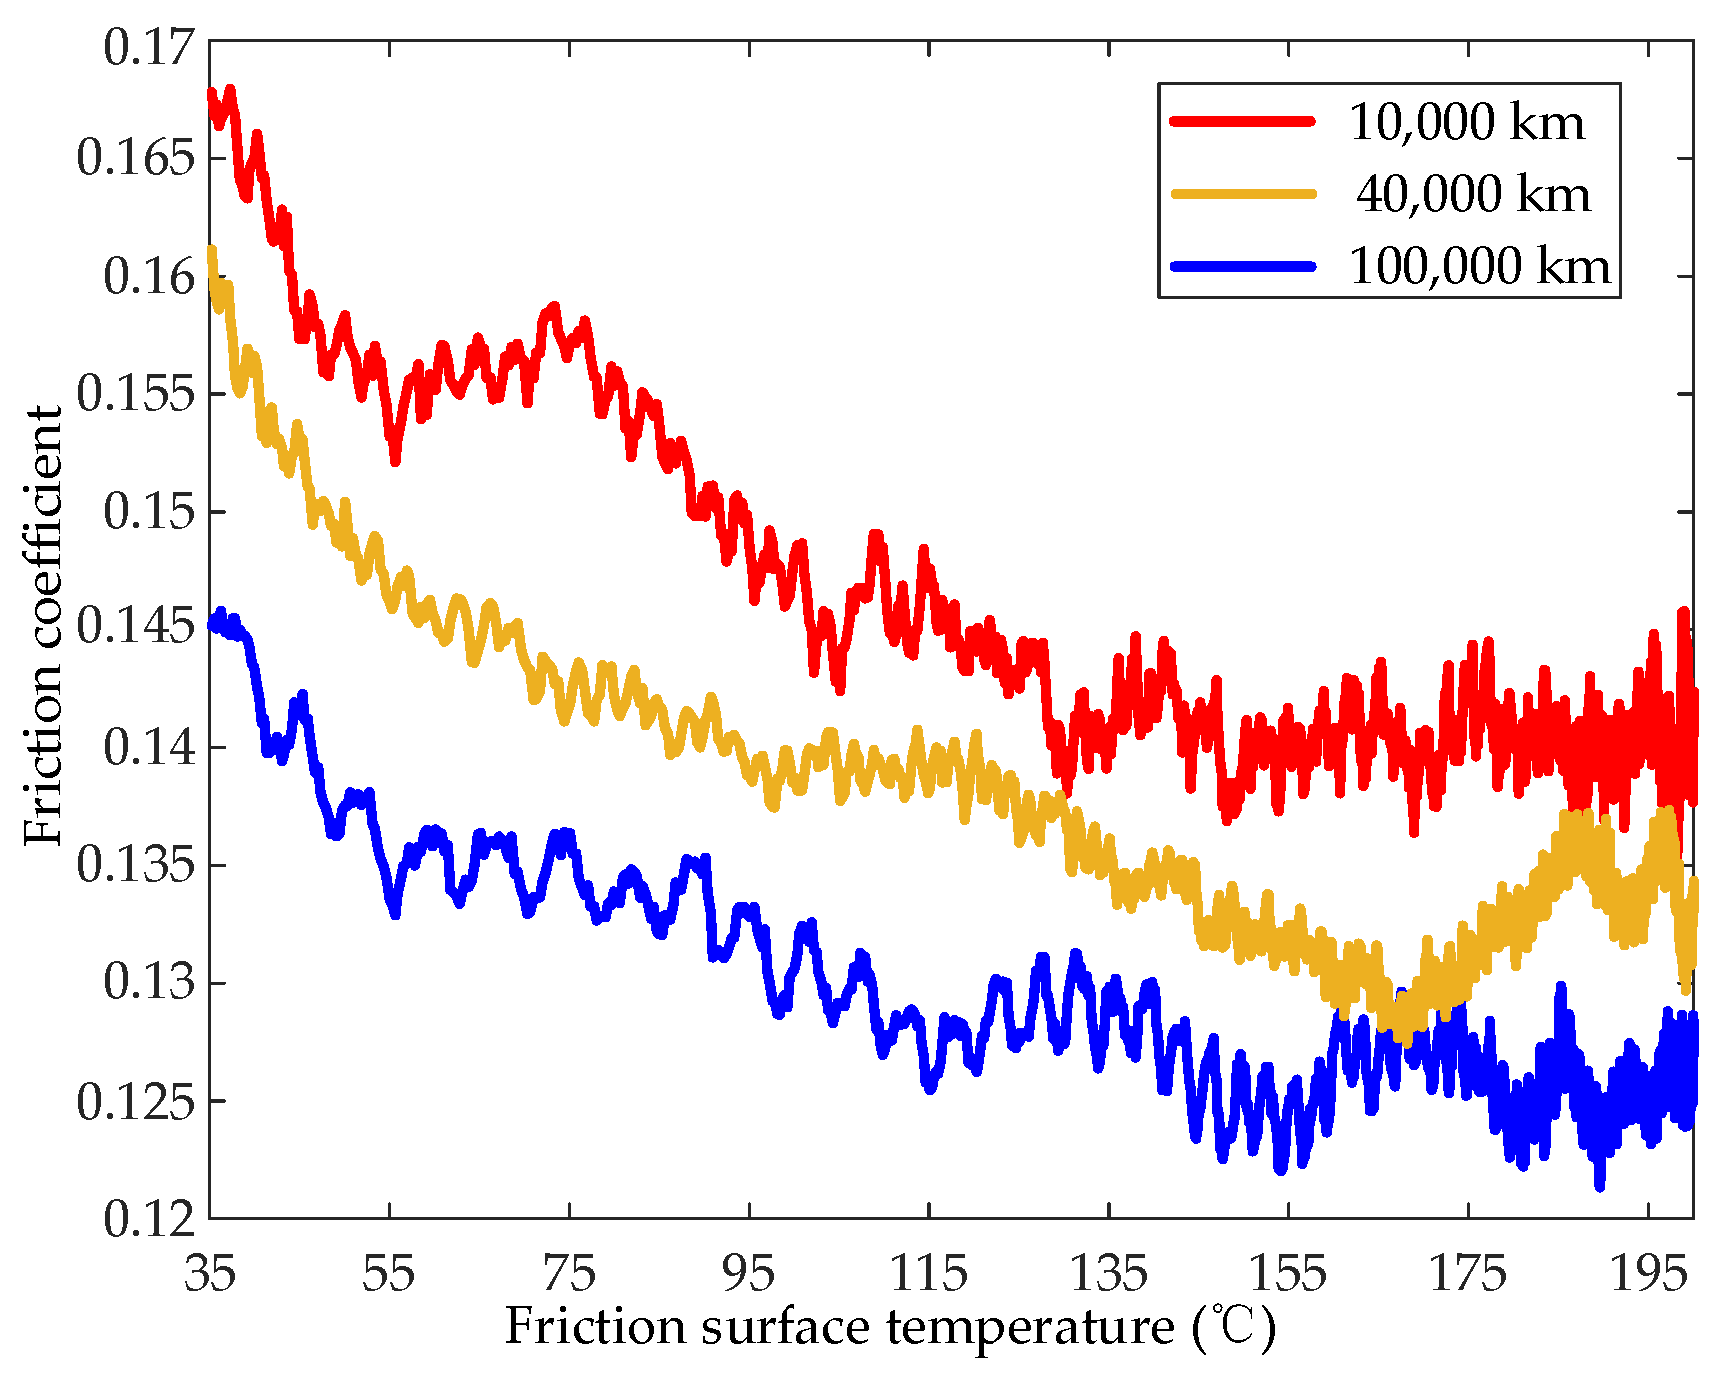
The influence of the FET on the friction coefficient for different service mileages is shown in Figure 8. The friction coefficient gradually decreased as the temperature of the friction surface increased. For different service mileages, the trends in the friction coefficient as a function of the FST were basically the same; the main difference was that the absolute values of the friction coefficient were smaller for higher service mileages.
Figure 9 shows the variation in the friction coefficient for different service mileages and CDESs as a function of the clutch engagement force. The figure indicates that for different CDESs, the influence of a given service mileage on the friction coefficient was essentially the same, regardless of the magnitude of the CEF. However, different service mileages did affect the variation in the friction coefficient in the asperities on the surfaces of the separator plate and the friction plate from initial contact to full contact.
4.2. Mechanistic Analysis of Service Characteristics of Wet Clutch Friction Coefficients
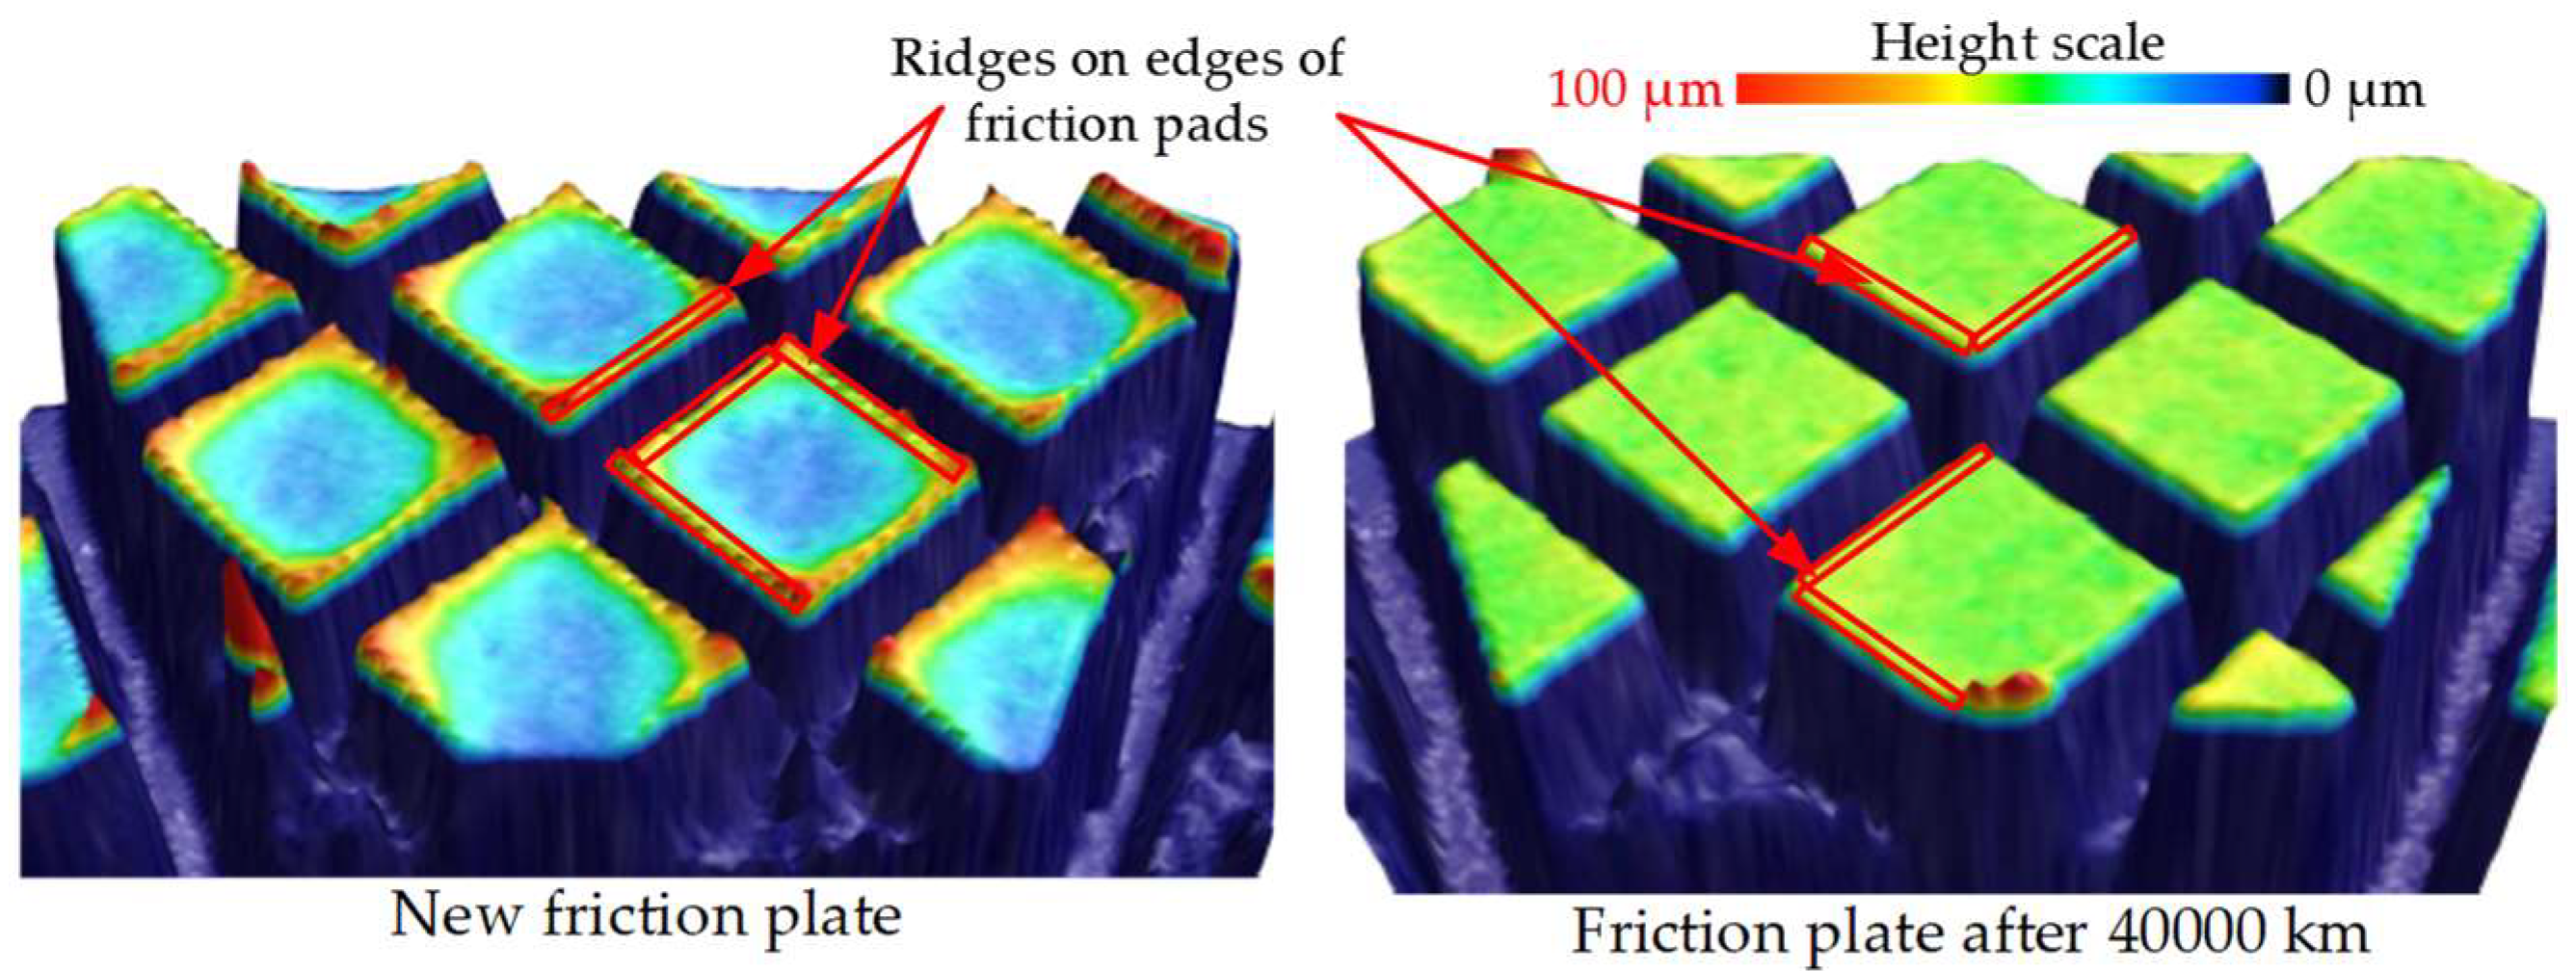
In order to determine the mechanism of change in the friction coefficient with service mileage, the three-dimensional profile of the friction plate was analyzed using a three-dimensional optical profiler (Bruker Contour GT-K 3D). Figure 10 shows the three-dimensional profiles of a new friction plate and the friction plate with a service mileage of 40,000 km. A comparison of the surface of these two plates indicated that the friction pads were generally flat. The specific differences in the friction pads are shown in Figure 11. Compared to the new friction plate, the height differences between the edges and middle areas of the friction pads on the older friction plate decreased as the ridges on the edges were flattened, and the thickness of the areas in the middle increased. The surface morphology of the friction pads on the older friction plate tended to be flatter, and the roughness tended to be less pronounced than those of the new friction plate. The ridges on the edges of the friction pads are primarily used to eliminate the effect of the lubricant film between the separator plate and the friction plate. As the service mileage increased, the ridges on the edges of the friction pads were gradually smoothed, which enhanced the hydrodynamic lubrication between the separator plate and the friction plate.
According to the analysis of the three-dimensional profile of the friction plate, the surface roughness of the friction plate decreased as the service mileage increased. Therefore, the standard deviation of the combined roughness (σ) of the friction surfaces in the above theoretical model was changed to simulate the change in the service mileage. The results for the theoretical simulation were obtained using MATLAB software and are shown in Figure 12. The results only revealed the rate of change (not specific values) because a large number of assumptions existed in the theoretical model, and the true values of the model parameters were difficult to obtain. Figure 12a shows the simulation conditions of the theoretical model: a constant clutch speed difference and a linearly increasing clutch engagement force. Figure 12b shows the theoretical simulation results for the influence of the standard deviation of the combined roughness of the different friction surfaces on the friction coefficient. According to the simulation results, the variation in the standard deviation of the combined roughness of the different friction surfaces mainly affected the variation law of the friction coefficient from initial contact to full contact between the asperities on the surfaces of the separator plate and the friction plate. In order to verify the validity of the theoretical simulation results, a comparison was made between the theoretical simulation results and the experimental results, as shown in Figure 13. As can be seen in Figure 13, the theoretical simulation results and experimental results of the friction coefficient were completely consistent with the variation pattern of the asperities on the surfaces of the separator plate and the friction plate from the initial contact to the full contact stage. Thus, this proves the feasibility of simulating the variation in friction coefficient with service mileage by changing the standard deviation of the combined roughness of the different friction surfaces in the theoretical model. Furthermore, the variation in the contact area ratio (A/An) shown in Figure 12c indicates that as the standard deviation of the combined roughness of the friction surfaces decreased, the duration of the dynamic pressure lubrication stage that occurred while the separator plate and the friction plate were engaged was extended. This increased the clutch engagement force when the asperities on the surfaces of the separator plate and the friction plate came into contact. Figure 12d shows the variation in the torque characteristics of the wet clutch. As the clutch engagement force increased, the friction torque transmitted by the asperities lagged behind as the standard deviation of the combined roughness of the friction surfaces decreased. However, the viscous torque transmitted by the lubricant film changed minimally as the standard deviation of the combined roughness of the friction surfaces changed.
5. Conclusions
For wet clutches with different service mileages, the change rule of friction coefficient with service mileage was experimentally investigated. Based on the three-dimensional profile analysis of the friction plate surface, the mechanism of friction coefficient change with service mileage was described by the established theoretical model of the dynamic engagement process of a wet clutch. The following conclusions were obtained:
- (1)
- The friction coefficient decreases as the service mileage of the wet clutch increases from initial contact to full contact between the asperities on the surfaces of the separator plate and the friction plate.
- (2)
- The surface roughness of the friction plate becomes progressively smaller with the increase in service mileage. This enhances the dynamic pressure lubrication effect between the separator plate and the friction plate, and also increases the engagement pressure when the asperities on the surfaces of the separator plate and the friction plate come into contact. Ultimately, the friction coefficient decreases from initial contact to full contact between the asperities on the surfaces of the separator plate and the friction plate.
- (3)
- The variation law of the friction coefficient of the wet clutch with service mileage can be theoretically analyzed by changing the standard deviation of the combined roughness of the different friction surfaces in the asperities elastic contact model and the dynamic pressure lubrication model.
Funding
This work was supported by the National Natural Science Foundation of China (NO. U1764259).
Data Availability Statement
The author will provide data upon reasonable request.
Conflicts of Interest
The author declares no conflicts of interest.
References
- Yan, Z.; Li, H.; Lei, H.; Xie, M.; Wang, L. Study of the Judder Characteristics of Friction Material for an Automobile Clutch and Test Verification. Chin. J. Mech. Eng. 2023, 36, 53. [Google Scholar] [CrossRef]
- Chen, Y.; Cheng, Z.; Qian, Y. Research on Wet Clutch Switching Quality in the Shifting Stage of an Agricultural Tractor Transmission System. Agriculture 2022, 12, 1174. [Google Scholar] [CrossRef]
- Yu, L.; Ma, B.; Chen, M.; Xue, J.; Zhao, P. Variation mechanism of the friction torque in a Cu-based wet clutch affected by operating parameters. Tribol. Int. 2020, 147, 106–169. [Google Scholar] [CrossRef]
- Peng, Z.; Yuan, S. Mathematical Model of Drag Torque with Surface Tension in Single-Plate Wet Clutch. Chin. J. Mech. Eng. 2019, 32, 25. [Google Scholar] [CrossRef]
- Wu, B.; Qin, D.; Hu, J.; Liu, Y. Experimental Data Mining Research on Factors Influencing Friction Coefficient of Wet Clutch. ASME J. Tribol. 2021, 143, 121802. [Google Scholar] [CrossRef]
- Liu, Y.; Sun, Y.; Gao, Z.; Ye, F.; Tang, P. Transient Temperature Characteristics of Friction Clutch Disc Considering Thermal Contact Conductance Under Sliding Conditions. Friction 2023, 11, 2253–2263. [Google Scholar] [CrossRef]
- Yevtushenko, A.; Kuciej, M.; Grzes, P.; Ilyushchanka, A.; Liashok, A. Influence of the Additive of Ceramic and Intermetallic Powders on the Friction Properties and Temperature of the Wet Clutch Disc. Materials 2022, 15, 5384. [Google Scholar] [CrossRef] [PubMed]
- Farfan-Cabrera, L.I.; Gallardo-Hernández, E.A.; Vite-Torres, M.; Godínez-Salcedo, J.G. Influence of Oxidation of Automatic Transmission Fluids (ATFs) and Sliding Distance on Friction Coefficients of a Wet Clutch in the Running-in Stage. Friction 2021, 9, 401–414. [Google Scholar] [CrossRef]
- Schneider, T.; Voelkel, K.; Pflaum, H.; Stahl, K. Failure Modes of Spontaneous Damage of Wet-Running Multi-Plate Clutches with Carbon Friction Linings. Tribol. Trans. 2022, 65, 813–826. [Google Scholar] [CrossRef]
- Li, M.; Khonsari, M.M.; Mccarthy, D.M.C.; Lundin, J. Parametric Analysis for a Paper-Based Wet Clutch with Groove Consideration. Tribol. Int. 2014, 80, 222–233. [Google Scholar] [CrossRef]
- Bao, H.; Huang, W.; Lu, F. Investigation of Engagement Characteristics of a Multi-Disc Wet Friction Clutch. Tribol. Int. 2021, 159, 10694. [Google Scholar]
- Chen, L.; Li, R.; Xie, F.; Wang, Y. Load-Bearing Capacity Research in Wet Clutches with Surface Texture. Measurement 2019, 142, 96–104. [Google Scholar] [CrossRef]
- Zhang, H.; Hua, M.; Dong, G.; Zhang, D.; Chin, K. A Mixed Lubrication Model for Studying Tribological Behaviors of Surface Texturing. Tribol. Int. 2016, 93, 583–592. [Google Scholar] [CrossRef]
- Chen, S.; Han, Z.; Zeng, Q.; Wang, B.; Wang, L.; Guo, L.; Shao, Y. Influence of Manufacturing Surface Topography on Torque and Load Bearing Capacity of Hydro-Viscous Drive Clutch Under Mixed Lubrication Stage. Ind. Lubr. Tribol. 2024, 76, 81–90. [Google Scholar] [CrossRef]
- Li, S.; Di, Z.; Cheng, L.; Liu, Z.; Piao, J.; Huang, D.; Zhao, Z.; Cui, H.; Li, Y. Surface Chemical Characterization of Steel Clutch Plate in ATF. Tribol. Int. 2016, 102, 319–325. [Google Scholar] [CrossRef]
- Wirkner, J.; Baese, M.; Lebel, A.; Pflaum, H.; Voelkel, K.; Pointner-Gabriel, L.; Besser, C.; Schneider, T.; Stahl, K. Influence of Water Contamination, Iron Particles, and Energy Input on the NVH Behavior of Wet Clutches. Lubricants 2023, 11, 459. [Google Scholar] [CrossRef]
- Fatima, N.; Minami, I.; Holmgren, A.; Marklund, P.; Larsson, R. Surface chemistry of wet clutch influenced by water contamination in automatic transmission fluids. Tribol. Int. 2016, 96, 395–401. [Google Scholar] [CrossRef]
- Farfán-Cabrera, L.; Gallardo-Hernández, E.; Vite-Torres, M.; Laguna-Camacho, J. Frictional Behavior of a Wet Clutch Using Blends of Automatic Transmission Fluid (ATF) and Biolubricant (Jatropha Oil) in a Pin-on-Disk Tester. Tribol. Trans. 2015, 58, 941–946. [Google Scholar] [CrossRef]
- Fei, J.; Li, H.; Fu, Y.; Qi, L.; Zhang, Y. Effect of Phenolic Resin Content on Performance of Carbon Fiber Reinforced Paper-Based Friction Material. Wear 2010, 269, 534–540. [Google Scholar] [CrossRef]
- Zhang, X.; Li, K.; Li, H.; Fu, Y.; Fei, J. Tribological and Mechanical Properties of Glass Fiber Reinforced Paper-Based Composite Friction Material. Tribol. Int. 2014, 69, 156–167. [Google Scholar] [CrossRef]
- Ingram, M.; Noles, J.; Watts, R.; Harris, S.; Spikes, H.A. Frictional Properties of Automatic Transmission Fluids: Part Ⅱ-Origins of Friction-Sliding Speed Behavior. Tribol. Trans. 2010, 54, 154–167. [Google Scholar] [CrossRef]
- Ma, B.; Wang, Q.; Zheng, C.; Yu, L.; Wang, G.; Zheng, L. Effect of ATF Temperature on the Friction-Wear Characteristic of a Wet Multi-Disc Clutch during the Running-in Process. Ind. Lubr. Tribol. 2022, 74, 714–721. [Google Scholar] [CrossRef]
- Li, W.; Huang, J.; Fei, J.; Liang, Z.; Cao, L.; Yao, C. Study on Tribological Properties as a Function of Operating Conditions for Carbon Fabric Wet Clutch. Tribol. Int. 2016, 94, 428–436. [Google Scholar]
- Cui, H.; Wang, Q.; Lian, Z.; Li, L. Theoretical Model and Experimental Research on Friction and Torque Characteristics of Hydro-Viscous Drive in Mixed Friction Stage. Chin. J. Mech. Eng. 2019, 32, 80. [Google Scholar] [CrossRef]
- Wu, J.; Cui, J.; Shu, W.; Wang, L.; Li, H. Coupling Mechanism and Data-Driven Approaches for High Power Wet Clutch Torque Modeling and Analysis. Tribol. Int. 2024, 191, 109166. [Google Scholar] [CrossRef]
- Ost, W.; Baets, P.; Degrieck, J. The Tribological Behaviour of Paper Friction Plates for Wet Clutch Application Investigated on SAE#II and Pin-On-Disk Test Rigs. Wear 2001, 249, 361–371. [Google Scholar]
- Fei, J.; Li, W.; Huang, J.; Cao, L.; Yao, C. Variation of the Tribological Properties of Carbon Fabric Composites in Their Whole Service Life. Tribol. Int. 2016, 99, 29–37. [Google Scholar]
- Voelkel, K.; Pflaum, H.; Stahl, K. Running-in Behavior of Wet Multi-Plate Clutches: Introduction of a New Test Method for Investigation and Characterization. Chin. J. Mech. Eng. 2020, 33, 34. [Google Scholar] [CrossRef]
- Wang, Q.; Ma, B.; Yu, L.; Xiong, C.; Zheng, L. Effects of Operating Conditions on the Tribological Behavior of a Wet Multi-Disc Clutch during the Running-in Process. Tribol. Int. 2023, 179, 108096. [Google Scholar] [CrossRef]
- Dong, H.; Fu, J.; Zhao, Z.; Liu, Q.; Li, Y.; Liu, J. A Comparative Study on the Energy Flow of a Conventional Gasoline-Powered Vehicle and a New Dual Clutch Parallel-Series Plug-in Hybrid Electric Vehicle Under NEDC. Energy Convers. Manag. 2020, 218, 113019–113026. [Google Scholar] [CrossRef]
- Wu, B.; Qin, D.; Hu, J.; Wang, X.; Wang, Y.; Lv, H. Analysis of Influencing Factors and Changing Laws on Friction Behavior of Wet Clutch. Tribol. Int. 2021, 162, 107125. [Google Scholar] [CrossRef]
- Greenwood, J.; Tripp, J. The Contact of Two Nominally Flat Rough Surfaces. Proc. Inst. Mech. Eng. 1970, 185, 625–634. [Google Scholar] [CrossRef]
- Patir, N.; Cheng, H. Application of Average Flow Model to Lubrication Between Rough Sliding Surfaces. ASME J. Tribol. 1979, 101, 220–229. [Google Scholar] [CrossRef]
Figure 1.
Wet clutch engagement process.
Figure 2.
Wet clutch transmission experimental system.

Figure 3.
Wet clutches with different service mileages.
Figure 4.
Equivalent contact model of the asperities on the friction pair surface.
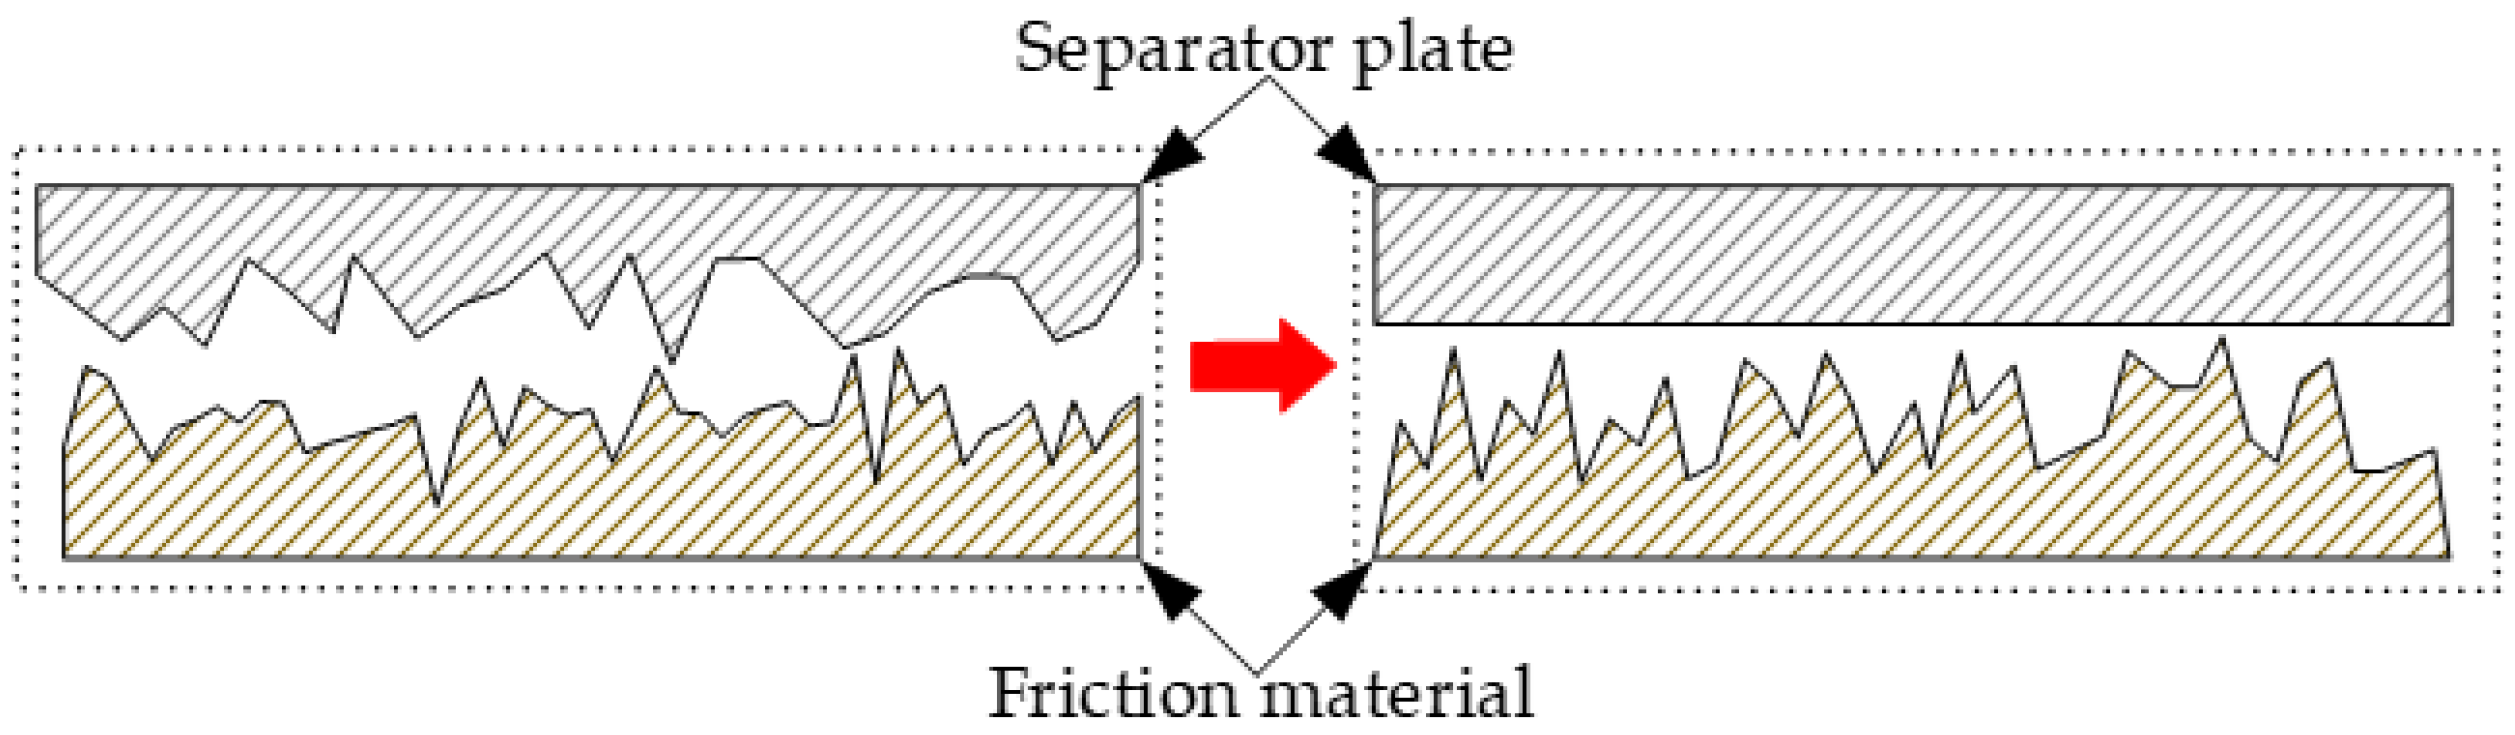
Figure 5.
Influence of the CEF on the friction coefficient (Section 2.3, Test (1)).
Figure 5.
Influence of the CEF on the friction coefficient (Section 2.3, Test (1)).
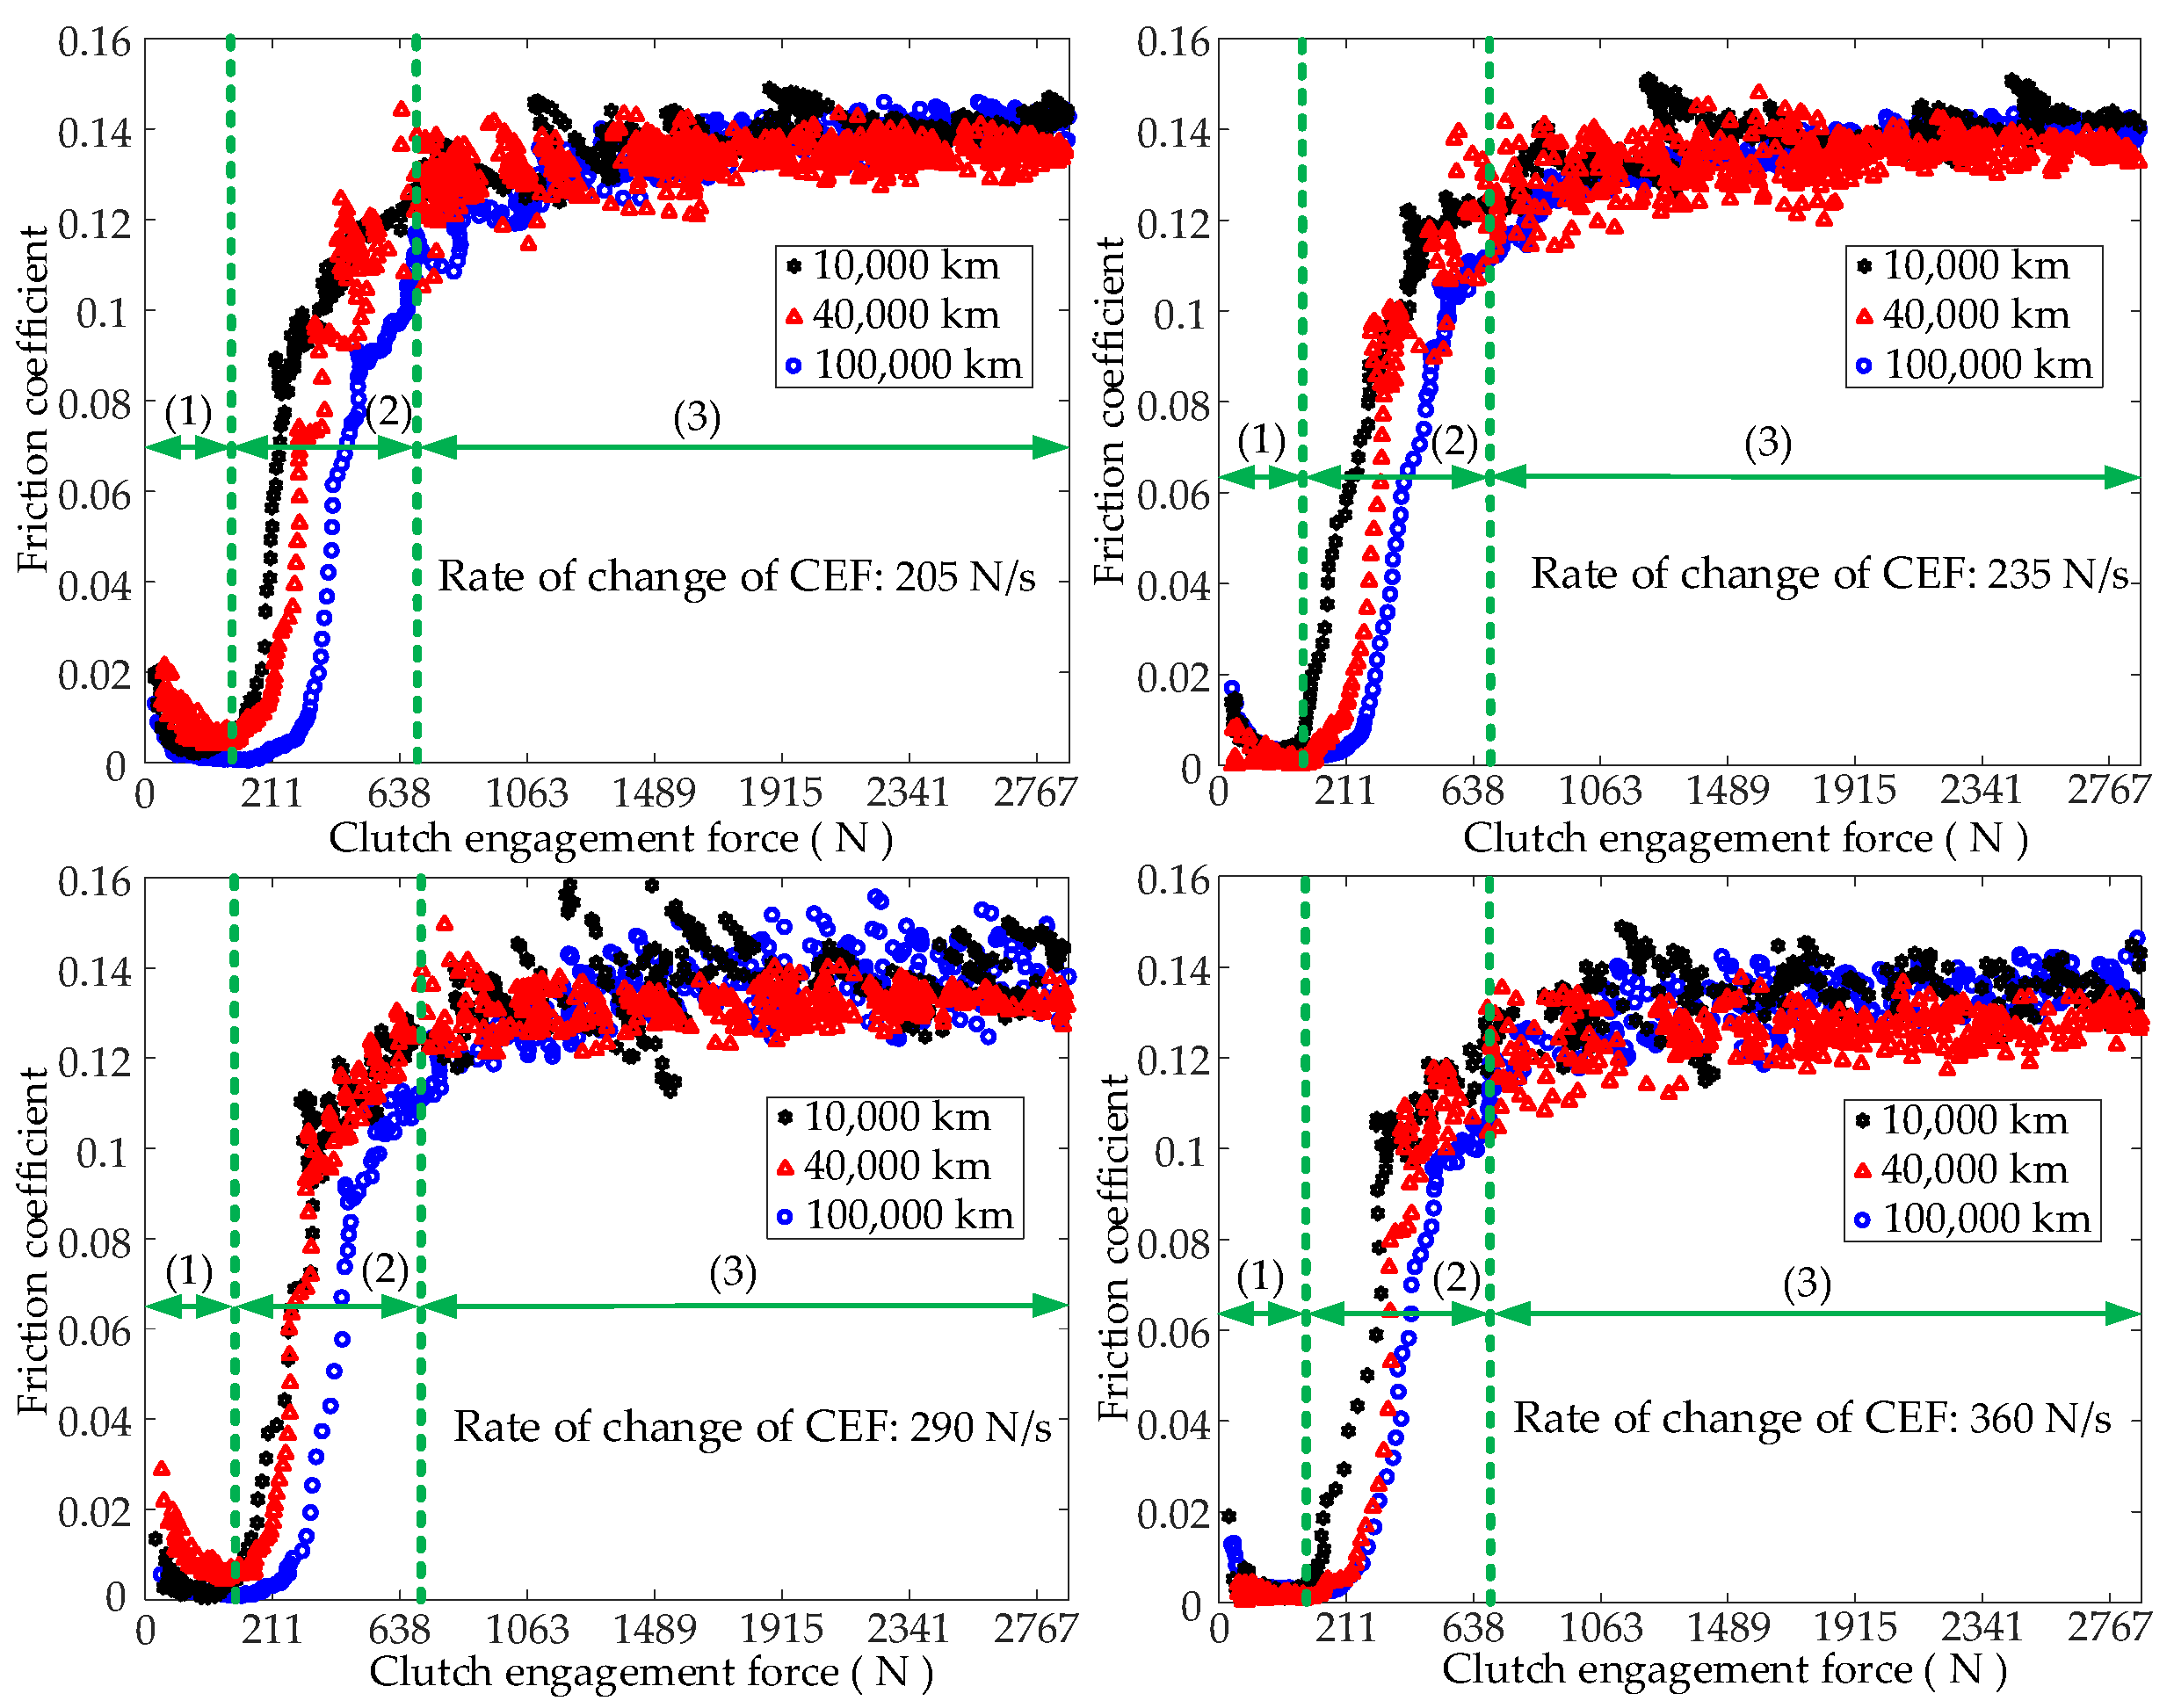
Figure 6.
Influence of the service mileage on the friction coefficient (Section 2.3, Test (2)).
Figure 6.
Influence of the service mileage on the friction coefficient (Section 2.3, Test (2)).
Figure 7.
Influence of the CAES on the friction coefficient (Section 2.3, Test (3)).
Figure 7.
Influence of the CAES on the friction coefficient (Section 2.3, Test (3)).
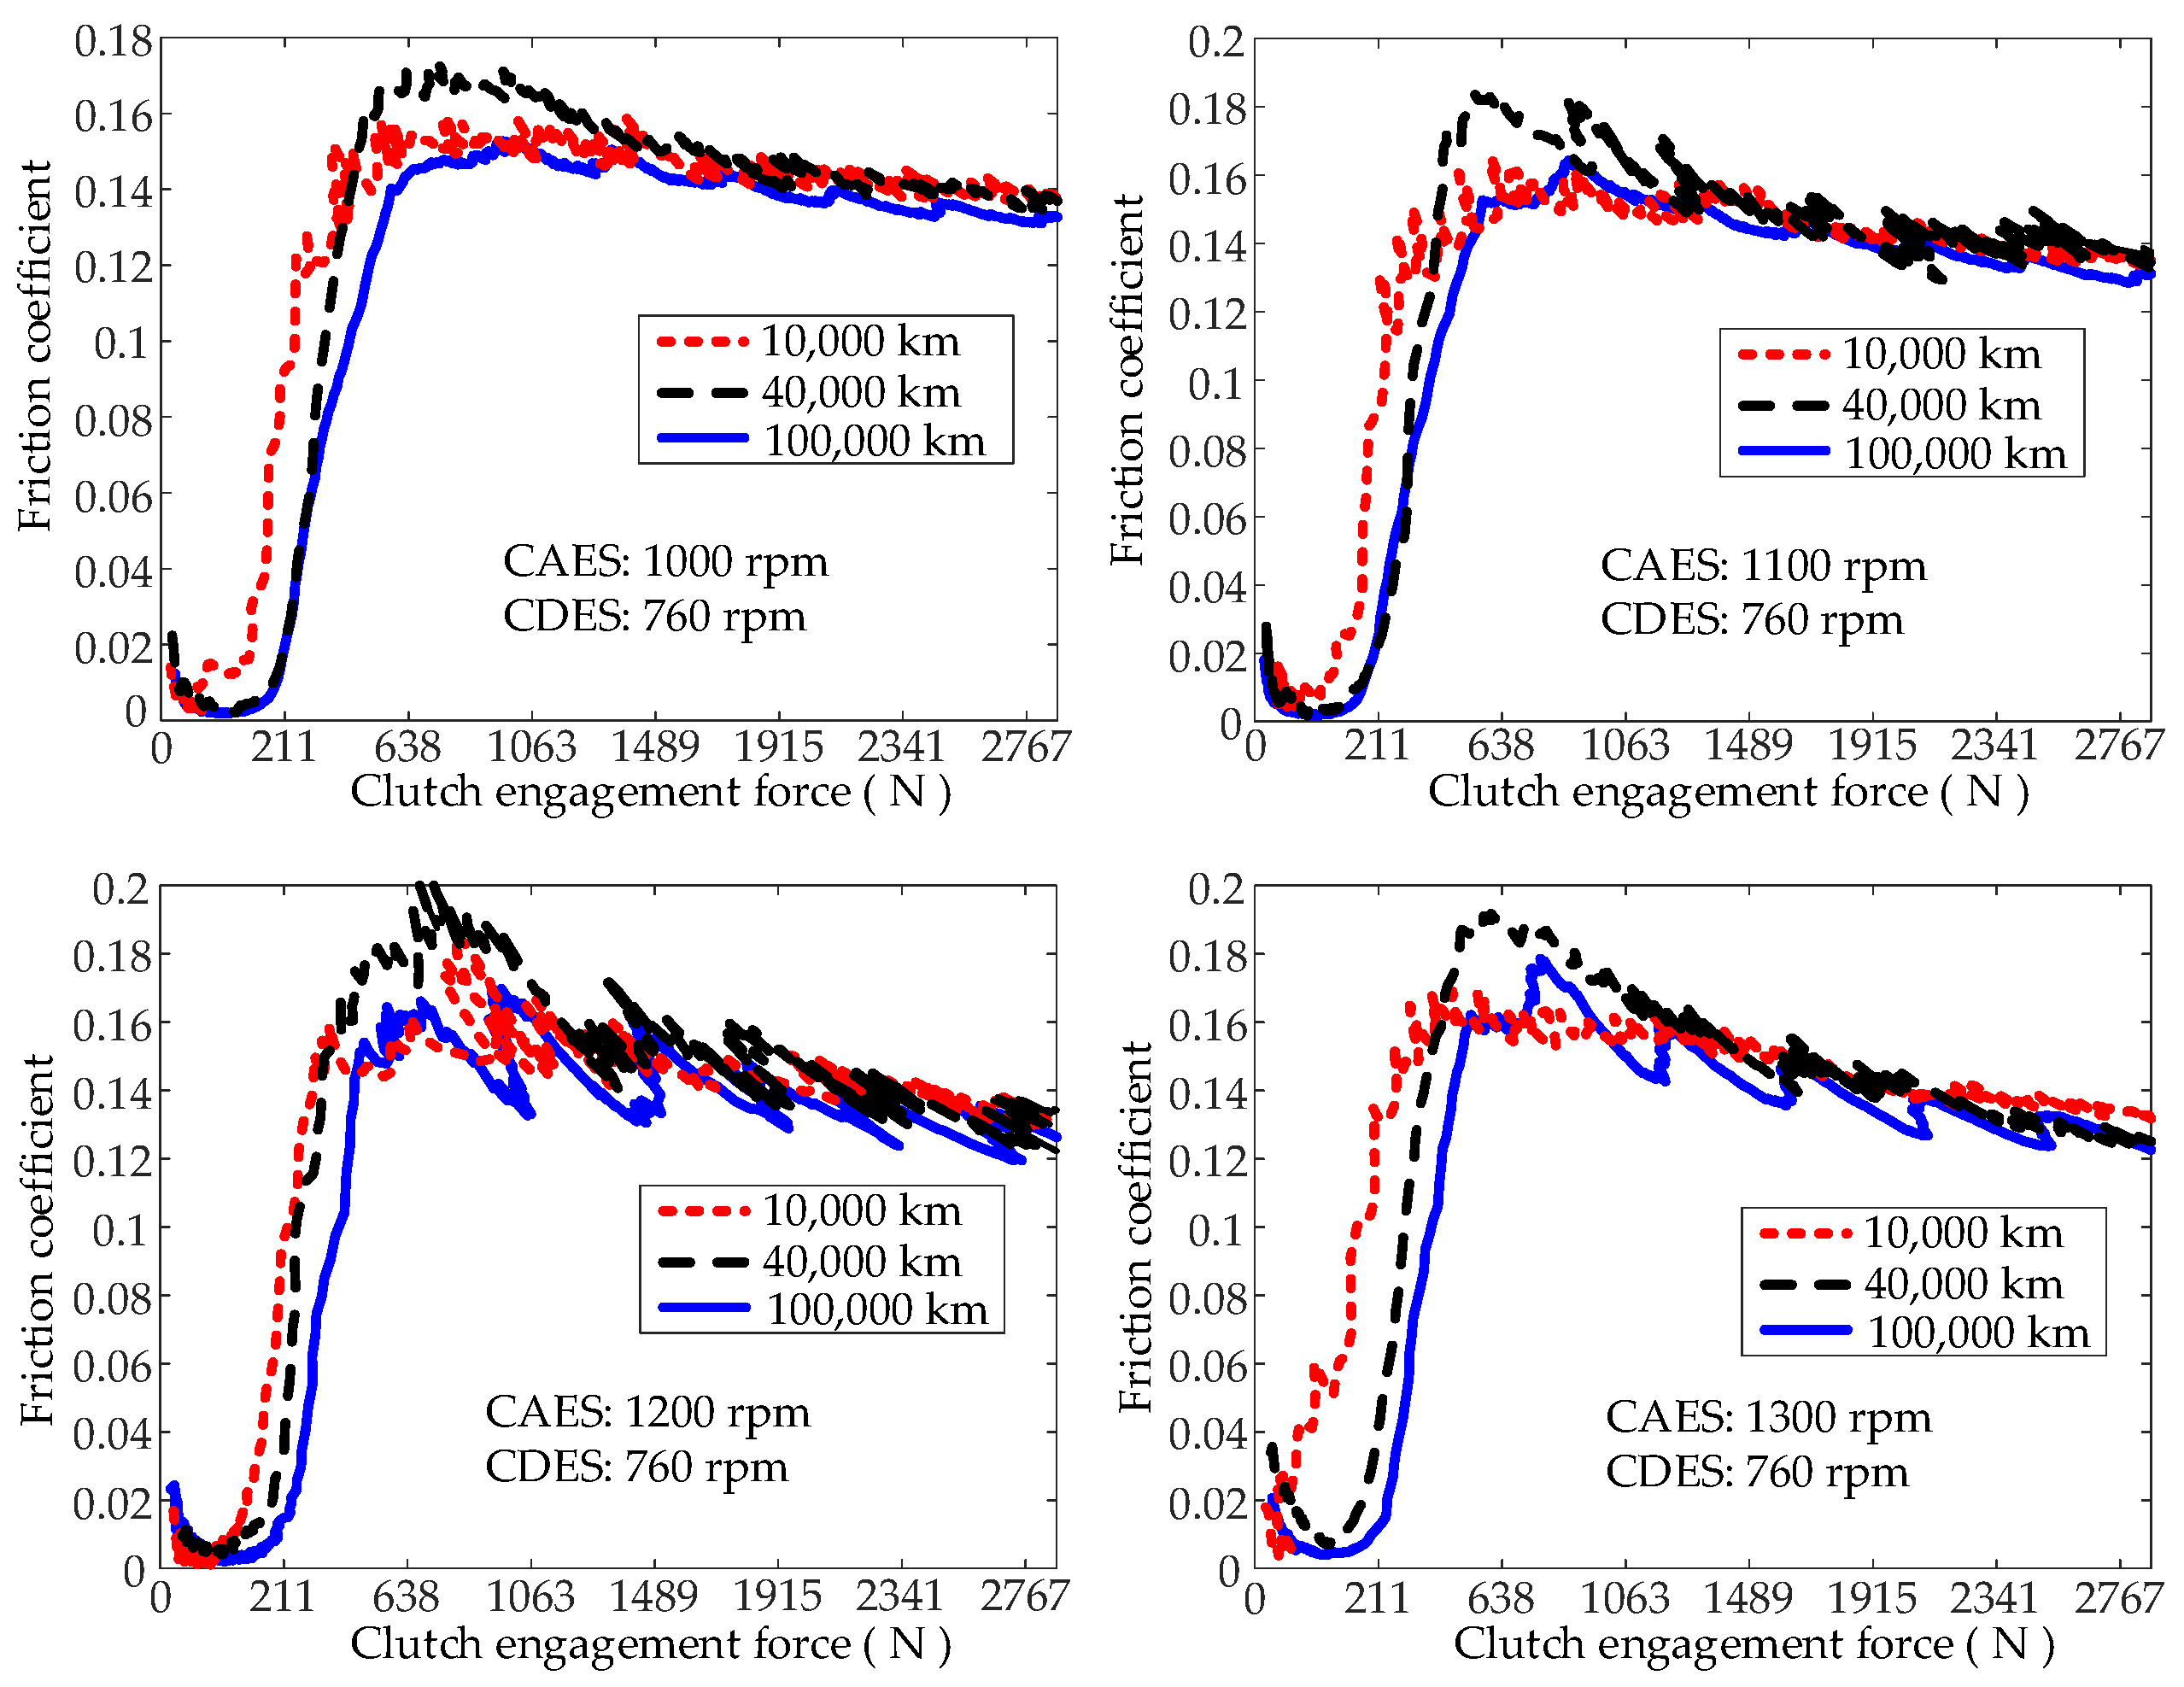
Figure 8.
Influence of the FST on the friction coefficient (Section 2.3, Test (4)).
Figure 8.
Influence of the FST on the friction coefficient (Section 2.3, Test (4)).

Figure 9.
Influence of the CDES on the friction coefficient (Section 2.3, Test (5)).
Figure 9.
Influence of the CDES on the friction coefficient (Section 2.3, Test (5)).
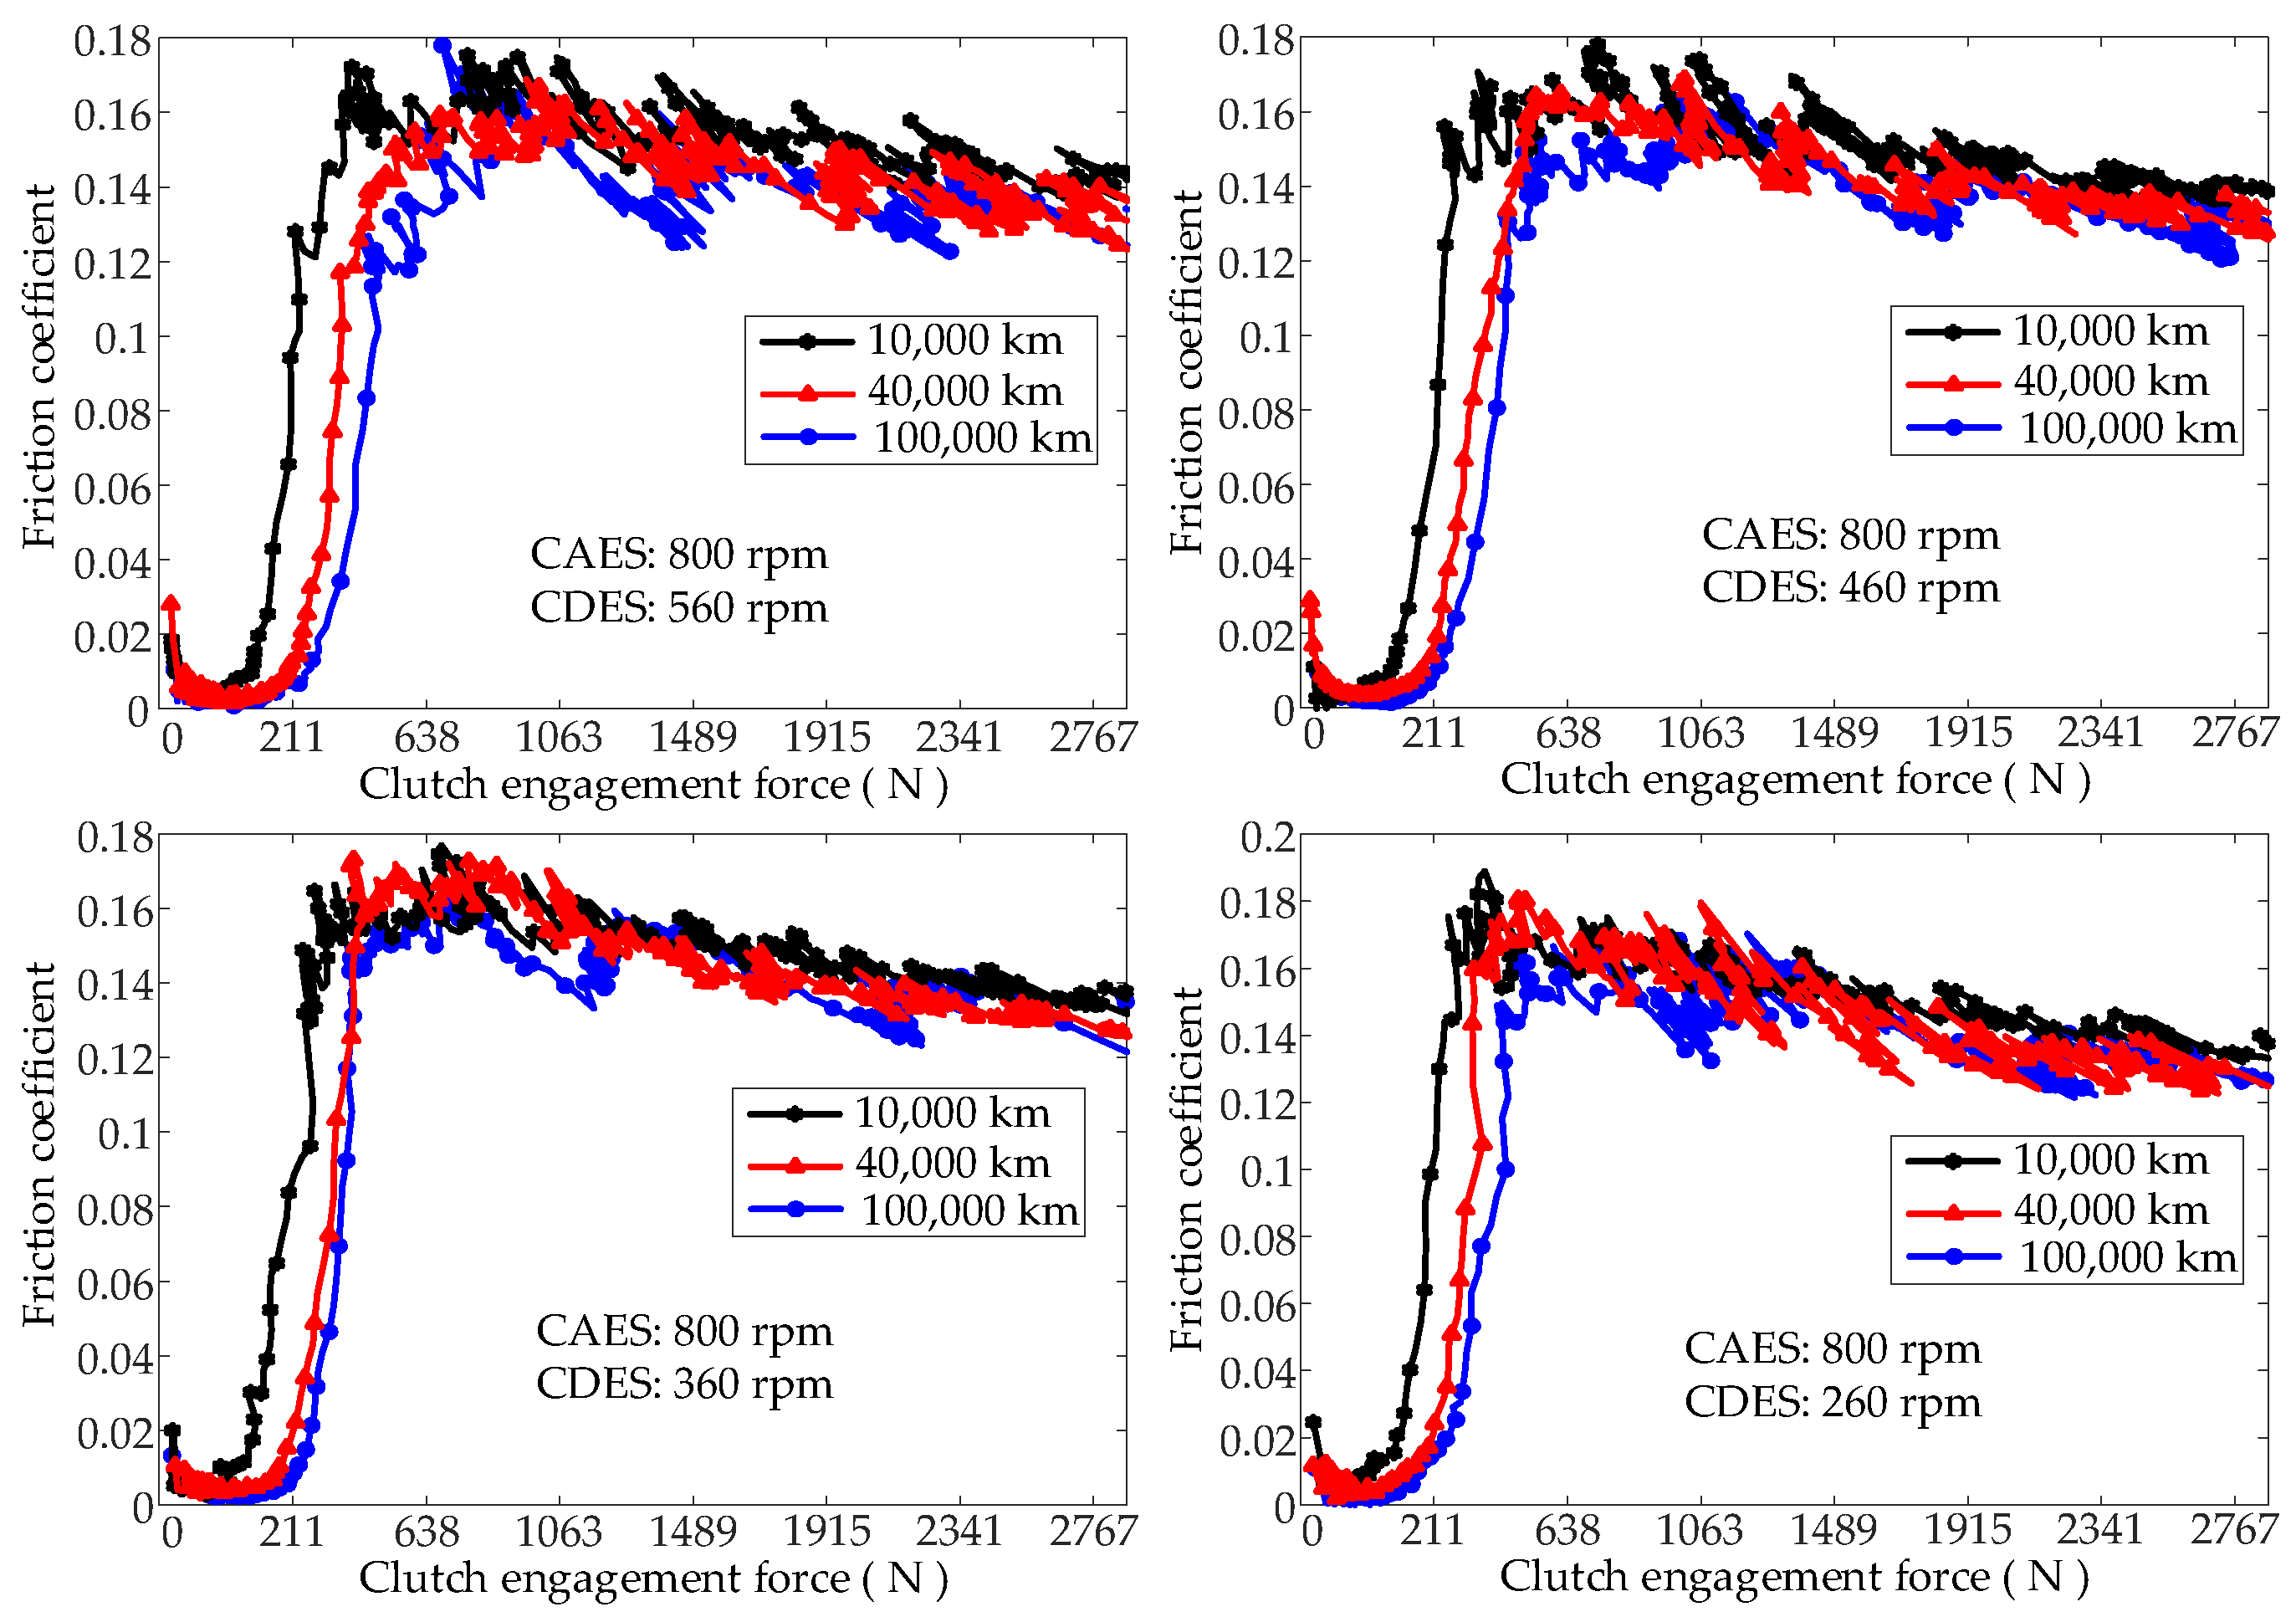
Figure 10.
Top view of the three-dimensional profile of the friction plate.
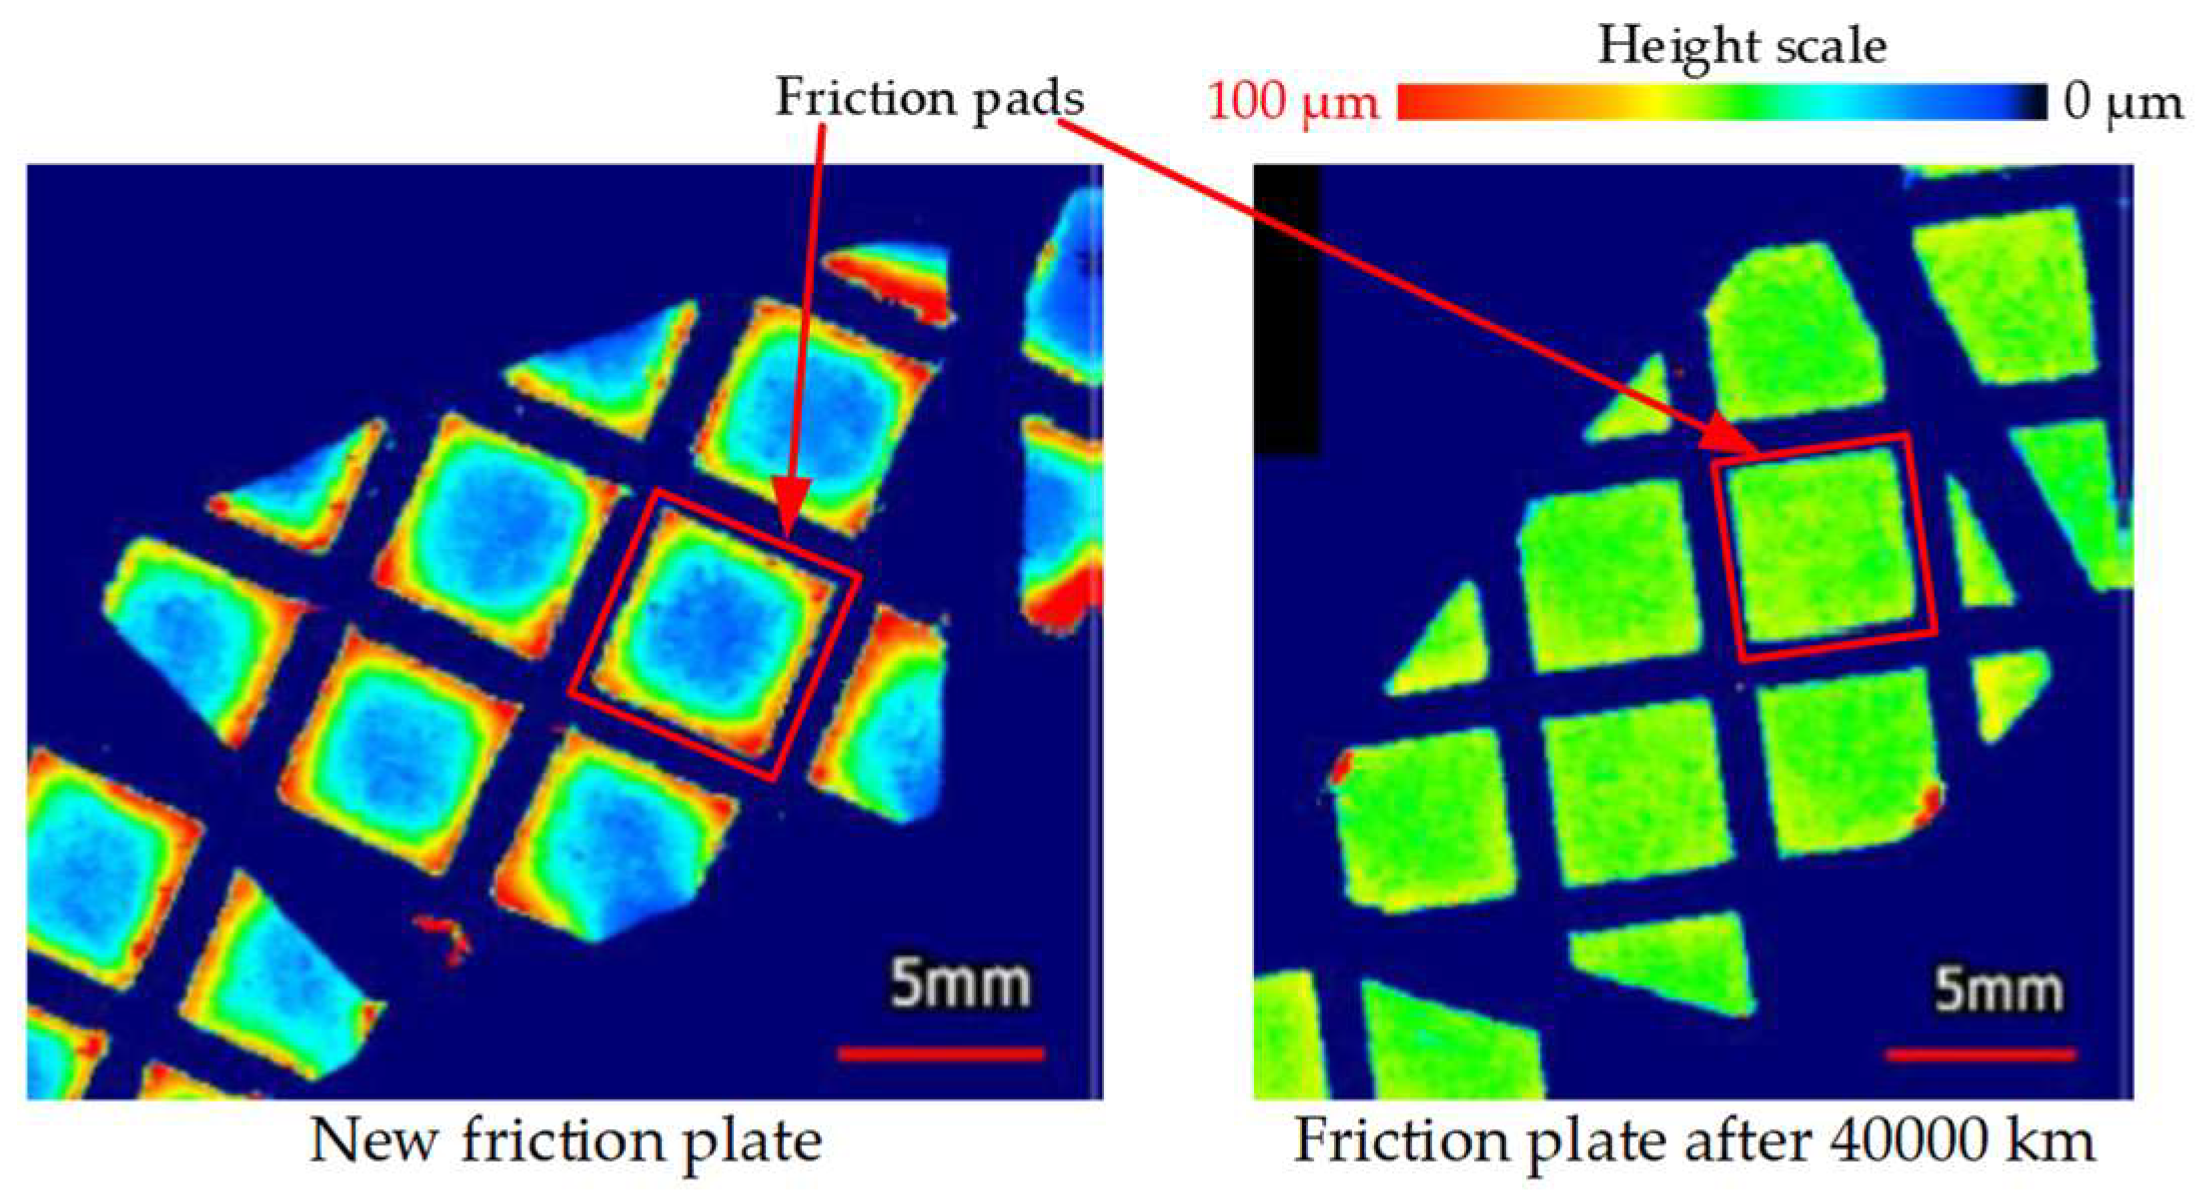
Figure 11.
Three-dimensional profiles of the friction pads on the friction pate.
Figure 12.
Theoretical simulation of the service characteristics of the friction in the wet clutches. (a) The simulation conditions for the clutch engagement process. (b) Theoretical simulation results of friction coefficient variation. (c) The ratio of the contact area of asperities to the total area. (d) The simulation results of torque transmission during the clutch engagement process.
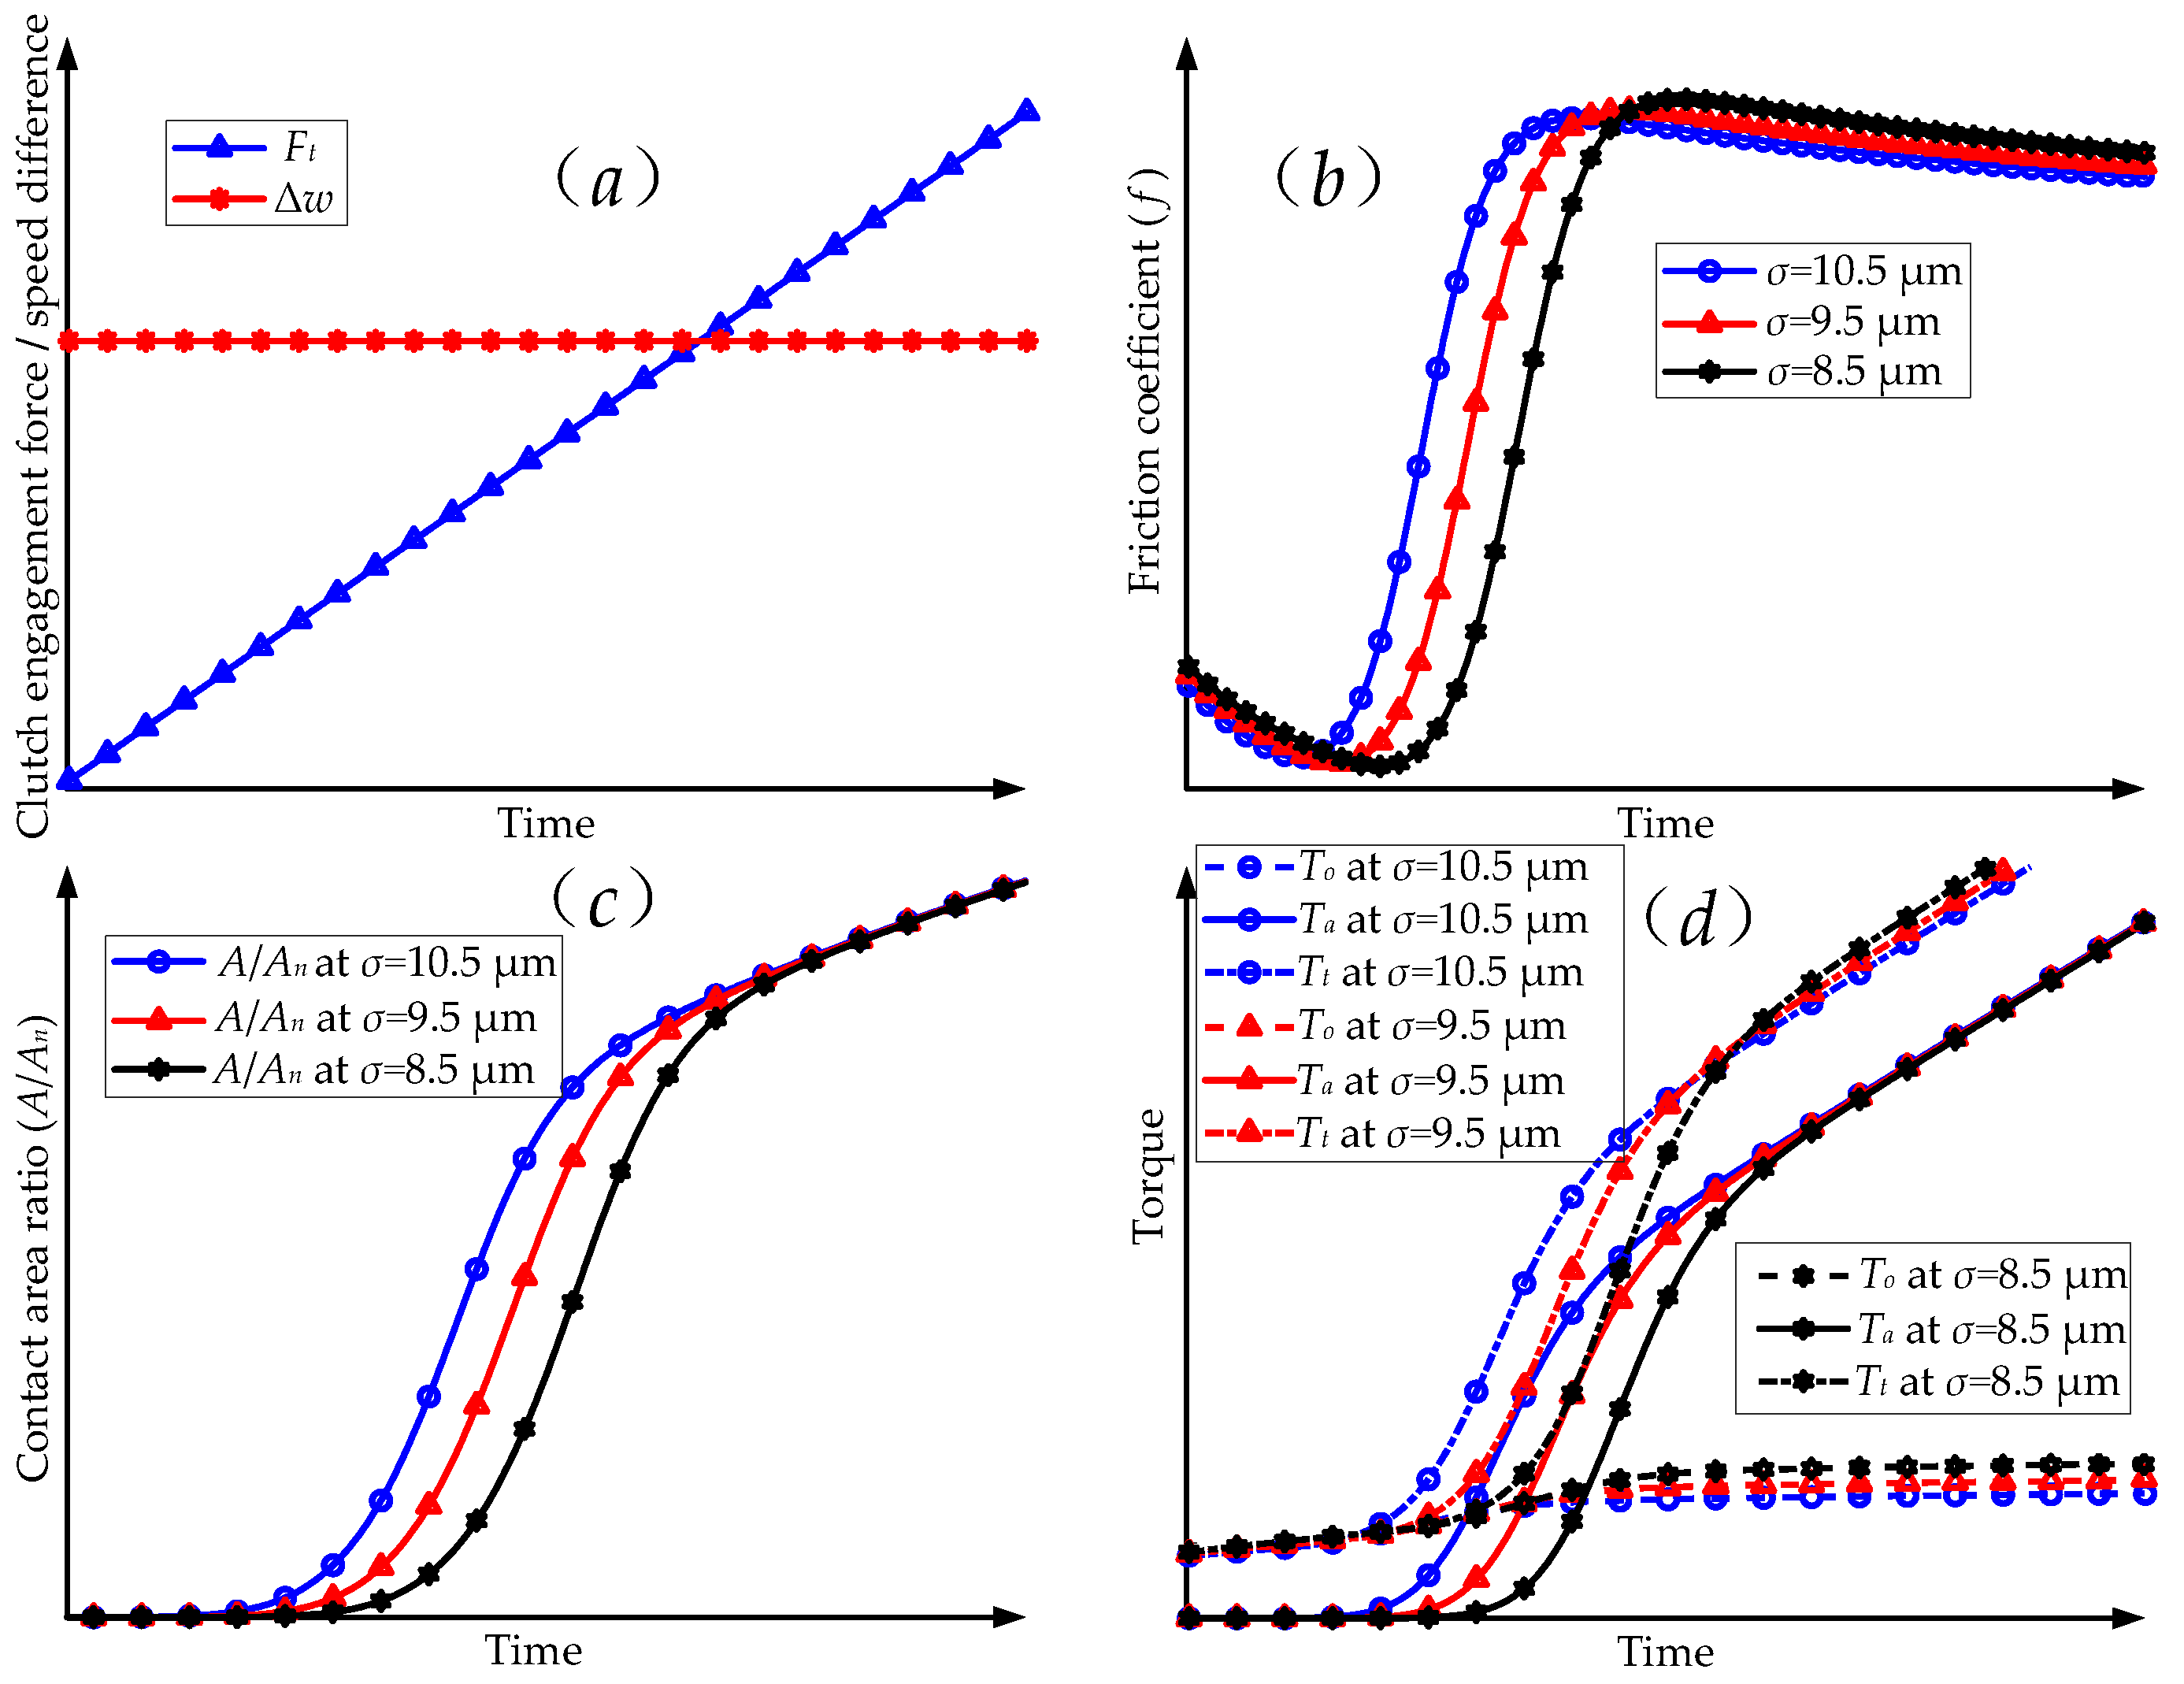
Figure 13.
Comparison between the simulation results and experimental data. (a) Theoretical simulation results of friction coefficient. (b) Section 2.3, Test (1) experimental results. (c) Section 2.3, Test (3) experimental results. (d) Section 2.3, Test (5) experimental results.
Figure 13.
Comparison between the simulation results and experimental data. (a) Theoretical simulation results of friction coefficient. (b) Section 2.3, Test (1) experimental results. (c) Section 2.3, Test (3) experimental results. (d) Section 2.3, Test (5) experimental results.

Table 1.
The main characteristic parameters of the experimental system.
| Component | Characteristic Parameter |
|---|---|
| Drive motor | Power 132 kW, Rated speed 3000 rpm |
| Thermocouple | Model TT-K-36-SLE, Temperature range −267–260 °C |
| Dynamometer | Power 250 kW, Rated speed 3000 rpm |
| Inertia flywheel | Inertia 120 kg·m2 |
| Control system | MicroAutoBox II 1401 |
| Torque and speed sensor | Model HBM T40B, Rated torque 500 Nm and 3000 Nm |
| Oil temperature control system | Temperature range 10–90 °C |
Disclaimer/Publisher’s Note: The statements, opinions and data contained in all publications are solely those of the individual author(s) and contributor(s) and not of MDPI and/or the editor(s). MDPI and/or the editor(s) disclaim responsibility for any injury to people or property resulting from any ideas, methods, instructions or products referred to in the content. |
© 2024 by the author. Licensee MDPI, Basel, Switzerland. This article is an open access article distributed under the terms and conditions of the Creative Commons Attribution (CC BY) license (https://creativecommons.org/licenses/by/4.0/).
Share and Cite
MDPI and ACS Style
Wu, B. Friction Coefficient of Wet Clutches as a Function of Service Mileage. Lubricants 2024, 12, 147. https://doi.org/10.3390/lubricants12050147
AMA Style
Wu B. Friction Coefficient of Wet Clutches as a Function of Service Mileage. Lubricants. 2024; 12(5):147. https://doi.org/10.3390/lubricants12050147
Chicago/Turabian StyleWu, Bangzhi. 2024. "Friction Coefficient of Wet Clutches as a Function of Service Mileage" Lubricants 12, no. 5: 147. https://doi.org/10.3390/lubricants12050147
Note that from the first issue of 2016, this journal uses article numbers instead of page numbers. See further details here.