2.1. Patterned Specimen Preparation
With the recent development of powerful lasers, such as femtosecond lasers, laser surface texturing (LST) is now widely used to enhance the tribological performance of bearings. However, the process using conventional LST techniques is in general very time-consuming, and it is difficult to produce complex surface textures covering a relatively large bearing area. Mücklich et al. [
13] developed an efficient surface texturing technique based on the interference of powerful laser beams. The technique, termed direct laser interference patterning (DLIP), produces interference fields that form micron/submicron surface topography on a fairly large area of interest.
A specimen steel block with a sliding surface of 4 mm (in the sliding direction) and 6 mm (in the lateral direction) in size was used in the experiment. The sample surface was highly polished and its roughness,
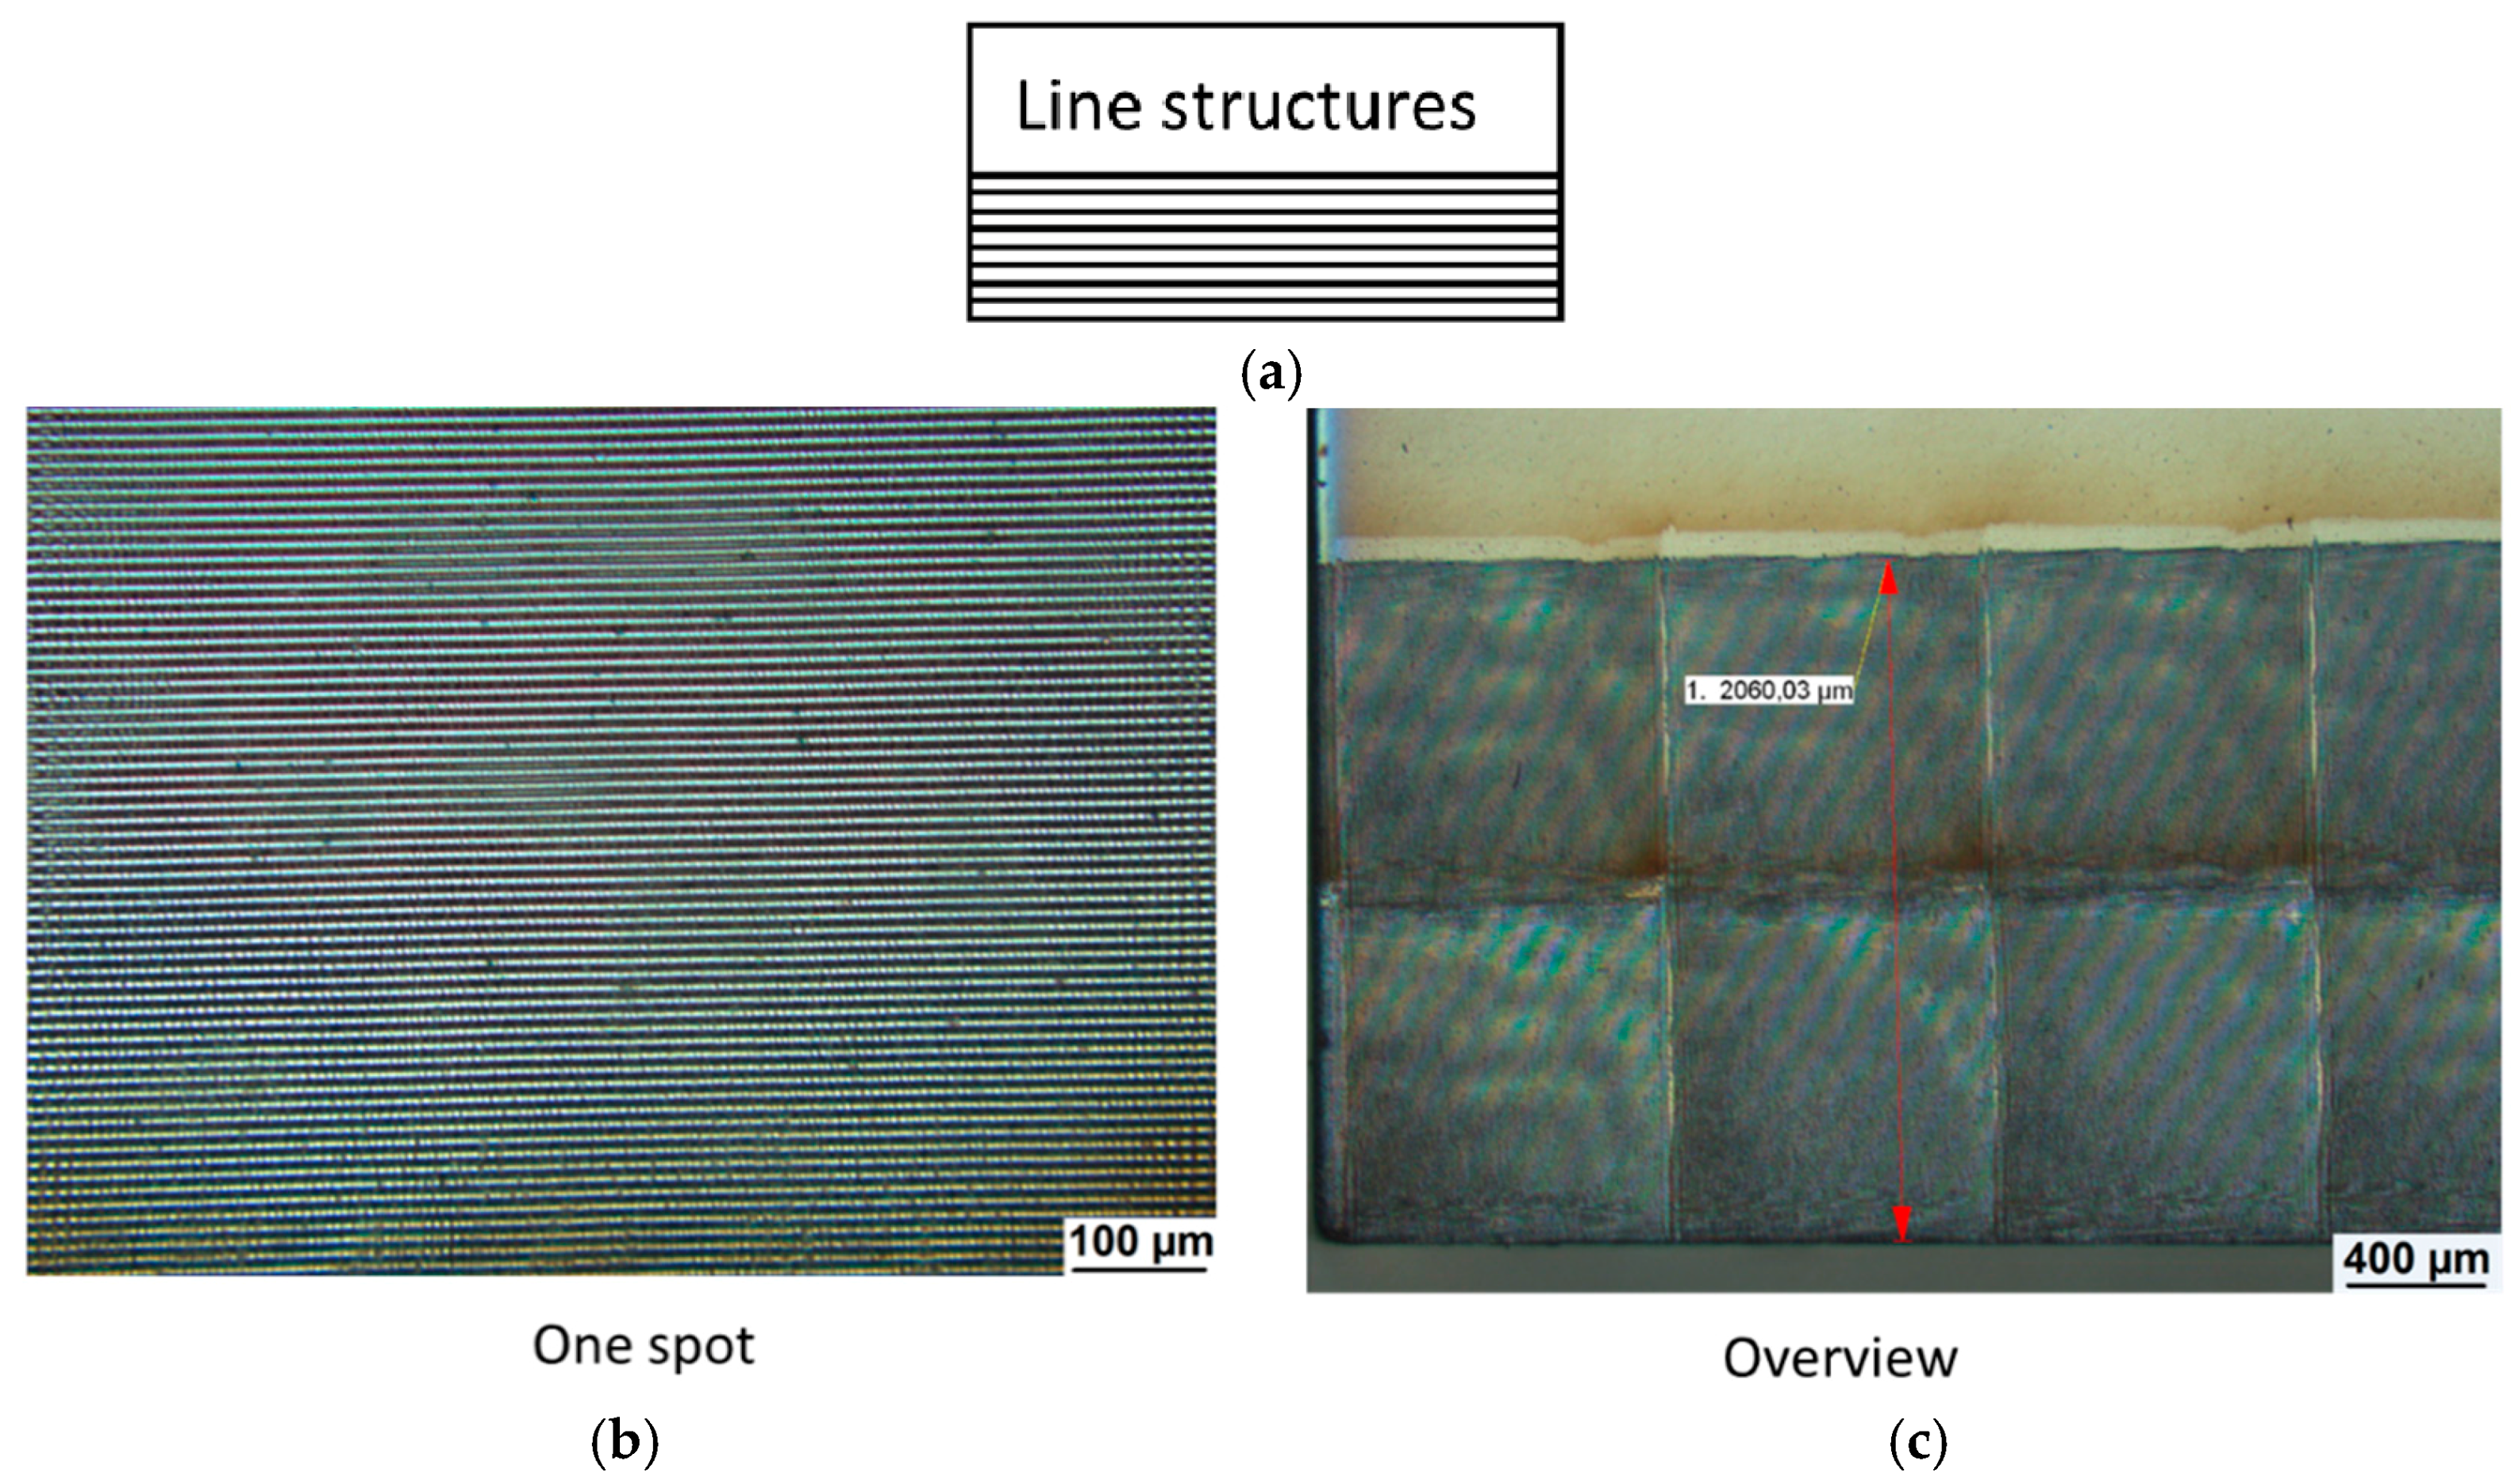
Ra, was about 6 nm. A pulsed Nd:YAG laser (Spectra Physics, Quanta Ray PRO 290, Darmstadt, Germany) with a pulse duration of 10 ns and a repetition rate of 10 Hz was used for the laser patterning process. The out-coming laser beam with a wavelength of 355 nm was divided into two laser beams, which were finally superimposed with each other, thus leading to a line-like interference pattern (see
Figure 1a). Half of the slider surface was patterned with two rows of laser spot alignments parallel to the inlet zone (
Figure 1b,c). The intensity of each beam can be precisely adjusted by applying suitable beam splitters. The laser energy density (fluence) was set to be 400 mJ/cm
2 for all treated steel substrates. The structural wavelength (line spacing) was fixed at about 9 µm. All sample surfaces were laser-textured under standard atmospheric conditions in air using a single laser pulse. More details of the experimental setup can be found in [
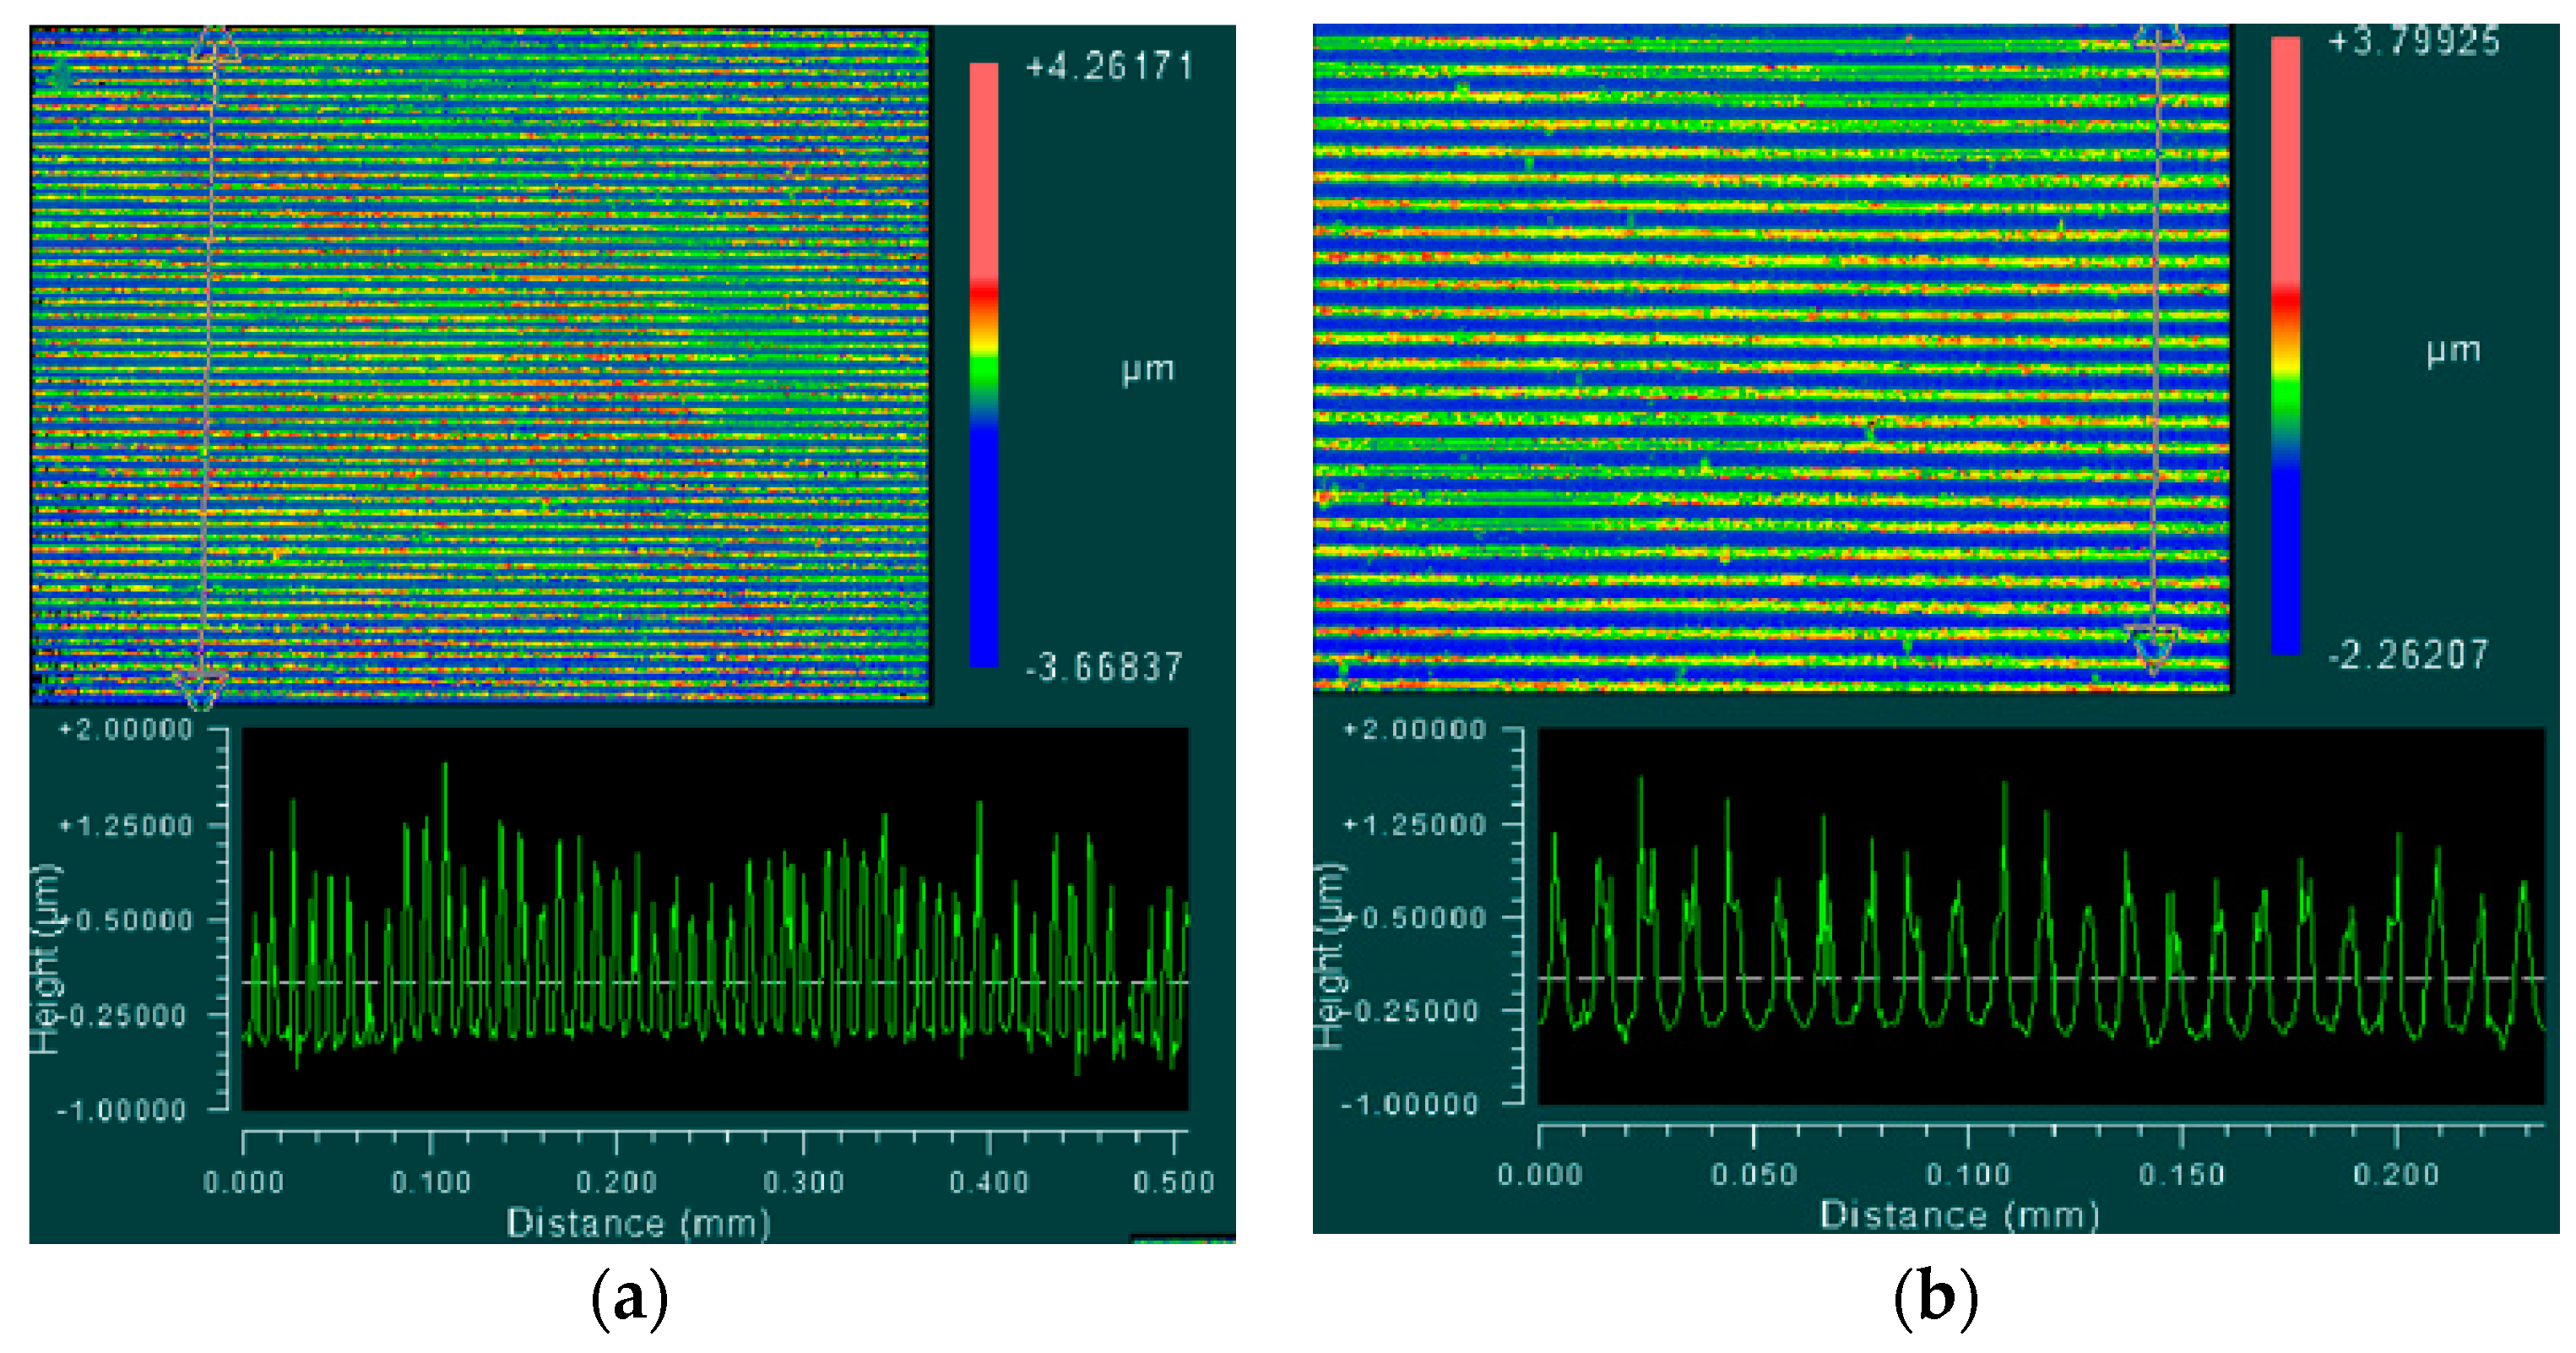
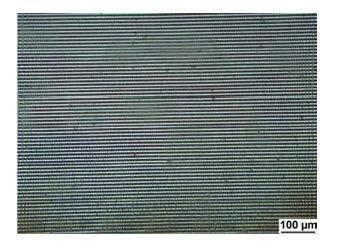
14]. The topography of the resulting laser surface texture was measured by optical interferometry (Zygo New View 100 white light interferometer (WLI), AMETEK, Weiterstadt, Germany). The patterns are homogeneous with a pattern periodicity of around 9 µm and a structural depth of approximately 1 µm, as shown in
Figure 2. At positions of maximum laser intensity, the material is molten, whereas the positions of minimum laser intensity are nearly unaffected. The sinusoidal intensity distribution of the laser interference process leads to a temperature and thus a surface tension gradient. Thus, the material flows from locations of maximum to minimum laser intensity and re-solidifies. Because of this, positions of maximum laser intensity correspond to topographic minima and vice versa. The square-shaped single laser spots (
Figure 1b) are then stitched together (
Figure 1c) by a motorized
x–
y stage. The interference patterns also continue in the overlapping spot areas but with a slightly larger structural depth as the material is molten twice there.
2.2. Thin Film Lubrication Experiment
Optical interferometry is widely used in lubrication research for its high accuracy in measuring lubricating film thickness. The technique was first introduced for the measurement of the thickness of oil films in non-conformal elastohydrodynamic lubrication by Gohar and Cameron [
14] in the 1960s. While optical interferometry is readily implemented to measure the film profile of a lubricated point contact, it is not easy to facilitate steady measurements of conformal contacts such as slider bearings. An optical slider-bearing test rig was successfully developed by Guo et al. [
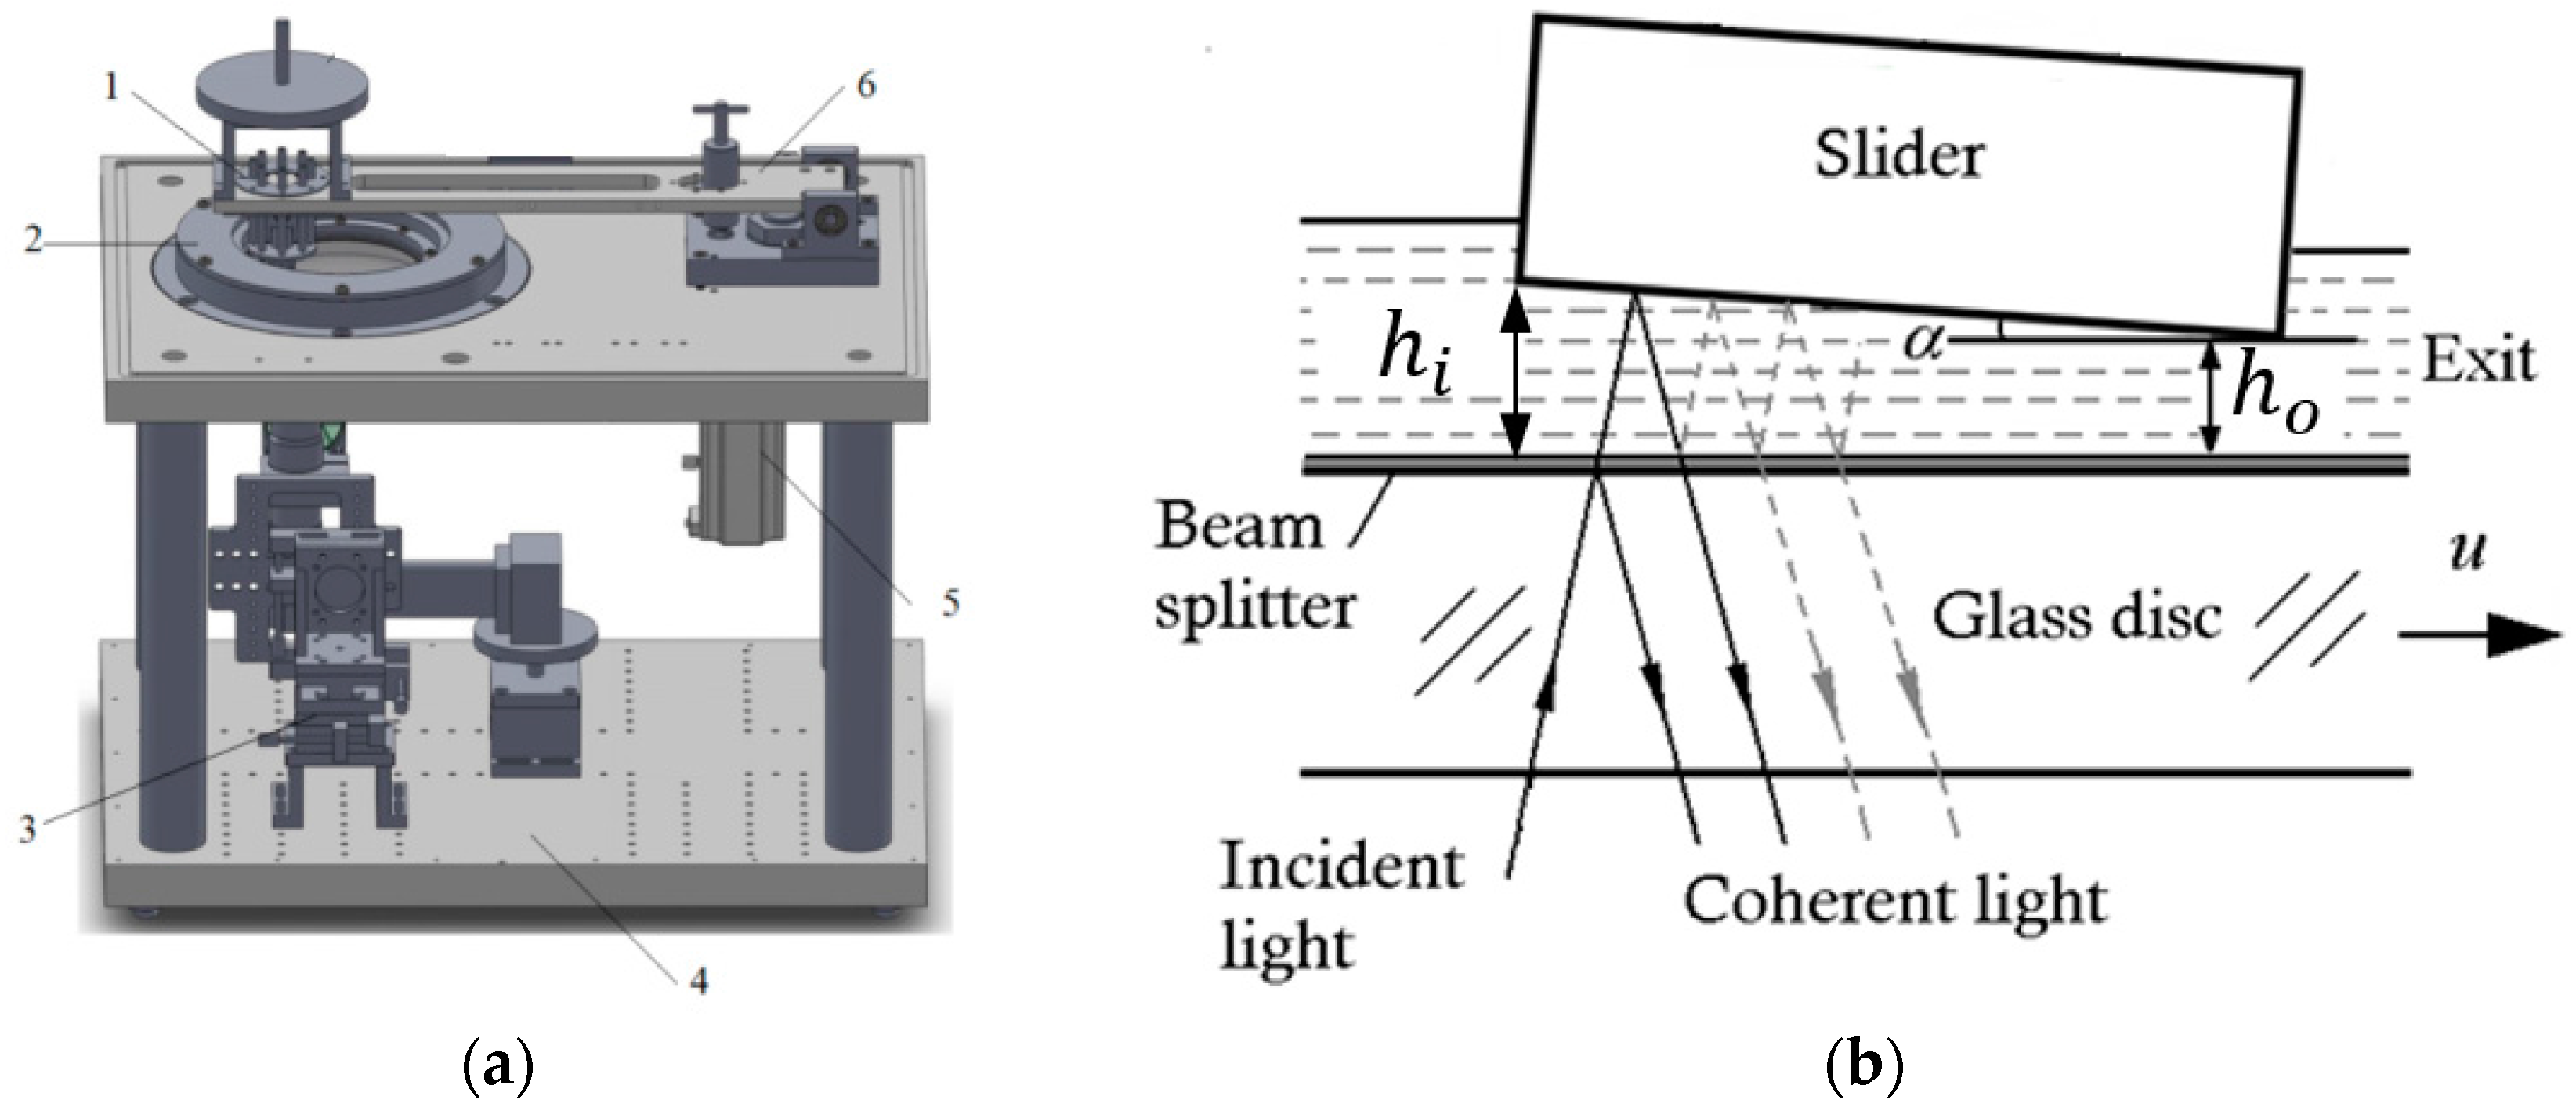
15]. The steady conformal sliding contact was achieved via a universal joint with backing bolts (Component 1 in
Figure 3a), which fastens the slider rigidly on the load arm. The slider set up is schematically shown in
Figure 3a.
Figure 3b illustrates the details of the sliding contact, which is constructed with a rotating glass disc and a stationary slider. Eight bolts are used to fix and adjust the inclination angle of the slider. To facilitate interferometry, the surface of the glass disc is coated with chromium and the reflectivity of the Cr-layer is about 20%.
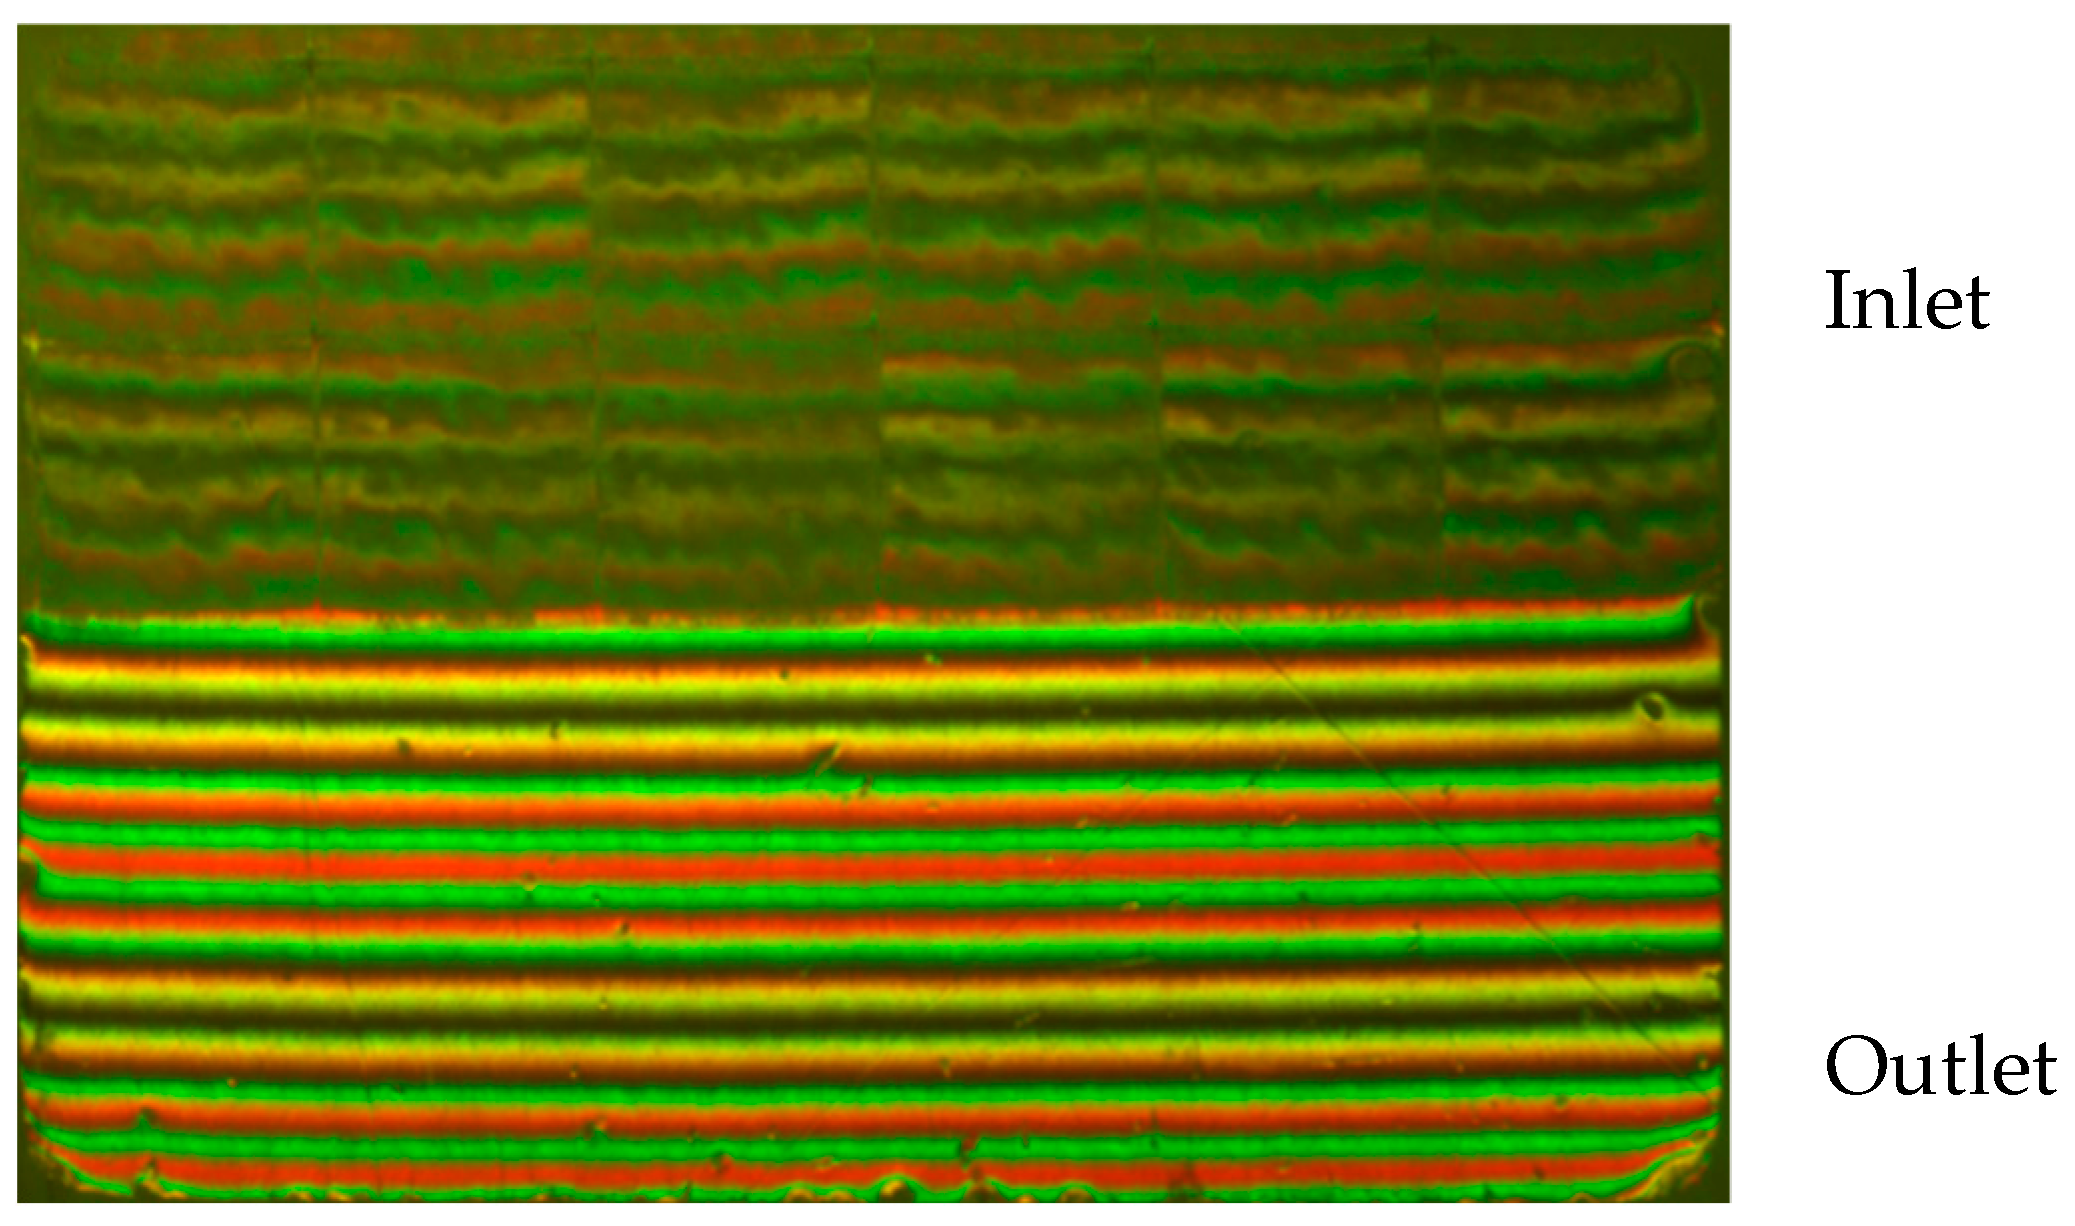
Figure 4 shows an optical interferogram formed between the inlet-textured slider and the glass disc. The slider is separated from the disc by the hydrodynamic effect of the lubricant once the disc starts rotating. By recording the change in optical interference formed between the slider and glass disc, the lubricant film thickness can be obtained directly with the developed algorithm [
16].
In this lubrication study, a synthetically based PAO oil without any additives was selected. The properties of the applied oil are listed in
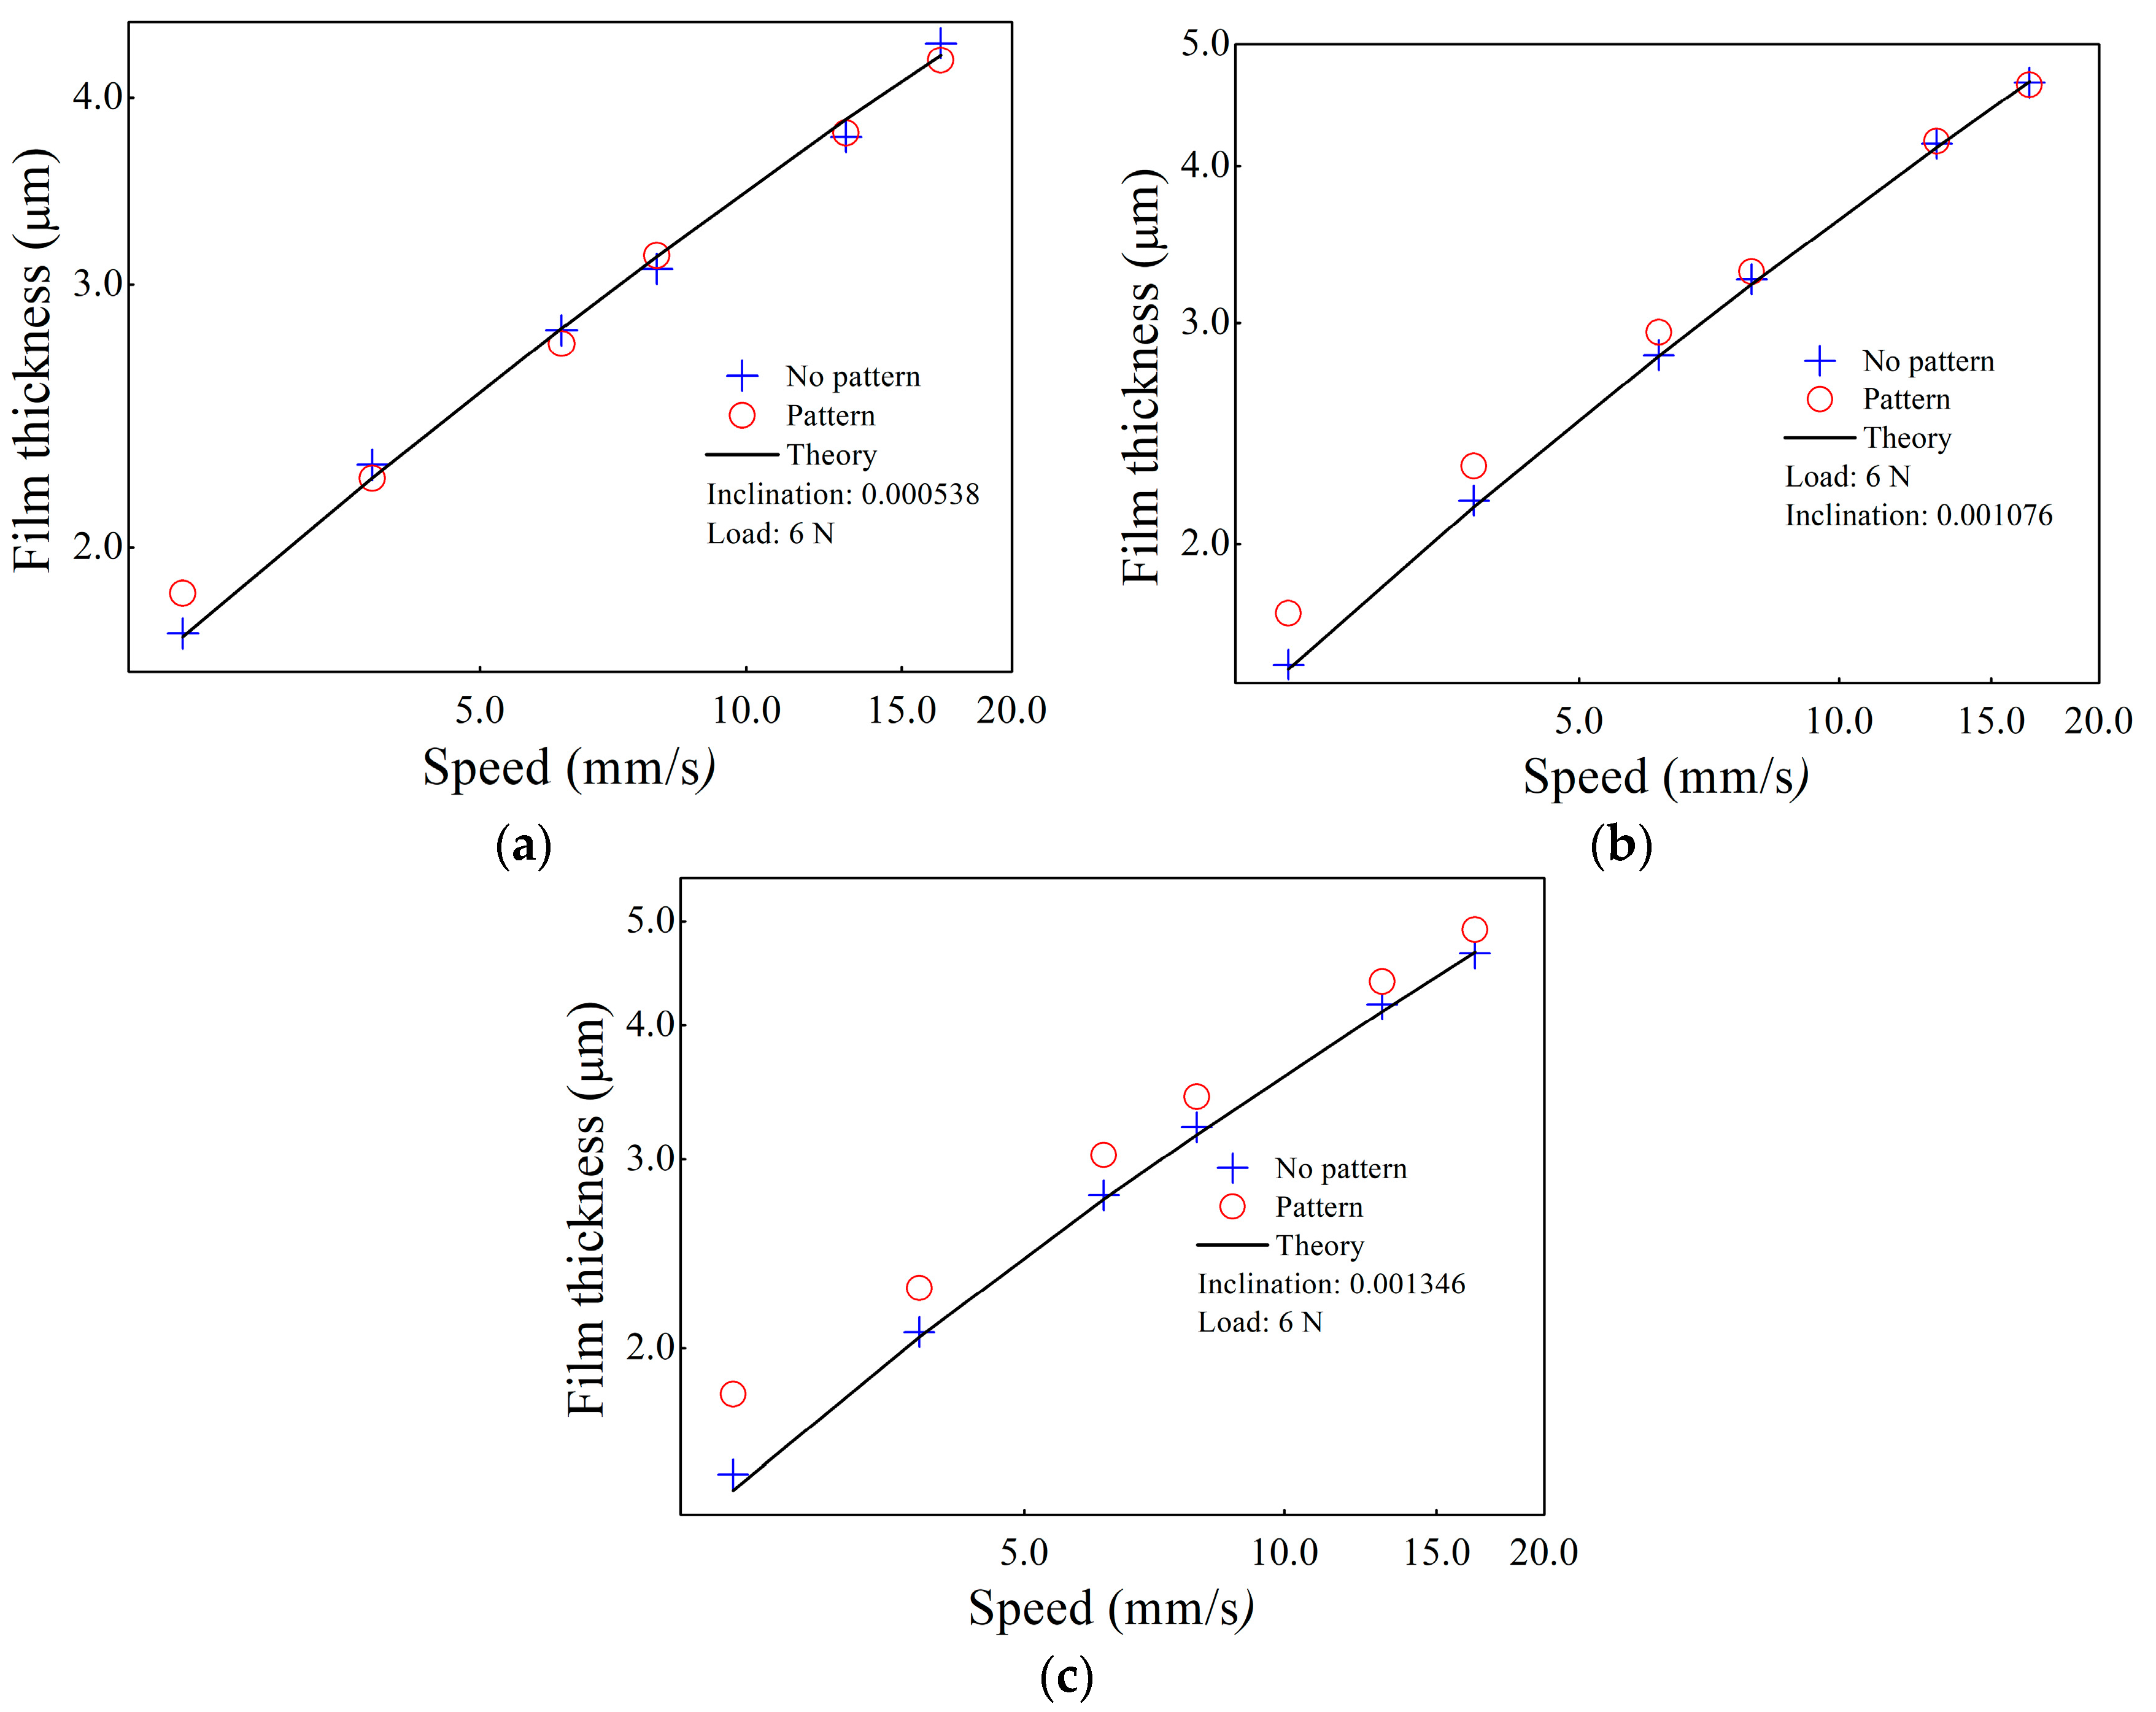
Table 1. A plain slider and a slider having transverse grooves on the front half of its sliding surface were applied. The size of these sliders is 4 mm (breadth, in the entrainment direction) × 6 mm (length, perpendicular to the entrainment direction). During the experiment, the change of lubricant film thickness versus speed was measured for sliders with different inclinations. A set of typical results of film thickness under a constant load of 6 N and with three different inclinations is shown in
Figure 5. The corresponding isothermal–theoretical curves are also plotted. The film thickness data of the plain slider (non-textured) for these three inclinations are well correlated by the theoretical curves in the whole speed range, which verifies the accuracy of the developed slider test rig. It also implies that there is no noticeable thermal effect generated in the experiment. Therefore, the thermal effect is ignored in the current study on hydrodynamic lubrication of inlet-textured surfaces. The measured film thickness data with a small inclination (
Figure 5a) are almost equal to those of the plain slider, except the first one under a low speed. The departure of experimental values of film thickness of the inlet-textured slider from theoretical values at low speeds becomes more pronounced as the inclination increased (
Figure 5b). For high inclination, the inlet-textured slider generated significantly higher film thickness than the plain slider in the whole speed range of the study (
Figure 5c). The inclination is, indeed, a key parameter which determines the texture effect on hydrodynamic lubrication.
The load carried by a tilted slider, which is the integral of the pressure over the slider plane, is expressed as [
17]
where
W: applied load (N);
hi, ho: film thickness at the inlet and outlet edges of slider, respectively (m);
U: sliding speed (m/s);
η: viscosity (Pa s);
B, L: breadth and length of the slider (m), respectively.
A non-dimensional parameter that includes inclination and film thickness is defined as the convergence ratio:
As illustrated in
Figure 5, the effects of inlet texturing are functions of inclination and film thickness. To give a comprehensive view, Equation (2) is substituted into Equation (1) to produce
Equation (3) is the analytical relation of the two non-dimensional terms, and K. The non-dimensional load-carrying capacity, , can also be experimentally obtained from the measured film thickness for a given applied load. The inclination of the slider can be obtained from the number of fringes on the interferogram of the slider. Thus, the film thickness at the inlet, , can be calculated once is detected.
Different sets of experiments were conducted with the inlet-textured slider under various operating conditions. Similar tests were also conducted with the plain slider for comparison. All film thickness measurements were converted to
using Equation (1) and are plotted against
K in
Figure 6. Theoretical
–
K curves of finite (
L/
B = 1.5) and infinite (
L/
B = ∞) length are also plotted in the figure. The load-carrying capacity of the finite-length slider is smaller than that of an infinite-length slider owing to the side leakage in the finite-length slider, as would be expected. The experimental results of the plain slider show very good agreement with the analytical solutions (
L/
B = 1.5) for a wide range of
K, which eliminates any thermal effect in the current study. For the textured slider, the results can be separated into two parts. When
K is less than 1.5, there is almost no difference in measured load-carrying capacity with or without texture, which means the texture plays almost no role in affecting the load-carrying capacity when the film thickness is high enough. However, the textured slider yields a higher load-carrying capacity than that of the non-textured slider when
K is greater than 1.5. The effect of the inlet texture as proposed by Tonder [
6,
7] is demonstrated. As illustrated in Equation (2), a smaller
h0 yields a greater
K. Thus, the effect is particularly significant when the film thickness is small.
