Article

High-Speed Measurements of Steel–Ice Friction: Experiment vs. Calculation

1
Fraunhofer IWM MikroTribologie Centrum, Rintheimer Querallee 2a , 76131 Karlsruhe, Germany
2
CNR-Istituto Nanoscienze S3, Dipartimento di Scienze Fisiche, Università di Modena e Reggio Emilia, Informatiche e Matematiche Via Campi, 213/a, 41125 Modena, Italy
*
Author to whom correspondence should be addressed.
Lubricants 2018, 6(1), 26; https://doi.org/10.3390/lubricants6010026
Submission received: 6 February 2018 / Revised: 2 March 2018 / Accepted: 4 March 2018 / Published: 9 March 2018

Abstract

:
An ultra-thin water film plays the decisive role in steel–ice friction in bobsleighing. The water film has a thickness on the order of nanometers and results from the superposition of an existing quasi-liquid layer and additional surface water generated by frictional heat. When friction is measured as function of sliding velocity, the coefficients decrease according to the typical Stribeck behavior. However, for highest sliding velocities, it is still unknown whether friction decreases further or shows an increase due to viscous drag. Both tendencies are essential for the construction of safe bobsleighs and bobsleigh tracks. This contribution presents results of high-speed experiments up to 240 km/h for a steel slider on a disk of ice at different ice temperatures. In addition, using the friction model of Makkonen, friction coefficients were calculated as function of sliding velocity and ice temperature. The significant correlation between experimental results and model calculation supports the model conception of frictional melting and viscous shearing.

1. Introduction

Modern bobsleigh tracks as the one at Pyeongchangs Alpensia Sliding Centre allow velocities up to 140 km/h. The main concern of track designers is to provide the spectators with a thrilling race and the athletes with a safe track. It is therefore extremely important for track designers to possess highly-reliable friction data as input to their track simulation programs [1]. The measurement of steel–ice friction directly inside a track is an almost impossible undertaking, due to strong vibrations generated by the contact of runner and ice. The number of experiments in the past dealing with friction measurements for the system steel versus ice, especially for high sliding velocities is limited [2,3]. Most of the data were obtained with tribometers (e.g., [4,5]) or special devices (e.g., [2,6]). Friction of steel on ice is dominated by the formation of a melt water film due to frictional heating. The basic mechanisms are well described in [7]. Therefore, the main influencing parameters are temperature, speed and normal force as well as the thermal contact situation, defined by contact area, roughness and thermal conductivity. Marmo et al. measured steel–ice friction as a function of ice temperature at low velocities and received coefficients of friction between 0.15 and 0.06 with increasing temperature [8]. Normal force was varied by Ovaska and Tuononen in the contact between a skate blade and an ice track resulting in friction values decreasing from 0.014 to 0.006 with increasing load [9]. The influence of roughness on steel–ice friction was investigated by Spagni et al., showing that the resulting coefficient of friction is dependent on the friction regime and can have values between 0.08 and 0.02 in a broad temperature range [10]. Because of the relation of our study to the sport of bobsleighing, we confine the review to experiments at high sliding velocities in the next paragraph.
De Koning et al. analyzed ice skates and measured mean coefficients of friction for straights and curves of 0.0046 and 0.0059, respectively [11]. Similar results were obtained by Federolf and co-workers [12]. Poirier published friction data for the bobsled derived on the base of precise speed measurements by radar [13]. Averaging high and low speed data, a mean coefficient of friction of 0.0053 was obtained. A summary of all available friction data can be found in [1] showing that, for sliding velocities up to 5 m/s, friction exhibits a drastic decrease from 0.06 for quasi-static conditions to 0.015 at 5 m/s. Higher sliding velocities change the friction behavior to an almost linear decrease down to 0.005 at 33 m/s. Sliding velocities higher than 33 m/s are not reported in literature, thus the question of a further friction decrease or an increase in friction due to the action of hydrodynamics cannot be answered yet. In an attempt to reduce the lack of experimental friction data at high velocities, we performed friction experiments under well-controlled conditions on a model system at three different temperatures. The work is supplemented by calculating coefficients of friction using the latest ice friction model.
The following section explains the experimental setup as well as steel sample and ice preparation. In addition to the experiments, the basics of ice friction calculations are given. The experimental section provides high-speed friction data and the numerical section shows computed friction data.

2. Materials and Methods

In this section, the applied test methods, sample materials and calculation details will be given.

2.1. Ice Tribometry-Setup, Materials and Test Program
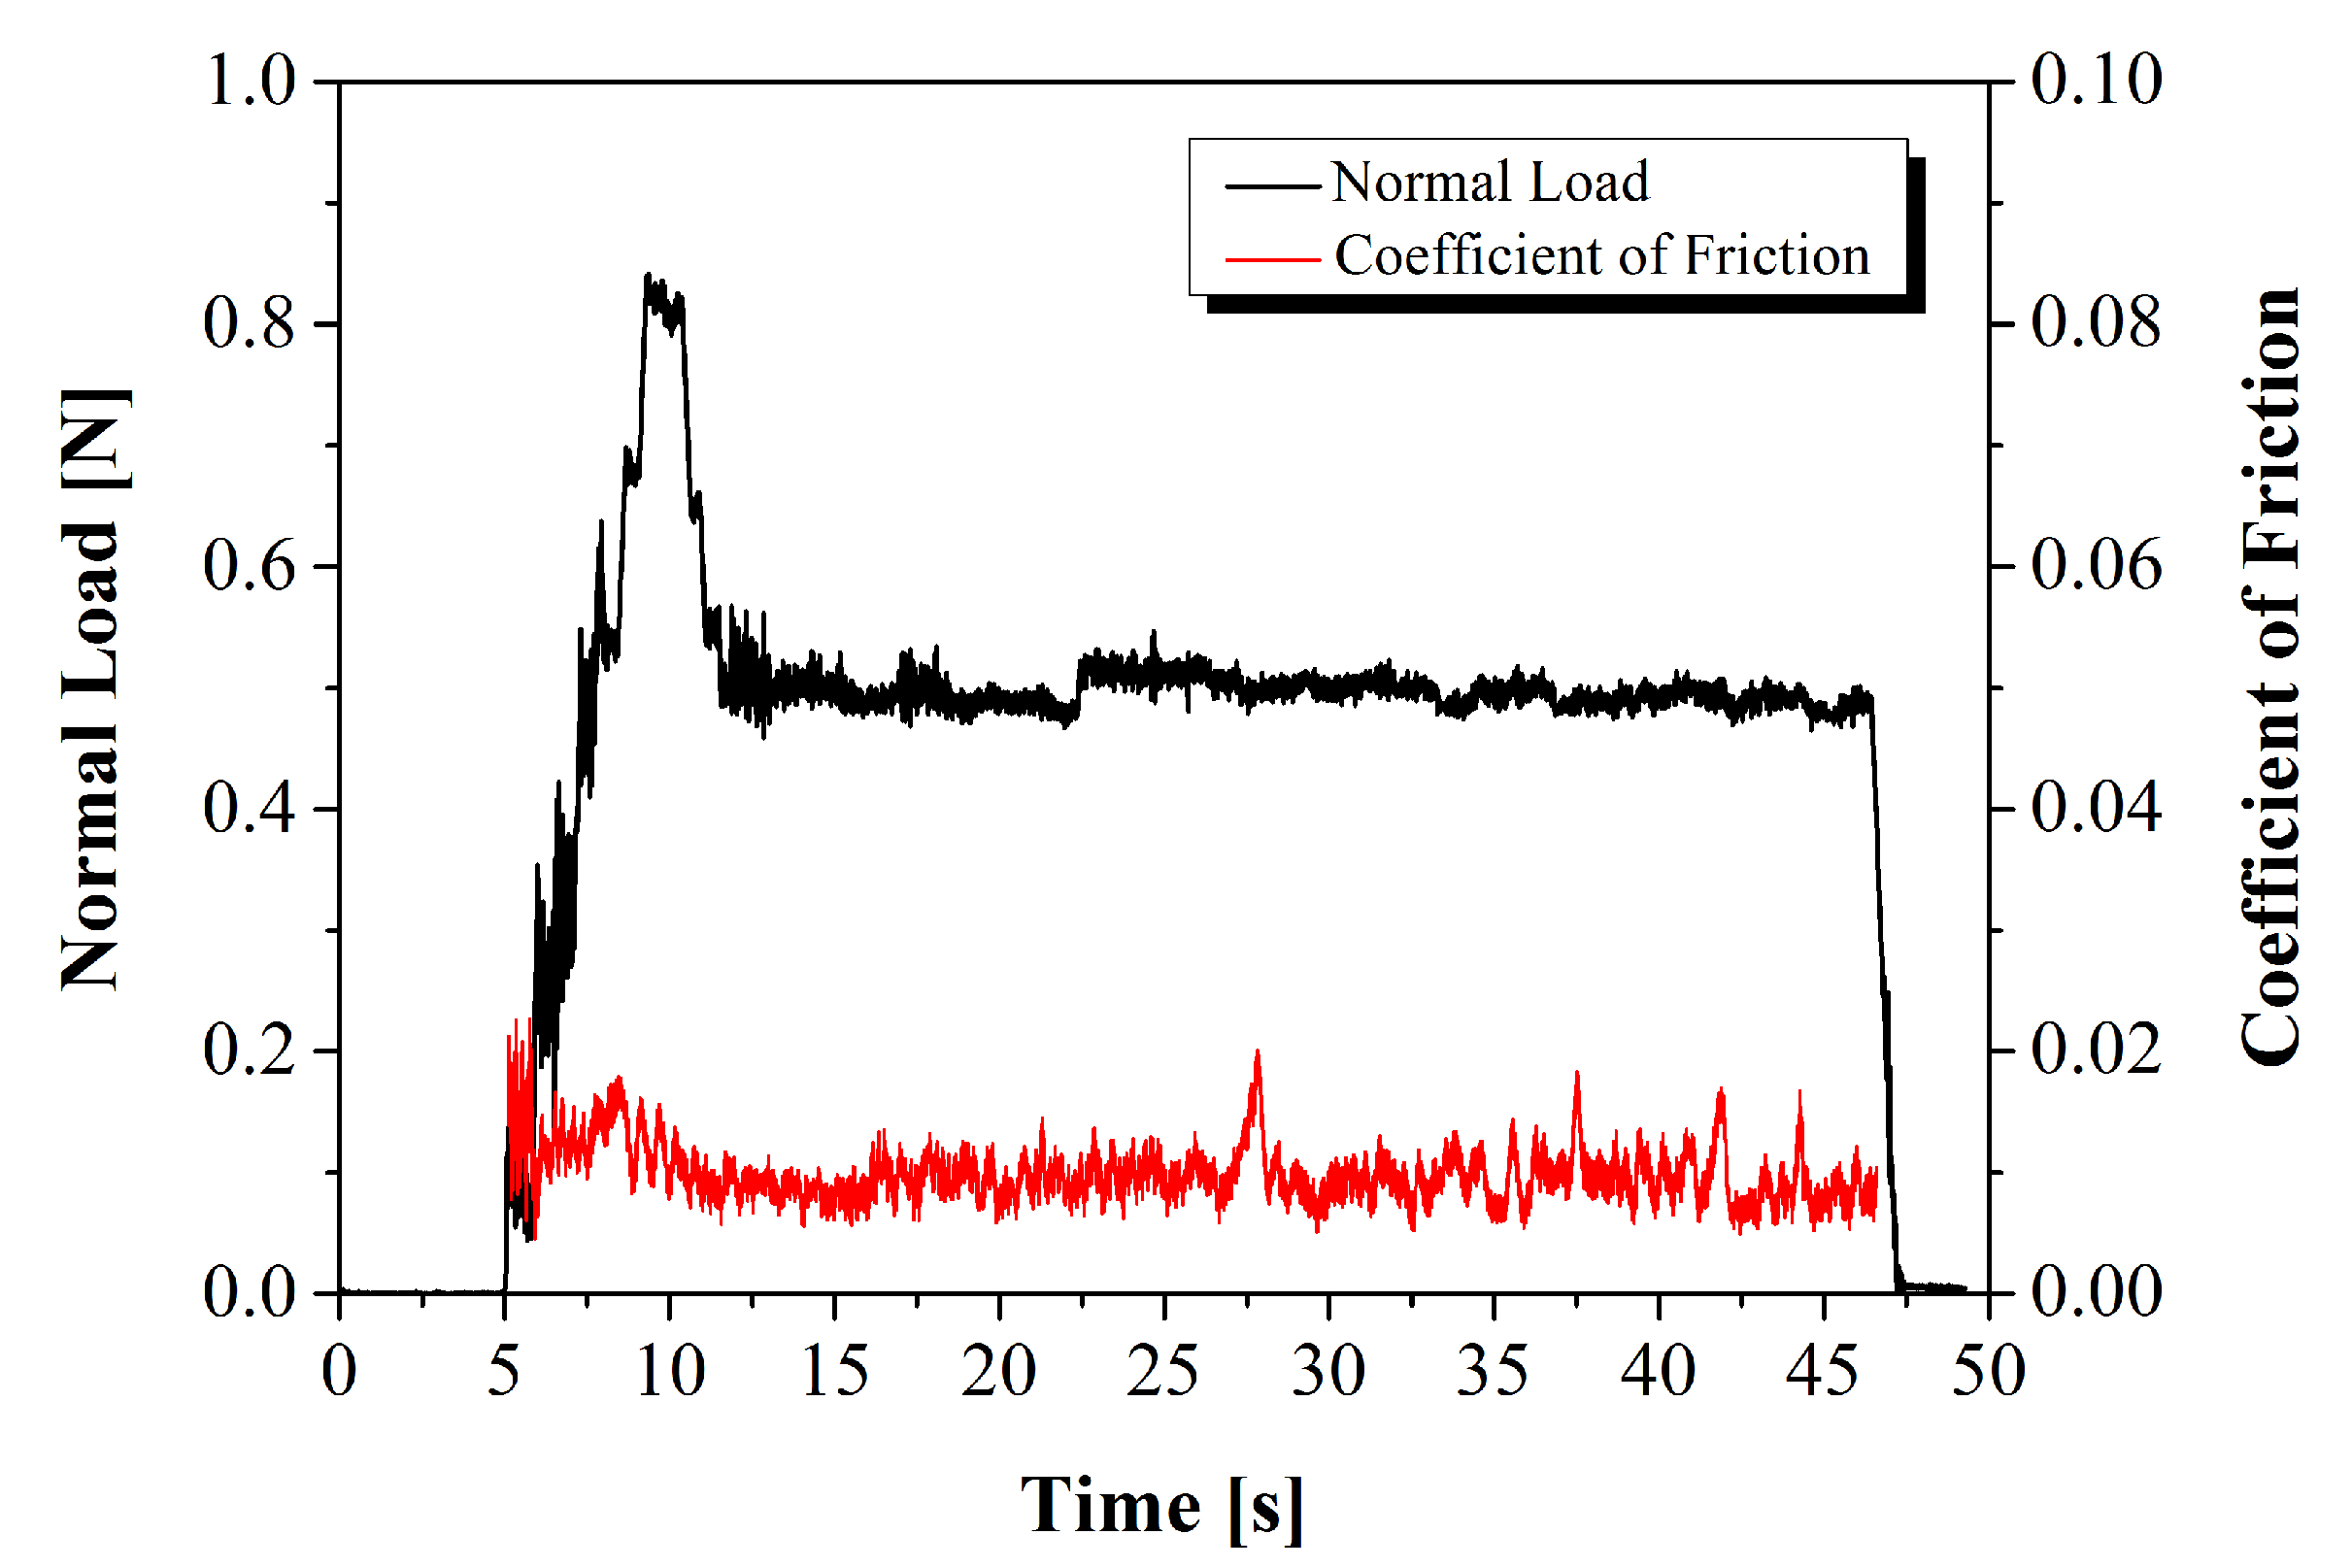
2.1.1. Tribometry

A custom-made pin-on-disk type microtribometer was used to measure friction between a circular steel pin (∅ = 3 mm) made of steel with material number 1.4057 (ASTM 321) and a 3 cm ice disk. The microtribometer employs a combination of high-speed drive for rotational motion, a vertical drive to lower the steel sample onto the ice and to apply the normal force and a force transducer to resolve friction forces in the mN range. The normal force was set to 500 mN resulting in a contact pressure of 0.07 MPa. The pressure was selected rather low (with respect to the acting pressure between a bobsled runner and the ice) in order to exclude ice fracture.
During each test, the sliding speed was increased stepwise from 1 to 65 m/s. Increasing sliding speed was chosen in order to receive a gradual build-up of the lubricating water film due to melting ice. The pin was lifted at each velocity change, in order to avoid excessive mechanical stimulation due to acceleration. Being attached to a flattened sphere, which is free to rotate around a small angle, the pin is able to self-adjust its position on the ice surface. This system guarantees the reproducibility of the contact despite the relatively low normal force and the strong excitations due to high speed. The sliding speed steps and all of the other testing parameters are reported in Table 1. During the test, the ice temperature T i c e was kept constant. The temperature was fixed before every test at a value between −17 and −6 ° C .
The high sliding speed induces mechanical noise that tends to cover the friction signal. With an applied normal force of 500 mN and an expected friction force of 5 to 10 mN, the reported noise caused a very bad signal to noise ratio. The problem was solved by filtering the data, taking the average of 10 points. This filter (which does not modify in a relevant way the friction force signal) reduced the amplitude of noise by a factor of 8 to 9.

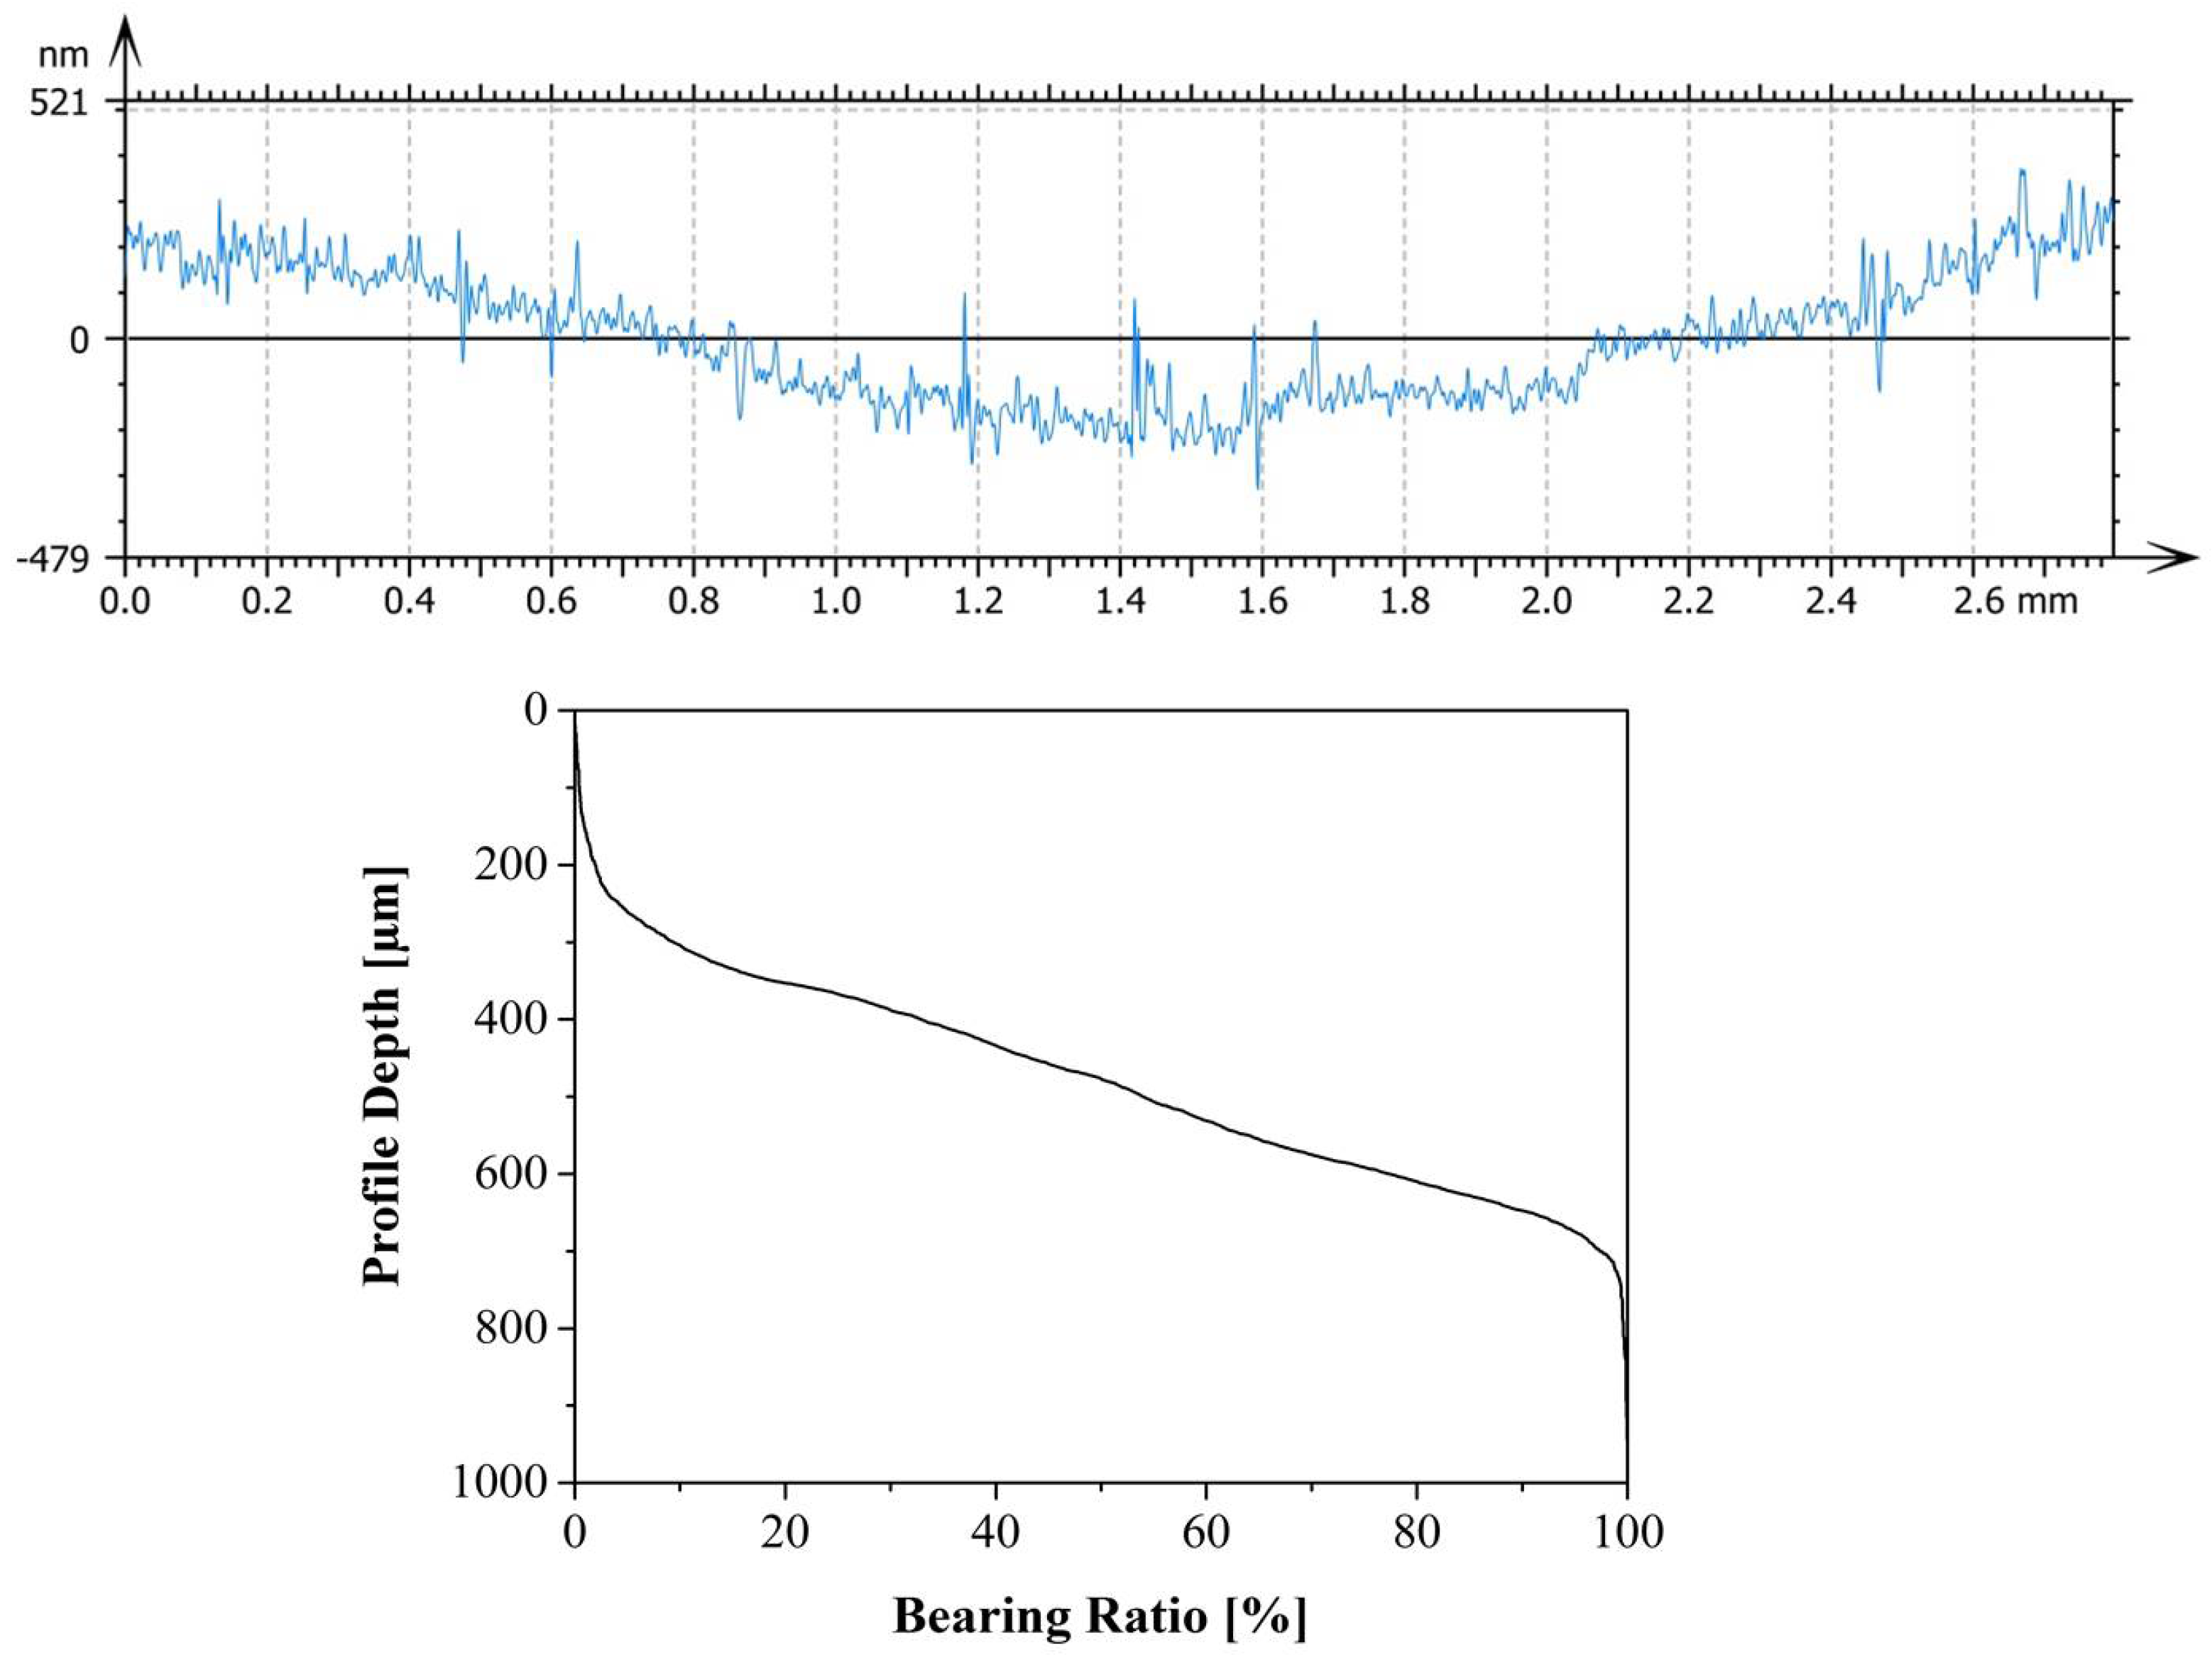
2.1.2. Ice and Steel Sample Preparation

The ice disk has a diameter of 3 cm, with a thickness of nearly 7–8 mm, and a total volume of about 5 mL. The preparation procedure of the ice sample guarantees the best regularity and reproducibility of the surface structure. Distilled water was left degassing for 2 h, at a pressure lower than 20 mbar before freezing. In addition, 5 mL of this water are then injected into a small metal holder, sealed into a cup filled with nitrogen. This cup is then put into a freezer unit, where the water freezes at T = - 20   ° C . This procedure ensures that the degassed water never gets in contact with the external atmosphere inhibiting the formation of air bubbles. Unfortunately, the surface of the ice produced with this recipe was extremely irregular. This problem was solved by shaving the ice surface via a heated metal blade. During the flattening process, the ice disk rotates at a speed of 5000 rpm and the heated blade is progressively lowered onto the ice surface. The flattening is performed directly in the tribometer chamber. An endoscopic camera allows a good view of the system during operation.
The steel pin used for the tests described in this work has a diameter of 3 mm and was finished with a specific surface roughness. The surface was characterized with confocal microscopy over an area of 0.4 × 2.8 mm2. An exemplary cross section and the related bearing ratio curve are shown in Figure 1.
The pin exhibits a curvature on its surface with a radius of 1.9 m. Three cross-sectional profiles were analyzed to determine the roughness parameters (Table 2).

2.1.3. Test Program

Figure 2 shows an example of a step at constant speed during a friction measurement. The normal force is initially taken to 0.8 N instead of 0.5 N. An initial higher pressure guarantees a good alignment between the pin and the ice surface. The load is then decreased to 0.5 N and the test runs for 30 s. The values of the coefficient of friction for each tested speed are obtained averaging the values acquired during those 30 s.

2.2. Basics of Friction Calculation

In this study, the friction model of Makkonen and Tikanmäki (MT model) [14] is applied, referring to the work of Oksanen and Keinonen (OK model) [15]. In the following, the basic principles of the model conception will be presented and we refer to [7,14] for the detailed derivation.
The OK model already considered the coupling between the viscous shearing and the heat conduction through the interface. The MT model represents a substantially extended description of the mechanical contact by taking into account the material hardness of both bodies involved (the slider and the ice). Regarding a sliding body on an ice surface close to the melting point, the frictional heat generates a lubricating water film by melting the ice. The sliding body, i.e., the pin, has the geometry as introduced above. The friction force is given through the classical definition by Bowden and Tabor, depending on the shear stress between the bodies and on the contact area. Following the assumption of hydrodynamic shearing for the lubricated contact, an expression for the resulting coefficient of friction was obtained:
μ = 1 a H 1 2 2 v ( Δ T 1 λ 1 c 1 ρ 1 + Δ T 2 λ 2 c 2 ρ 2 ) + 1 8 v ( Δ T 1 λ 1 c 1 ρ 1 + Δ T 2 λ 2 c 2 ρ 2 ) 2 + η v ρ L .
H denotes ice hardness, and a is the contact width. Δ T represents the temperature difference between the contact and the bulk temperature of the friction bodies. The thermal conductivity λ , the specific heat capacity c and the density ρ are needed to estimate the amount of conducted heat. L is the latent heat of ice melting. η is the viscosity of water and v is the sliding velocity. For the application of Equation (1) to the steel pin, parameter a has to be assigned with an appropriate value. This topic will be addressed in the Section 3.2.

3. Results

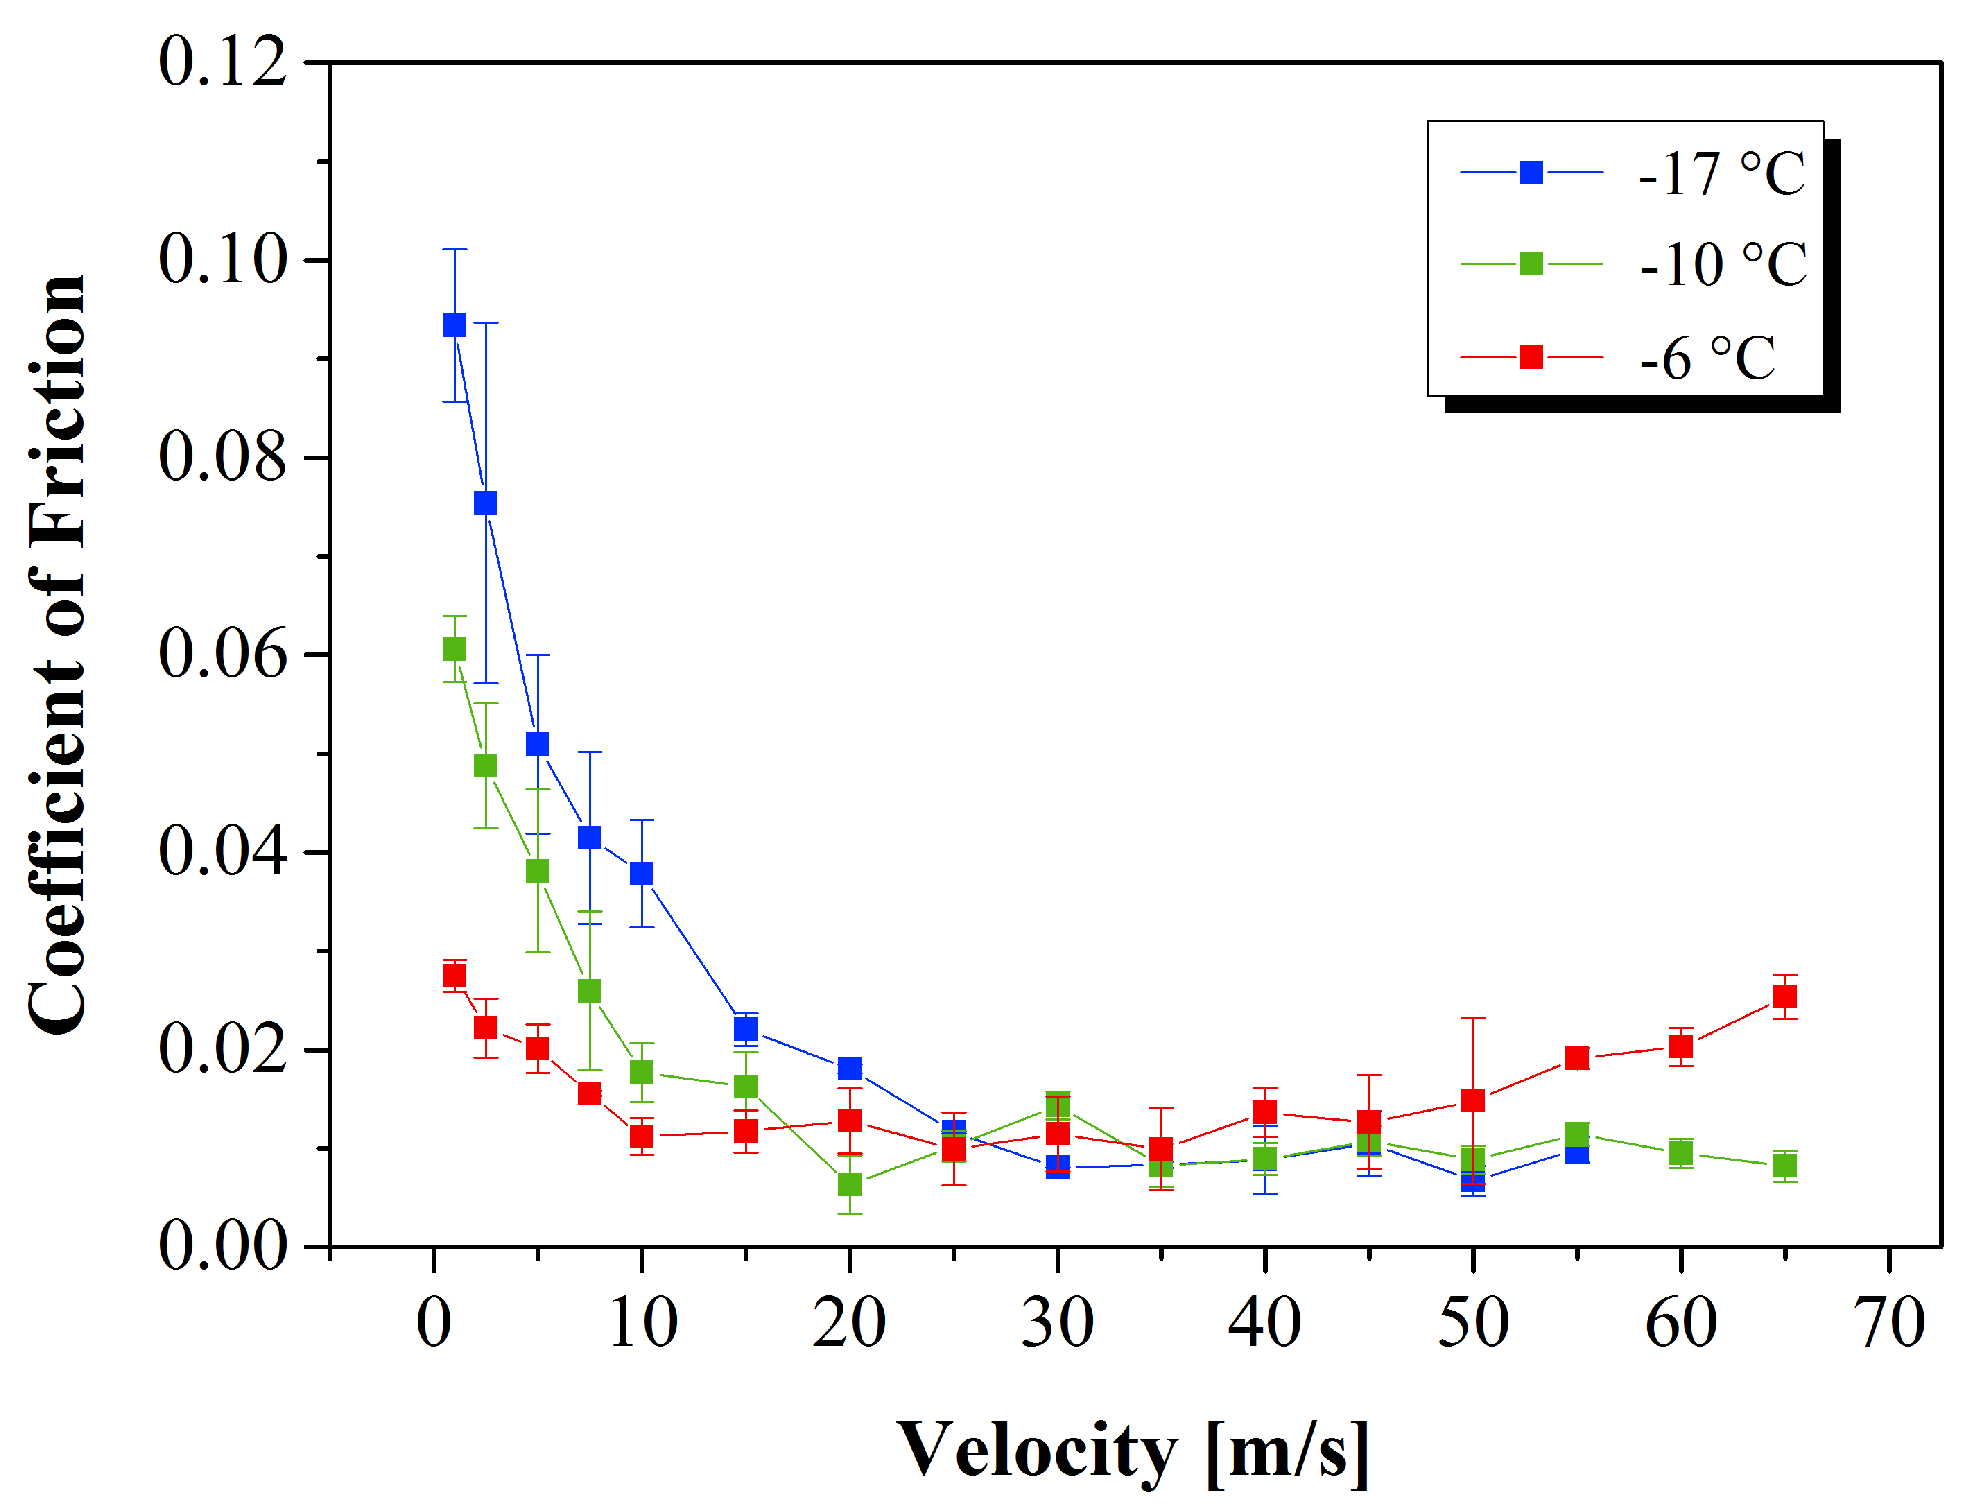
3.1. Friction Measurements
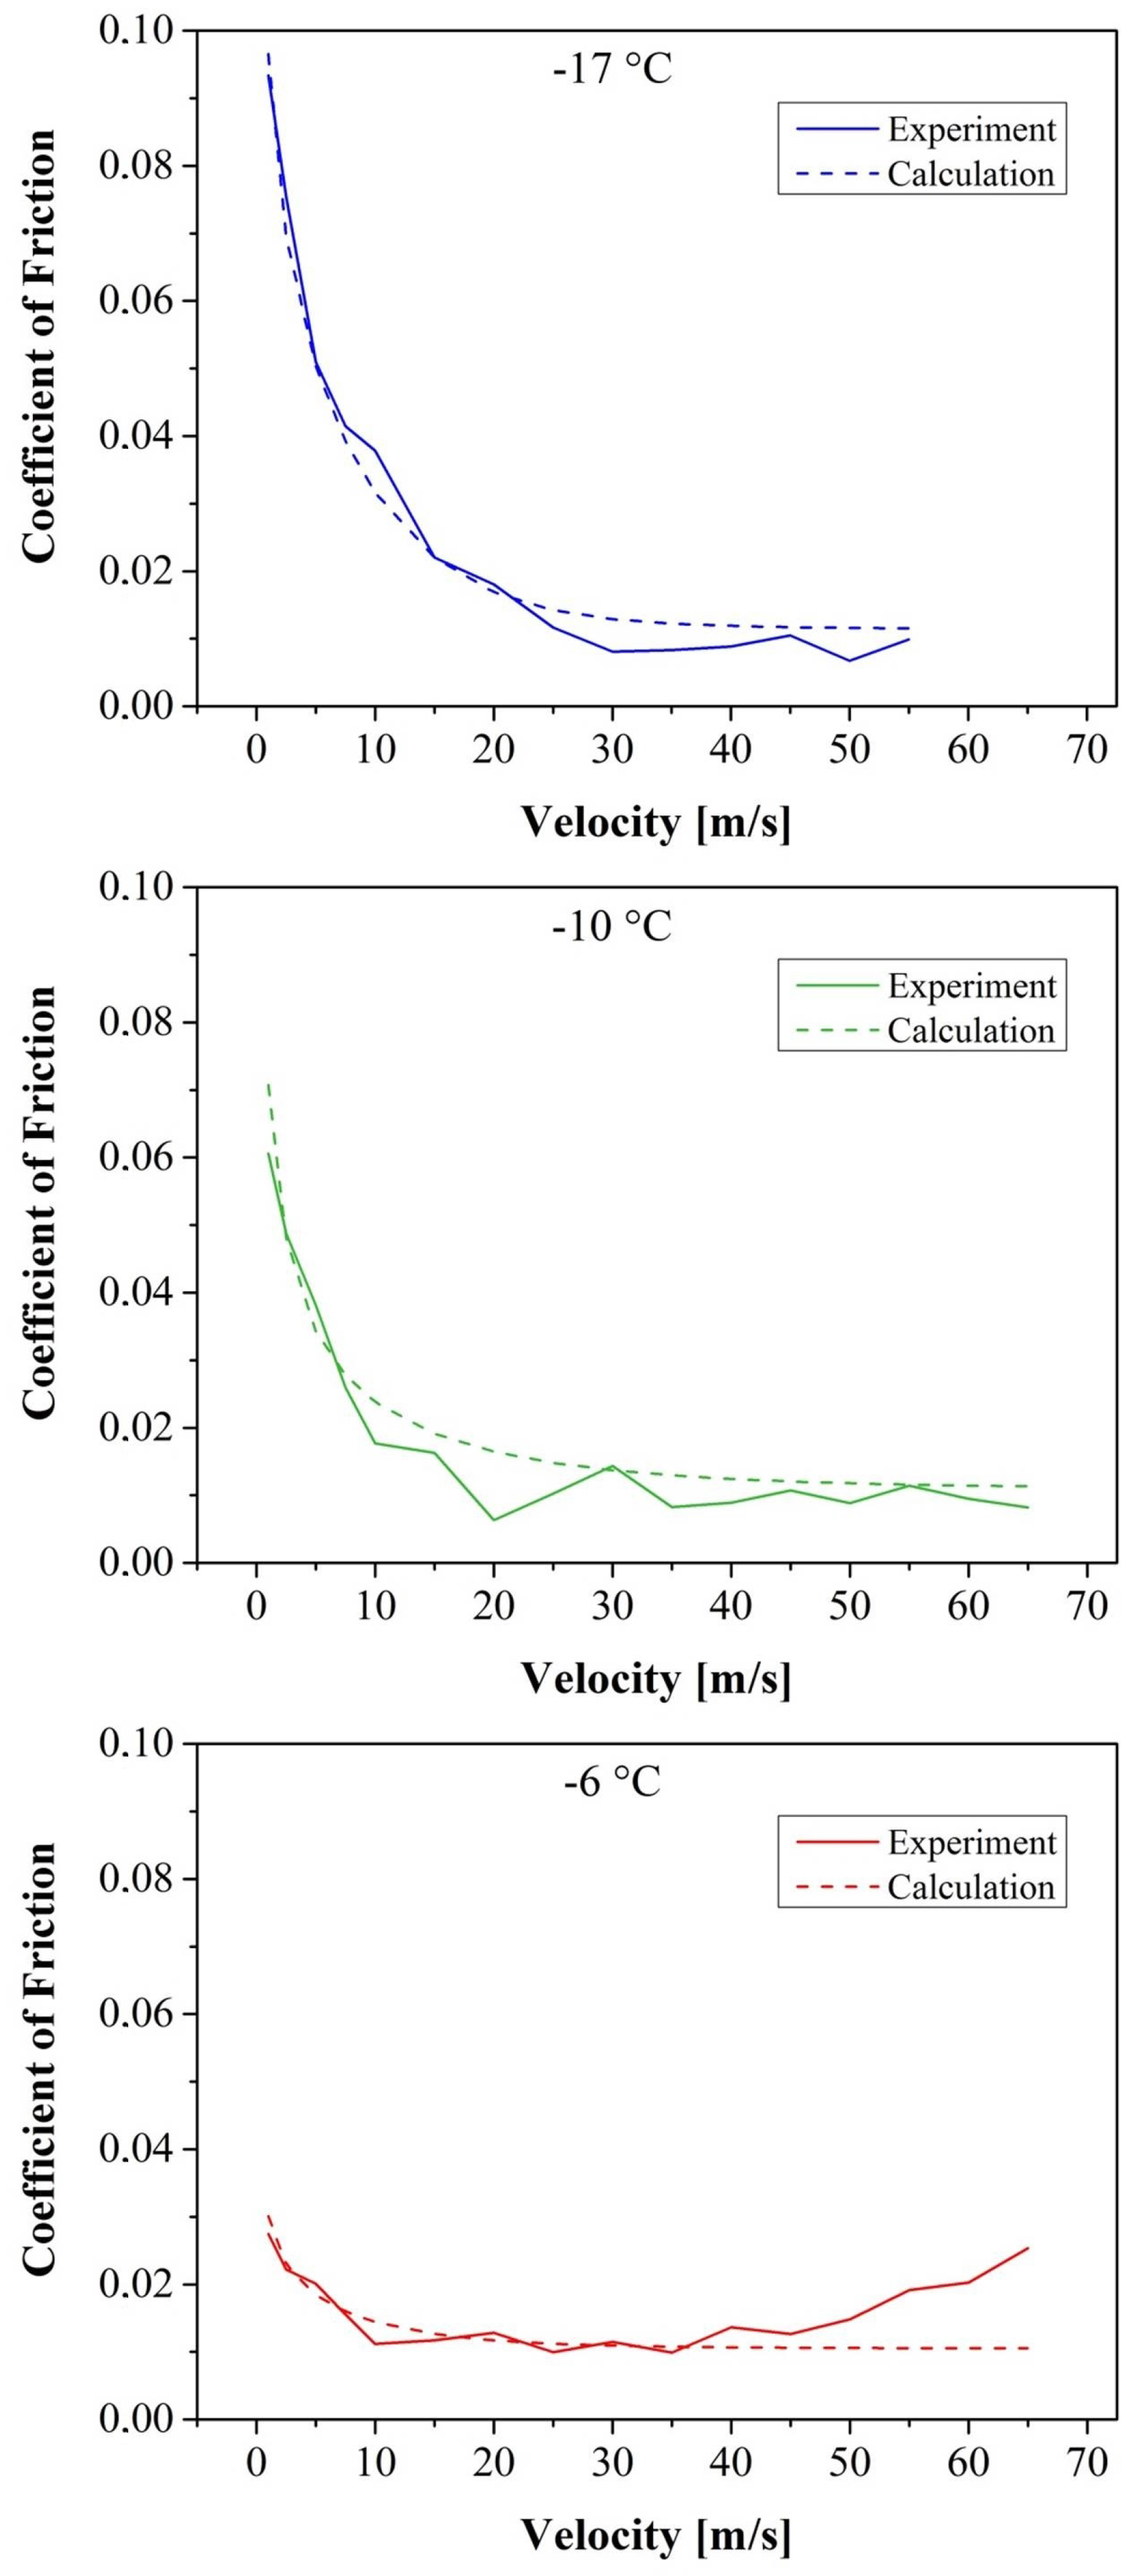
All measured coefficients of friction are shown in Figure 3. Each data point building the graph represents the average of two different tests, performed under the same conditions on a newly prepared ice surface. The starting points of the graphs are 0.03, 0.06 and 0.09 according to the ice temperature. Warmer ice results in lower initial coefficients of friction. All graphs show a decrease of the coefficient of friction between 1 and 25 m/s. With the exception of T i c e = - 6 ° C , the coefficient of friction maintains a quite stable behavior around μ = 0 . 01 for the rest of the velocity range. The lowest friction coefficients of about 0.008 occur between 20 and 55 m/s mainly for an ice temperature of −10 and −17 ° C .
For an ice temperature of −6 ° C , the graph shows an increase in friction for higher sliding velocities.

3.2. Calculations

For the calculation of the coefficient of friction, the appropriate data for thermal conductivity, specific heat capacity and density were supplied as shown in Table 3. The ice hardness was obtained according to
H = 3.75 5.625 × T i c e ( ° C ) 1 .
The topography analysis revealed that the pin surface has a concave shape on a submicron scale. Due to this fact, only a fraction of the pin surface carries the initial load. In addition, an increase of the contact area and subsequently of contact width a will take place with increasing velocity due to the thicker melt water film. Taking these points into consideration, a fit function for a was applied, respecting an increasing melting and wetting of the surface profile with increasing velocity. A sigmoidal fit similar to the bearing ratio curve of the profile was chosen for that purpose with the assumption that a cannot exceed the pin diameter of 3 mm. Figure 4 shows the comparison between experimentally gained and calculated coefficients of friction for all three ice temperatures.
The characteristics of the friction behavior is very well reproduced by the model calculations. For all three temperatures (at −6 ° C up to 35 m/s), Pearson correlation coefficients of 0.97 up to 0.99 at very high significance are achieved. Deviations from the experiment can be found at T i c e = −6 ° C beginning from 40 m/s on, where experimental μ tends to increase differing from the stable coefficient of friction received by model calculation.

4. Discussion

The finding of the significant correlation of experimental data and model calculation allows the statement that the model very well reflects the mechanisms of the real friction process. Therefore, the gliding of the steel pin on the ice surface is dominated by the frictional heat generated and the formation of a lubricating melt water film. The velocity increase as well as the temperature increase leads to an increased melt water production, which is lubricating the contact. The effect of friction reduction is more distinct for lower sliding velocities where the melt water film thickness is in the range of Ångstroms, and an increased water film thickness improves the friction conditions remarkably. A detailed description of the model and the friction mechanisms can be found in [7]. In addition, the assumption of an increasing contact width was confirmed by the good correlation of experimental data and calculation.
The following discussion therefore concentrates on the deviations between calculation and experiment. The most significant differences became evident for warmest ice at T i c e = −6 ° C . One of the reasons for the deviations is the fact that the calculation is based on constant values of thermal conductivity, specific heat capacity and density of ice and steel. Only for the thermal conductivity of ice, the expression from [16] was used. The other reason for the deviations was caused by the type of experimental setup. In the present study, the pin slides on a rotating disk. This means that the pin crosses the ice periodically with increasing frequency for higher sliding velocities. The warmer the ice is, the more surface water is generated by frictional heat. With increasing sliding velocity, the ice disk has less time to cool, thus there might be an accumulation of surface water. We therefore treat the increase of friction at T i c e = −6 ° C as the result of that accumulation.
In contrast to the measurement of De Koning and Poirier, our experiment and calculation did not result in coefficients of friction less than 0.008. We attribute this behavior to the type of steel used for the pin. This type of steel obviously has a different thermal conductivity and specific heat compared with steel used for skates and bobsleigh runners. However, this explanation must be proven by further experiments.
The validity of the model crucially depends on the correct values of ice hardness. In the model approach shown here, ice hardness equilibrates the acting pressure in normal direction. Equation (2) shows that H has no dependency on normal force, which is necessary to compute the coefficient of friction not only for straights but for curves of a bobsleigh track as well. Further refinements of the model are therefore necessary.

5. Conclusions

With respect to results and discussion, the following conclusions can be drawn:
  • Coefficients of friction between steel and ice were successfully measured up to high velocities of 240 km/h by means of a custom-built tribometer.
  • Using the model of Makkonen et al., friction coefficients of the steel–ice interface can be calculated with very good precision. The model is ready to be implemented into modern calculation tools of bobsleigh track designers.
  • For highest sliding velocities, the coefficients of friction do not become lower than 0.008.

Author Contributions

Matthias Scherge, Roman Böttcher and Diego Marchetto conceived the experiments, which were designed and performed by Alberto Spagni at Fraunhofer IWM in Karlsruhe. The paper was written by Matthias Scherge and Roman Böttcher.

Conflicts of Interest

The authors declare no conflict of interest.

References

  1. Scherge, M.; Böttcher, R.; Richter, M.; Gurgel, U. High-Speed Ice Friction Experiments under Lab Conditions: On the Influence of Speed and Normal Force. ISRN Tribol. 2013, 2013, 1–7. [Google Scholar] [CrossRef]
  2. Itagaki, K.; Huber, N.P.; Lemieux, G.E. Dynamic Friction of a Metal Runner on Ice; CRREL Report; 1989. [Google Scholar]
  3. Penny, A.; Lozowski, E.; Forest, T.; Fong, C.; Maw, S.; Montgomery, P.; Sinha, N. Speedskate ice friction: Review and numerical model - FAST 1.0. In Physics and Chemistry of Ice; Kuhs, W.F., Ed.; The Royal Society of Chemistry: Cambridge, UK, 2007; pp. 495–502. [Google Scholar]
  4. Dumm, M.; Hainzlmaier, C.; Boerboom, S.; Wintermantel, E. The Effect of Pressure on Friction of Steel and Ice and Implementation to Bobsleigh Runners. In The Engineering of Sport 6; Springer: New York, NY, USA, 2006; pp. 103–106. [Google Scholar]
  5. Mills, A. The coefficient of friction, particularly of ice. Phys. Educ. 2008, 43, 392. [Google Scholar] [CrossRef]
  6. Kobayashi, T. Studies of the properties of ice in speed-skating rinks. ASHRAE J. 1973, 15, 51–56. [Google Scholar]
  7. Böttcher, R.; Seidelmann, M.; Scherge, M. Sliding of UHMWPE on ice: Experiment vs. modeling. Cold Reg. Sci. Technol. 2017, 141, 171–180. [Google Scholar] [CrossRef]
  8. Marmo, B.A.; Blackford, J.R.; Jeffree, C.E. Ice friction, wear features and their dependence on sliding velocity and temperature. J. Glaciol. 2005, 51, 391–398. [Google Scholar] [CrossRef]
  9. Ovaska, M.; Tuononen, A.J. Multiscale imaging of wear tracks in ice skate friction. Tribol. Int. 2018, 121, 280–286. [Google Scholar]
  10. Spagni, A.; Berardo, A.; Marchetto, D.; Gualtieri, E.; Pugno, N.M.; Valeri, S. Friction of rough surfaces on ice: Experiments and modeling. Wear 2016, 368–369, 258–266. [Google Scholar] [CrossRef]
  11. De Koning, J.J.; de Groot, G.; van Ingen Schenau, G.J. Ice friction during speed skating. J. Biomech. 1992, 25, 565–571. [Google Scholar] [CrossRef]
  12. Federolf, P.A.; Mills, R.; Nigg, B. Ice friction of flared ice hockey skate blades. J. Sports Sci. 2008, 26, 1201–1208. [Google Scholar] [CrossRef] [PubMed]
  13. Poirier, L. Ice Friction in the Sport of Bobsleigh. Ph.D. Thesis, University of Calgary, Calgary, AB, Canada, 2011. [Google Scholar]
  14. Makkonen, L.; Tikanmäki, M. Modeling the friction of ice. Cold Reg. Sci. Technol. 2014, 102, 84–93. [Google Scholar] [CrossRef]
  15. Oksanen, P.; Keinonen, J. The mechanism of friction of ice. Wear 1982, 78, 315–324. [Google Scholar] [CrossRef]
  16. Yen, Y.C. Review of thermal properties of snow, ice and sea ice. Cold Reg. Res. Eng. Lab. 1981, 81, 1–27. [Google Scholar]
Figure 1. Cross-sectional profile and bearing ratio.
Lubricants 06 00026 g001
Figure 2. Test program.
Lubricants 06 00026 g002
Figure 3. Experimentally obtained dependence of the coefficient of friction (CoF) on the sliding velocity.
Lubricants 06 00026 g003
Figure 4. Coefficient of friction from experiment and model calculation in dependance on the sliding velocity for different ice temperatures.
Lubricants 06 00026 g004
Table 1. Summary of experimental conditions used for the high-velocity tribological tests.
EntityUnitValue
temperatures ° C −17 / −10 / −6
velocitiesm/s1 / 2.5 / 5 / 7.5 / 10 / 15 / 20 / 25 / 30 / 35 / 40 / 45
50 / 55 / 60 / 65
applied loadmN500
average track radiusmm7.5
pin diametermm3
nominal pressureMPa0.07
step durations30
Table 2. Roughness parameters for the slider: average roughness ( R a ), root mean square ( R q ), skewness ( R s k ), kurtosis ( R k u ).
R a (nm) R q (nm)RskRku
33.8 ± 3.7247.37 ± 5.510.61 ± 0.717.12 ± 1.08
Table 3. Thermal conductivity, specific heat capacity and density of ice and steel.
UnitIceSteel
thermal conductivityW/m/K 9.828 × e ( 0.0057 × T i c e × K 1 ) 55
specific heatJ/kg/K1962460
density at T i c e = −20  ° C kg/m3919.77900

