Article

Material Characterization and Influence of Sliding Speed and Pressure on Friction and Wear Behavior of Self-Lubricating Bearing Materials for Hydropower Applications

1
Division of Machine Elements, Luleå University of Technology, 971 87 Luleå, Sweden
2
Division of Chemical Engineering, Luleå University of Technology, 971 87 Luleå, Sweden
3
Division of Fluid and Experimental Mechanics, Luleå University of Technology, 971 87 Luleå, Sweden
4
Division of Chemistry of Interfaces, Luleå University of Technology, 971 87 Luleå, Sweden
5
ALS Laboratory Group, ALS Scandinavia AB, Aurorum 10, 977 75 Luleå, Sweden
*
Author to whom correspondence should be addressed.
Lubricants 2018, 6(2), 39; https://doi.org/10.3390/lubricants6020039
Submission received: 16 March 2018 / Revised: 16 April 2018 / Accepted: 20 April 2018 / Published: 24 April 2018

Abstract

:
Nowadays, hydropower plants are forced to have more frequent power control and the self-lubricated bearings used in the applications are one of the most critical components affected by the continuously changing operating conditions. In this study, microstructure and composition of two commercially available bearing materials (Orkot TXM Marine and Thordon ThorPlas) used in hydropower turbines were studied. In addition, the influence of sliding speed and applied pressure on the friction and wear behavior of the materials was investigated systematically for dry sliding conditions. The bearing materials were characterized using X-ray microtomography, Nuclear Magnetic Resonance (NMR) spectroscopy and Inductively Coupled Plasma–Sector Field Mass Spectrometry (ICP-SFMS) techniques. Friction and wear tests were carried out with a polymer pin sliding against a stainless steel (SS2333) plate with a linear reciprocating motion. Test conditions were: room temperature, 9–28 MPa pressure and 10–40 mm/s sliding speed ranges. Surface analysis of the polymer pins and the wear tracks were performed by optical profilometry, Scanning Electron Microscope (SEM) and Energy Dispersive Spectroscopy (EDS) techniques. Test results show that, for both materials, the coefficient of friction (COF) is decreasing at higher pressures. Surface analysis reveals higher concentrations of solid lubricants in the transfer layers formed at higher pressures, explaining the decrease in COF. Furthermore, the specific wear rate coefficients are increasing at higher sliding speeds, especially at lower pressures. Results of this study demonstrate that, under dry sliding conditions, changes in sliding speed and pressure have a significant influence on the tribological behavior of these bearing materials.

Graphical Abstract

1. Introduction

The use of renewable energy has increased dramatically over the last few years due to increased environmental awareness, technological developments as well as tougher legislation and political decisions resulting in higher costs of energy production from fossil sources. However, as most of these energy sources (e.g., wind or solar power) are intermittent in nature, with unpredictable output, including them in existing power grids puts extra pressure on hydropower to actively control the power output. Consequently, the self-lubricated bearings used to control the turbine blades and the guide vanes are one of the most critical components affected. These boundary lubricated bearings often experience extreme working conditions as they operate at high pressures, low sliding speeds and small oscillatory movements. It has been reported that the increased control (shift from water level control to primary control) multiplies the number of load cycles and hence can lead to a reduction of the useful life of the bearings by a factor of about 20 [1].
In spite of the severity of the issue and additional maintenance and/or replacement costs involved, only a limited number of studies dealing with wear and friction behavior of commercially available self-lubricating polymer composite bearing materials used for hydropower applications has been reported [2,3,4,5,6]. Jones et al. [2] presented an extensive work, studying coefficients of friction and wear rates in both wet and dry conditions and proposed a rating system for several bearing materials. Gawarkiewicz and Wasilczuk [3] evaluated wear rates of four bearing materials under conditions simulating guide vane bearing operation. However, these two studies did not evaluate the influence of sliding speed and pressure. Moreover, due to a rapid development of the existing and new bearing materials for hydropower applications, some of these results are no longer relevant.
Based on experience from the Swedish hydropower market, two of the currently most commonly used materials for hydropower applications are Thordon ThorPlas Blue (ThorPlas) and Orkot TXM Marine (Orkot). The effect of pressure on ThorPlas bearing material has previously been investigated for higher pressures (between 45 and 90 MPa) with a maximum sliding speed of 5.4 mm/s. The test conditions were dry with air cooling of the shaft and bearing and the test was performed using a test rig that simulates the wicket gate bearing operation in hydro turbines with a major observation being a decrease in coefficient of friction with increased pressure [4]. However, both the experimental setup and the test procedure were not reported in sufficient detail and the effect of sliding speed was not studied. Ando and Sukumaran [5] studied the tribological behavior of Orkot for various loads (corresponding to maximum pressures between 77 and 143 MPa) and two sliding speeds (10 and 700 rpm). They found that the friction force increase rate is much more sensitive to high speed and that the friction force has a tendency towards linear increase at higher loads. Sukumaran et al. [6] also studied the effect of sliding speed, 10 to 700 rpm, for nominal contact pressures of both 77 and 143 MPa. A very rapid increase in friction force with sliding speed up to 100 rpm followed by a linear increase with sliding speed in the range 100–700 rpm were reported. In addition, friction was only marginally affected by sliding speed at high loads. However, a continuous motion and high sliding speeds were used in the aforementioned studies of Orkot, and thus not fully transferable to the operating conditions typical for turbine blades and guide vanes. Furthermore, the wear rates have not been investigated. In addition, in all of these studies, the experiments have only been conducted at higher pressures and systematical investigation on the effect of sliding speed and pressure on the friction and wear of these two bearing materials is missing.
The tribological behavior of other self-lubricated polymer composite materials was a focus of attention in a considerable number of papers and many of them have investigated the effect of sliding speed and pressure [7,8,9,10,11,12,13,14,15,16,17,18]. Studies of polytetrafluoroethylene (PTFE) and polymer composite materials whereby PTFE was added as a solid lubricant have reported lower coefficient of friction at higher contact pressure [7,8,9,10,11]. However, no clear description of the underlying mechanism governing the influence of pressure on the coefficient of friction was given.
Therefore, the objectives of this study are to:
  • systematically investigate how changes in sliding speed and pressure influence the friction and wear of ThorPlas and Orkot.
  • investigate how the coefficient of friction is affected by the applied pressure and propose an underlying mechanism governing the influence of pressure on the coefficient of friction.
As detailed information on chemical structure, composition and concentrations of fillers, active additives and impurities in these materials is not readily available, a range of analytical techniques were used to aid in the interpretation of the tribological results.

2. Materials and Methods

In the following section, materials and methods used for material characterization, tribological characterization and surface analysis are described.

2.1. Materials

In this study, two commercially available self-lubricating bearing materials for hydropower and marine applications were investigated. The bearing materials were Thordon ThorPlas Blue (hereafter referred to as ThorPlas) and Orkot TXM Marine (hereafter referred to as Orkot). ThorPlas is a homogeneous thermoplastic polymer alloy, made by compounding several resins with additives and lubricants. The solid lubricants are formulated into substrate and evenly dispersed throughout the material. Orkot is a medium weave, fabric reinforced thermoset polymer material. Composition of the material is PTFE woven polyester ID with MoS2 and PTFE lubricants incorporated into wound layers. In Figure 1b, the brown PTFE fibers (weft) and the light grey/white polyester fibers (warp) can be seen while the resin matrix can be seen in Figure 1c, as the darker grey areas. In addition, calcium carbonate (CaCO3) is used as a filler in the material. The characteristics of the bearing materials are listed in Table 1. Note that, as the bearings manufactured from Orkot are intended to operate at compression, not tension, information about the Tensile Modulus of Elasticity for this material is missing.
Test specimens of the bearing materials were used in the reciprocating tests in the form of cubes with the size 4 × 4 × 4 mm3 (Figure 1). In order to minimize the edge effect and remove eventual fibers that protruded from the surface (visible in Figure 1b), the edges of the load carrying side were gently polished using SiC sand paper of #P600 grade. A sample with polished edges is shown in Figure 1a. In order to remove wear debris from polishing and eventual surface contaminations, prepared samples were cleaned with ethanol, using an ultrasonic bath. Stainless steel plates of SS2333 grade were used as counter surface. Chemical composition of the austenitic stainless steel used is given in Table 2. The plates were laser cut and had a dimension of 60 × 30 × 3 mm3 (length × width × height) with measured Sa surface roughness of 0.31 ± 0.02 μm and hardness of 205 ± 5 HV100. The plates were cut from a rolling sheet and therefore had a grind parallel to the sliding direction. In order to remove potential contaminations before the tests, the stainless steel plates were cleaned in an ultrasonic bath, using ethanol.

2.2. Material Characterization

Material characterization has been carried out using X-ray microtomography, NMR spectroscopy and elemental analysis methods, which are described in this section.

2.2.1. X-Ray Microtomography (XMT)

The two bearing materials were scanned using a Zeiss Xradia 510 Versa (Carl Zeiss X-ray Microscopy, Pleasanton, CA, USA) (see Figure 2). This imaging system combines flexibility with high-resolution and high contrast capabilities. The maximum spatial resolution in terms of 10% modulation transfer function (MTF) is 0.7 μm, while the spatial resolution in terms of voxel resolution (minimum voxel size) is 70 nm.
The Zeiss Xradia 510 Versa system is often referred to as a 3D X-ray microscope (XRM) and, analogous to a light microscope, has multiple detector objectives enabling sample imaging at a number of resolution and field of view pairings. In this study, samples of the two bearing materials were initially scanned using a 4× objective with a field of view (FOV) of 6.02 mm and the spatial resolution 5.97 μm. Such scan setup allows the full geometry of the 4 × 4 × 4 mm cubic polymeric samples to be imaged and analyzed. Based on results of these initial findings, a certain region of interest (ROI) was identified in each sample and scanned at a higher resolution using the 20× objective. These interior tomography scans were carried out with the FOV 0.55 mm and spatial resolution 0.55 μm (voxel size), providing insights into microscale features.
The low-resolution scans were carried out using the X-ray tube voltages of 50 kV (ThorPlas) and 60 kV (Orkot), and the output effects of 4 W (ThorPlas) and 5 W (Orkot). In these experiments, 1601 projections were acquired with an exposure time of 3 s each, providing a total scan time of approximately 2 h. The interior tomography scans (the close-up scans of ROI using the 20× objective), were performed at slightly higher energies: the X-ray tube voltages of 60 kV (ThorPlas) and 70 kV (Orkot) with the output effect of 5 W (ThorPlas) and 6 W (Orkot). High-resolution interior tomography benefits from more projection images than for bulk scans, and hence 2201 projections with an exposure time of 10 s each were acquired resulting in a total measurement time of approximately 8 h per sample. All scans were carried out without X-ray filters.
The 3D visualization and quantitative analysis of the microstructure in the bearing material samples were obtained using Dragonfly Pro software (ORS) (Montreal, QC, Canada). The different phases in the materials were segmented using standard thresholding procedure, enabling volume fractions of internal phases and the pore size distribution to be calculated.

2.2.2. NMR Spectroscopy

As the composition of ThorPlas was unknown, solid-state 13C Magic Angle Spinning (MAS) Nuclear Magnetic Resonance spectroscopy (NMR, Bruker Ascend Aeon WB 400 spectrometer from Bruker BioSpin AG, Fällanden, Switzerland) was used to investigate the chemical structure of the polymer. The sample was cut into small pieces (<2 mm) and placed into a 3.2 mm rotor. The working frequency for 13C was 100.63 MHz. Data were processed using Bruker Topspin 3.5 software (Bruker BioSpin GmbH, Rheinstetten, Germany). The spinning speed was 9 kHz with and 29,478 acquisitions for the solid-state 13C Cross Polarization (CP) MAS NMR and 40,000 for the “Direct excitation” solid-state 13C MAS NMR.

2.2.3. ICP-SFMS

Chemical composition of the bearing materials, with respect to inorganic elements, was measured by Inductively Coupled Plasma Mass Spectrometry (ICP-SFMS) technique. All sample preparation was conducted utilizing high purity reagents: de-ionized Milli-Q water (Millipore, Bedford, MA, USA) further purified by sub-boiled distillation in PTFE stills (Savillex, Minnetonka, MN, USA), nitric acid (HNO3, from Sigma-Aldrich Chemie GmbH, Munich, Germany) and hydrofluoric acid (HF, 48%, Merck Merck KGaA, Darmstadt, Germany). All laboratory ware coming into contact with samples or sample digests was soaked in 0.7 M HNO3 (>24 h at room temperature) and rinsed with MQ water prior to use.
Polymer samples (weight in the range 0.06–0.1 g) were accurately weighed into a 12 mL PTFE vials before the addition of 5 mL 14 M HNO3 and 0.1 mL HF. Vials were placed into a carousel with numbered slots, which was then loaded into the PTFE-coated UltraCLAVE digestion system reaction chamber containing a deionized water–H2O2 mixture (10:1 v/v). The chamber was pressurized with compressed argon and a preprogrammed digestion cycle (30 min ramp to 220 °C followed by 20 min holding time at that temperature) was initiated. Set of method blanks was prepared with each batch of samples. Aliquots of the digests were diluted 50-fold with 1.4 M HNO3, providing a total digestion factor of approximately 1000 v/m, and analyzed by ICP-SFMS (ELEMENT XR, Thermo Scientific, Bremen, Germany) using a combination of internal standardization and external calibration [22].

2.3. Friction and Wear Tests

The reciprocating sliding tests were carried out using a CETR UMT-2 tribometer (CETR, San Jose, CA, USA) with linear reciprocating motion drive and a pin-on-disc test configuration, illustrated in Figure 3. The upper carriage consists of a block with dual friction force and normal load sensor. A polymer sample holder is mounted on the block. The polymer pin consisting of bearing materials is placed inside the polymer sample holder. The carriage is lowered for loading the polymer pin against the stainless steel plate. The stainless steel plate is mounted on the lower drive, allowing for linear reciprocating motion.
The tribological tests were carried out at three different normal loads of 150, 300 and 450 N, corresponding to a nominal surface pressure of 9, 19 and 28 MPa. For each load, tests were performed at different sliding speeds of 10, 25 and 40 mm/s. The selected operating conditions (pressures and sliding speeds) are typical for hydropower applications, based on experience from the Swedish hydropower industry. In order to systematically investigate how sliding speed and pressure influences friction and wear, the total sliding distance was kept constant at 2000 m for all tests resulting in a test duration of 14 to 56 h. Tests were performed at room temperature and each test was repeated three times. A summary of test conditions is presented in Table 3.
The wear depth of the polymer pin was measured continuously during the test using a displacement sensor, located in the upper carriage. In order to calculate specific wear rate coefficients, measured wear depths were plotted as a function of the product of pressure, sliding speed and time, using a reformulation of Archard’s wear equation [23]:
h i = k i pvt ,
where h i is the wear depth, k i is the specific wear rate coefficient, p is the nominal surface pressure, v is the sliding speed and t is time. Index i refers to the examined sliding surface. Time was set to result in the same sliding distance for all the tests and the latter was selected to ensure reaching the steady state wear in all the tests, thus excluding running-in phase. A specific wear rate coefficient based on Equation (1) was calculated by fitting a line to the data points using the linear least-square method. Average friction coefficients were calculated for the same sliding distance as the specific wear rate coefficients.

2.4. Surface Analysis

After the tribological tests, wear tracks were formed on the stainless steel counter surface, as shown in Figure 4. It can be seen that loose wear debris from the polymeric pins are accumulated at the edges of the wear tracks, thus not contributing to the formation of transfer film. These loose wear particles were carefully removed by pressurized air, before starting further surface analysis. All images of the polymeric pins and stainless steel counter surfaces have been captured using a digital camera Nikon D90 (Nikon, Tokyo, Japan) equipped with a Nikon AF-s 60/2,8 G ED Macro lens (Nikon, Tokyo, Japan).
Surface topography measurements were performed using Zygo (NewView 7300, Middlefield, CT, USA) 3D optical profilometer operated in 5× magnification. Two different scanning electron microscopes (SEM) equipped with energy-dispersive X-ray spectrometers were used for the surface analysis of the polymer pins and the wear tracks, namely JEOL JSM-IT300 LV (Peabody, MA, USA) was used for magnifications below 3000× while Zeiss Merlin SEM (FEG-SEM, Oberkochen, Germany) was used for higher magnifications. The latter SEM equipped with a charge compensator, enabling studying the polymer pins without sputtering.

3. Results and Discussion

In the following section, results from material characterization, tribological characterization and surface analysis are presented and discussed. Thorough material characterization of the bearing materials has been conducted in order to study the microstructure and the composition of the materials. Tribological characterization has been carried out in order to investigate the influence of sliding speed and pressure on the friction and wear behavior of the bearing materials. In order to investigate and explain the tribological behavior, surface analysis of the polymer pins and the wear tracks formed on the counter surface during the sliding tests have been performed.

3.1. Material Characterization

In order to study the microstructure and composition of the bearing materials, their characterization was carried out by X-ray microtomography, NMR spectroscopy and elemental analysis methods.

3.1.1. X-Ray Microtomography

Figure 5 shows 3D visualization of the microstructure in the bearing materials, scanned with XMT using 20× objective. The structure of the materials can be seen in more details in the animation of the 3D visualization (see Video S1 for ThorPlas and Video S2 for Orkot). For ThorPlas, three different phases could be distinguished and segmented (Figure 5a): the first one corresponding to the bulk material, second to the pores and the third phase consisting of spherically shaped particles having a higher density than the bulk material. It can be seen that both pores and the spherical shaped particles are evenly dispersed in the material confirming compositional homogeneity of ThorPlas. Quantification of the internal phases in the scanned sample indicated that the volume fraction of bulk material is 98.64 vol %, pores is 0.35 vol % and the spherical particles 1.01 vol %. The majority of pores has a volume below 60 μm3, with only a few single pores having volumes up to 166 μm3, (Figure S1), while the majority of the spherically shaped particles has a volume less than 1300 μm3, some between 1300–3000 μm3 and only single particles have a volume up to 7650 μm3, (Figure S2).
Thus, pores in ThorPlas are much smaller than the spherically shaped particles. Moreover, it was found that many particles and pores are smaller than the spatial resolution of the scan using 4× objective (5.97 μm). Therefore, it fails to provide a good representation of the microstructure of ThorPlas as only the larger details were visible.
Comparing to ThorPlas, the structure of Orkot is more complex, see Figure 5b showing 3D visualization in grey scale with both the actual sliding surface, marked with an arrow, and the structure of the material visible. The scale reflects relative density of the features, where black corresponds to the lowest density and white to the highest. From the reconstruction of the XMT imaging using 20× objective, five phases can be distinguished. The different phases are clearly visible in a cross section of the full tomographic reconstruction of Orkot in grey scale (Figure 6). Phase one (I) represents the bulk polymeric material. The second phase (II) corresponds to the fibers, which constitute the woven structure. Phase three (III) and four (IV) are particles, where phase three has a higher density suggesting that they consist of the MoS2 and phase four made of the CaCO3. The fifth phase (V) corresponds to the pores in the material.
Unlike ThorPlas, it was not possible to segment all the phases of Orkot using the standard thresholding procedure, as the fibers and the polymeric bulk material of the latter both consist of polyester and PTFE, having similar density and are hence hard to distinguish if only grey scale information is considered. However, particles and pores can be segmented for further analysis. Quantification of the internal phases in the sample scanned using 20× objective indicated that the volume fraction is 1.2 vol % for pores and 8.82 vol % for CaCO3. Volume fraction of MoS2, though measured, is not disclosed for proprietary reasons.
From the pore size distribution, it can be deduced that the majority of pores have a volume less than 10,000 μm3, with only single pores having a volume up to 92,000 μm3, (Figure S3). The majority of MoS2 particles has a volume below 840 μm3, but a few having larger volumes up to 1800 μm3 (Figure S4) while the majority of the CaCO3 particles has a volume less than 20,000 μm3 but some are much larger up to 7.5 × 106 μm3 (Figure S5), indicating that the majority of CaCO3 particles have a volume that is more than 20 times higher than the MoS2 particles.
In Figure 7, two scans using 4× and 20× objectives reveal uneven distribution of the segmented pores in the material. The higher magnification scan shows that pores are more abundant in areas close to fibers, suggesting that the resin matrix do not perfectly adhere to the structure fibers. The scan using 4× objective reveals larger pores in the material structure. Figure 8 presents a cross section of the full tomographic reconstruction of Orkot, revealing macro structure of material. It appears that the spacing between the woven fibers is not uniform, indicating structural heterogeneity in the structure of Orkot. Moreover, several larger pores, situated on different locations in the material, are visible in the slice. As a result of the heterogeneity, the volume fraction data for different internal phases is valid only for the location of the high magnification scan. This may lead to high uncertainty of the whole sample volume fractions assessment by extrapolation and such data should be treated with caution.
Using results from the lower magnification scan, the majority of pores are estimated to have a volume less than 5 × 106 μm3, with only single pores having a volume up to 1.9 × 107 μm3 (Figure S6). Quantification of the internal phases in the sample scanned using 4× objective provides the volume fraction of pores of 0.36 vol %. The apparent discrepancy in volume fraction of pores, estimated from the two scans using different objectives, stem from differences in spatial resolution, as many of the pores visible in the 20× scan are too small to be resolved in the 4× scan. The size of the pores is up to 1 × 10⁵ times larger in Orkot than in ThorPlas.

3.1.2. NMR Spectroscopy

The solid-state 13C Cross Polarization (CP) MAS NMR spectrum of ThorPlas is shown in Figure 9. It is noteworthy that, in the 1H-13C cross polarization (CP) experiment, only the carbon atoms that are in a close proximity to hydrogen atoms are detected. The spectrum shows four major resonance lines from such carbon atoms. A resonance line at 163.4 ppm in the 13C CP/MAS NMR spectrum of the polymeric material is assigned to carbon sites in the carbonyl groups [–C(O)–]. The resonance lines at 133.7–129.8 ppm are assigned to aromatic carbon atoms, while the resonance line 61.5 ppm is attributed to CH2–O group [24]. This spectrum revealed that ThorPlas contains carbonyl groups, aromatic phenyl rings and CH2–O groups. There are no signals around between 30 and 0 ppm, which are typical for the aliphatic methylene and methyl carbons, suggest that this polymeric material does not contain such compounds.
Figure 10 shows a “direct excitation” solid-state 13C MAS NMR spectrum of ThorPlas. In this experiment, all carbons present in the sample are detected. Confirming results of the CP/MAS experiment, this spectrum also shows resonance lines assigned to carbonyl groups [–C(O)–], aromatic carbon atoms and methylene groups attached to oxygen atoms (CH2–O). In addition, this experiment reveals resonance line at 1.1 ppm, which is a typical region for carbon atoms attached to silicon atoms [24], since 0 ppm corresponds to tetramethylsilane (TMS), used as a reference for 1H, 13C and 29Si nuclei in NMR experiments. The broad background signals in the range from 160 to 80 ppm are typical for a PTFE-type polymer, which might also be present in the sample. These signals are absent in the CP/MAS NMR experiment because PTFE does not contain protons.
The NMR spectroscopy results suggest that ThorPlas material is most probably a mixture of a few polymeric compounds: (1) The aromatic carbons together with the carbonyl groups and methylene groups attached to oxygen atoms indicate the presence of aromatic polyester type polymer and most probably polyethylene terephthalate (PET). These functional groups might be caused by the presence of polyamide type polymer as well, but as no nitrogen atoms were detected in the Energy Dispersive Spectroscopy (EDS) analysis, the presence of polyamide species in this polymeric material can be excluded; (2) PTFE-type polymers and (3) Si–C-based polymers, in which carbon atoms are directly attached to silicon atoms but without nearby hydrogen atoms.
Due to its excellent property of self-lubrication, PTFE is a common additive used in both thermoplastics and thermosets as a solid lubricant [25]. When PTFE slides against a hard surface (e.g., metal), a part of the material is transferred to the metal counterpart forming a PTFE transfer film [26,27,28]. This film plays a critical role in reducing the friction coefficient as PTFE-PTFE contact has a very low friction coefficient [29,30,31].
Silicone-based additives are commonly used for thermoplastic resins, including aromatic polymers, in order to provide improved mechanical, friction, wear, processing and heat resistance properties [32,33,34,35]. When used together with PTFE, such additives eliminate a so-called “break-in” period [36].
Concentrations/traces of both fluorine (F), most likely coming from the PTFE, and silicon (Si) was found in the transferred layers formed on the stainless steel counter surfaces (see Section 3.3). In a study presented by the bearing manufacturer, it is revealed that more than one solid lubricant is used in the material and a concentration of lubricants on the surface have been detected using energy dispersive X-ray Analysis [4]. Applying the same analytical method to the transfer layers formed only C, O, F and Si atoms were detected, suggesting that both PTFE and Si-based additives are present as solid lubricants in the material.

3.1.3. Elemental Analysis

A concentration of inorganic constituents in ThorPlas measured by ICP-SFMS is presented in Table 4. Only elements with measured concentrations above 0.001 wt % are included, with the total sum well below 0.5 wt %, demonstrating that the ThorPlas is mostly an organic polymer. This is further confirmed by very low ash content (0.5 ± 0.2 wt %) determined gravimetrically by ashing four sub-samples of material at 550 °C. It should be noted though that surface contamination during sample preparation (e.g., cutting, milling and handling) may contribute to measured concentrations. For example, very variable content of Titanium (Ti), observed in some sub-samples of these polymers, most probably present as surface contamination from cutting equipment and the data for this element is omitted. Moreover, Fe, Mg and Mn (found in both materials) are not typical elements added to polymers and thus they might also originate from external contamination.
Results show that ThorPlas contains silicon (Si), which confirms the findings from the NMR spectroscopy. Furthermore, it has the highest concentration of the inorganic constituents in the material, even though it is only 0.12 wt % corresponding to approximately 0.2 wt % of Poly(siloxane). Due to its low concentration, it is most likely that the spherical particles seen in Figure 5a are not silicon but rather PTFE particles. It was shown (Section 3.1.1) that ThorPlas is a homogeneous material having its compounds evenly dispersed in the bulk, and thus silicon particles are expected to be uniformly distributed. The low measured Si concentration suggests that silicon particles are smaller than the spatial resolution of the 20× objective and thus undetectable in the reconstruction of tomography scans, suggesting that they can be considered nano-particles.
Rather unexpectedly, it was found that ThorPlas contains germanium (Ge), which is a rare element, implying that it has been added to the material intentionally. Germanium is commonly used as a polymerization catalyst in plastics, especially polyethylene terephthalate (PET) [37,38], thus supporting the hypothesis that the polymer resin of ThorPlas contains PET based polymer as suggested by NMR spectroscopic data.
Concentrations of inorganic constituents in Orkot are presented in Table 5. However, concentrations of Molybdenum and Sulphur are not disclosed for proprietary reasons. The sum of inorganic components is several times higher in comparison to ThorPlas. Results show that, besides Calcium (Ca), Molybdenum (Mo) and Sulphur (S), there are also several other inorganic elements in the material, though in relatively low concentrations. Si was one of the detected elements. Silica (SiO2) is a commonly used filler in thermoset composites added in order to enhance the mechanical properties of the materials [39,40,41]. The elemental analysis does not provide information on bonds or structure of the component containing Si in the material. Cobalt (Co) is commonly used as a promoter in the cure process of polyester thermosets [42].
From relative density of the polymer (1.25 g/cm3, Table 1), MoS2 (5.06 g/cm3) and CaCO3 (2.71 g/cm3) and respective volume fractions determined by XMT (see Section 3.1.1), concentrations of the latter two compounds can be calculated, providing estimates of 19 wt % (CaCO3). Results from XMT and ICP-SFMS measurements provide almost identical MoS2 concentrations, while it is almost a two-fold difference in CaCO3 estimates between the two analytical techniques. The reason for the discrepancy is most likely spatial heterogeneity of material causing the volume fraction values obtained from XMT using a high magnification lens, being strongly dependent on the location of the scan and thus may not be representative for the whole sample. Moreover, partial precipitation losses of Ca as insoluble fluorides from digestion solution cannot be ruled out. The almost identical MoS2 concentrations from the two different measurement techniques suggest that the solid lubricant is evenly dispersed within the material matrix.
Both measurement methodologies are capable of estimating the various volumetric element content within the bearing materials; however, because of the small sample size tested by XMT, uncertainty in estimation of average content of heterogeneous materials may be high.

3.2. Tribological Characterization

In the following section, friction and wear results obtained from the reciprocating sliding tests are presented and discussed.

3.2.1. Friction

Figure 11 shows the average coefficient of friction (COF) values for the two bearing materials obtained under different operating conditions. In general, both materials showed a trend of decreasing COF for increasing pressure and this trend was consistent for all tested sliding speeds. For Orkot, the COF decrease at different sliding speeds is linear, while, for ThorPlas, the decrease is steeper at pressures between 9 to 19 MPa than at 19 to 28 MPa. Comparing COF between the two bearing materials, it can be observed that, overall, ThorPlas exhibits a lower COF in comparison to Orkot.
A decrease in COF with increased pressure between 45 and 90 MPa at a maximum sliding speed of 5.4 mm/s has previously been observed for ThorPlas [4]. Moreover, a COF decrease for higher loads was reported for Orkot as well [5]. The COF values obtained for Orkot at 28 MPa are in agreement with previously reported friction values at 29 MPa pressure and unspecified sliding speed [3].
Lower COF at higher contact pressure is probably due to the presence of PTFE in both materials as shown in previous studies with PTFE and polymer composite materials with PTFE inclusions [7,8,9,10,11]. Data from EDS analysis on the wear tracks formed on the stainless steel counter surfaces (see Section 3.3 and Figure 16) revealed higher concentrations of elements from the internal lubricants, in tests performed at higher pressures (Table 7), indicating that, at such conditions, more solid lubricants can be squeezed from the material forming a layer on the counter surface and thus contributing to lower the COF.
For Orkot, changes in sliding speed have little effect on the COF irrespective pressures applied (Figure 11). This also applies for ThorPlas at higher pressures. However, at lower pressure (9 MPa), the COF is increasing with the sliding speed. The lower content of released solid lubricants under low pressures, as revealed by the EDS analysis (Table 6), may be responsible for the behavior observed. It is important to note that ThorPlas is a thermoplastic polymer while Orkot is a thermoset polymer. Thermoplastics soften appreciably or even melt at a characteristic temperature in contrast to thermosets, which are cross-link under the heat and do not melt easily [43].
It is previously reported that, for COF of polymers (thermoplastics), the sliding speed influence is higher than that of applied pressure [12,13]. However, for ThorPlas, this was valid only for lower pressures, when the lubrication of solid lubricants is lower. The sliding friction between materials generates heat at asperities increasing surface temperature. The higher the sliding speed, the higher the resulting temperature, and, as it reaches the softening point of the polymer, the accompanying increase in adhesive components leads to higher COF values [12]. Hence, the contact zone temperature is a key factor influencing the quality of operation of bearings made of polymeric materials [11,14,15,16,44,45].
The observed trends in ThorPlas COF under different operating conditions (pressure and sliding speed) are similar to those recently reported for PET filled with PTFE [11].

3.2.2. Wear

Figure 12 shows the average specific wear rate coefficient ( k [mm2/N]) obtained for the two bearing materials at different operating conditions. It can be seen that, for ThorPlas, the specific wear rate coefficient follows similar trends to COF. Both materials exhibit similar tendencies; regardless of the pressure applied, the specific wear rate coefficients increase with sliding speed.
For Orkot, the increase in specific wear rate coefficient at increasing sliding speed is linear for lower pressures (9 and 19 MPa), while, at higher pressure (28 MPa), the increase is insignificant between 10 to 25 mm/s, though the specific wear rate coefficient is higher at 40 mm/s. The ThorPlas specific wear rate coefficient at low pressure (9 MPa) doubles with sliding speed increasing from 10 to 25 mm/s, while there is no further increase between 25 and 40 m/s. For higher pressures (19 and 28 MPa), the increase in specific wear rate coefficient with increased sliding speed follows a linear trend.
An increase in wear rate with increased sliding speed is believed to be caused by the thermal softening of the polymers, which leads to higher plastic deformation under lower load values. Thus, the increase in COF and wear rate is because of the rise in surface temperature to the point of surface layer reaching the softening point of the polymer [12]. Such increase in wear rate with increased sliding speed has also previously been reported for fiber-reinforced composites [17].
The ThorPlas specific wear rate coefficient at higher sliding speeds (25 and 40 mm/s) decreases almost in half between 9 and 19 MPa while there is no significant specific wear rate coefficient change as load is increasing from 19 to 28 MPa. The specific wear rate coefficient at the lower sliding speed (10 mm/s) is stable over all pressures tested. The Orkot specific wear rate coefficient at the higher sliding speeds (25 and 40 mm/s) is decreasing with increased pressure. However, at 10 mm/s, the wear is lowest at low pressure (9 MPa) than at the higher pressures (19 and 28 MPa). It has previously been reported that, for woven fabric composites, the applied load has more effect on the specific wear rate coefficient than the sliding speed [17]. Obtained results confirm findings of another study suggesting that specific wear rate coefficient is decreasing with applied pressure [18].
Over the wide range of operational conditions, Orkot has lower specific wear rate coefficients than ThorPlas. The obtained Orkot specific wear rate coefficient values are, though in the same order of magnitude, slightly higher than previously published for studies testing the material using journal bearing test set-ups [2,3,46]. The slight differences can be attributed to a different load characteristic (23 ± 7 MPa and 29 MPa vs. 28 MPa), motion amplitudes (1.1 mm and 0.12 mm vs. 2.5 mm), sliding speed as well as the contact mechanics specifics.

3.3. Surface Analysis

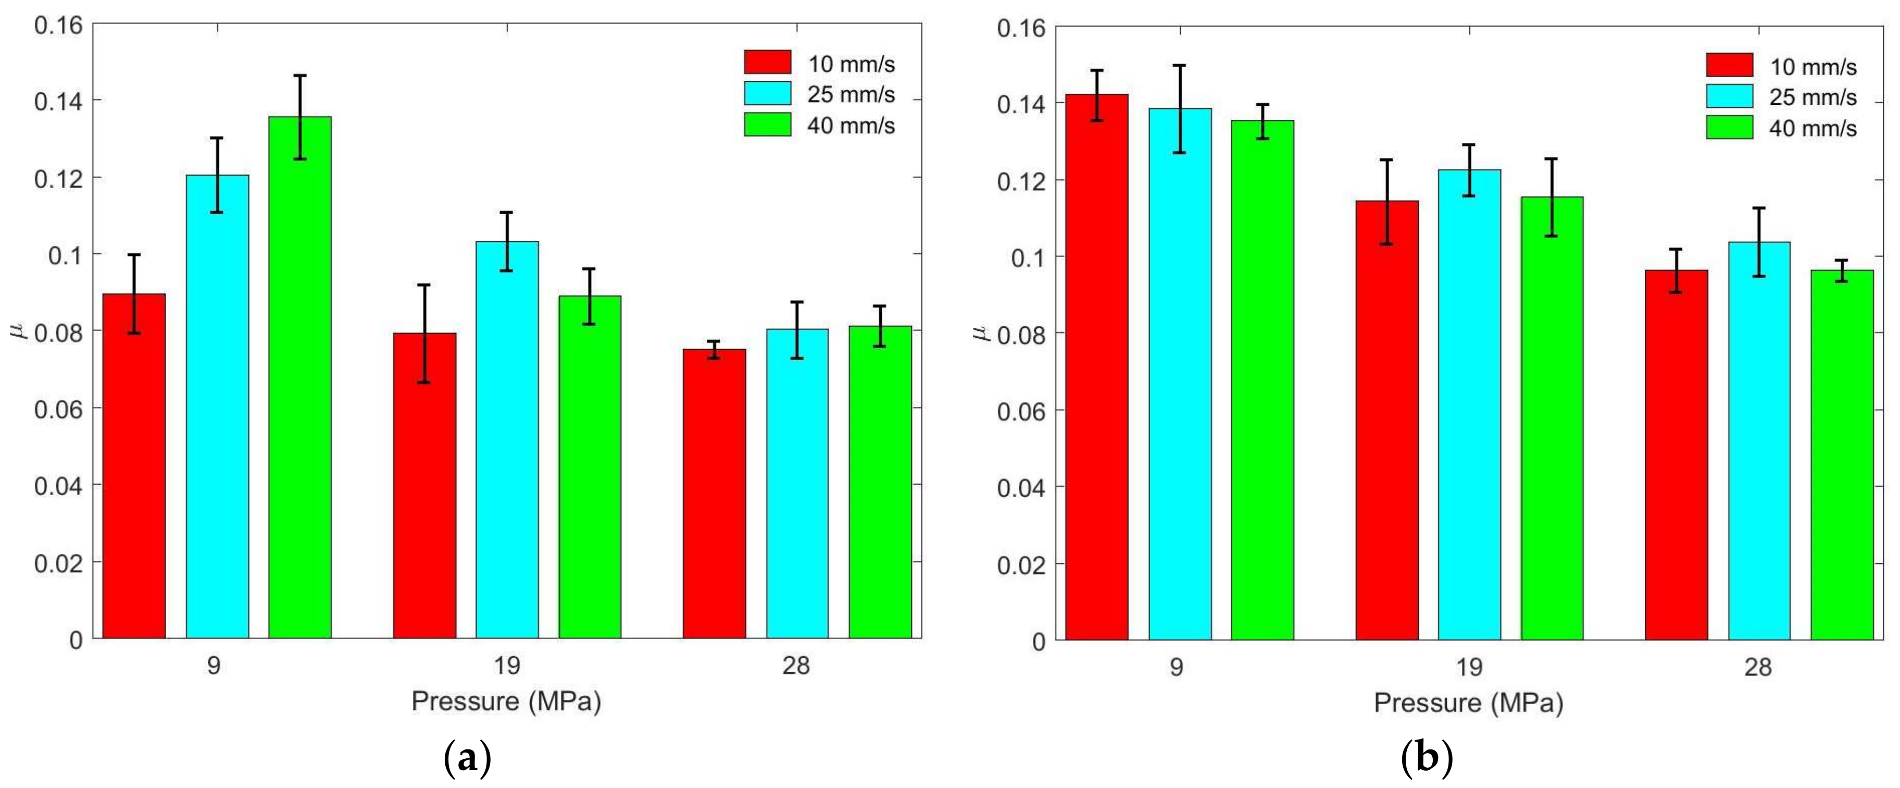
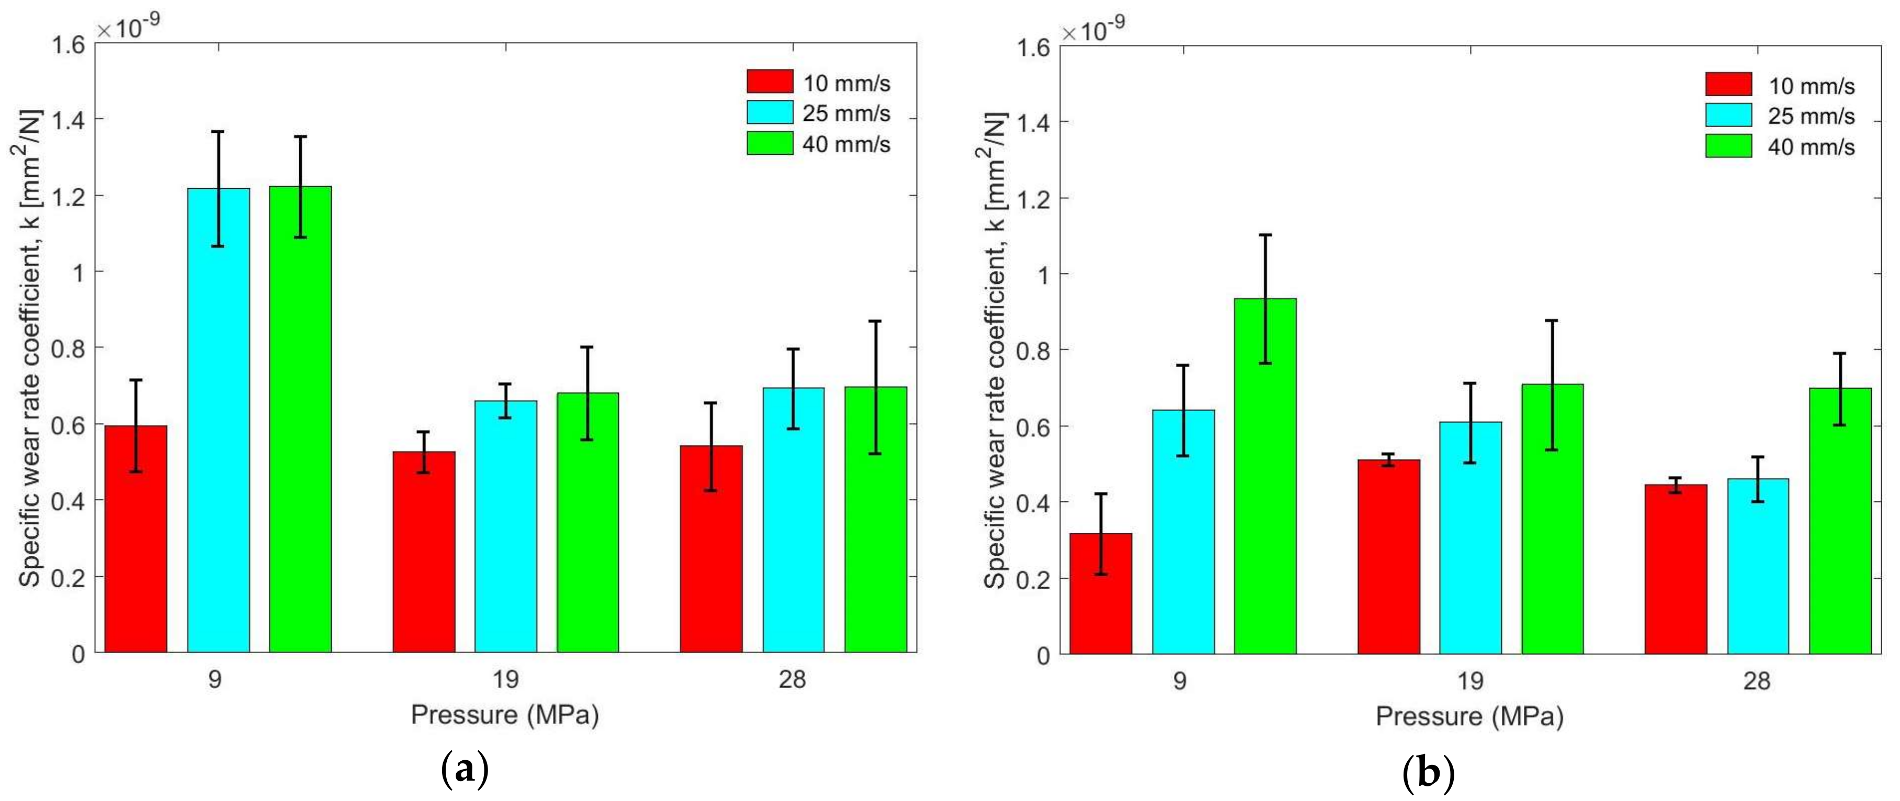
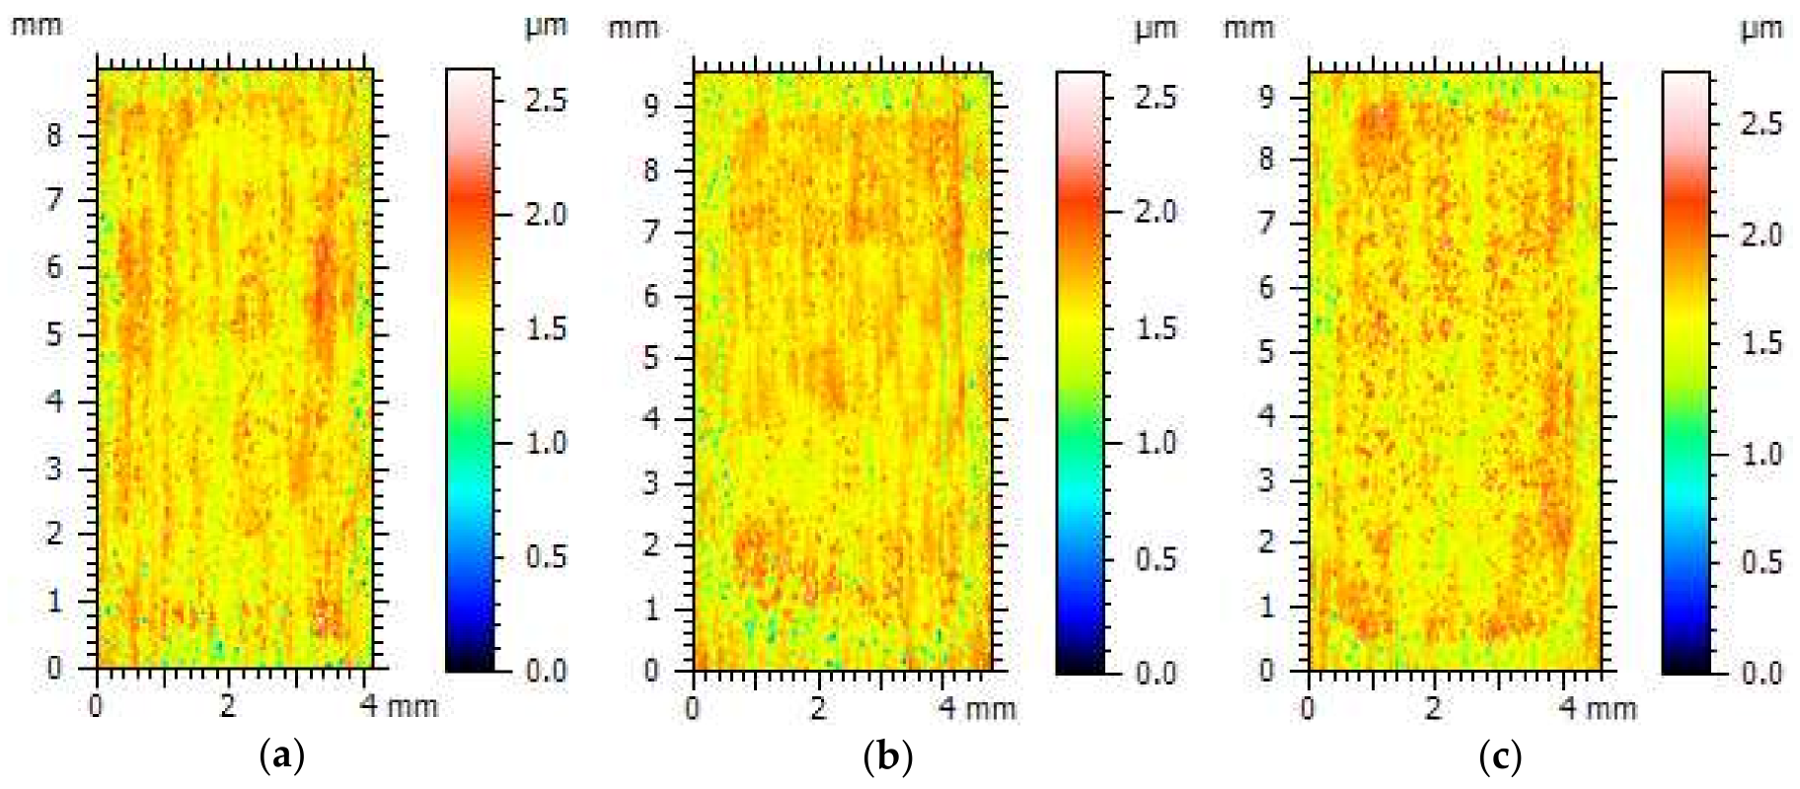
In order to investigate the observed decrease of COF with increased pressure as well as increase of specific wear rate coefficient at higher sliding speed, counter surfaces from tests performed with three different operating conditions were selected for further surface analysis based on findings from the tribological characterization. The selected operating conditions for both bearing materials were 9 MPa at 10 mm/s, 9 MPa at 40 mm/s and 28 MPa at 40 mm/s.
Surface topography of the wear tracks formed on the stainless steel counter surfaces during sliding tests, as measured by optical interferometer (Zygo), are presented in Figure 13 for ThorPlas and 
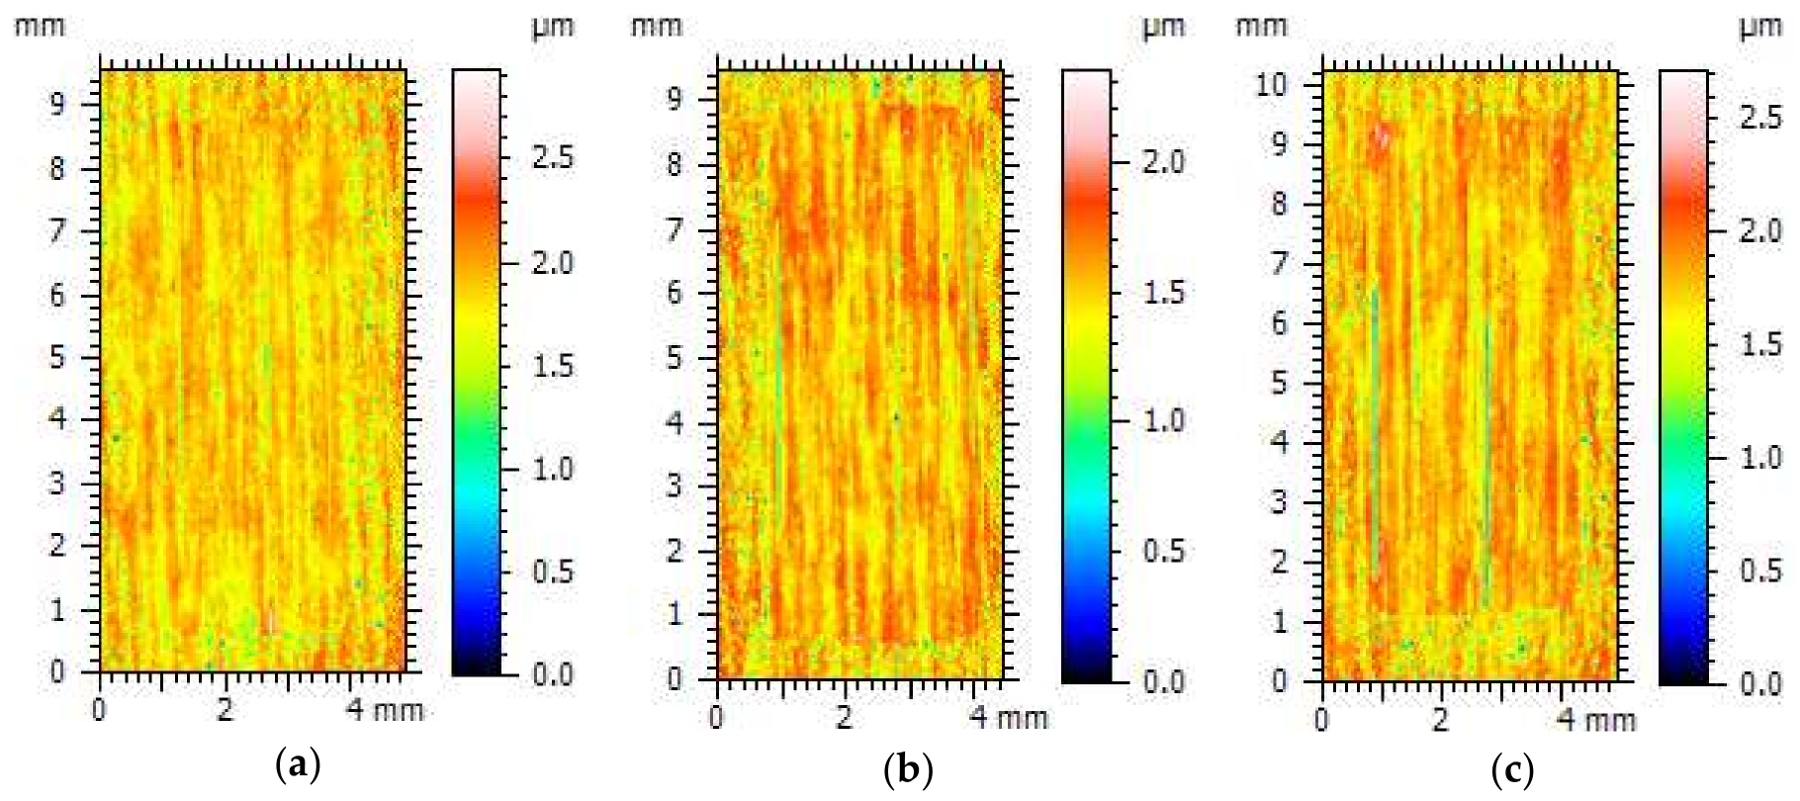
Figure 14 for Orkot. It should be noted that, as polymers are partially reflective materials, the measurements on transferred layers occasionally introduces artifacts manifested as spikes in the surface roughness measurements. These spikes have been filtered out using a threshold operator in order to truncate the peaks that mask other findings. As these artifacts may induce an error in calculation of the transferred material volume, no further quantitative analysis of the transferred layers has been performed.
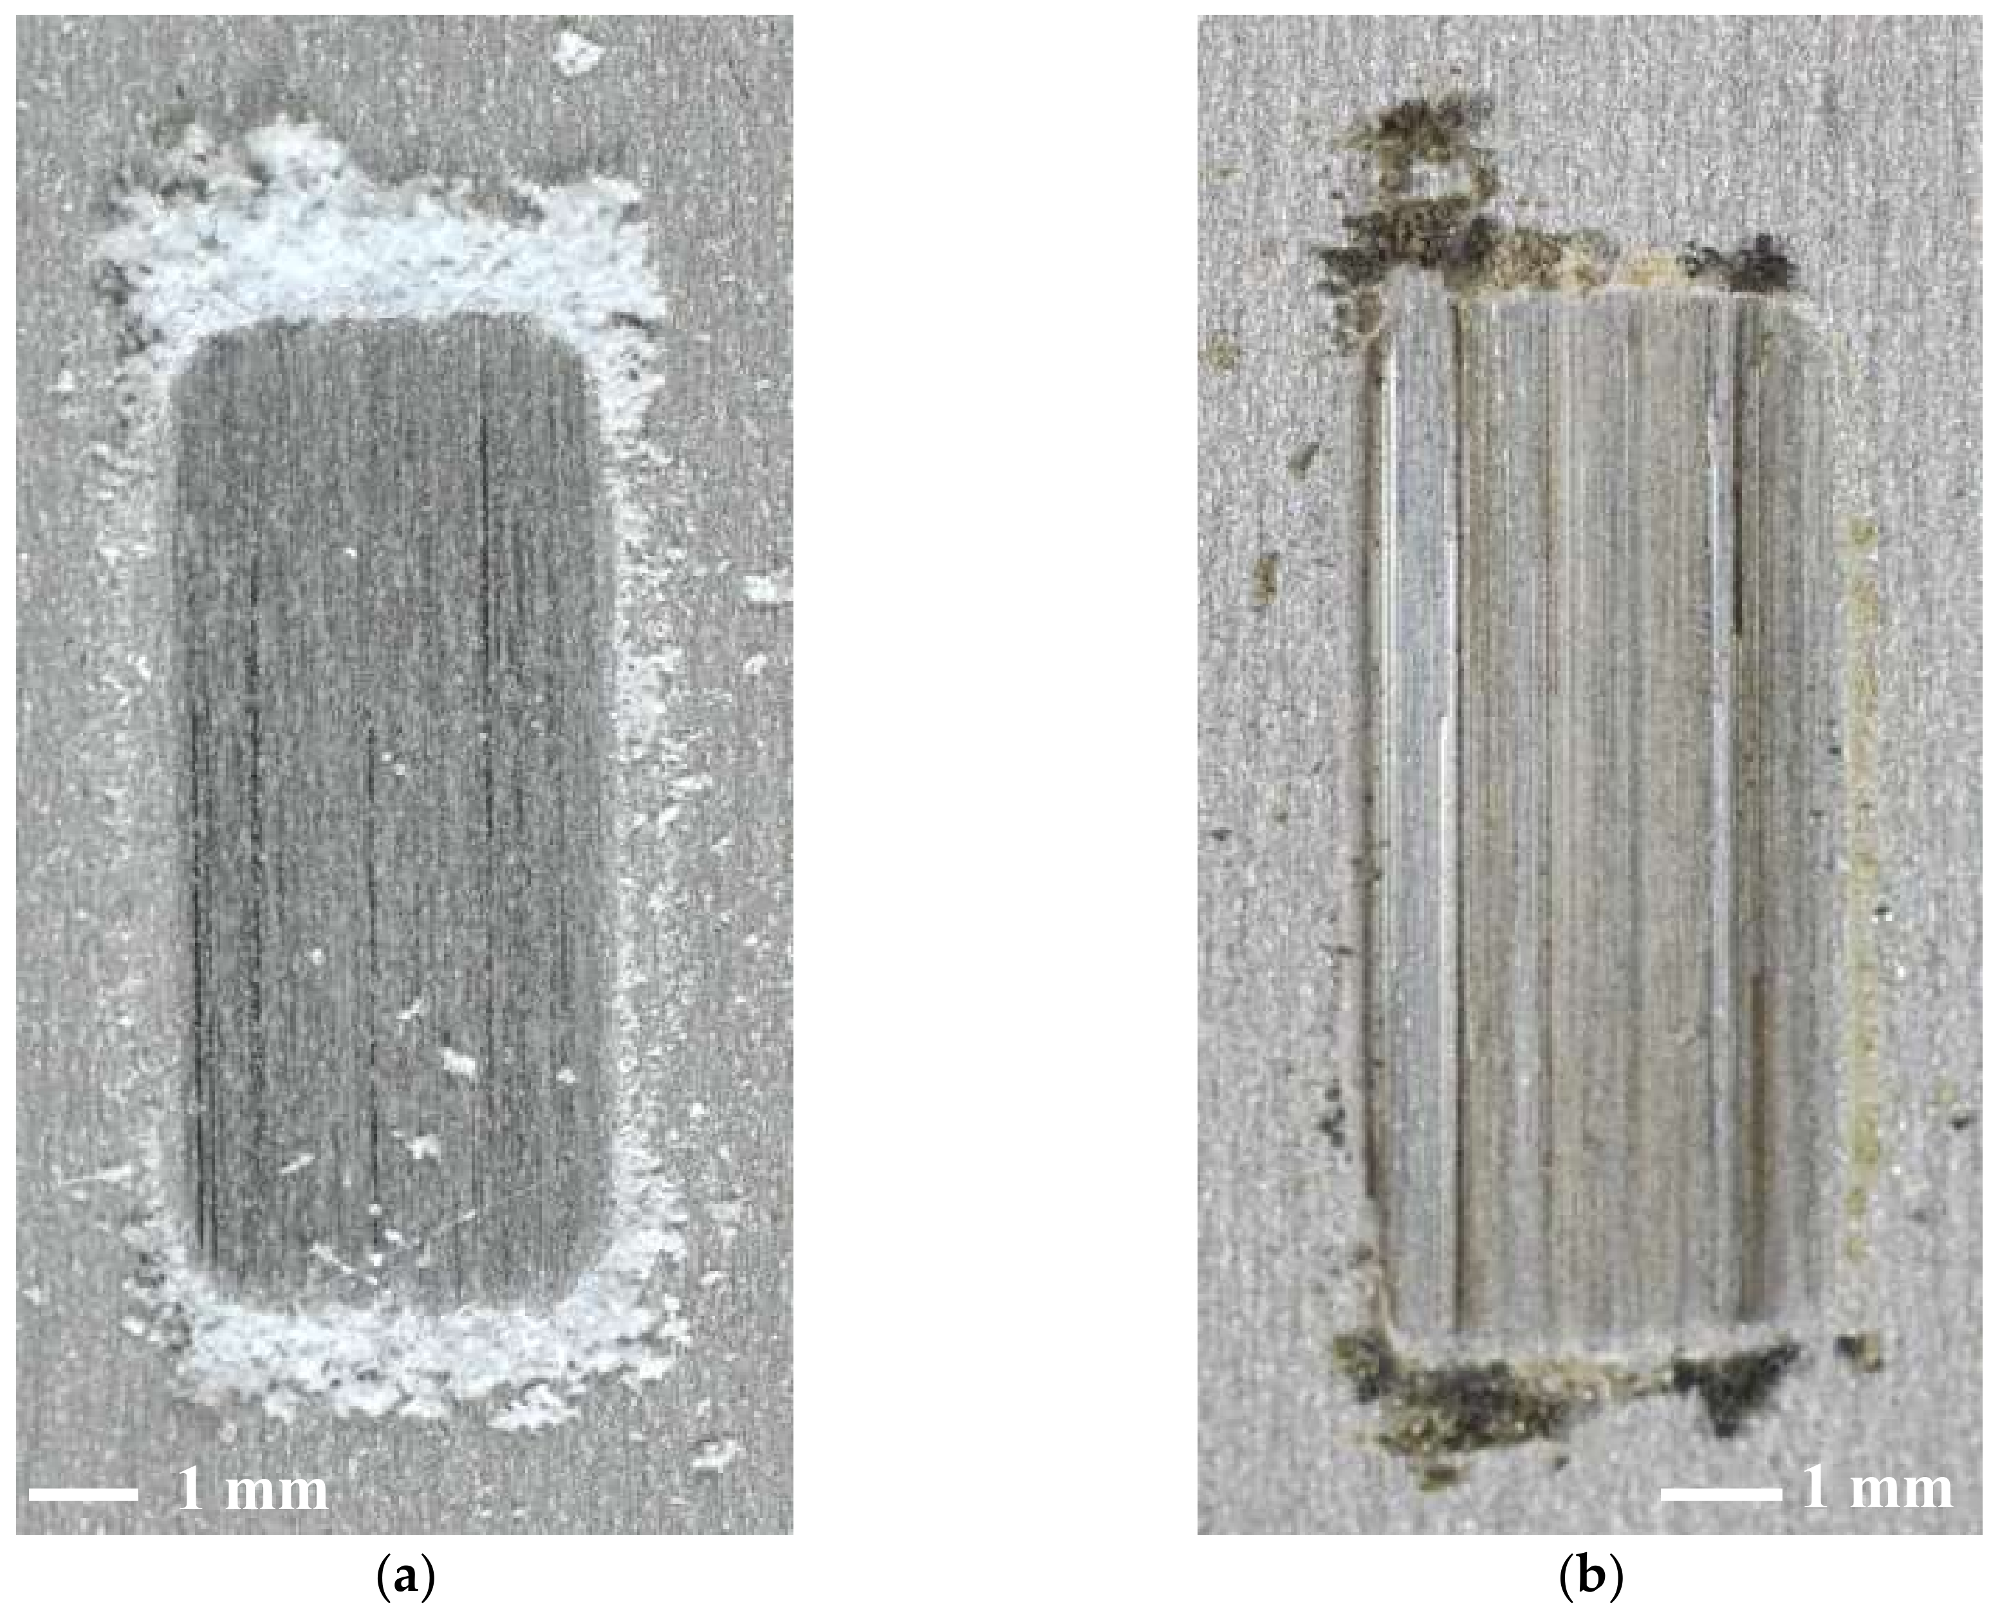
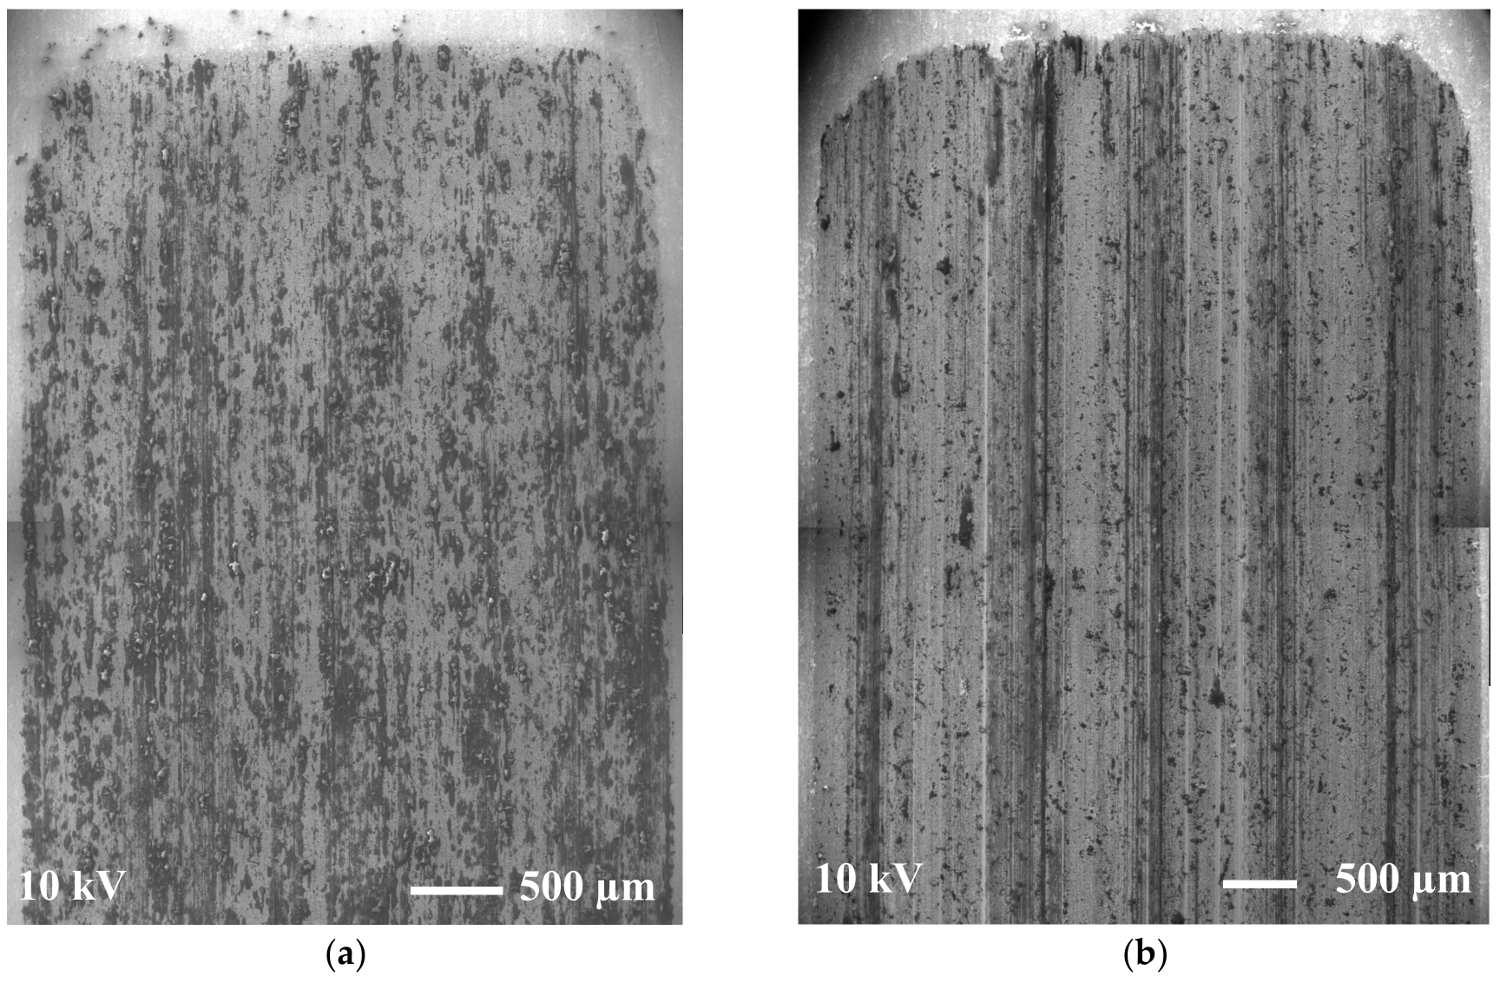
Stitched SEM micrographs of the wear tracks are shown in Figure 15. The darker areas in the images correspond to the transferred polymer layers. It can be seen that less material transfer occurs for tests performed with Orkot than with ThorPlas. This finding is consistent with the lower specific wear rate coefficients observed for Orkot during the tribological characterization (Figure 12). In addition, a lower amount of deposited material in the transfer layer can explain the overall higher COF for tests performed with Orkot material (see 
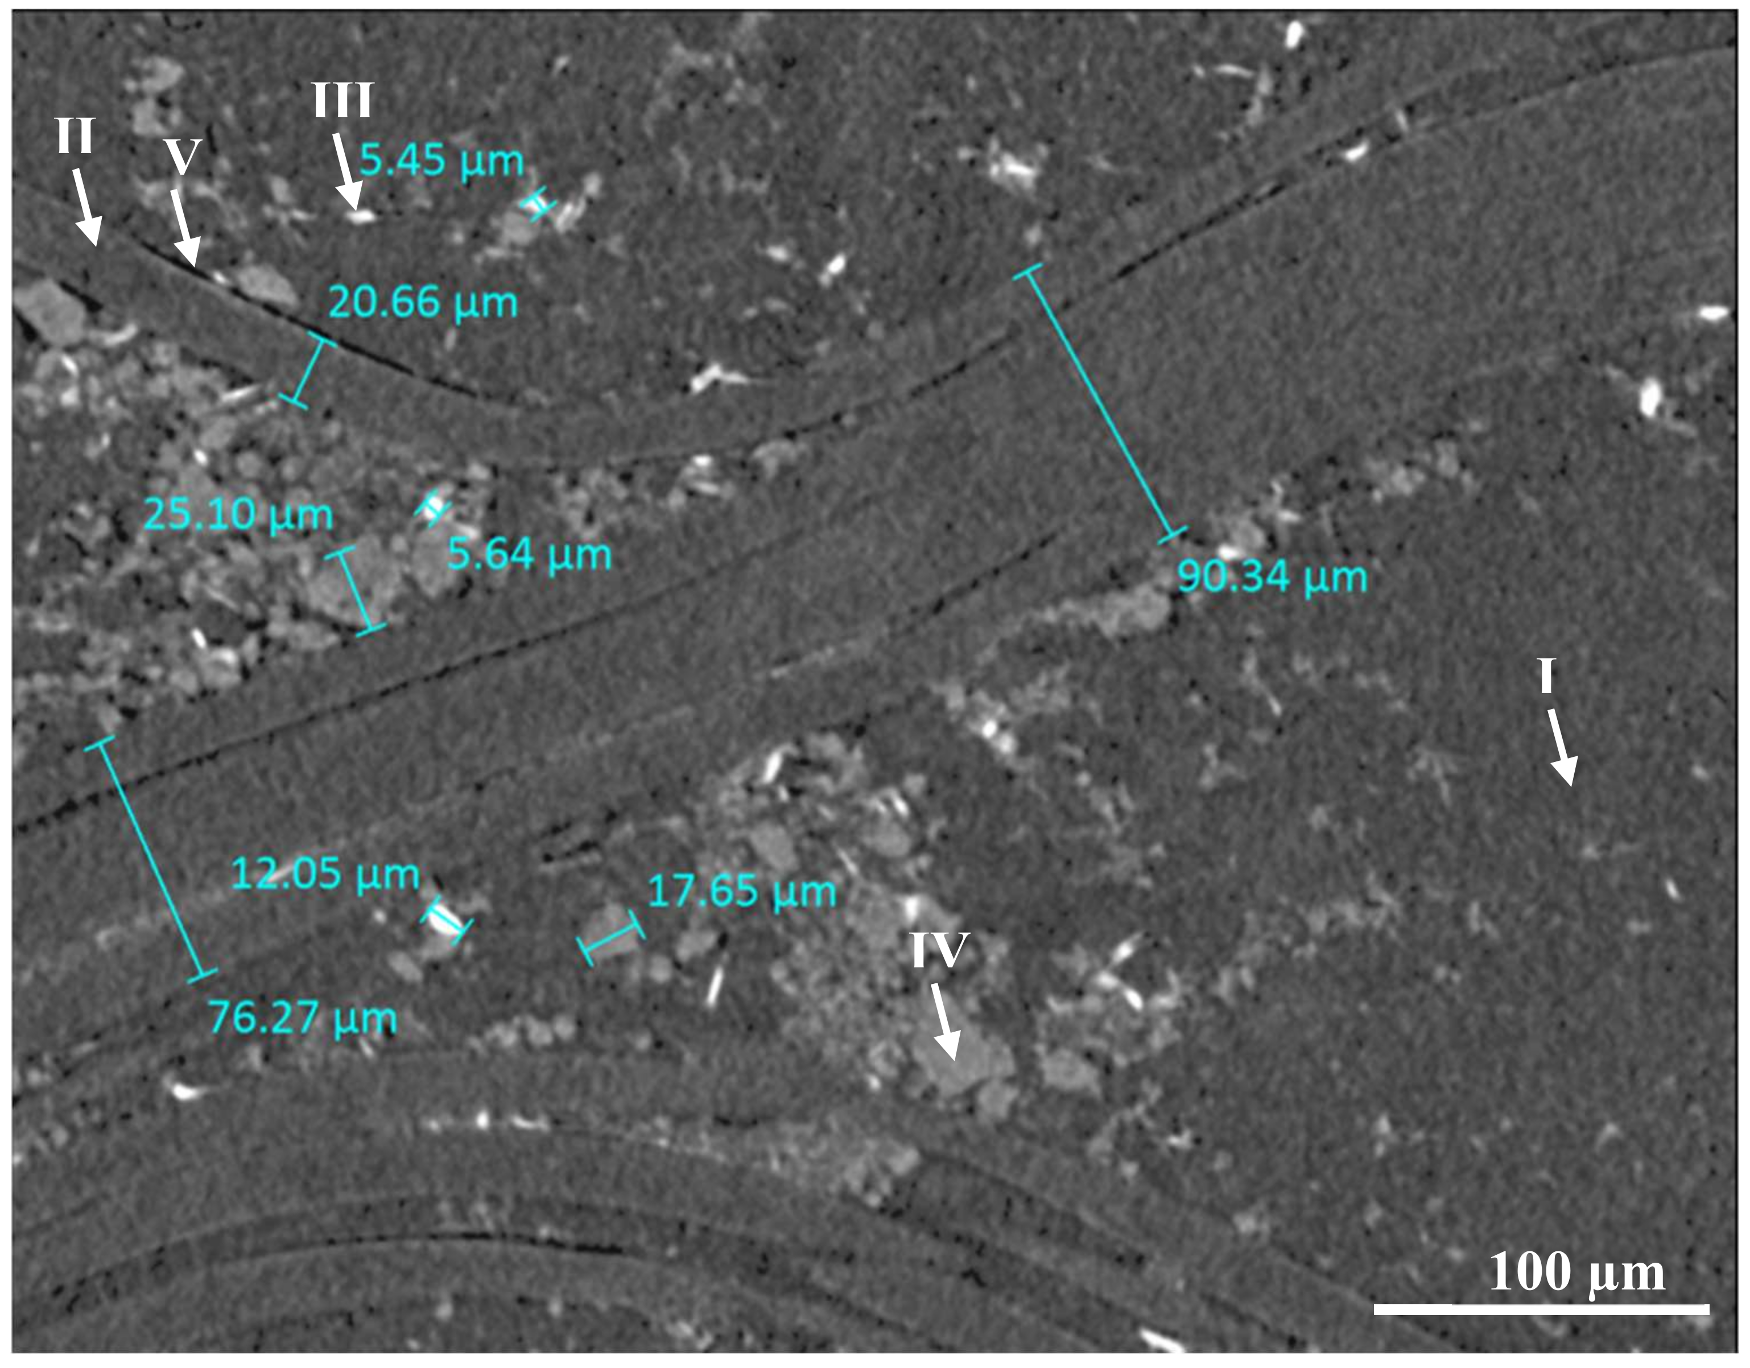
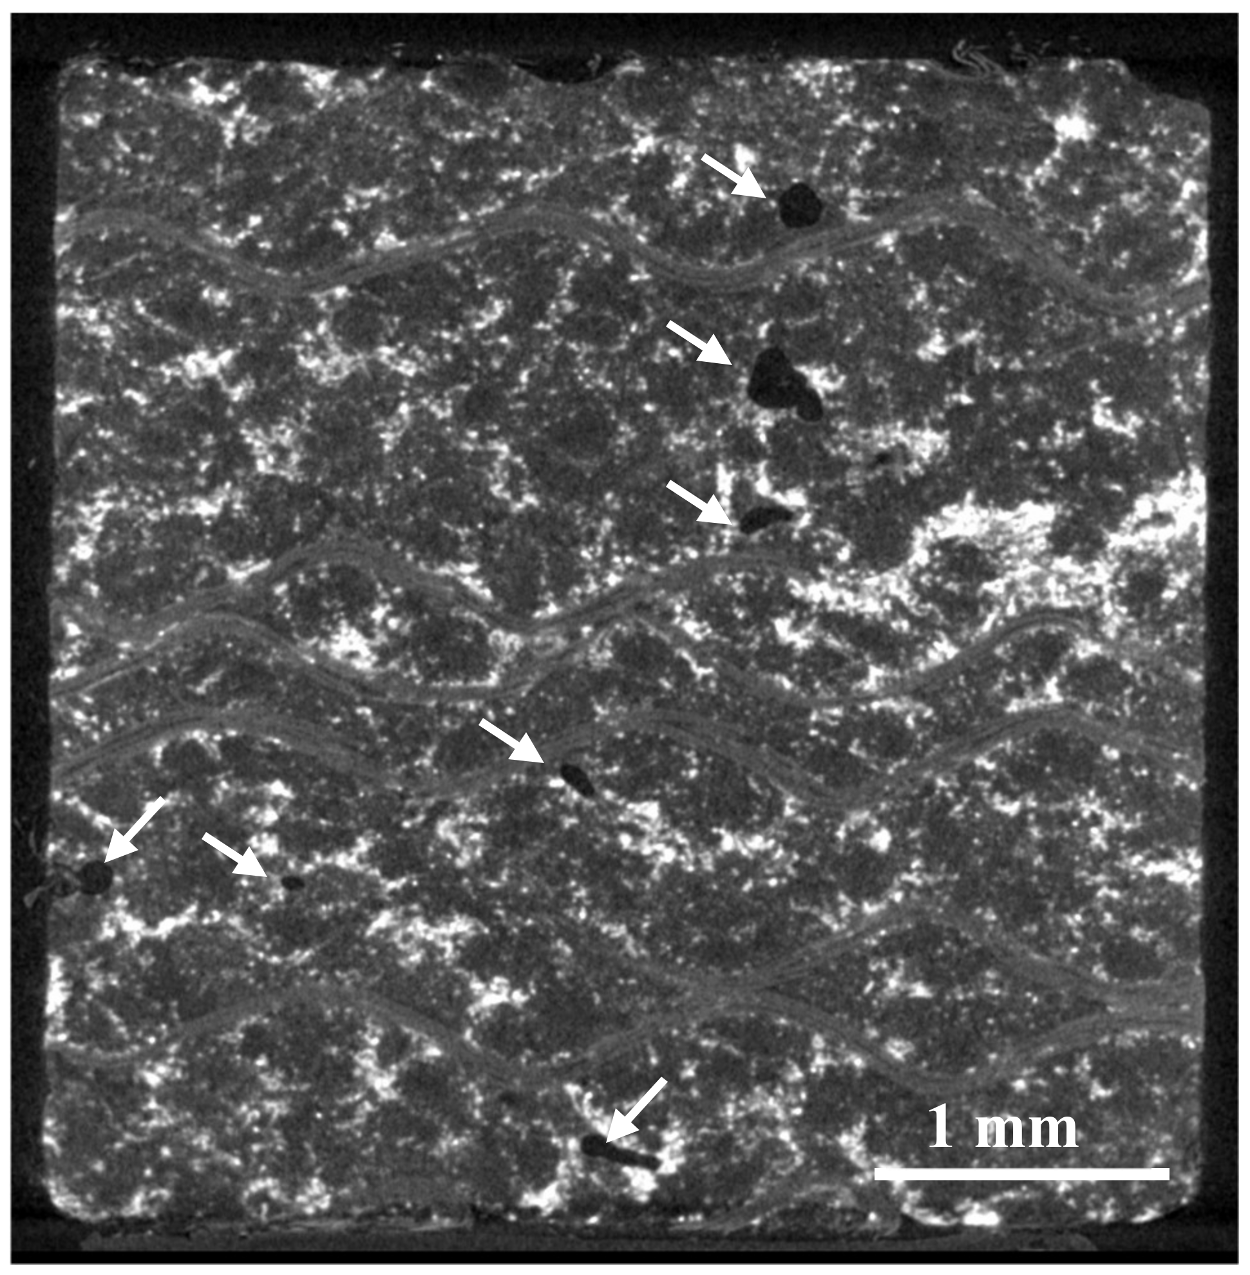
Figure 11). Furthermore, the surface topography reveals deep groves in the wear tracks formed during sliding tests with Orkot material, indicating that the counter surface are subjected to an extensive abrasive wear, contributing to a higher COF. It can be seen that the grooves grow deeper when the sliding speed and pressure are increased. These groves are believed to be caused by polyester fibers used as reinforcement (warp) in the material. Comparing SEM micrographs of the wear tracks (Figure 15) at higher magnifications with the tomographic reconstruction of Orkot (Figure 6), it can be observed that the width of the groves is consistent with the width of the fibers.
From surface topography (Figure 13 and Figure 14) and SEM micrographs (Figure 15) of the wear tracks, it can be seen that the transferred layers are less prominent for operating conditions characterized by low sliding speed and low nominal pressure. Comparing wear tracks for the two different pressures (9 and 28 MPa) at the same sliding speed (40 mm/s), it appears that more polymer material is transferred to the stainless steel at the lower pressure. Moreover, the transferred layers are more uniformly distributed than under other operating conditions, where more uneven, lumpy deposition can be seen. Therefore, it is unclear why the higher pressure gives rise to a lower COF.
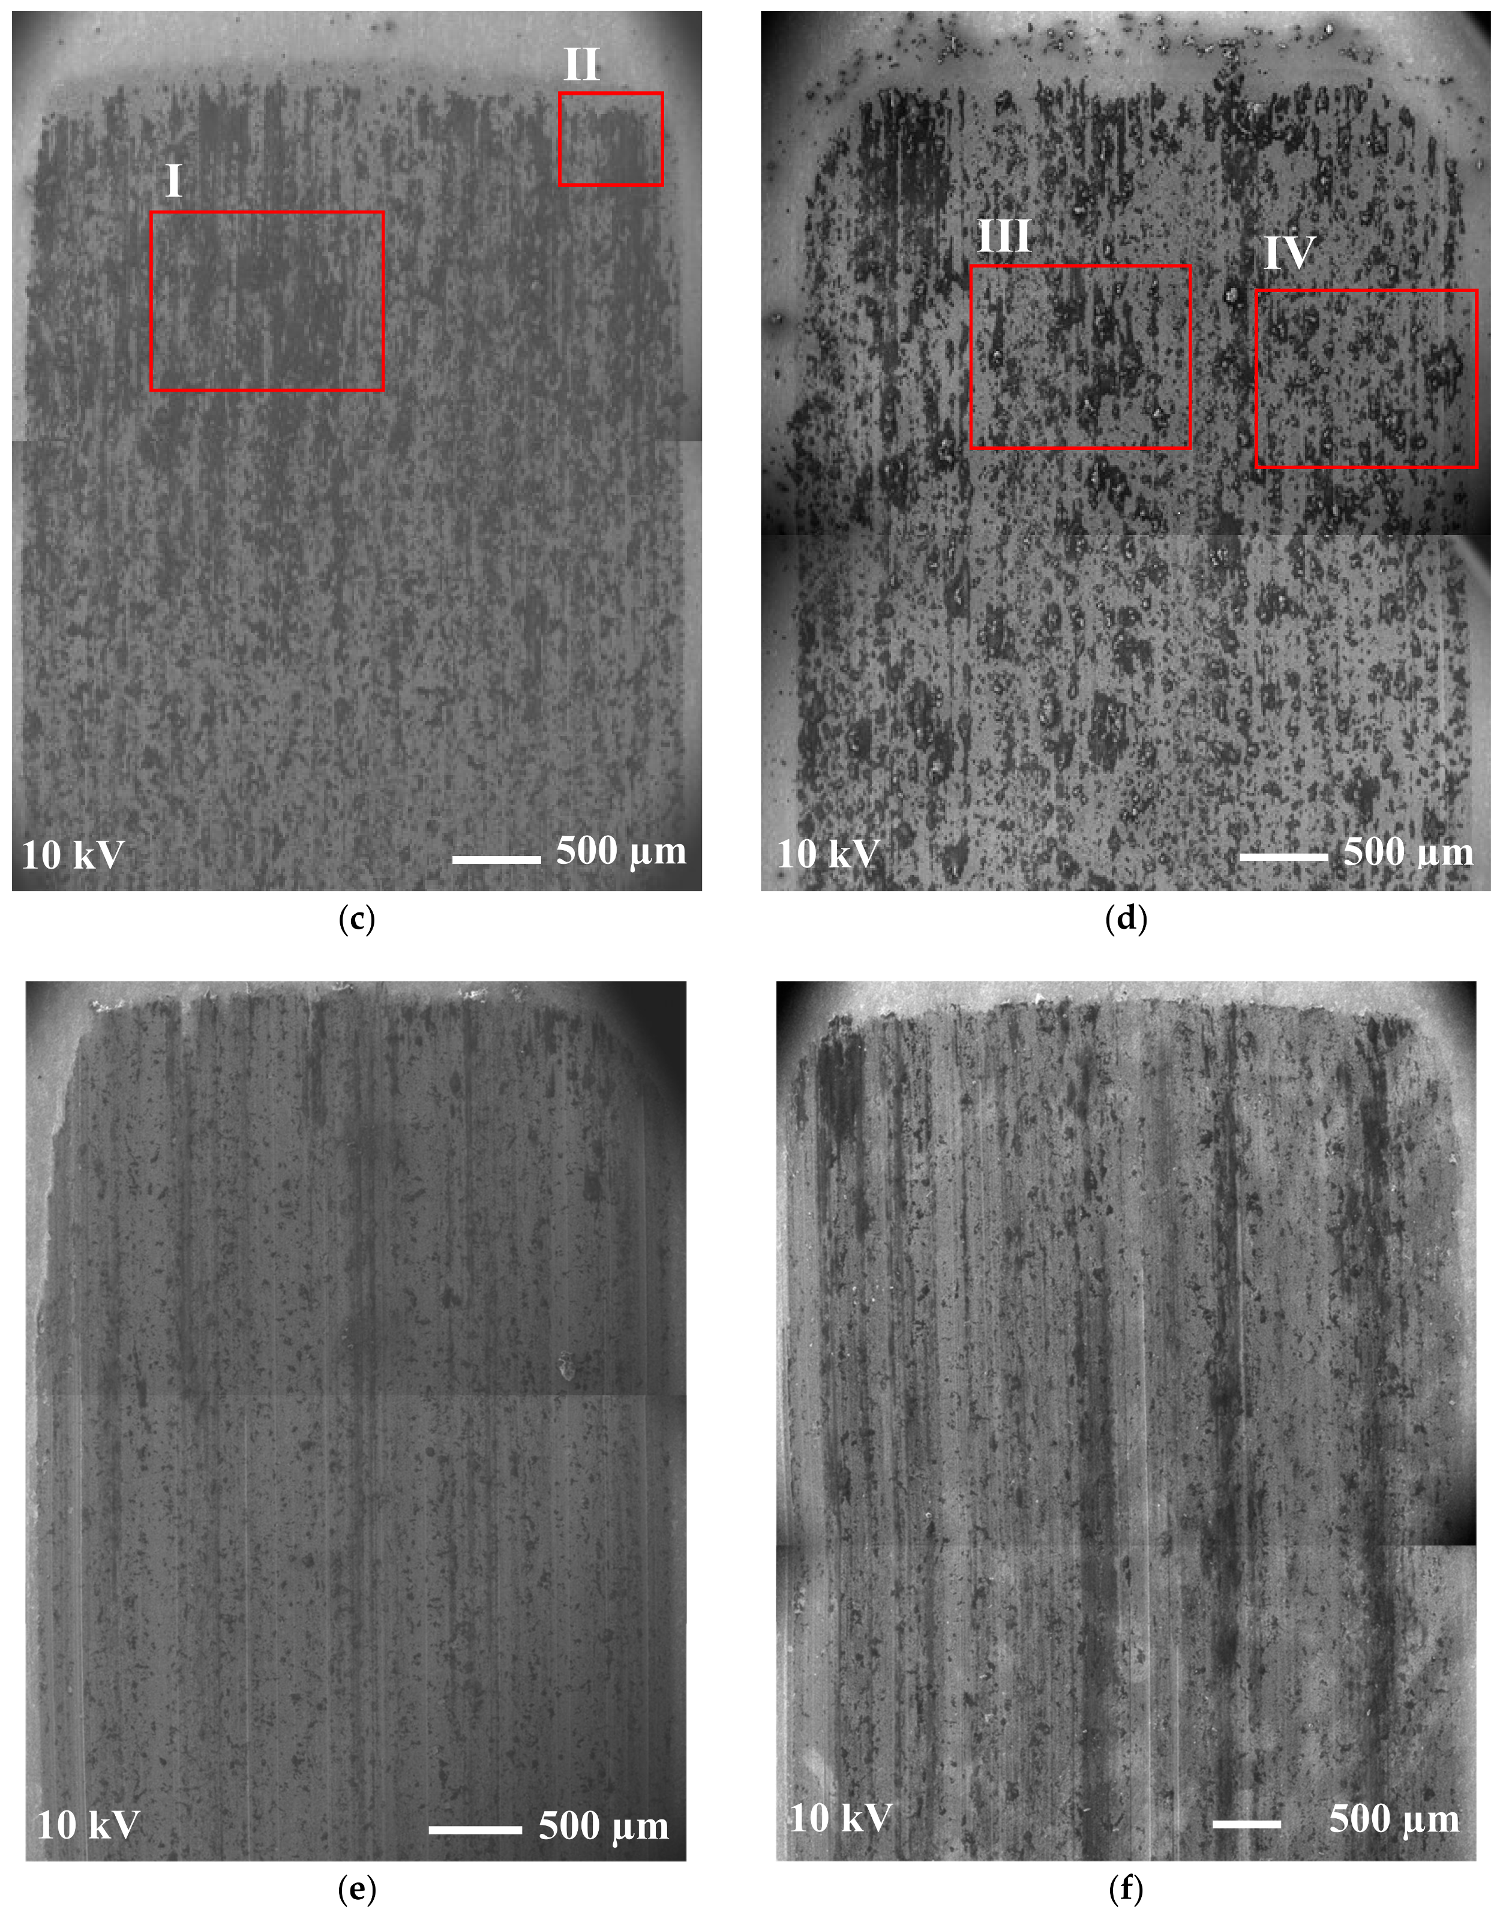
In order to study this behavior further, EDS analysis of the transferred layers was performed in several locations for each wear track. Four of the selected ROIs for ThorPlas are marked in Figure 15. The corresponding SEM micrographs at higher magnifications for the ROI are presented in Figure 16. For each area, EDS spectra are presented for two locations providing typical elemental content in the region. In Table 6, obtained EDS spectra are presented for areas corresponding to the lower pressure and in Table 7 to the higher pressure.
Comparing the elemental content for the two pressures, it can be observed that the transferred layers formed at the higher pressure contain higher amounts of the solid lubricants elements (fluorine and silicon) aiding lower COF. It should be mentioned that some locations for the wear tracks contained as much as 14.4 wt % fluorine and 3.8 wt % silicon. Similar findings were observed while studying the transferred layers deposited in tests performed with Orkot, indicating that, at higher pressures, solid lubricants were squeezed from the bulk of polymer at greater rates, depositing on the counter surface and contributing to lower friction observed. The mechanism bears similarities with a wet sponge: the harder it squeezed, the more water gets out.
This effect may also explain the wear increase caused by insufficient lubrication at higher sliding speeds and lower pressures.
Surface analyses were also performed on the worn polymer pins that have caused the wear tracks on the counter surface shown in 
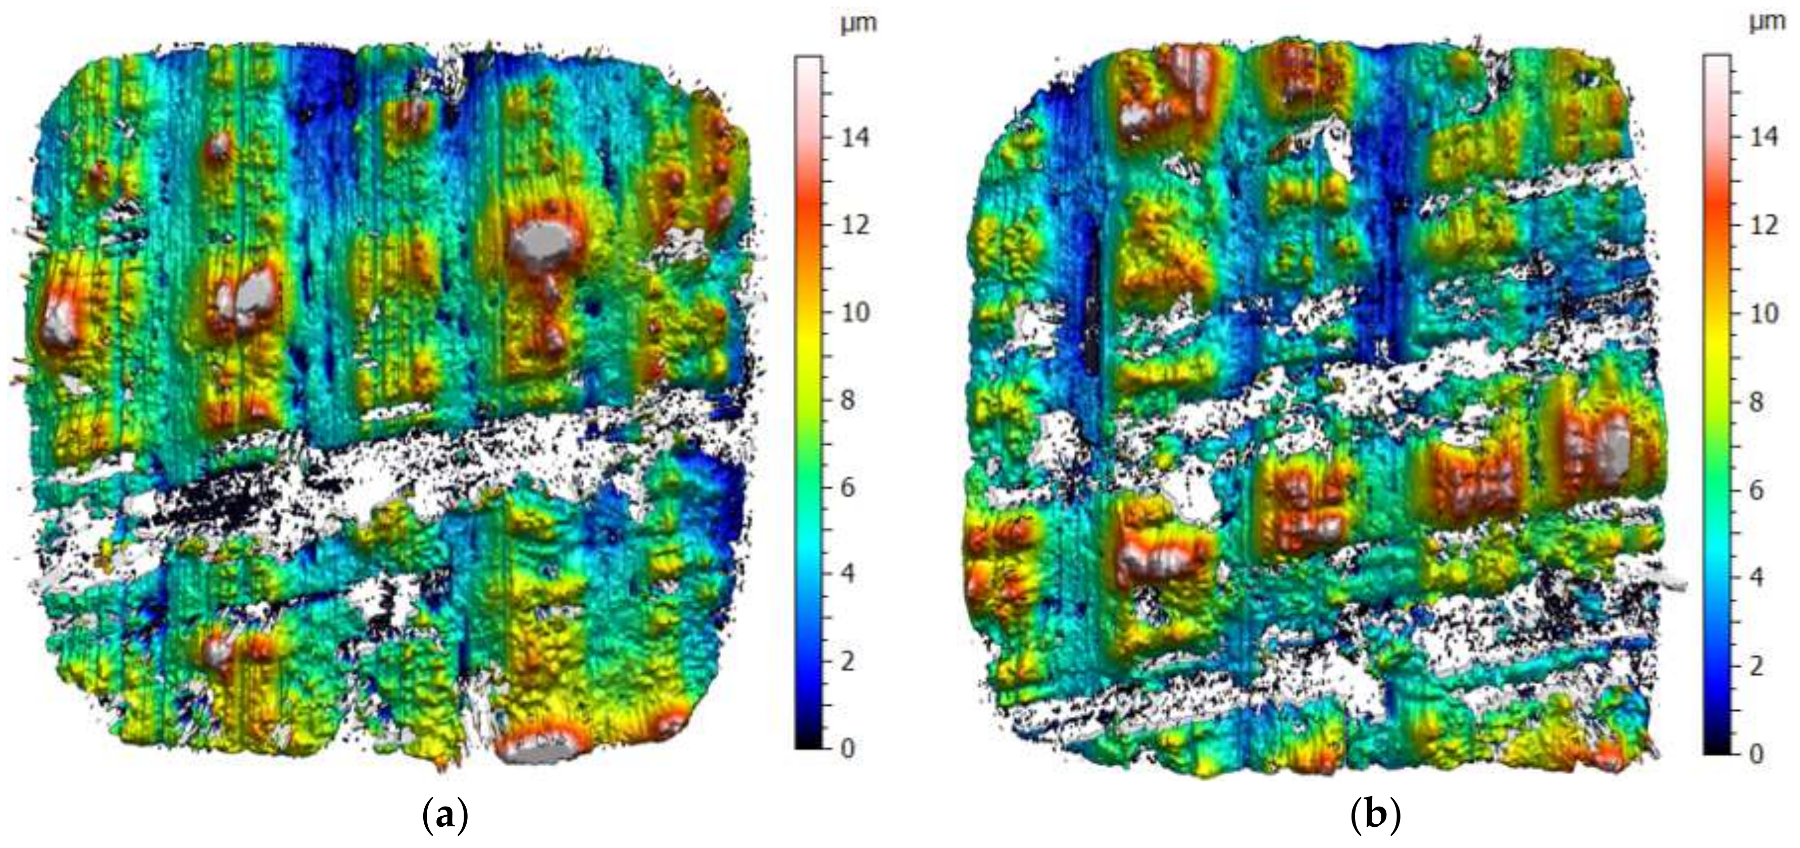
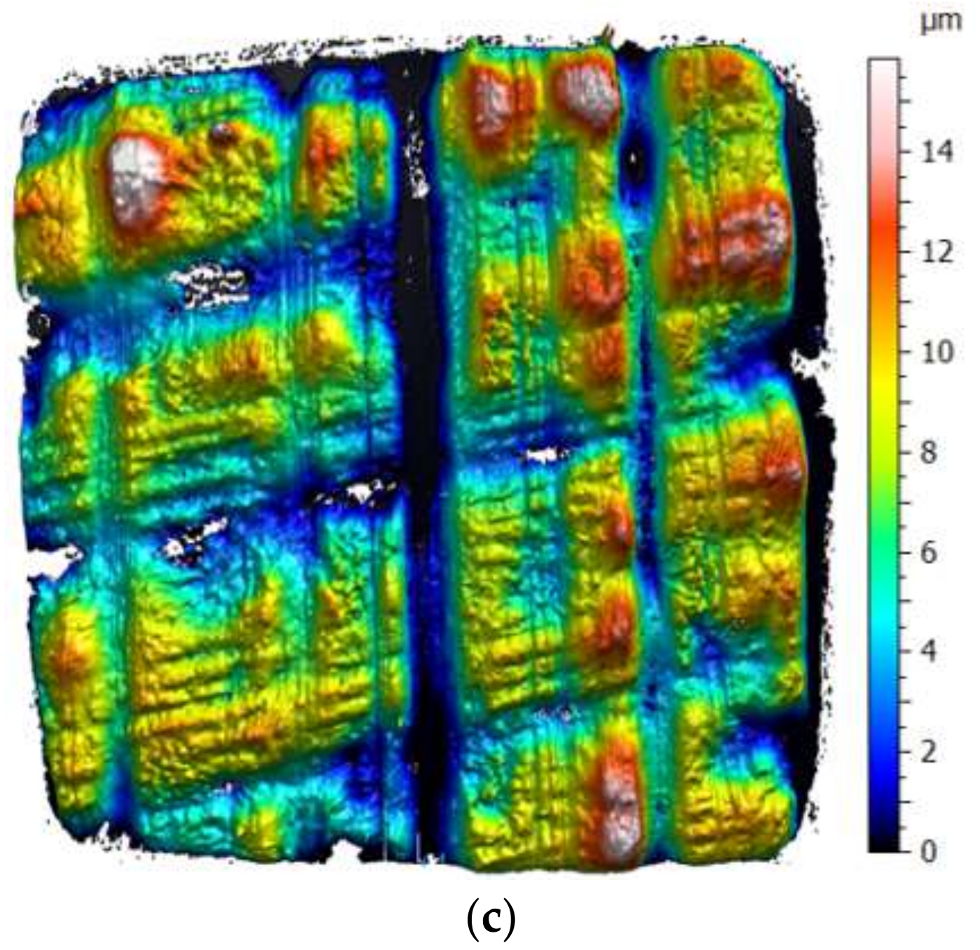
Figure 15. Surface topography of worn Orkot polymer pins, after sputtering, is presented in 
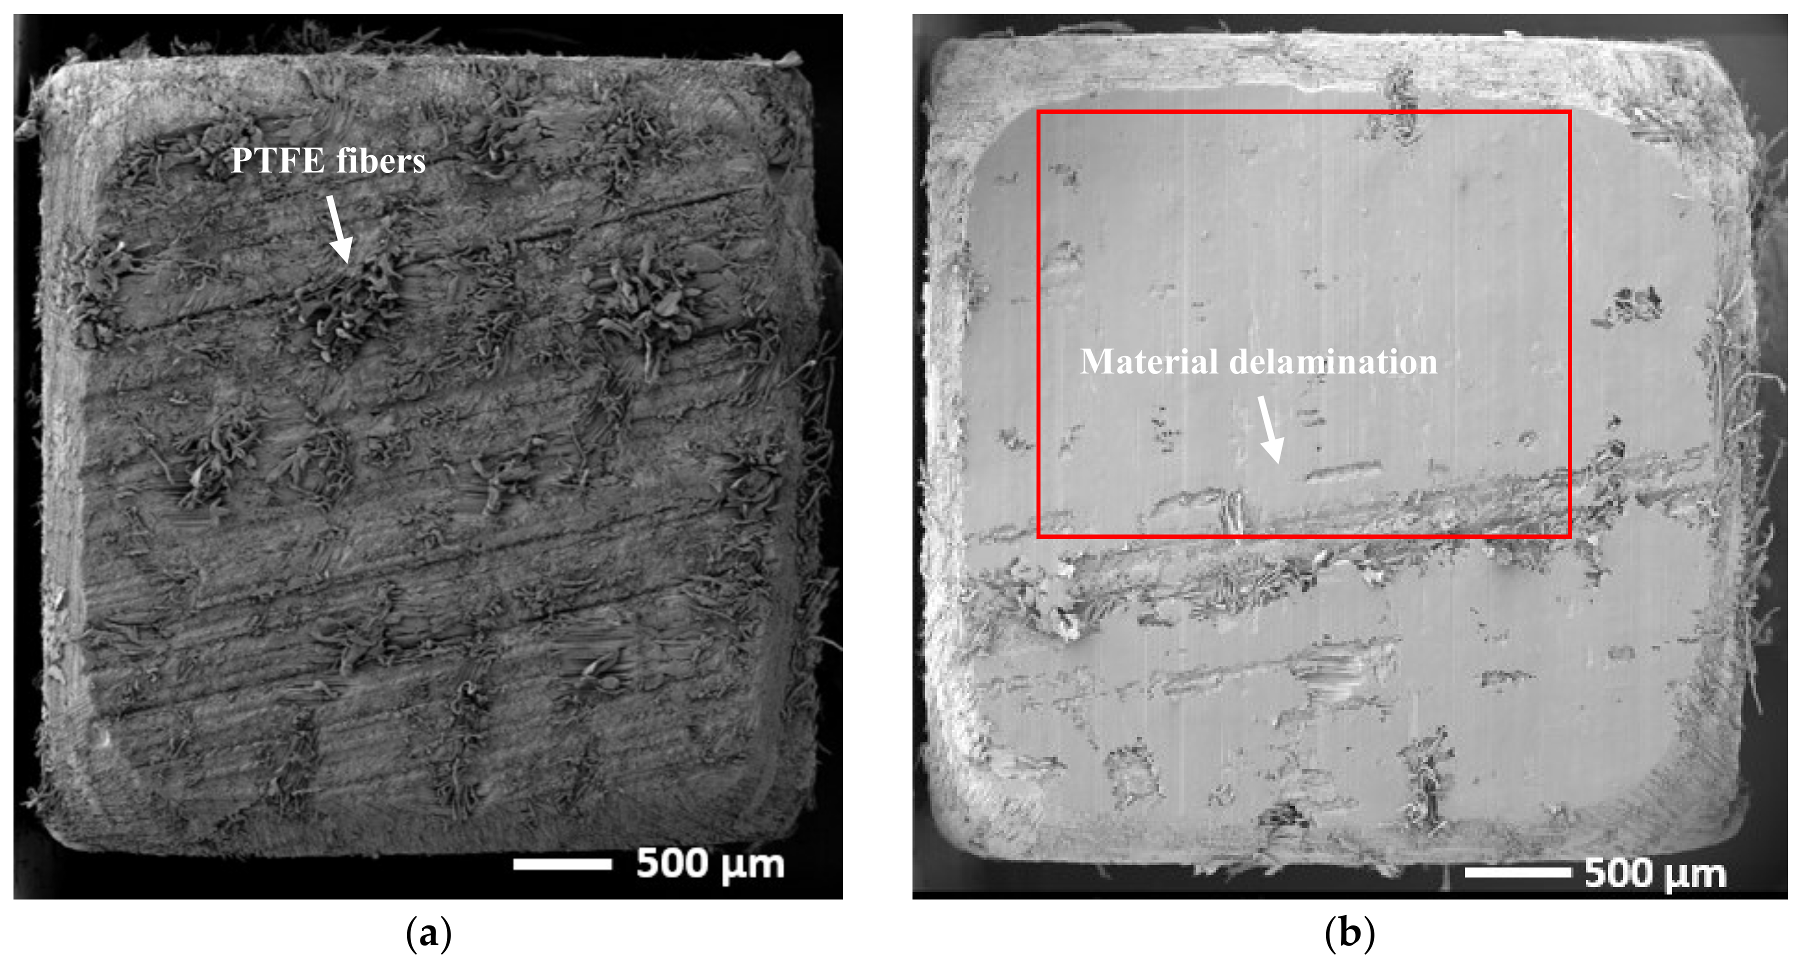
Figure 17 with the higher areas reflecting the PTFE weft. The corresponding SEM micrographs are presented in Figure 18. In addition, a SEM micrograph of an unworn surface is shown in Figure 18a, where the PTFE fibers (weft) protruding the surface can be clearly seen. Several attempts were made to measure surface topography of the unworn surface. However, because of the nature of the material, too much of the light was scattered. Moreover, regions of the worn polymer surfaces subjected to larger losses of material of the deposited material resulted in missing data points for the surface topography measurements seen as white areas in Figure 17.
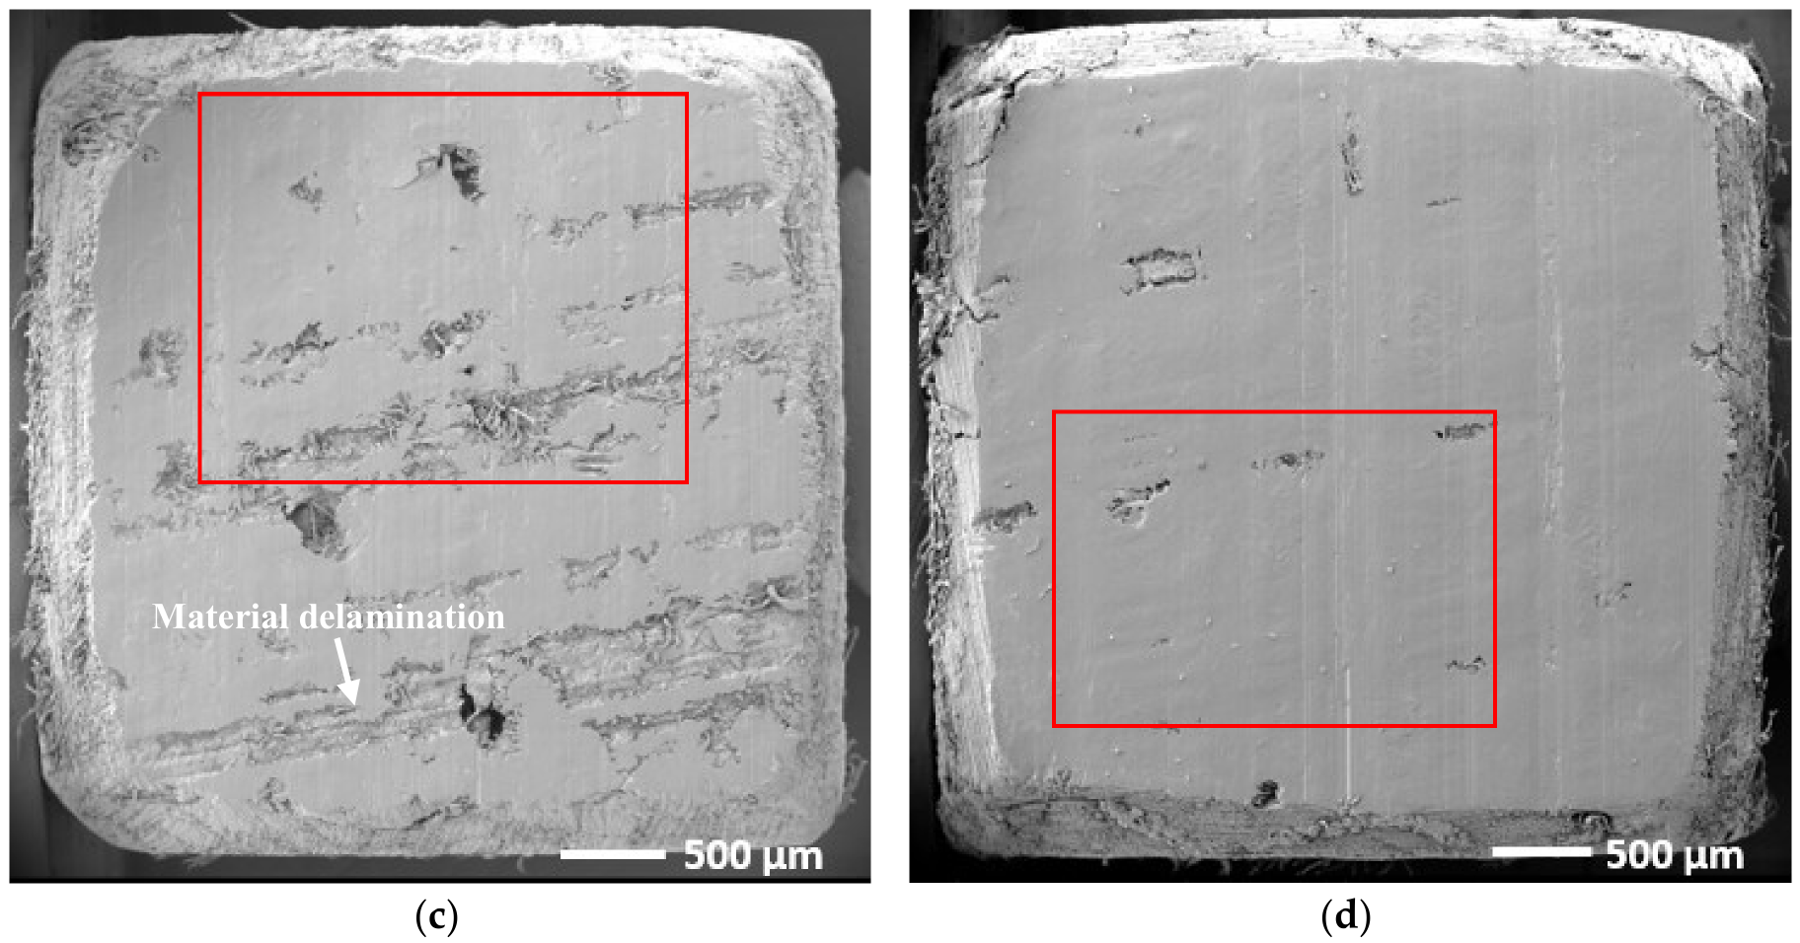
Surface topography and SEM micrographs of the polymer pins show that less material wear occurs at higher contact pressure. At low pressures, a higher rate of material delamination from the surface can be observed. Comparing pin surfaces worn at the two different sliding speeds (10 at 40 mm/s) and the same nominal pressure (9 MPa), it appears that the wear is more severe at the higher sliding speed, with significant losses of material observed from wider areas. Moreover, deeper valleys between the PTFE weft are formed at higher sliding speed, confirming higher wear of the warp. This is consistent with the higher specific wear rate coefficient observed for higher sliding speeds, as shown in Figure 12.
An explanation for the higher wear of the polymer pins at low pressure is the poorer lubrication between the pin and the material deposited on the stainless steel counter surface (transferred layers formed on the wear track, Table 6). Higher sliding speed leads to higher temperature in the contact zone, making the pin material softer and easier to shear. This causes more wear at low pressures when the lubrication is insufficient.
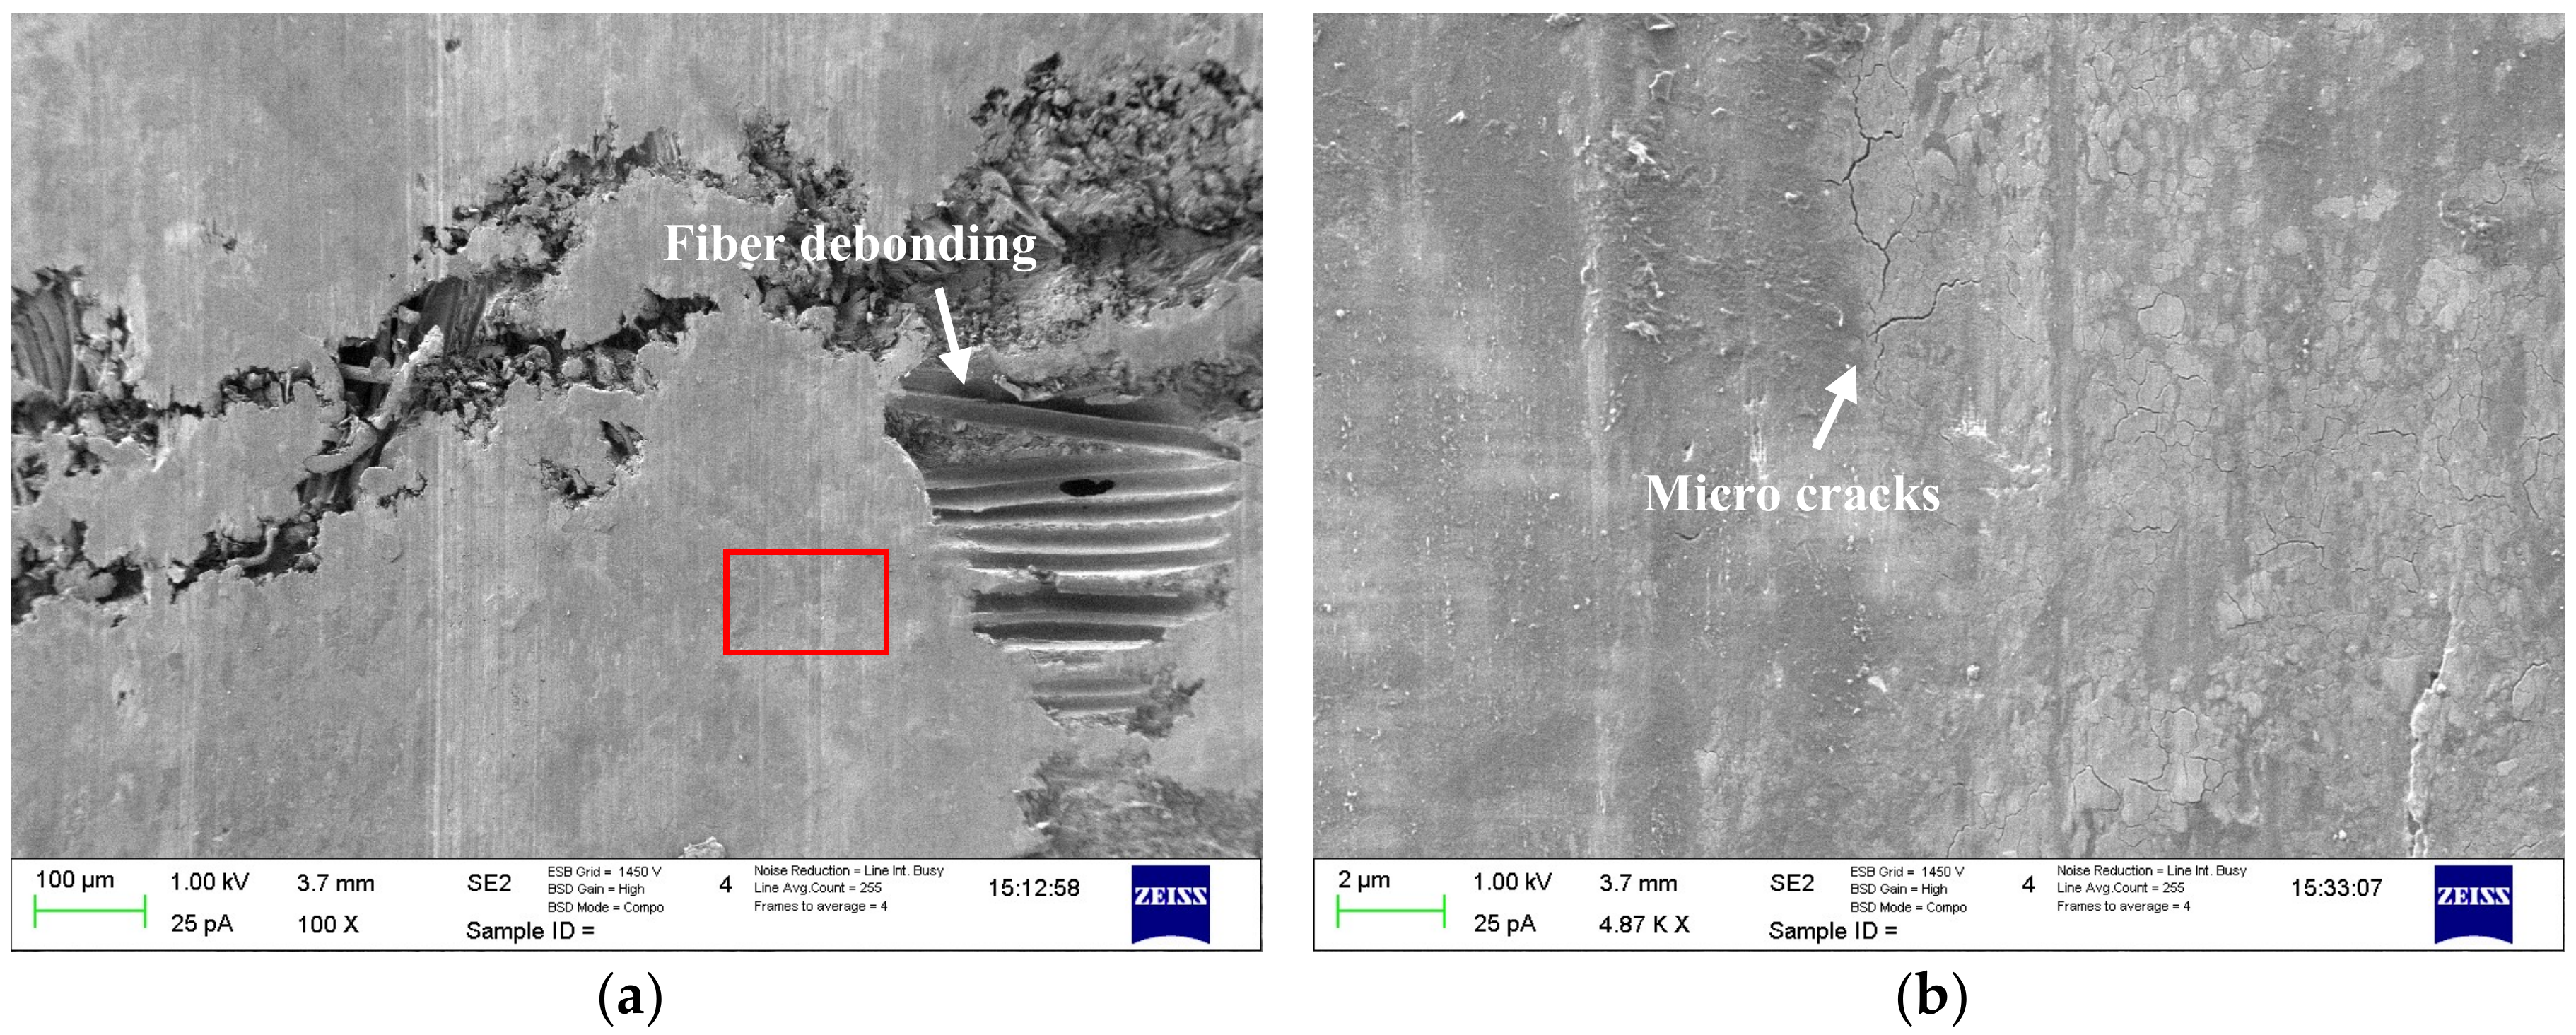
Studying the material delamination, clear traces of fiber debonding from the polymer matrix can be observed, as illustrated in Figure 19. Furthermore, micro cracks can form on the surface, potentially causing delamination of material and exposure of unprotected fibers that can be peeled off by shear during the sliding motion.
A following explanation for the material delamination can be proposed: PTFE requires a certain amount of energy to be released from the fiber and deposited on the running faces to form a low shear layer. A micro-scale stiffness variances of the matrix components (various E-moduli and some porosity/voids that can be seen in Figure 6 and Figure 8) can cause the deposited PTFE to shear or break off at certain areas. Because of these variations, there might be vibration of different amplitudes that could aid with detaching of the deposited material.
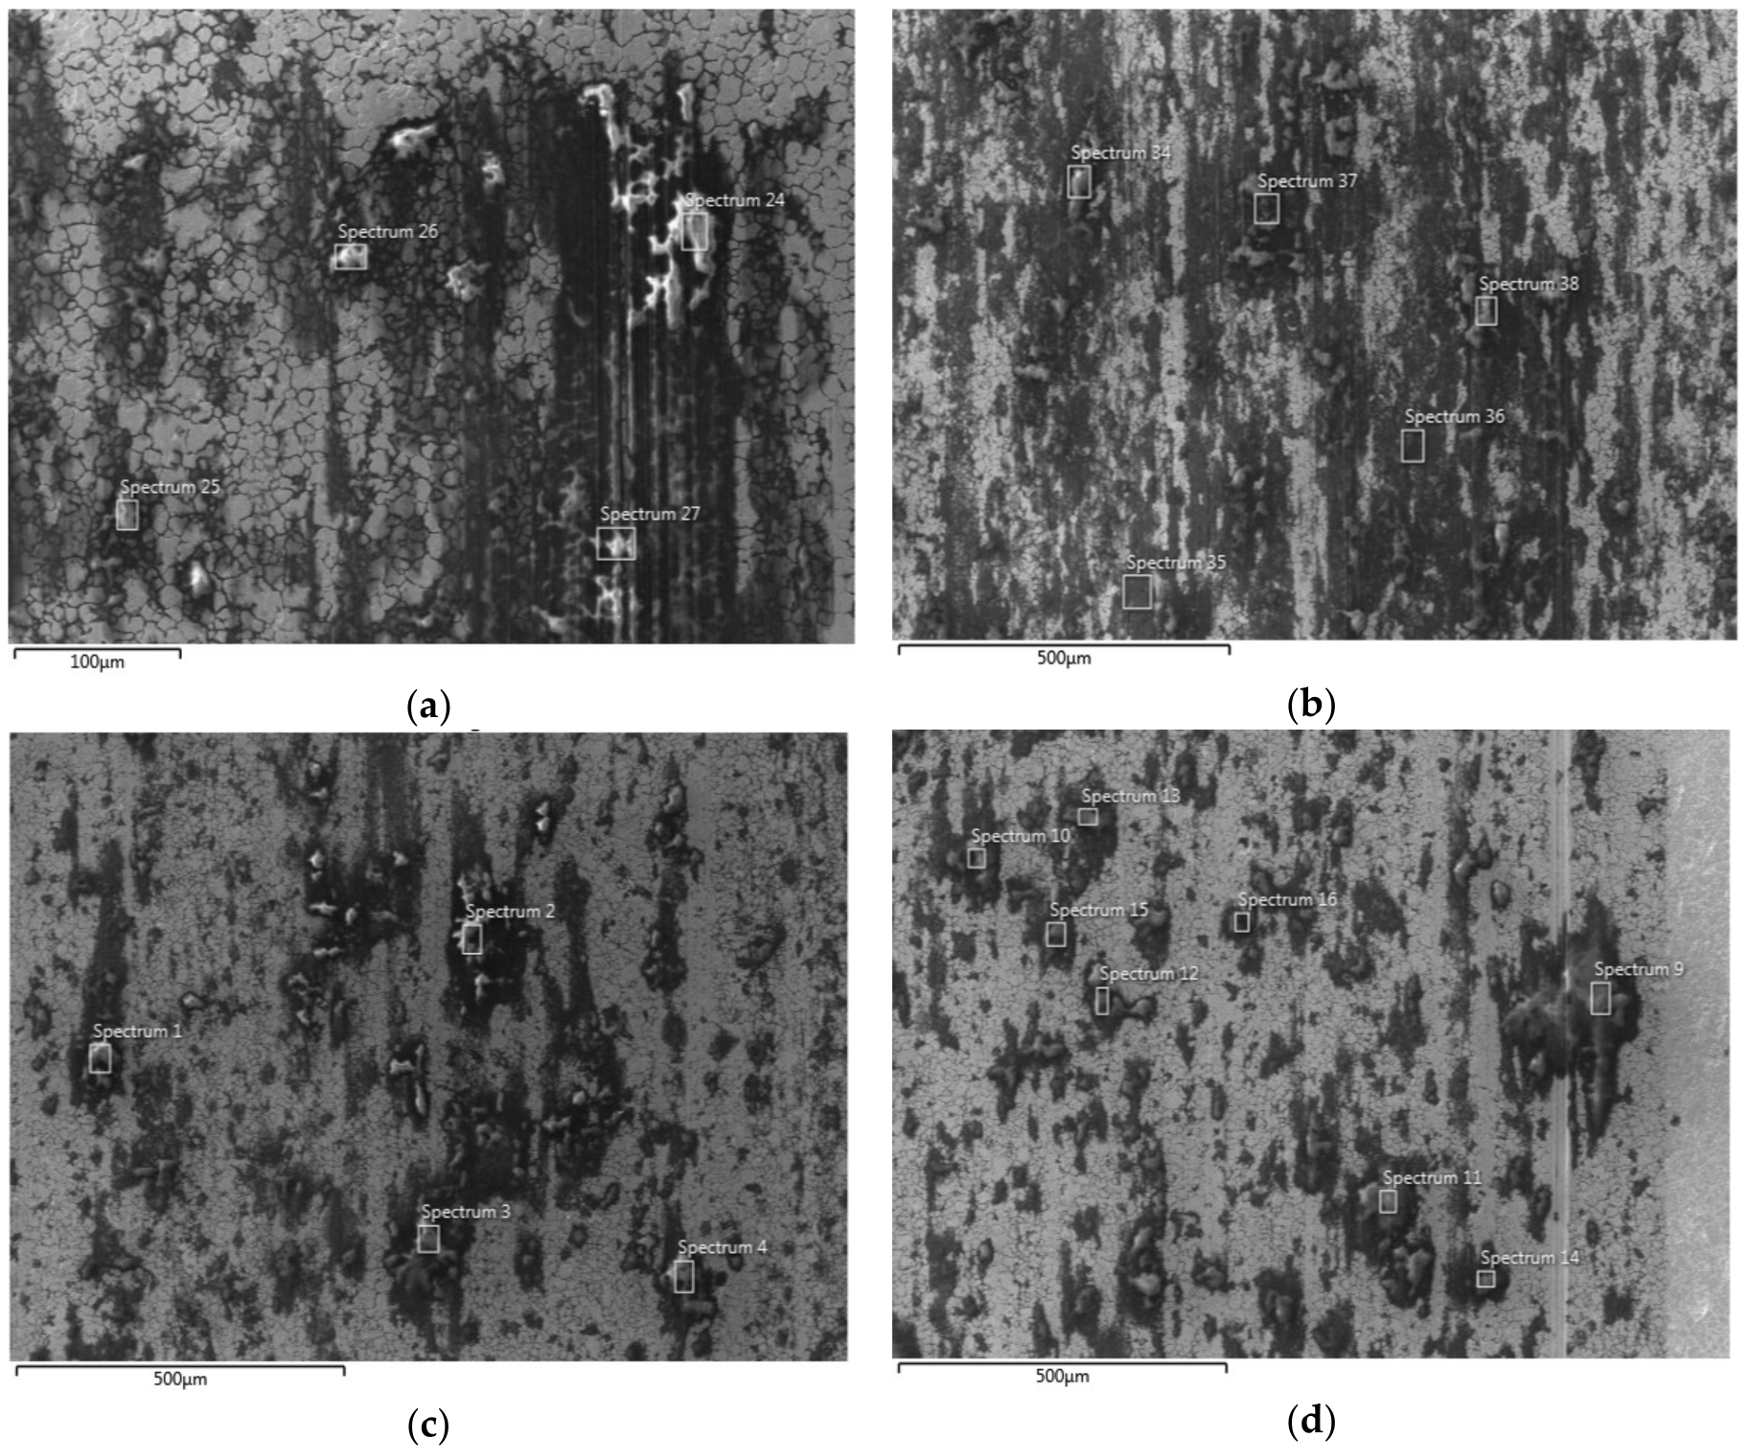
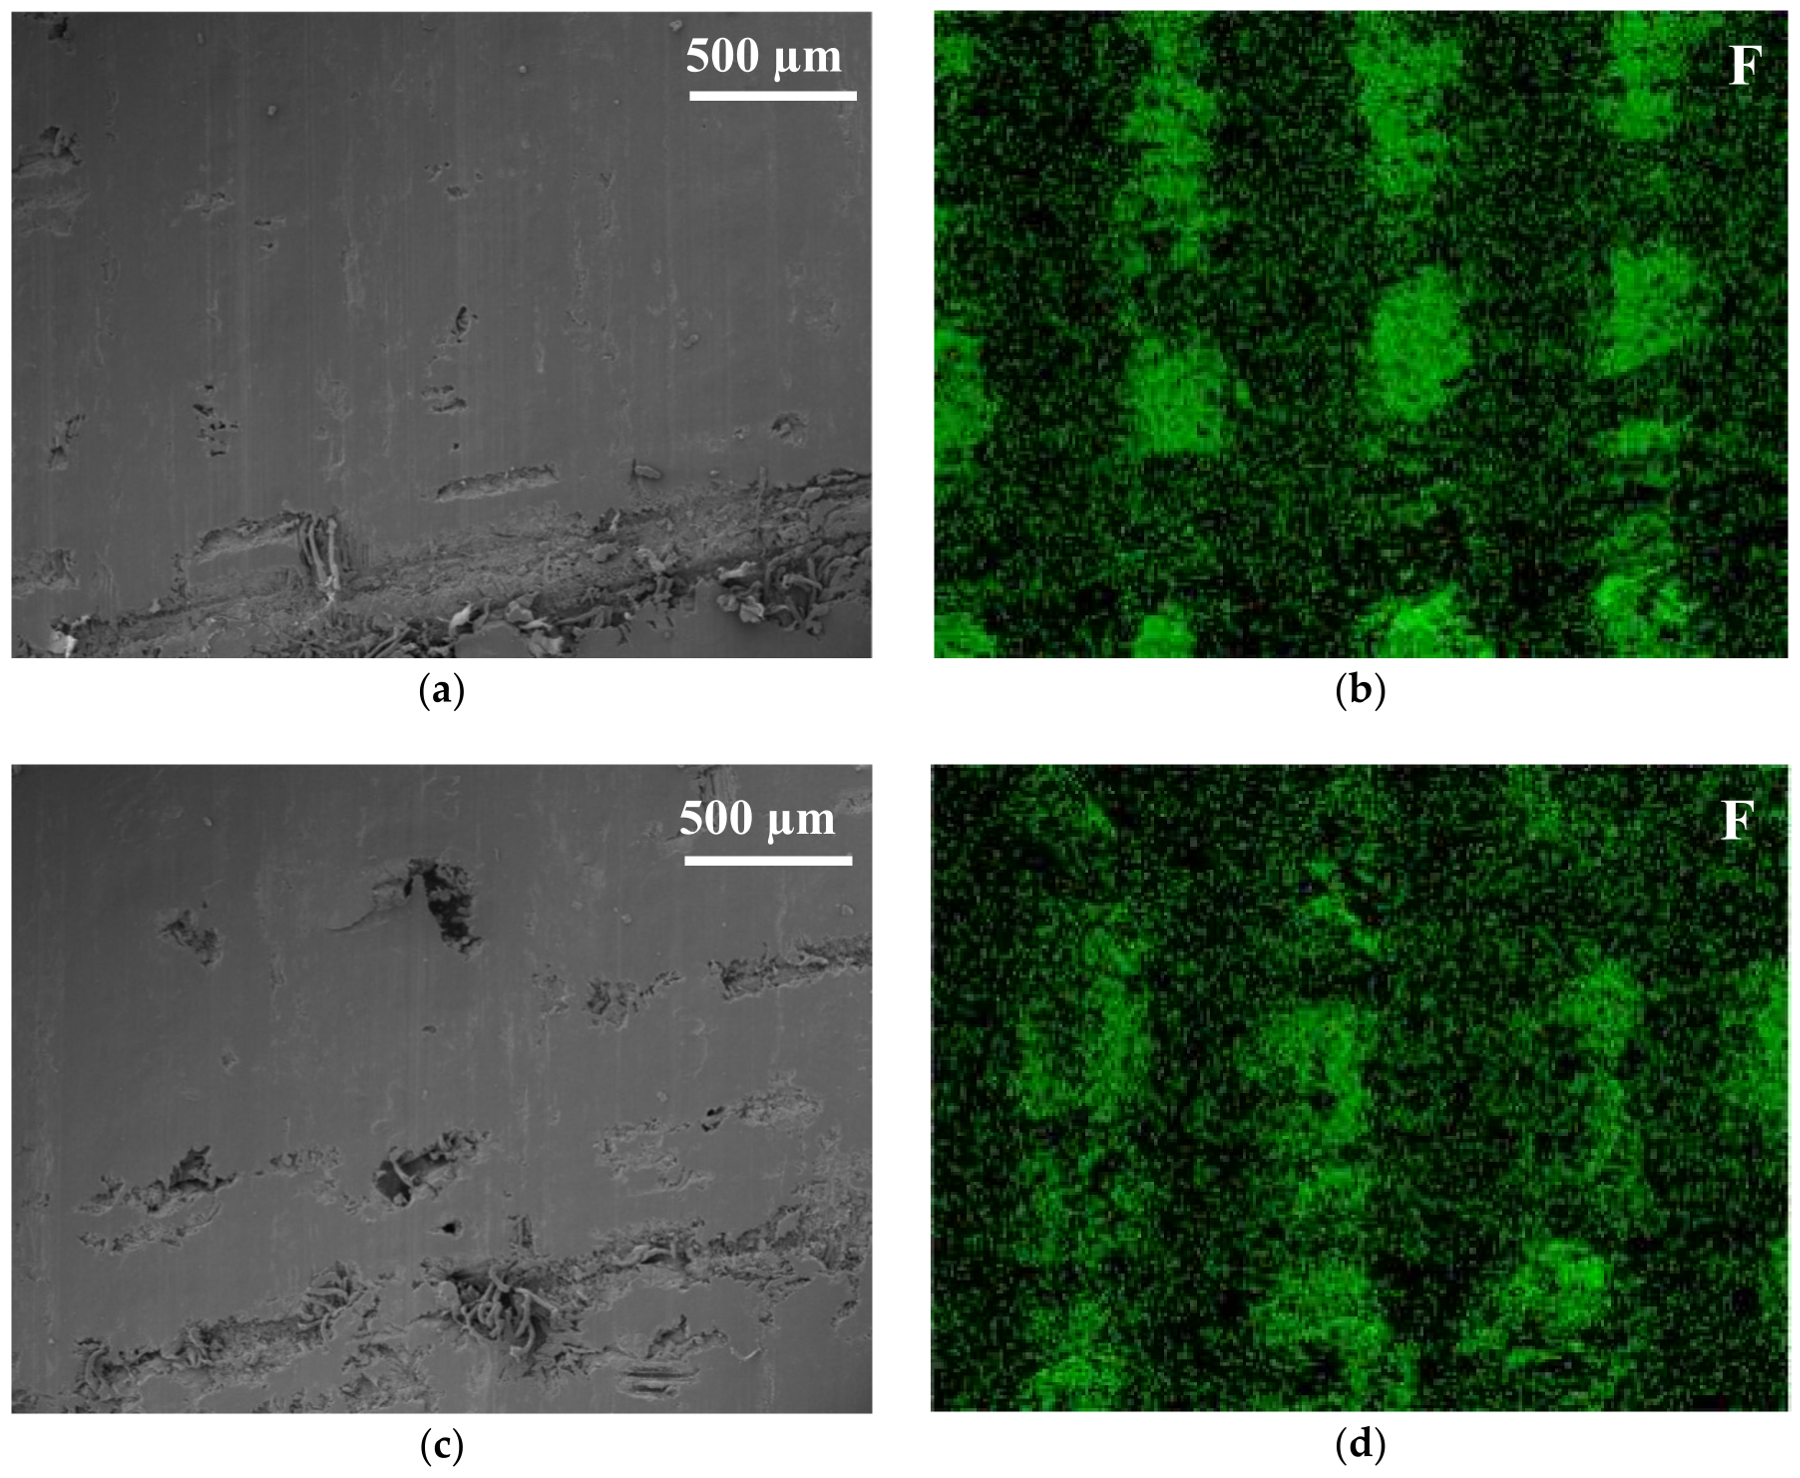
Additional surface analysis on the polymer pins was performed by EDS compositional mapping of the regions marked in Figure 18. SEM micrographs of the ROI at higher magnifications and corresponding compositional maps of fluorine are presented in Figure 20. The EDS spectra of the compositional maps are shown in Table 8. Comparing the elemental content for the different operating conditions, higher fluorine concentrations can be observed for the sliding experiments done at higher pressure. Moreover, from the compositional maps for the same conditions it appears that the fluorine is smeared out in the sliding direction, contributing to better lubrication (as the solid lubricant cover a larger area) and thus to less wear of the surface. This may explain the lower COF observed at higher pressures (Figure 11) and less polymer wear (Figure 17).
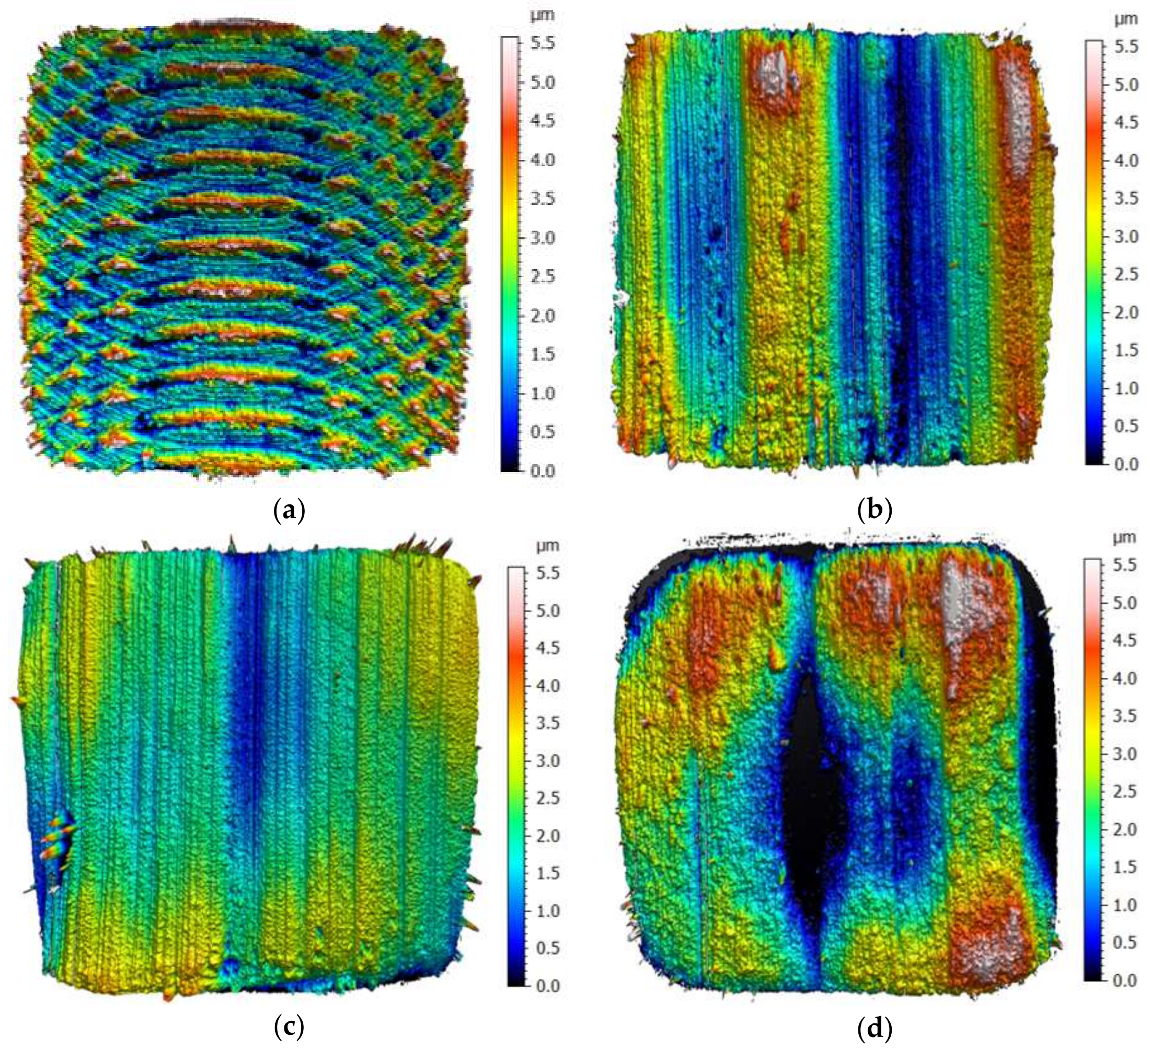
Surface analysis was also performed on the worn and an unworn ThorPlas polymer pins that have caused the wear tracks on counter surface shown in Figure 15. Surface topography of ThorPlas polymer pins, after sputtering, are presented in Figure 21 and the corresponding SEM micrographs are shown in Figure 22. Surface topography of the unworn surface (
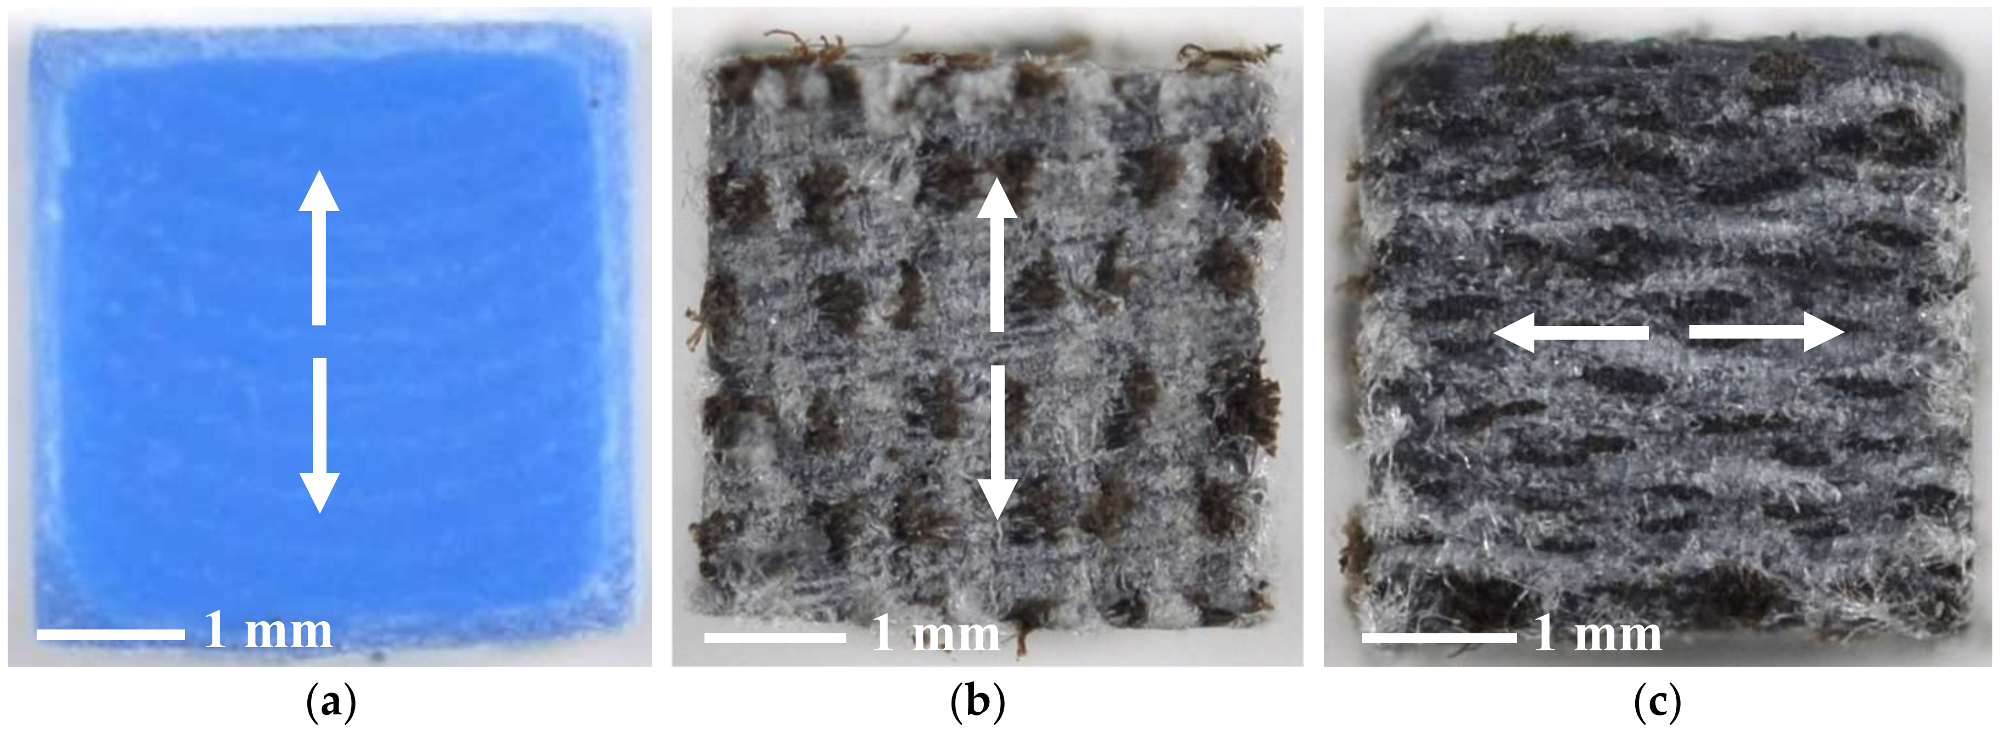
Figure 21a) shows traces from manufacturing (milling) of the polymer pin. These traces can also be observed in the image of the polymer pin presented in Figure 1a. Surface topography of the worn polymer pins shows no such traces and it can be concluded that the milling rests were removed during the sliding test.
For low sliding speed and low nominal pressure (10 mm/s and 9 MPa, 
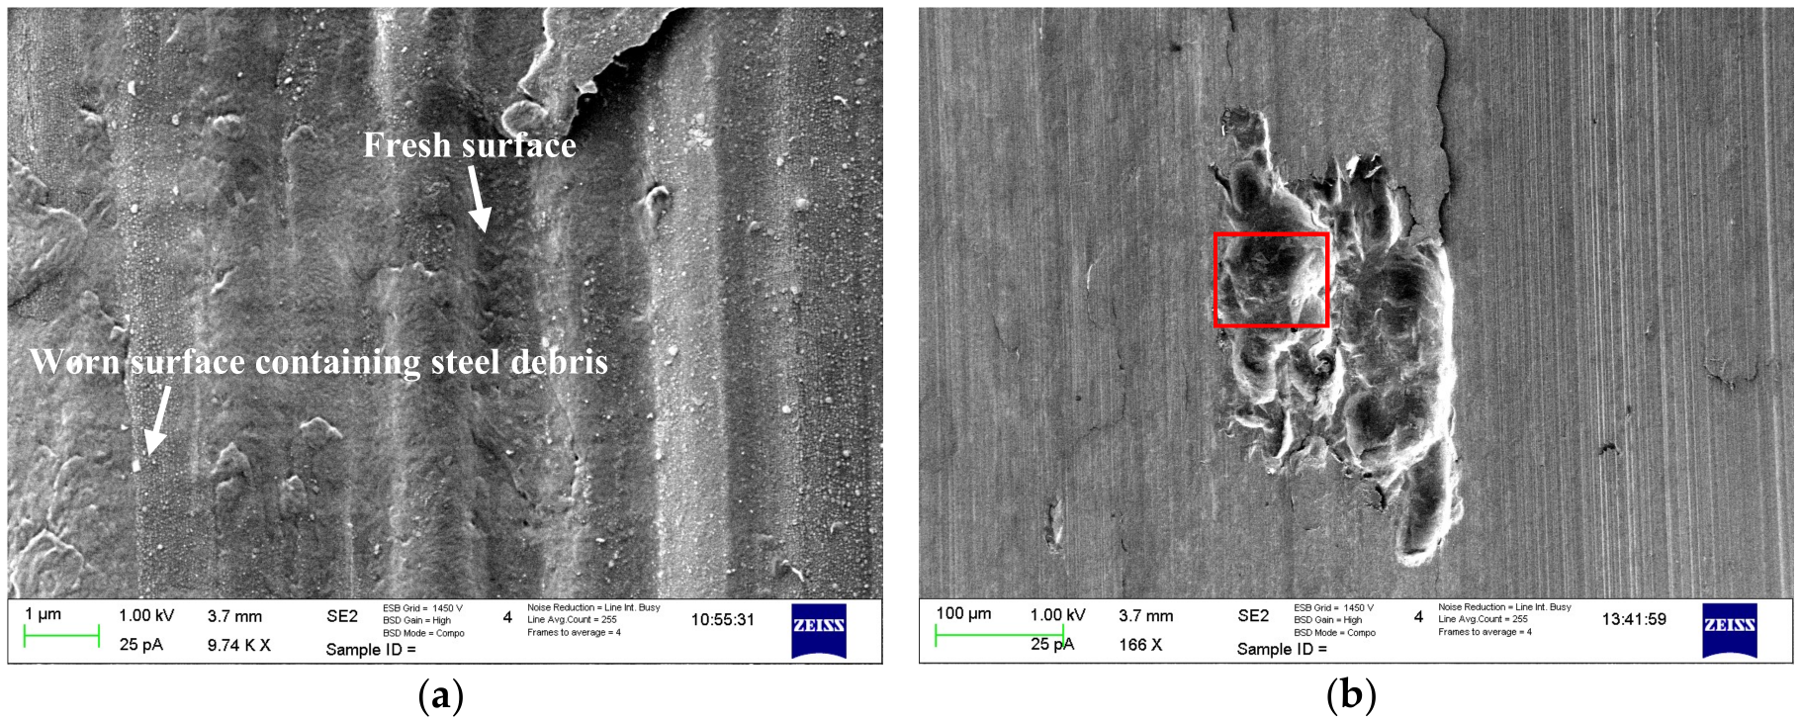
Figure 21b), two broad valleys are formed in the surface topography, indicating that these regions experienced higher wear than the rest of the surface. Furthermore, on the sides of these valleys, higher peaks are seen indicating accumulation of adhered material on the surface. It appears as if a part of the removed material excavated from the valleys has been ploughing up to the sides and adhered to the surrounding regions. Such formation can be seen even better in Figure 23a, showing the surface of an unsputtered polymer pin at higher magnification. In the SEM micrograph, traces of micro-ploughing are clearly visible alongside with fresh (unaffected) polymer surface and worn (exposed) surface containing nano-particles of steel debris. Thus, the surface is subjected to an on-going evolution process during the reciprocating sliding, where the part of worn surface is removed due to micro-ploughing and new fresh surface forms.
At the same nominal pressure (9 MPa), higher sliding speed (40 mm/s) results in more homogeneous surface wear, except for smaller regions in the middle, which are subjected to more severe wear (Figure 21c). It seems that the material becomes softer when the sliding speed and hence temperature in the contact is increased, resulting in a smaller area for the fresh material to re-deposit. Furthermore, close scrutiny of surface topography reveals that, along the abrasive wear tracks formed in the sliding direction, the dominant wear mechanism is adhesive wear in the small contacts. All these mechanisms together contribute to a higher COF and specific wear rate coefficient than observed at lower sliding speed.
The surface in the experiment with the same sliding speed but under higher nominal pressure (28 MPa at 40 mm/s) has been subjected to less wear than under other operating conditions tested (Figure 21d). A deeper valley has formed in the central region, reflecting significantly higher wear than the rest of the surface. Higher peaks can be seen in the regions surrounding the valley, made of the material removed from the valley and re-deposited in these regions during the reciprocating sliding. Less wear of the surface is consistent with the higher concentration of the solid lubricants measured in the transferred layers (Table 7), providing a lower COF and less shear of the polymer, i.e., smaller specific wear rate coefficient, observed in the tribological characterization (Figure 11 and Figure 12, respectively).
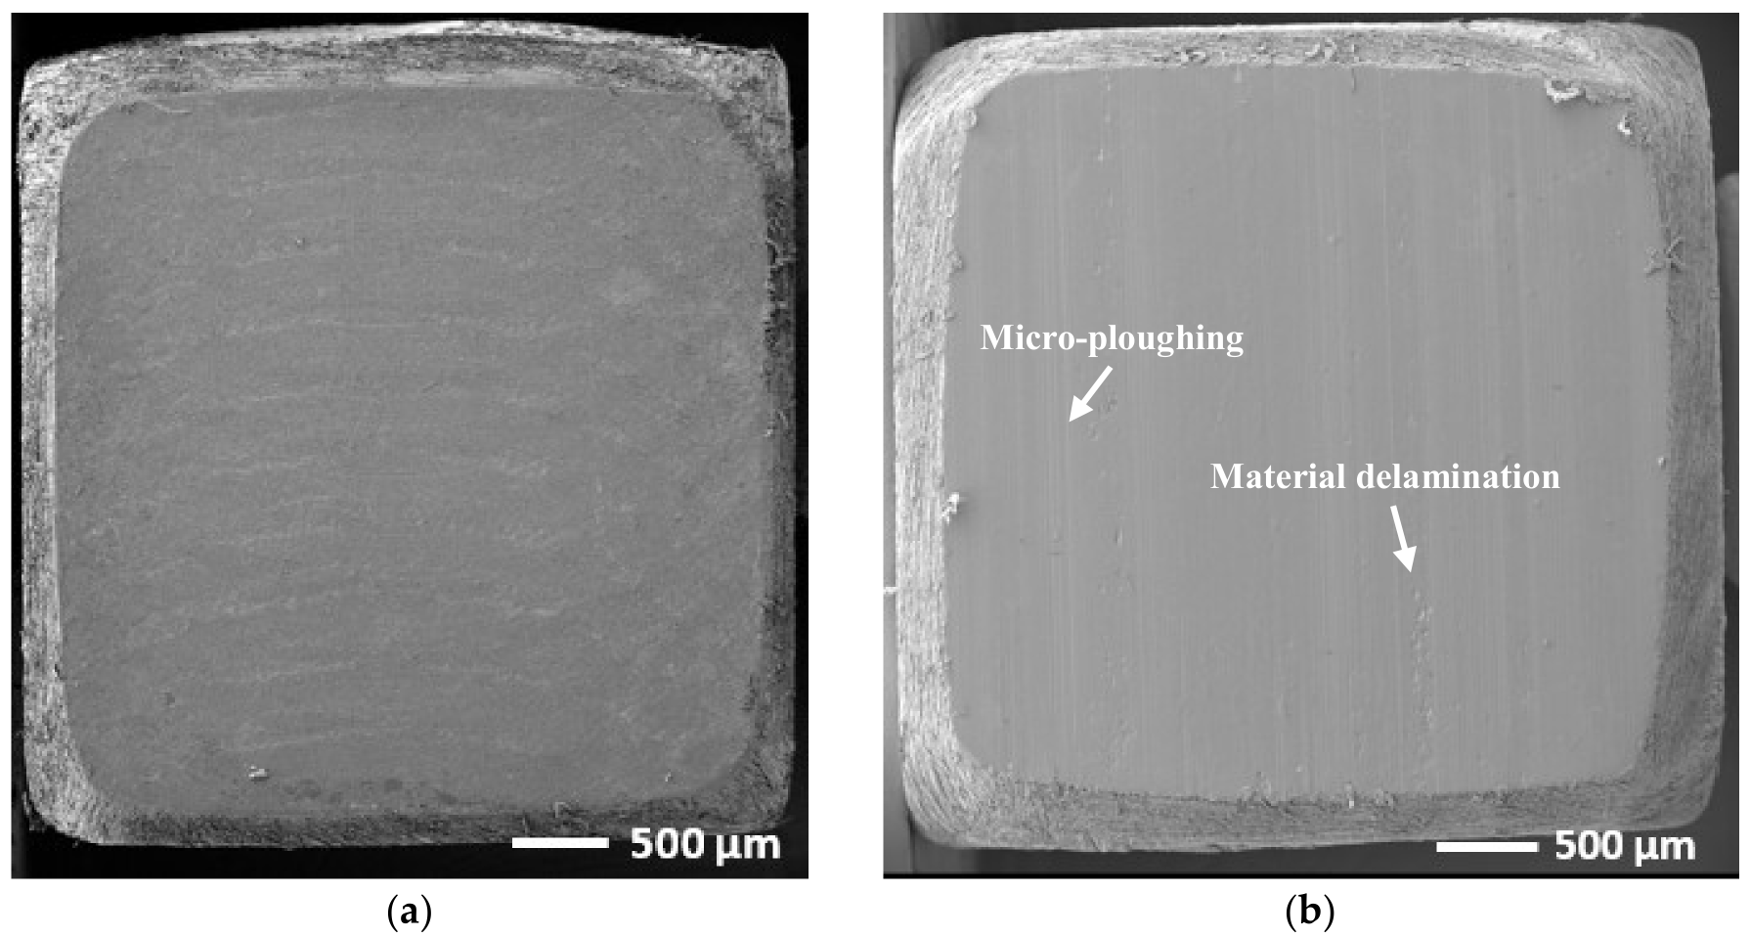
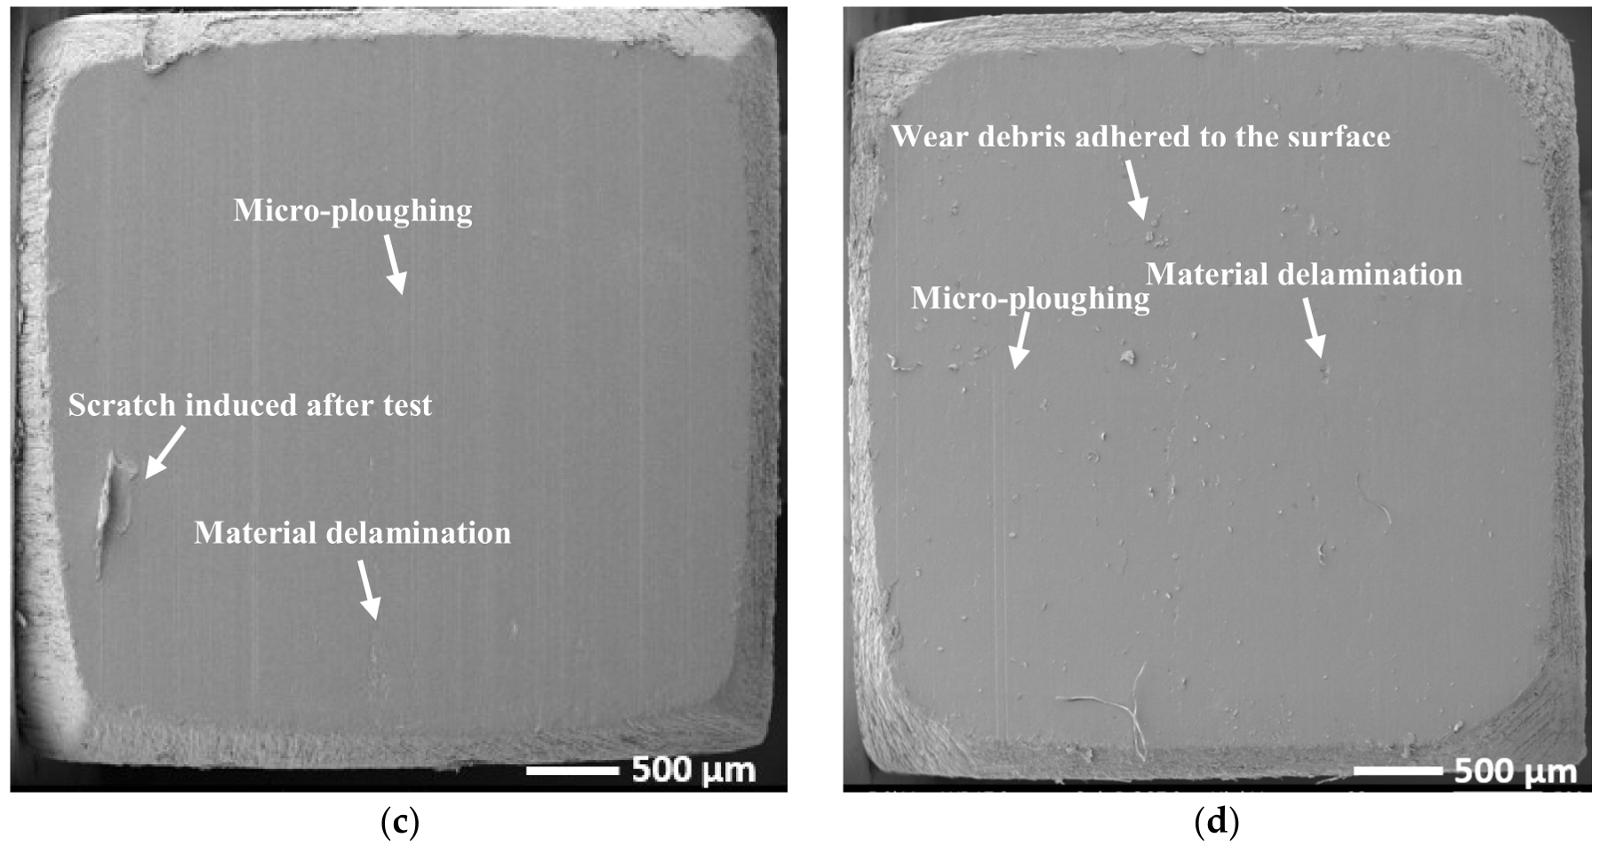
Worn polymer pin surfaces show traces of micro-ploughing and material delamination, visible in SEM micrographs (Figure 22). It appears that these effects are less prominent for the higher pressure operating condition. 
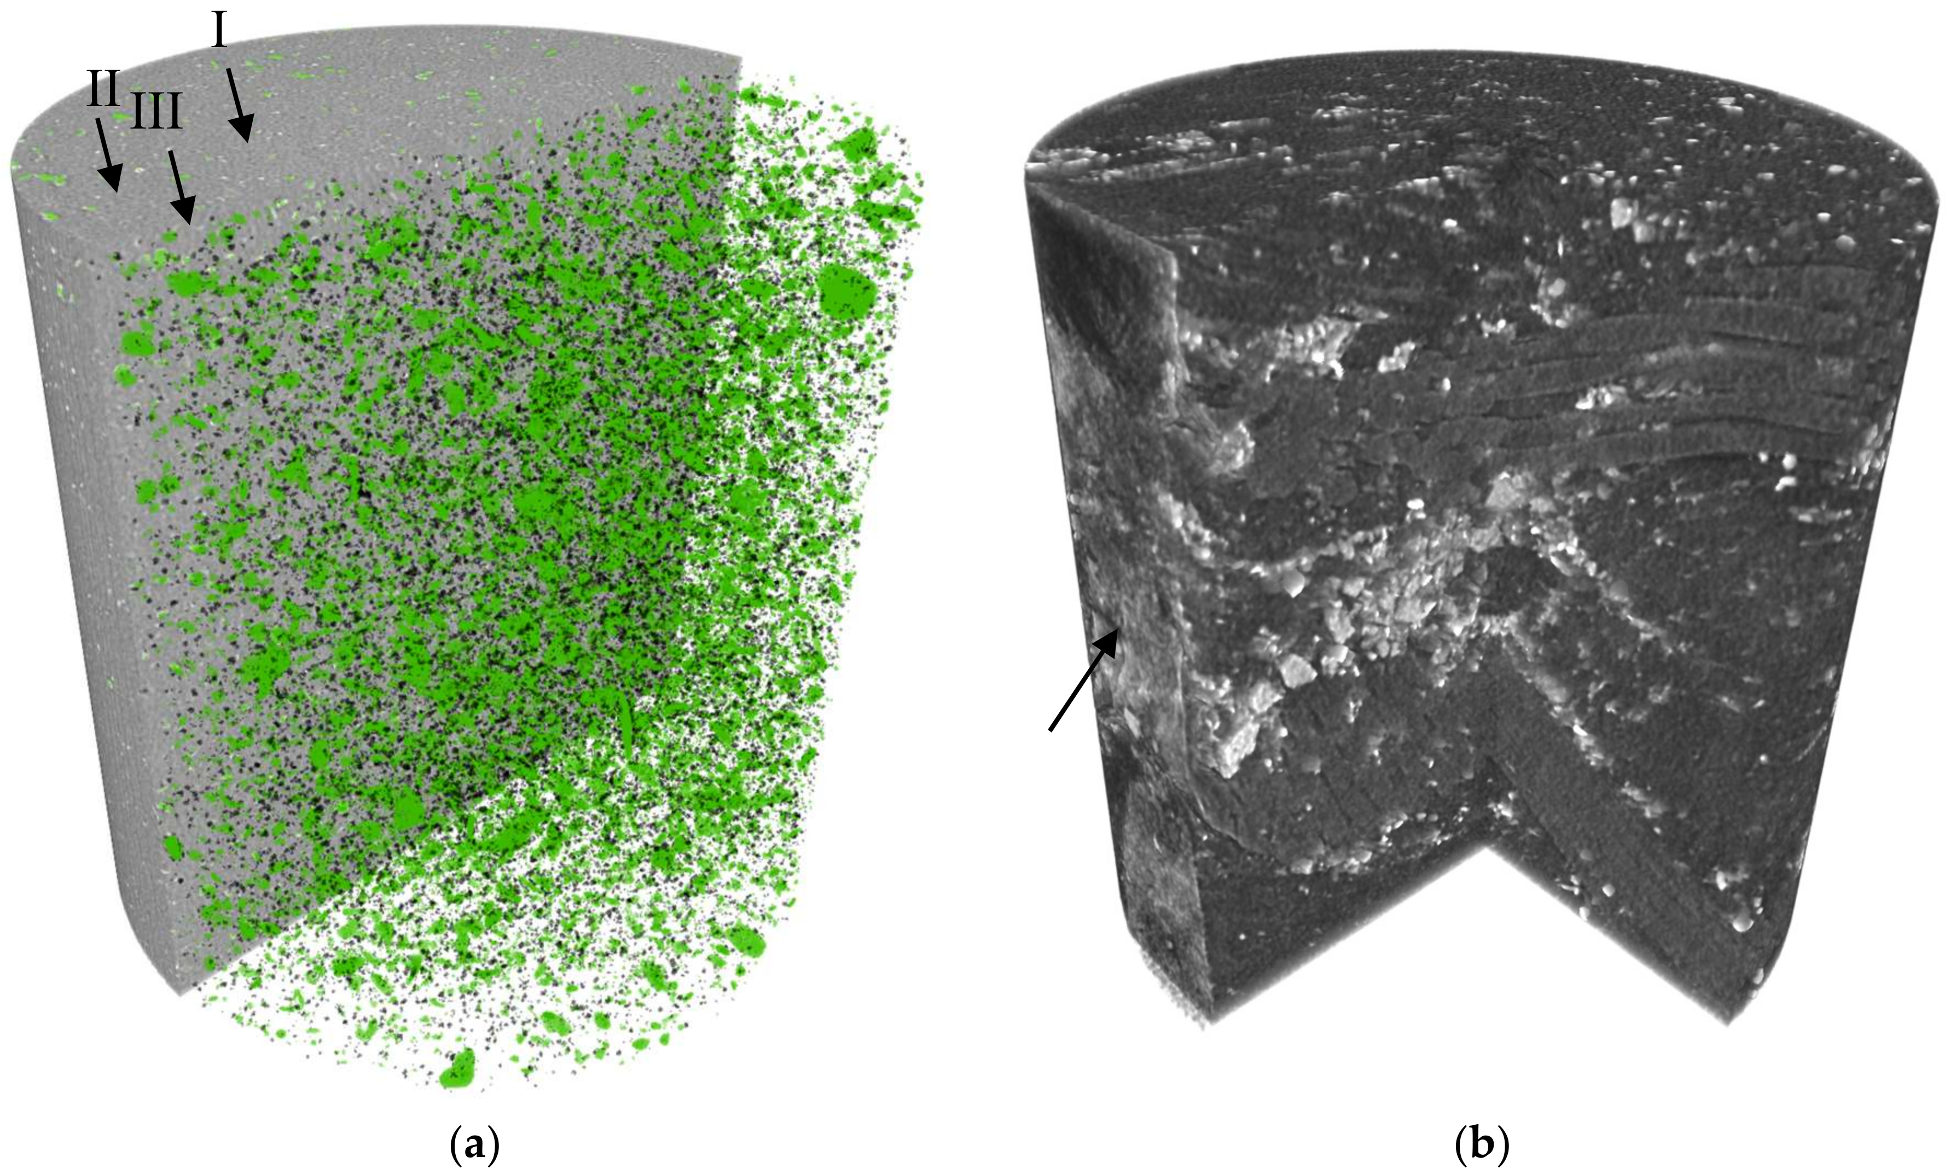
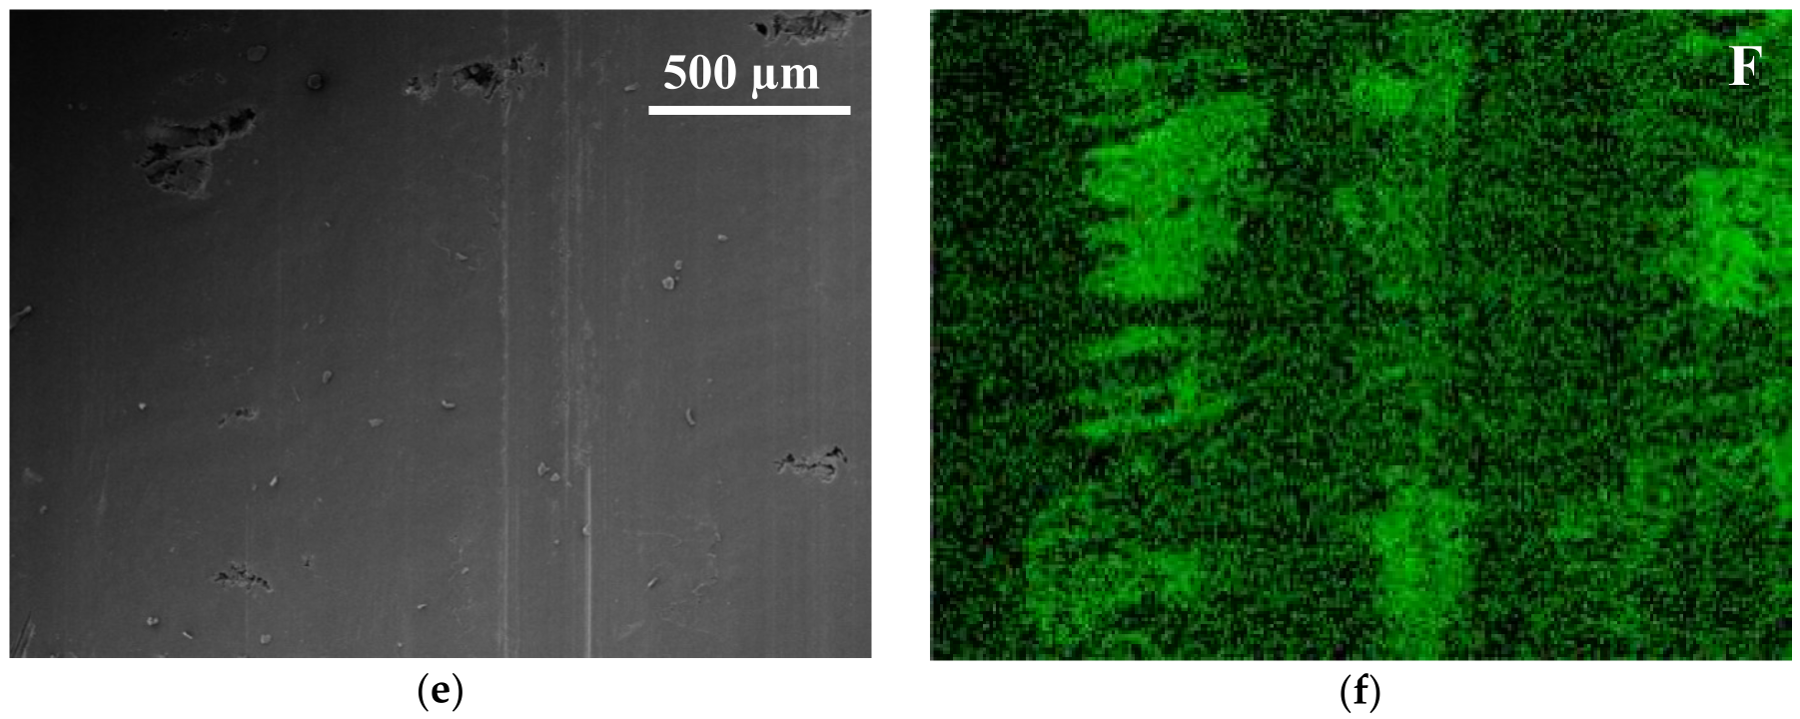
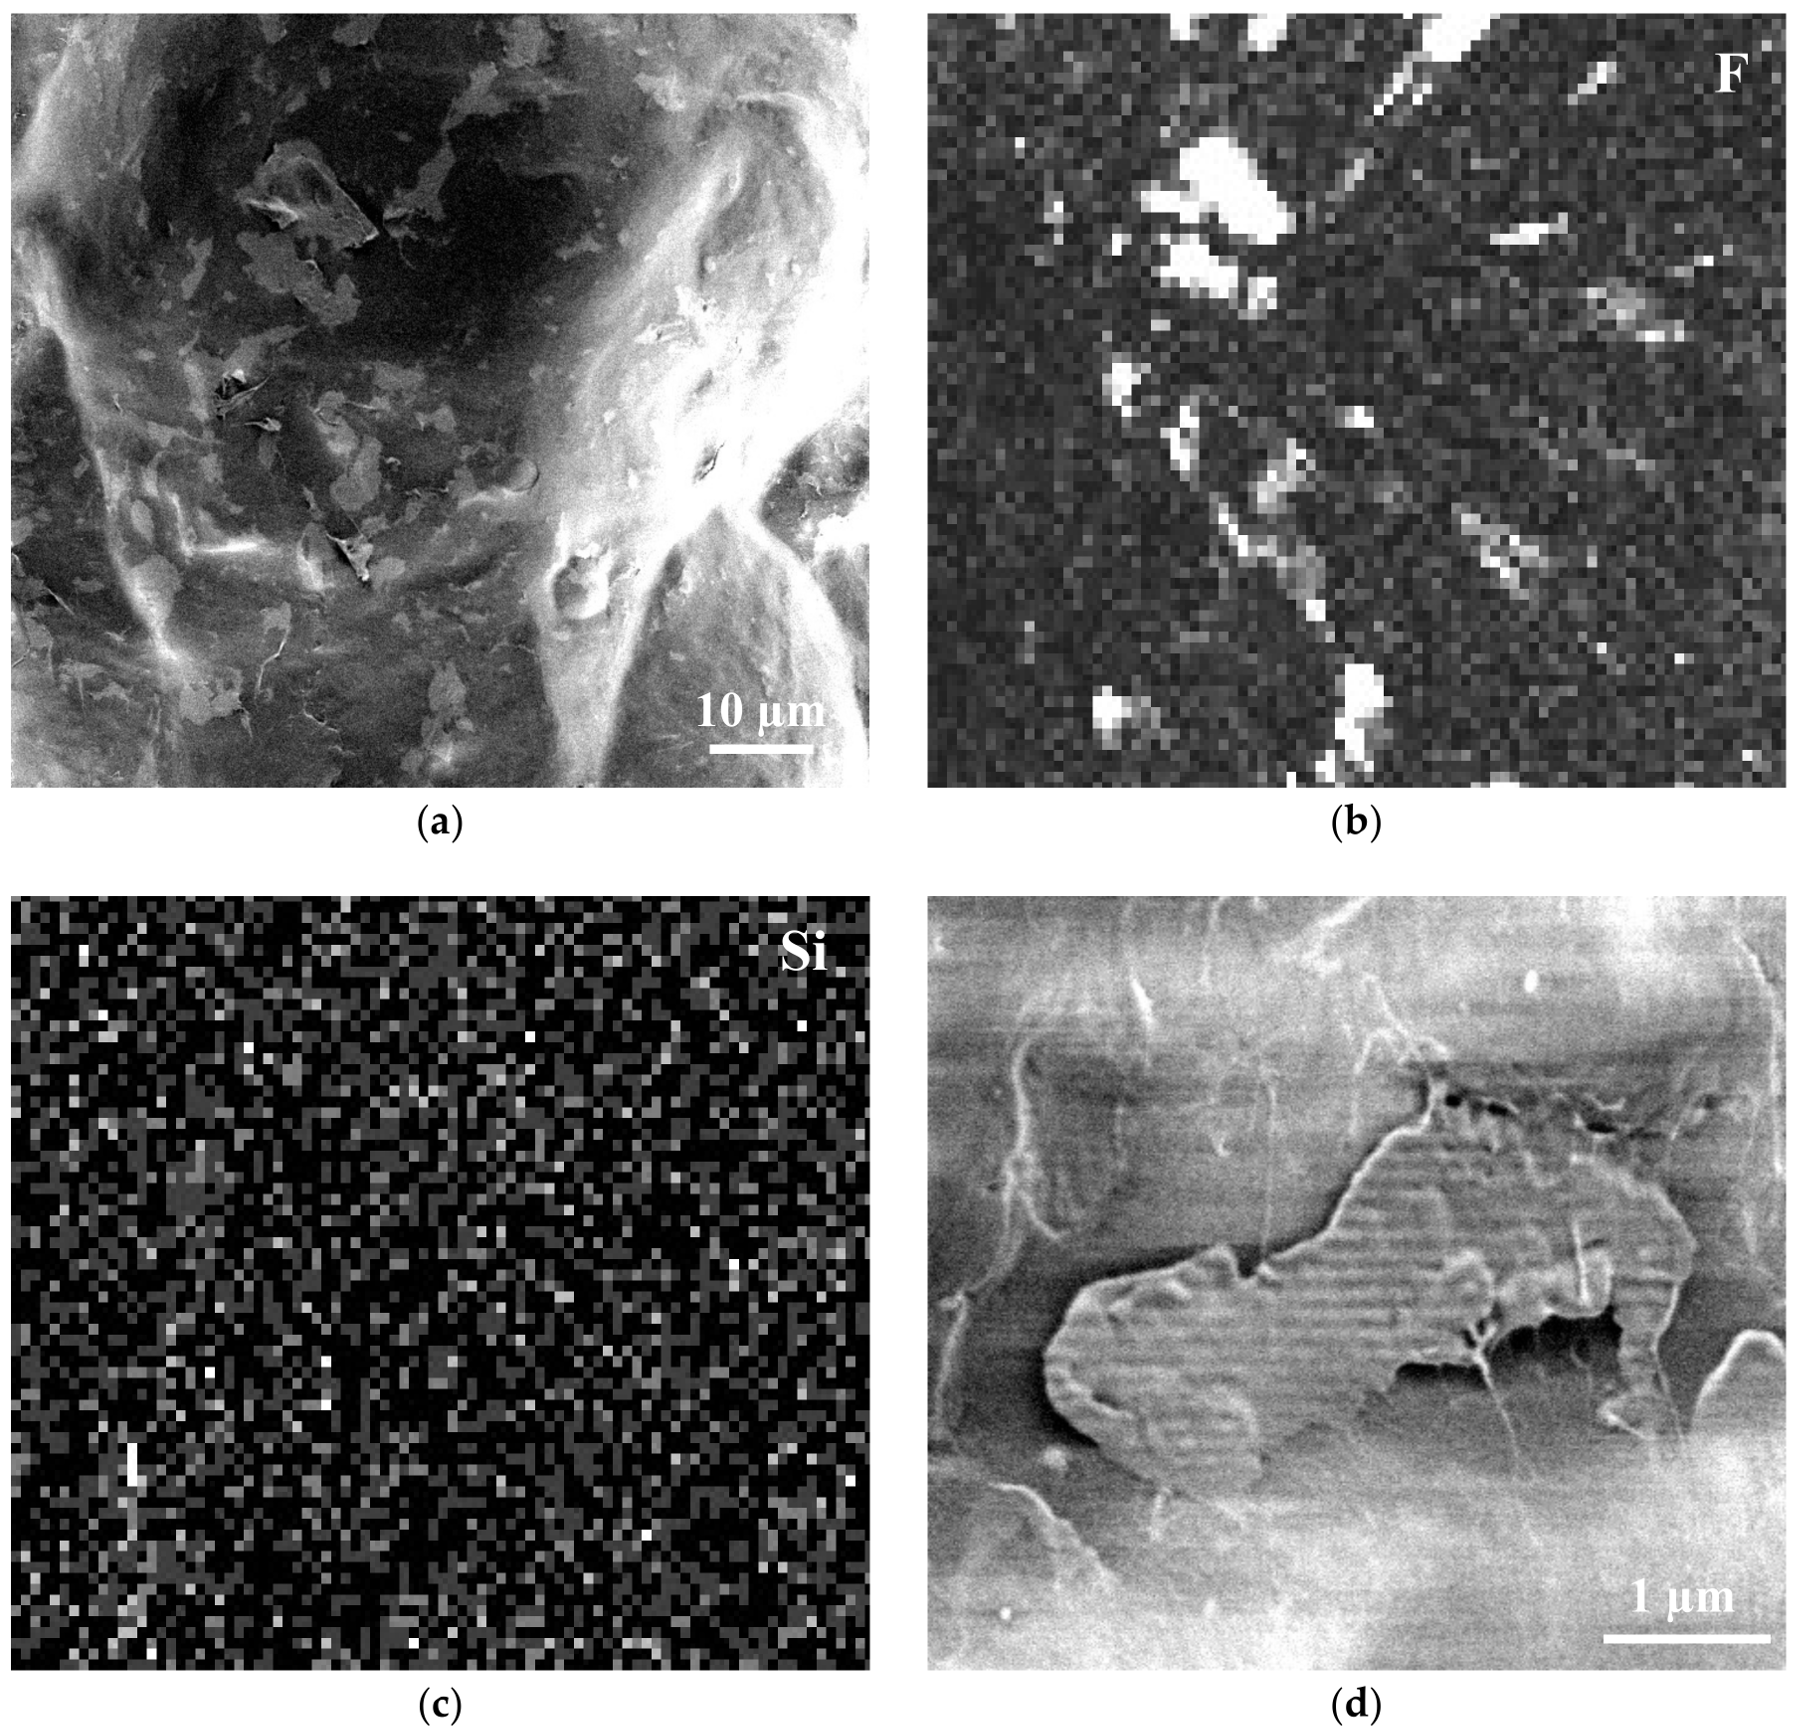
Figure 23b shows an example of a surface region subjected to material delamination, revealing a fresh polymer surface. At higher magnification, it can be seen that the polymer matrix contains two distinct phases (
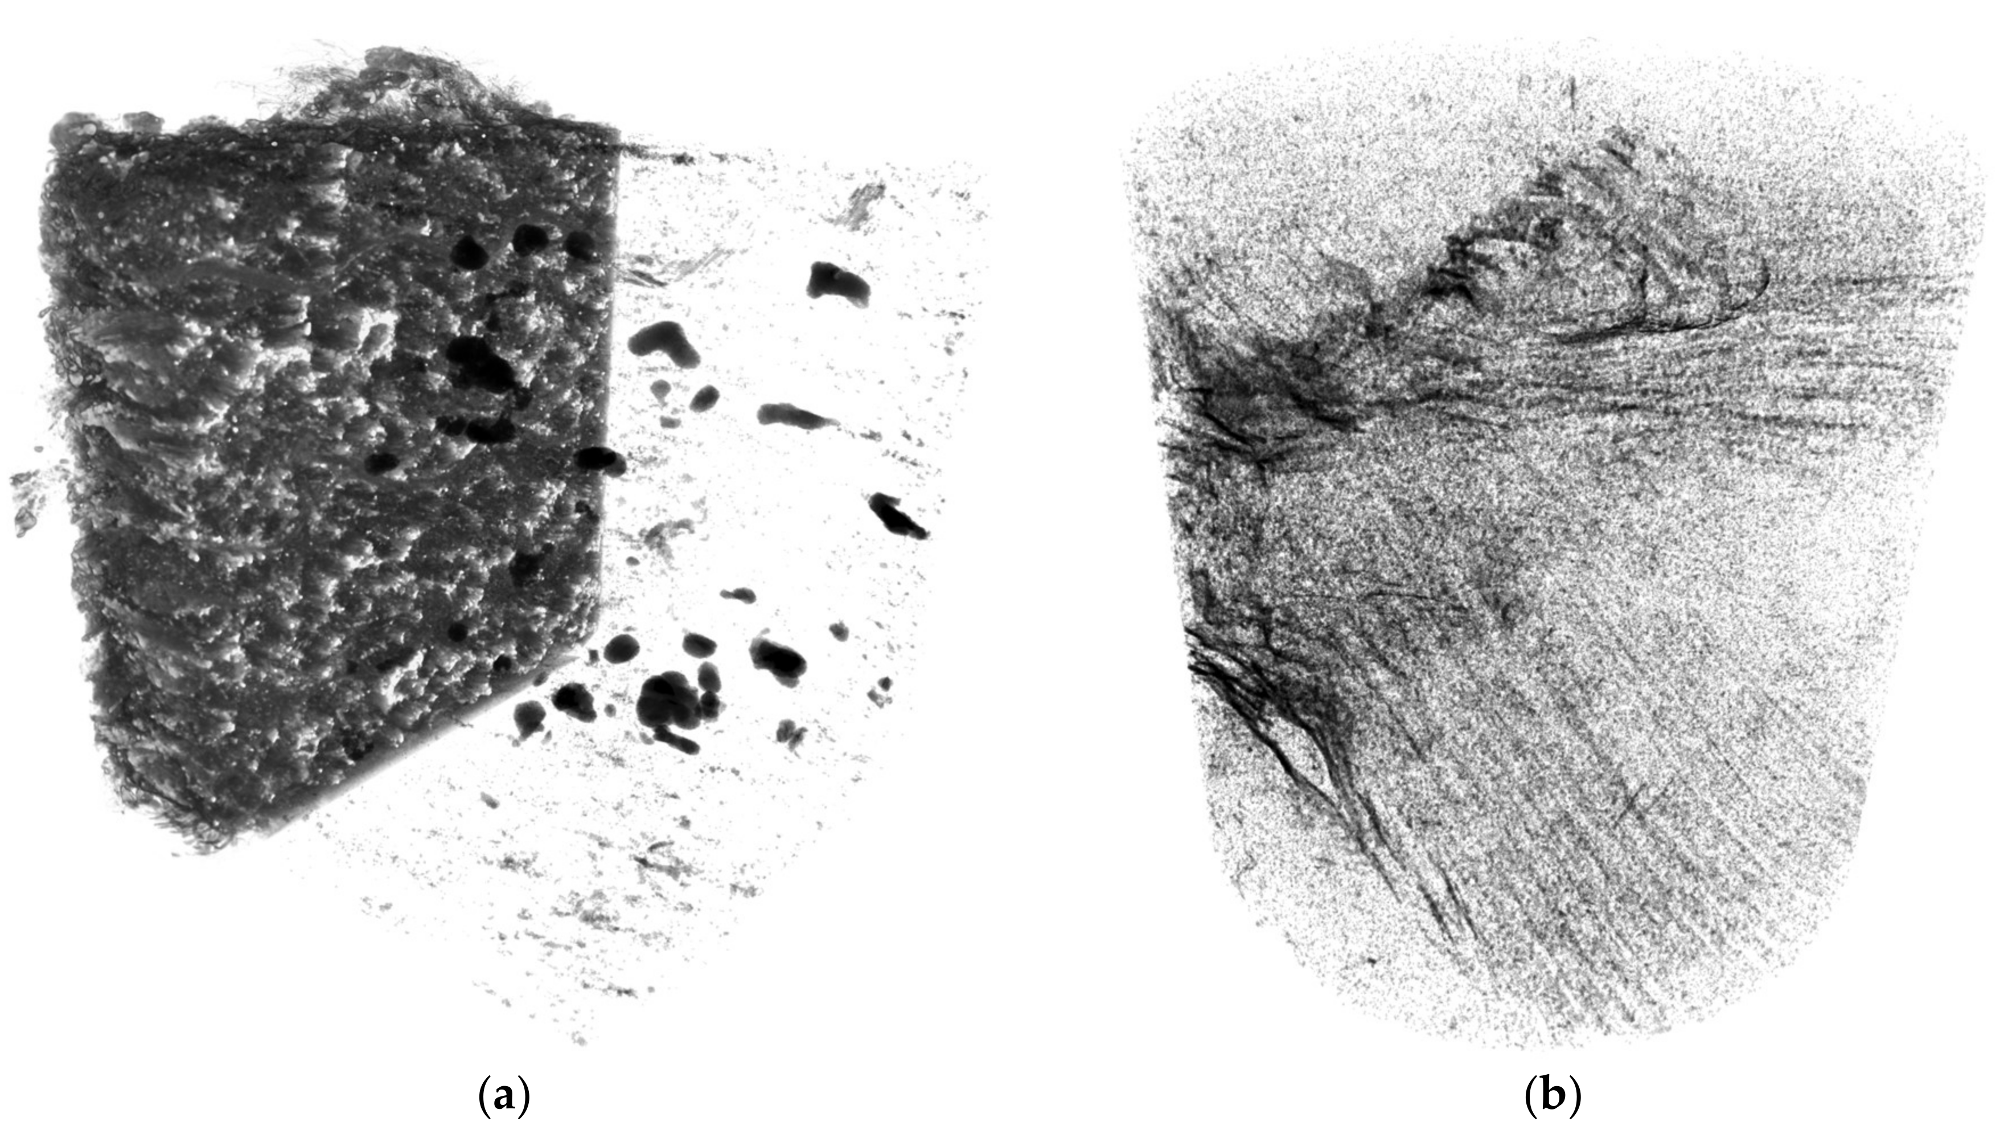
Figure 24a). The lighter grey phase is consistent with the spherically shaped particles seen in the 3D visualization of material microstructure, from XMT reconstruction (Figure 5a).
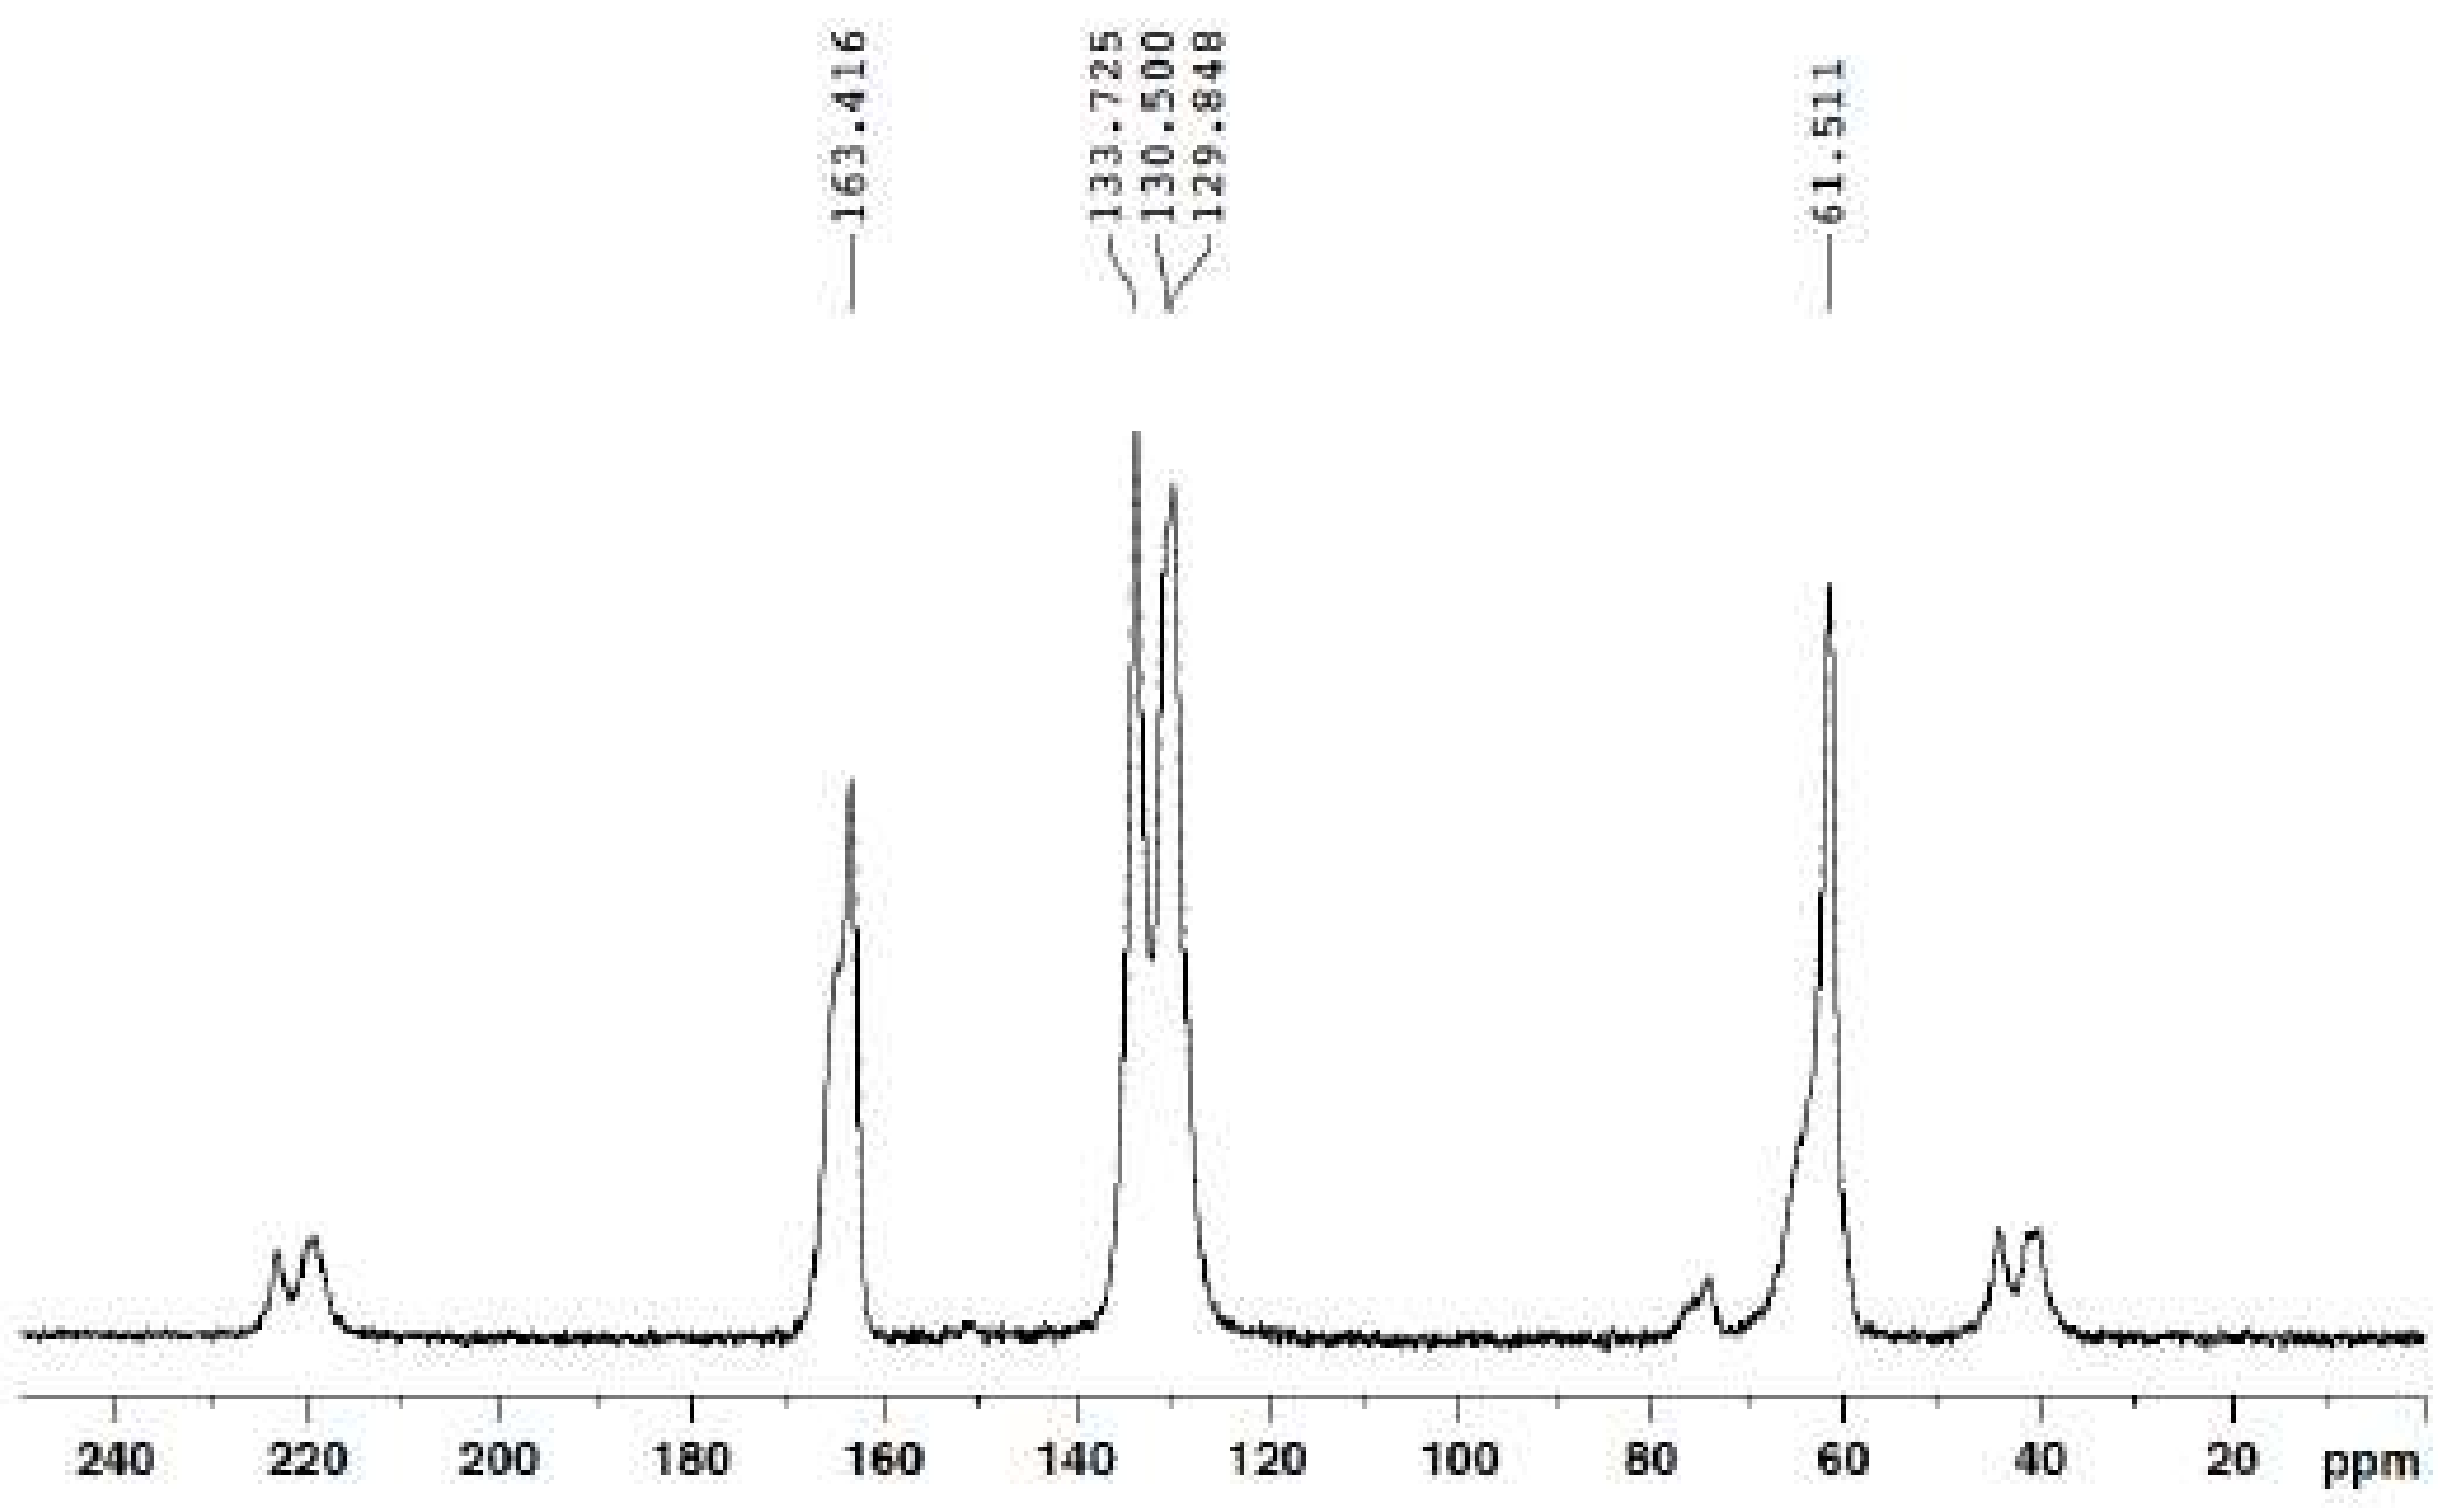
EDS compositional maps of the region (
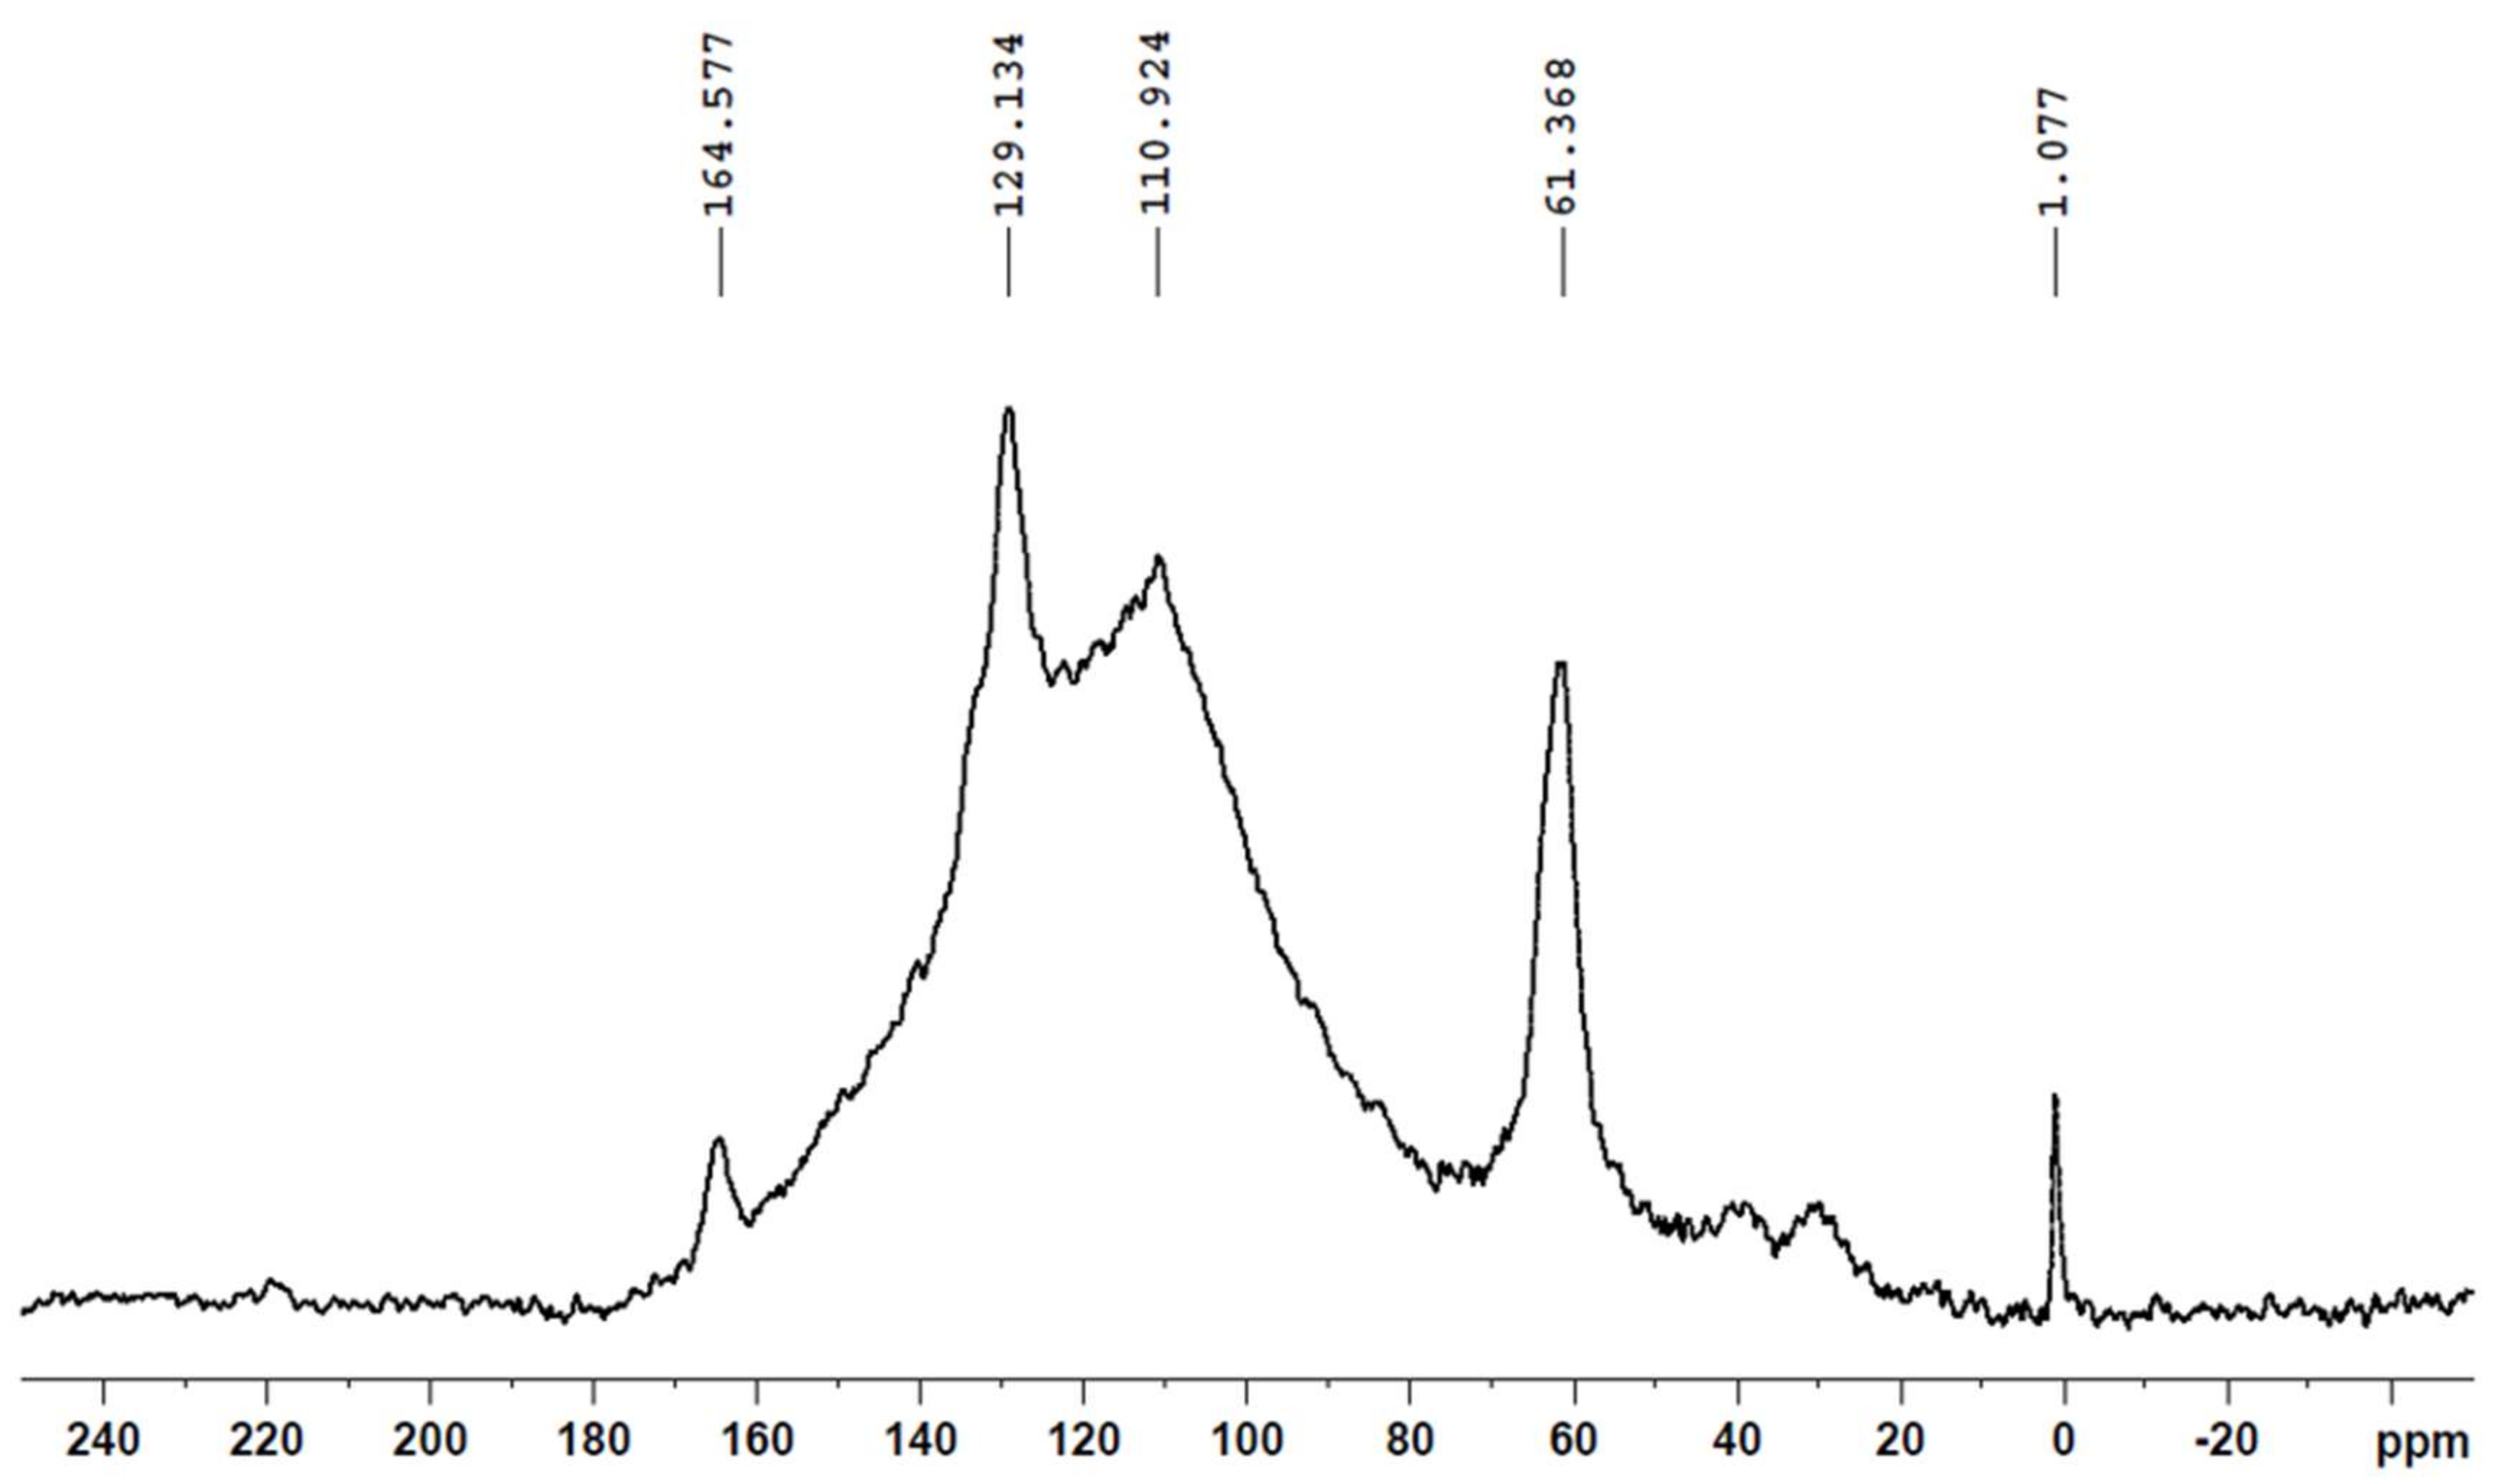
Figure 24) reveal that the light grey phase has a high concentration of fluorine, suggesting that the spherically shaped particles is made of PTFE, as detected by NMR spectroscopic measurements (Figure 10). Furthermore, traces of Si were also detected in the region, which is consistent with NMR results and ICP-SFMS elemental analysis (Table 4). Both F and Si were detected in the transferred layers deposited on the stainless steel counter surface (Figure 16), indicating that they serve as a solid lubricant in the material.

4. Conclusions

In this work, thorough material characterization of two commercially available bearings materials, used in hydropower and marine applications, has been conducted. Results suggest that ThorPlas is a mixture of a thermoplastic aromatic polymer containing PTFE and silicon-based inclusions as solid lubricants. Furthermore, the X-ray microtomography reveals the presence of larger pores in Orkot as well as smaller voids in the areas surrounding fibers, indicating imperfect adhesion between the resin matrix and the structure fibers. For operating conditions under low nominal pressures, this may lead to debonding of the fibers from the surface as a result of poor lubrication.
From study of the friction and wear behavior of the bearing materials tested, it can be concluded that low sliding speeds (10 mm/s) offer the best performance for ThorPlas bearings, as such operating conditions provide the lowest COF and specific wear rate coefficients irrespective of pressures applied. It was found that, for both bearing materials, increased pressure leads to a reduction of COF. This should be taken into consideration when selecting the design pressure for bearings used in hydropower applications. Furthermore, operation under lower sliding speeds results in lower specific wear rate coefficients. This needs to be considered when selecting time for regulation of the guide vane and turbine blade bearings used in hydropower applications.
Surface analysis revealed that, even though more polymer material is transferred to the counter surface and distributed more uniformly at low pressures, the transferred layers formed at the higher pressure contain higher amounts of the solid lubricants elements. Indicating that at higher pressures, solid lubricants are squeezed from the bulk of polymer at greater rates and depositing on the counter surface and contributing to lower friction observed. Moreover, studying worn Orkot polymer pins, it was found that the solid lubricant was smeared out on the surface in the sliding direction, resulting in better lubrication as the solid lubricant covers a larger area and thus contributes to lower COF. Consequently, the amount of transferred bulk material to the counter surface is not the major factor affecting the tribological performance of these materials, as a concentration of lubricants in the friction zone can be of equally or even higher importance. For example, the lower concentration of solid lubricant at low pressure may explain the higher specific wear rate coefficients with increased sliding speed.
Extrapolating these findings to the real-life application, it can be concluded that the regulation time for bearings used as guide vanes (subjected to lower loads) should be longer in order to provide a lower sliding speed operation. This condition would ensure low friction and wear of the bearings, saving energy and prolonging useful lifetime. Results of this study suggest that, in order to minimize wear of bearings used for regulation of the turbine blades (affected by higher loads), operation at lower sliding speeds can be recommended.
By optimizing the operating conditions for the bearings used in hydropower turbines, it is possible to reduce the COF by more than 32% and to decrease the specific wear rate coefficient by more than three times for Okrot bearings. For ThorPlas bearings, corresponding figures are almost reduced 45% in the COF and 67% in the specific wear rate coefficient. Hence, by using such optimized conditions, it is possible to both save energy (and thus money) and prolong the useful lifetime of the bearings. Furthermore, data obtained may be useful for selection of bearing material best suitable for prevailing operating conditions or (where possible) for adjustment of the operating condition to ensure better tribological performance of the bearings.

Supplementary Materials

The following are available online at https://www.mdpi.com/2075-4442/6/2/39/s1, Figure S1: Volume distribution of pores in ThorPlas using 20× objective, Figure S2: Volume distribution of spherical shaped particles in ThorPlas using 20× objective, Figure S3: Volume distribution of pores in Orkot using 20× objective, Figure S4: Volume distribution of MoS2 particles in Orkot using 20× objective, Figure S5: Volume distribution of CaCO3 particles in Orkot using 20× objective, Figure S6: Volume distribution of pores in Orkot using 4× objective, Video S1: 3D visualization of the microstructure of ThorPlas, reconstructed from XMT imaging using 20× objective, Video S2: 3D visualization of the microstructure of Orkot, reconstructed from XMT imaging using 20× objective.

Author Contributions

Maria Rodiouchkina conceived, designed and performed the experiments in addition to analyzing the data and writing the paper; Fredrik Forsberg contributed the X-ray tomography scans and analysis of obtained data; Johanne Mouzon performed SEM imaging and EDS analysis for high magnifications using Zeiss Merlin; Faiz Ullah Shah conducted NMR measurements and analysis of the obtained spectra; Ilia Rodushkin performed ICP-SFMS analysis; Kim Berglund and Roland Larsson have contributed with supervision of the study and revision of this paper.

Acknowledgments

The research presented was carried out as a part of Swedish Hydropower Centre (SVC). SVC was established by the Swedish Energy Agency, Energiforsk and Svenska Kraftnät together with Luleå University of Technology, KTH Royal Institute of Technology, Chalmers University of Technology and Uppsala University. www.svc.nu. We thank the bearing manufacturers Thordon Bearings Inc. (Burlington, ON, Canada) and Trelleborg Sealing Solutions Rotherham (Rotherham, UK) for supplying the bearing materials, technical support, feedback on the findings and revising this paper. Furthermore, we thank Ichiro Minami and Yijun Shi for providing advice about the contents and useful comments on the manuscript.

Conflicts of Interest

The authors declare no conflict of interest.

References

  1. Benda, S.; Wurm, E. Primärregelung Donaukette: Auswirkungen auf den Laufrad Verstellapparat. In Proceedings of the Praktiker Konferenz, Graz, Austria, 22 September 2011. [Google Scholar]
  2. Jones, J.A.; Palylyk, P.; Willis, P.; Weber, R.A. Greaseless Bushings for Hydropower Applications: Program, Testing, and Results; 99/104; US Army Corps of Engineers, Engineer Research and Development Center: Vicksburg, MS, USA, 1999.
  3. Gawarkiewicz, R.; Wasilczuk, M. Wear measurements of self-lubricating bearing materials in small oscillatory movement. Wear 2007, 263, 458–462. [Google Scholar] [CrossRef]
  4. Ren, G.; Feng, J. Friction and Wear Characteristics of ThorPlas Bearings and Their Application in Hydro Turbines. In Proceedings of the HydroVision International, Sacramento, CA, USA, 19–22 July 2011. [Google Scholar]
  5. Ando, M.; Sukumaran, J. Tribological behavior of composite-steel on rolling/sliding contacts for various loads. Int. J. Sustain. Constr. Des. 2011, 2, 29–34. [Google Scholar]
  6. Sukumaran, J.; Ando, M.; Rodriguez, V.; De Baets, P. Effect of velocity on roll/slip for low and high load conditions in polymer composite. Int. J. Sustain. Constr. Des. 2011, 2, 122–127. [Google Scholar]
  7. Biswas, S.K.; Vijayan, K. Changes to near-surface region of PTFE during dry sliding against steel. J. Mater. Sci. 1988, 23, 1877–1885. [Google Scholar] [CrossRef]
  8. Briscoe, B.J.; Yao, L.H.; Stolarski, T.A. The friction and wear of poly(tetrafluoroethylene)-poly(etheretherketone) composites: An initial appraisal of the optimum composition. Wear 1986, 108, 357–374. [Google Scholar] [CrossRef]
  9. Uchiyama, Y.; Tanaka, K. Wear laws for polytetrafluoroethylene. Wear 1980, 58, 223–235. [Google Scholar] [CrossRef]
  10. Samyn, P.; Schoukens, G. Tribological properties of PTFE-filled thermoplastic polyimide at high load, velocity, and temperature. Polym. Compos. 2009, 30, 1631–1646. [Google Scholar] [CrossRef]
  11. Domitran, Z.; Žeželj, D.; Katana, B. Influence of contact pressure and sliding speed on the temperature and coefficient of friction in sliding contact between two PET samples. Teh. Vjesn. 2016, 23, 389–396. [Google Scholar]
  12. Unal, H.; Sen, U.; Mimaroglu, A. Dry sliding wear characteristics of some industrial polymers against steel counterface. Tribol. Int. 2004, 37, 727–732. [Google Scholar] [CrossRef]
  13. Wang, Y.Q.; Li, J. Sliding wear behavior and mechanism of ultra-high molecular weight polyethylene. Mater. Sci. Eng. A 1999, 266, 155–160. [Google Scholar] [CrossRef]
  14. Brostow, W. Tribology of polymers and polymer-based composites. J. Mater. Educ. 2010, 32, 273–290. [Google Scholar]
  15. Opalic, M.; Domitran, Z.; Katana, B. Comparison of antifriction properties of polymer composites and bronze. Teh. Vjesn. 2014, 21, 1089–1095. [Google Scholar]
  16. Tevruz, T. Tribological behaviours of carbon filled polytetrafluoroethylene PTFE dry journal bearings. Wear 1998, 221, 61–68. [Google Scholar] [CrossRef]
  17. Pıhtılı, H.; Tosun, N. Effect of load and speed on the wear behavior of woven glass fabrics and aramid fibre-reinforced composites. Wear 2002, 252, 979–984. [Google Scholar] [CrossRef]
  18. Bijwe, J.; Indumathi, J.; Ghosh, A.K. On the abrasive wear behavior of fabric-reinforced polyetherimide composites. Wear 2002, 253, 768–777. [Google Scholar] [CrossRef]
  19. ThorPlas®. Bearings Engineering Manual. Version: TP 2006.1. Available online: http://thordonbearings.com/system/documents/documents/36/original/ThorPlas_Engineering_ManualA4.pdf?1278591962 (accessed on 14 January 2018).
  20. Orkot®. TLM & TXM Marine Bearings. Available online: http://www.orkot.com/-/media/tss-media-repository/orkot/pdfs/marine_txmm__tlmm_brochure.pdf (accessed on 14 January 2018).
  21. Steel Grade SS 2333 Chemical Information, Mechanical Properties. Available online: http://www.steel-grades.com/Steel-Grades/Special-Alloy/68/4552/SS_SS_2333.pdf (accessed on 15 January 2018).
  22. Engström, E.; Stenberg, A.; Baxter, D.C.; Malinovsky, D.; Mäkinen, I.; Pönni, S.; Rodushkin, I. Effects of sample preparation and calibration strategy on accuracy and precision in the multi-elemental analysis of soil by sector-field ICP-MS. J. Anal. At. Spectrom. 2004, 19, 858–866. [Google Scholar] [CrossRef]
  23. Archard, J.F. Contact and rubbing of flat surfaces. J. Appl. Phys. 1953, 24, 981–988. [Google Scholar] [CrossRef]
  24. Shah, F.U.; Akhtar, F.; Khan, M.S.U.; Akhter, Z.; Antzutkin, O.N. Solid-state 13C, 15N and 29Si NMR characterization of block copolymers with CO2 capture properties. Magn. Reson. Chem. 2016, 54, 734–739. [Google Scholar] [CrossRef] [PubMed]
  25. Lancaster, J.K. Polymer-based bearing materials: The role of fillers and fibre reinforcement. Tribology 1972, 5, 249–255. [Google Scholar] [CrossRef]
  26. Biswas, S.K. Friction and wear of PTFE—A review. Wear 1992, 158, 193–211. [Google Scholar] [CrossRef]
  27. Makinson, K.R.; Tabor, D. The friction and transfer of polytetrafluoroethylene. Proc. R. Soc. A 1964, 281, 49–61. [Google Scholar] [CrossRef]
  28. Gong, D.L.; Zhang, B.; Xue, Q.J.; Wang, H.L. Effect of tribochemical reaction of polytetrafluoroethylene transferred film substrates on its wear behavior. Wear 1990, 137, 267–273. [Google Scholar]
  29. Bahadur, S. The development of transfer layers and their role in polymer tribology. Wear 2000, 245, 92–99. [Google Scholar] [CrossRef]
  30. Conte, M.; Igartua, A. Study of PTFE composites tribological behavior. Wear 2012, 296, 568–574. [Google Scholar] [CrossRef]
  31. Jia, Z.N.; Yang, Y.L.; Chen, J.J.; Yu, X.J. Influence of serpentine content on tribological behaviors of PTFE/serpentine composite under dry sliding conditions. Wear 2010, 268, 996–1001. [Google Scholar] [CrossRef]
  32. Levchik, S.V.; Weil, E.D. Flame retardancy of thermoplastic polyesters—A review of the recent literature. Polym. Int. 2005, 54, 11–35. [Google Scholar] [CrossRef]
  33. Friction and Wear Characteristics of Silicone-Modified Thermoplastics. Available online: http://www.dtic.mil/dtic/tr/fulltext/u2/a305129.pdf (accessed on 29 January 2018).
  34. Silicone-Based Additives for Thermoplastic Resins Providing Improved Mechanical, Processing and Fire Properties. Available online: https://s3-ap-southeast-1.amazonaws.com/erbuc/files/4fd63c28-527f-4d65-a6bd-bd489053a61d.pdf (accessed on 29 January 2018).
  35. Wolverton, M.P.; Theberge, J.E. Plastic-On-Plastic Tribological Properties of Thermoplastic Composites. J. Elastom. Plast. 1981, 13, 97–107. [Google Scholar] [CrossRef]
  36. Wear Resistant Thermoplastic Compounds. Available online: https://www.sintef.no/globalassets/project/ffs/dokumenter/seminar-april2011/wear-resistant-thermoplastics-april2011.pdf (accessed on 29 January 2018).
  37. Böyükbayram, A.E.; Volkan, M. Cloud point preconcentration of germanium and determination by hybride generation atomic absorption spectrometry. Spectrochim. Acta Part B At. Spectrosc. 2000, 55, 1073–1080. [Google Scholar] [CrossRef]
  38. Moskalyk, R.R. Review of germanium processing worldwide. Miner. Eng. 2004, 17, 393–402. [Google Scholar] [CrossRef]
  39. Borkar, S.P.; Senthil Kumar, V.; Mantha, S.S. Effect of silica and calcium carbonate fillers on the properties of woven glass fibre composites. Indian J. Fibre Text. Res. 2007, 32, 251–253. [Google Scholar]
  40. Akram, W.; Chaturvedi, S.K.; Ali, S.M. Comparative study of mechanical properties of E-glass/epoxy composite materials with Al2O3, CaCo3, SiO2 and PBO fillers. Int. J. Eng. Res. Technol. 2013, 2, 1029–1034. [Google Scholar]
  41. Anjum, N.; Prasad, S.L.A.; Suresha, B. Role of Silicon Dioxide Filler on Mechanical and Dry Sliding Wear Behaviour of Glass-Epoxy Composites. Adv. Tribol. 2013, 2013, 324952. [Google Scholar] [CrossRef]
  42. Salla, J.M.; Cadenato, A.; Ramis, X.; Morancho, J.M. Thermoset Cure Kinetics by Isoconversional Methods. J. Therm. Anal. Calorim. 1999, 56, 771–781. [Google Scholar] [CrossRef]
  43. Lancaster, J.K. Dry bearings: A survey of materials and factors affecting their performance. Tribology 1973, 6, 219–251. [Google Scholar] [CrossRef]
  44. Chen, B.; Wang, J.; Yan, F. Friction and Wear Behaviors of Several Polymers Sliding Against GCr15 and 316 Steel Under the Lubrication of Sea Water. Tribol. Lett. 2011, 42, 17–25. [Google Scholar] [CrossRef]
  45. Briscoe, B.J.; Sinha, S.K. Wear of polymers. Proc. Inst. Mech. Eng. Part J 2002, 216, 401–413. [Google Scholar] [CrossRef]
  46. Design and Material Selection for Dry Rubbing Bearings; ESDU 87007; Engineering Science Data Unit: London, UK, 1987.
Figure 1. Images of the bearing material specimens used for the reciprocating tests, with sliding direction marked with arrows in the figures, illustrating: (a) ThorPlas load carrying surface with polished edges; (b) Orkot load carrying surface with the brown PTFE fibers (weft) and the light grey/white polyester fibers (warp); (c) Orkot from the side with the darker grey areas containing the resin matrix.
Lubricants 06 00039 g001
Figure 2. The experimental setup for the scanning of the bearing materials, using a Zeiss Xradia 510 Versa microtomography system.
Lubricants 06 00039 g002
Figure 3. Schematics of pin-on-block test configuration used for friction and wear tests, with the front view to the left and the side view to the right.
Lubricants 06 00039 g003
Figure 4. Wear track formed on the counter surface directly after test performed with a pressure of 9 MPa and a sliding speed of 40 mm/s for: (a) ThorPlas; (b) Orkot.
Lubricants 06 00039 g004
Figure 5. 3D visualization of the microstructure in the bearing material, obtained using XMT with 20× objective for: (a) ThorPlas with the three different phases (I–III) segmented; (b) Orkot in grey scale with the actual sliding surface marked with an arrow. The diameter of the scanned cylinders in the figures is 0.55 mm.
Lubricants 06 00039 g005
Figure 6. A cross section of the full tomographic reconstruction of Orkot 20×, showing five different phases and their relative size.
Lubricants 06 00039 g006
Figure 7. Segmented pores in Orkot for the tomographic scans using: (a) 4× objective, with a part of the whole structure visible; (b) 20× objective.
Lubricants 06 00039 g007
Figure 8. A cross section of the full tomographic reconstruction of Orkot 4×, presenting the macro structure of the material. Several larger pores are visible in the slice.
Lubricants 06 00039 g008
Figure 9. Solid-state 13C CP/MAS NMR spectrum of ThorPlas. A total number of accumulated signal transients was 29,478 and the MAS was 9 kHz. Note that the only resonance lines that are labeled are the real resonance lines, the so called “centre bands”; the other smaller resonance lines that are not labeled are so called spinning sidebands.
Lubricants 06 00039 g009
Figure 10. “Direct excitation” solid-state 13C MAS NMR spectrum of ThorPlas. A total number of signal transients was 40,000 and the MAS was 9 kHz.
Lubricants 06 00039 g010
Figure 11. Average coefficients of friction for the different operating conditions (sliding speeds and pressures) obtained for: (a) ThorPlas; (b) Orkot.
Lubricants 06 00039 g011
Figure 12. Average specific wear rate coefficients for the different operating conditions (sliding speeds and pressures) obtained for: (a) ThorPlas; (b) Orkot.
Lubricants 06 00039 g012
Figure 13. Surface topography of the wear tracks formed on the stainless steel counter surfaces after sliding test with ThorPlas for: (a) 9 MPa at 10 mm/s; (b) 9 MPa at 40 mm/s; (c) 28 MPa at 40 mm/s. Magnification: 5×. The sliding direction in the figures is longitudinal.
Lubricants 06 00039 g013
Figure 14. Surface topography of the wear tracks formed on the stainless steel counter surfaces after sliding test with Orkot for: (a) 9 MPa at 10 mm/s; (b) 9 MPa at 40 mm/s; (c) 28 MPa at 40 mm/s. Magnification: 5×. The sliding direction in the figures is longitudinal.
Lubricants 06 00039 g014
Figure 15. Stitched SEM micrographs of the wear tracks containing the transferred layers formed on the stainless steel counter surface after sliding against polymer pins for: (a) ThorPlas 9 MPa at 10 mm/s; (b) Orkot 9 MPa at 10 mm/s; (c) ThorPlas 9 MPa at 40 mm/s; (d) ThorPlas 28 MPa at 40 mm/s; (e) Orkot 9 MPa at 40 mm/s; (f) Orkot 28 MPa at 40 mm/s. In the images, the upper end position and the middle (bottom part) of the wear tracks is presented with longitudinal sliding direction. The red marked areas represent the ROI used for the EDS analysis of the transferred layers.
Lubricants 06 00039 g015aLubricants 06 00039 g015b
Figure 16. SEM micrographs of the red marked areas in Figure 15 corresponding to: (a) ROI I; (b) ROI II; (c) ROI III; (d) ROI IV. The sliding direction in the figures is longitudinal.
Lubricants 06 00039 g016
Figure 17. Surface topography of the Orkot polymer pins after sliding test for: (a) 9 MPa at 10 mm/s; (b) 9 MPa at 40 mm/s; (c) 28 MPa at 40 mm/s. Magnification: 5×. The sliding direction in the figures is longitudinal. Polymer pins have been sputtered with a thin layer of gold, 15.8 nm in depth.
Lubricants 06 00039 g017aLubricants 06 00039 g017b
Figure 18. SEM micrographs of the Orkot polymer pins using 5 kV: (a) before test; (b) after test with 9 MPa at 10 mm/s; (c) after test with 9 MPa at 40 mm/s; (d) after test with 28 MPa at 40 mm/s. The sliding direction in the figures is longitudinal. Polymer pins have been sputtered with a thin layer of gold, 15.4 ± 0.7 nm in depth. The red marked areas represent the area of interest used for the EDS analysis of compositional maps.
Lubricants 06 00039 g018aLubricants 06 00039 g018b
Figure 19. SEM micrographs of unsputtered Orkot polymer pin surface after sliding test for 9 MPa at 10 mm/s illustrating: (a) overview of the worn surface; (b) higher magnification of the area indicated in (a). The sliding direction in the figures is longitudinal.
Lubricants 06 00039 g019
Figure 20. SEM micrographs of the marked areas of the Orkot polymer pins after test using 10 kV for: (a) 9 MPa at 10 mm/s; (c) 9 MPa at 40 mm/s; (e) 28 MPa at 40 mm/s. With corresponding compositional map of fluorine (F) from EDS analysis of the area for; (b) 9 MPa at 10 mm/s; (d) 9 MPa at 40 mm/s; (f) 28 MPa at 40 mm/s. The sliding direction in the figures is longitudinal. Polymer pins have been sputtered with a thin layer of gold, 15.8 nm in depth.
Lubricants 06 00039 g020aLubricants 06 00039 g020b
Figure 21. Surface topography of the ThorPlas polymer pins: (a) before test; (b) after test with 9 MPa at 10 mm/s; (c) after test with 9 MPa at 40 mm/s; (d) after test with 28 MPa at 40 mm/s. Magnification: 5×. The sliding direction in the figures is longitudinal. Polymer pins have been sputtered with a thin layer of gold, 14.1 ± 0.4 nm in depth.
Lubricants 06 00039 g021
Figure 22. SEM micrographs of the ThorPlas polymer pins using 5 kV: (a) before test; (b) after test with 9 MPa at 10 mm/s; (c) after test with 9 MPa at 40 mm/s; (d) after test with 28 MPa at 40 mm/s. The sliding direction in the figures is longitudinal. Polymer pins have been sputtered with a thin layer of gold, 14.1 ± 0.4 nm in depth.
Lubricants 06 00039 g022aLubricants 06 00039 g022b
Figure 23. SEM micrographs of unsputtered ThorPlas polymer pin surface for 9 MPa at 10 mm/s illustrating: (a) the worn surface; (b) material delamination. The sliding direction in the figures is longitudinal. The red marked area represent the ROI used for the EDS analysis of compositional maps.
Lubricants 06 00039 g023
Figure 24. Further surface analysis of the marked area in Figure 23, illustrating: (a) SEM micrograph of the fresh surface with two distinct phases; (b) corresponding compositional map of fluorine and; (c) corresponding compositional map of silicon; (d) phase containing fluorine at higher magnification.
Lubricants 06 00039 g024
Table 1. Characteristics of the bearing materials [19,20].
PropertyUnitThordon ThorPlas BlueOrkot TXM Marine
Densityg/cm31.401.25
Elastic Modulus:
 Tensile Modulus of ElasticityMPa2930- 1
 Compressive Modulus of ElasticityMPa24102800 2
Tensile StrengthMPa6755
Compressive Strength:
 Compression Strength (D695)MPa105
 Normal to LaminateMPa 280
 Parallel to LaminateMPa 90
Compressive Yield StrengthMPa9290
Hardness:
 Shore D-83
 Rockwell M- 90
Thermal ConductivityW/m·K0.25 20.220 2
Maximum Operating Temperature°C110130 2
1 Information missing; 2 Provided directly by the bearing manufacturer.
Table 2. Chemical composition of SS2333 (Iron excluded) [21].
ElementCSiMnPSCrNi
Mass Fraction wt %Max 0.05Max 1.0Max 2.0Max 0.045Max 0.0317.0–19.08.0–11.0
Table 3. Test conditions during friction and wear tests, using CETR UMT 2 tribometer.
Test ParameterUnitValue
Sliding speedmm/s10–40
Normal loadN150–450
Nominal surface pressureMPa9–28
Total stroke lengthmm5
Test durationh14–56
Total sliding distancem2000
Polymer test sample dimensionmm4 × 4 × 4
Counter surface roughness, Saμm0.3
Temperature°C24 ± 1
Table 4. Concentration of inorganic constituents in ThorPlas.
ElementConcentration wt %Comment
Si0.12Correspond to 0.2 wt % Poly(siloxane)
Mg0.01Potential contamination during preparation
Ge0.006Utilized as a polymerization catalyst in plastics
Mn0.006Potential contamination during preparation
P0.003
Fe0.003Potential contamination during preparation
Table 5. Concentration of inorganic constituents in Orkot.
ElementConcentration wt %Comment
Ca4.2Correspond to 10.4 wt % CaCO3
Mo-Constituents of MoS2, used as a solid lubricant. Values of concentration are not disclosed for proprietary reasons
S-
Si0.03Possibly used as a filler
Mg0.016Potential contamination during preparation
Fe0.013Potential contamination during preparation
Co0.01Used as a promoter in the cure process of polyester thermosets
Al0.01
K0.008
Sr0.007Probably impurity from CaCO3
Mn0.003Potential contamination during preparation
Table 6. EDS spectra of stainless steel counter surface after test with ThorPlas for 9 MPa at 40 mm/s.
ElementSpectrum Number
25263437
wt %wt % σwt %wt % σwt %wt % σwt %wt % σ
C63.90.562.40.560.60.563.10.6
O32.20.533.20.534.60.432.50.5
F3.60.33.90.34.20.32.40.4
Si0.30.10.50.10.60.10.30.1
Total:100.0 100.0 100.0 100.0
Table 7. EDS spectra of stainless steel counter surface after test with ThorPlas for 28 MPa at 40 mm/s.
ElementSpectrum Number
141011
wt %wt % σwt %wt % σwt %wt % σwt %wt % σ
C59.90.559.40.561.40.460.10.5
O32.40.534.30.532.00.433.20.4
F6.70.35.00.36.40.35.70.3
Si1.00.11.40.10.30.11.00.1
Total:100.0 100.0 100.0 100.0
Table 8. EDS spectra of the compositional maps of the Orkot polymer pins after test.
ElementOperating Conditions
9 MPa 10 mm/s9 MPa 40 mm/s28 MPa 40 mm/s
wt %wt % σwt %wt % σwt %wt % σ
C56.220.3456.130.5057.560.38
O22.920.3021.670.4521.380.33
F16.180.2516.670.3716.940.28
Ca4.690.185.540.294.120.22
Total100.00 100.00 100.00

