Contact-Patch-Size Distribution and Limits of Self-Affinity in Contacts between Randomly Rough Surfaces


Department of Materials Science and Engineering, Universität des Saarlandes, 66123 Saarbrücken, Germany
*
Author to whom correspondence should be addressed.
Lubricants 2018, 6(4), 85; https://doi.org/10.3390/lubricants6040085
Submission received: 1 August 2018
/
Revised: 30 August 2018
/
Accepted: 31 August 2018
/
Published: 20 September 2018
(This article belongs to the Special Issue Multiphysics and Multiscale Models of Tribology)
Abstract
:True contact between solids with randomly rough surfaces tends to occur at a large number of microscopic contact patches. Thus far, two scaling regimes have been identified for the number density of contact-patch sizes A in elastic, non-adhesive, self-affine contacts. At small A, is approximately constant, while decreases as a power law at large A. Using Green’s function molecular dynamics, we identify a characteristic (maximum) contact area above which a superexponential decay of becomes apparent if the contact pressure is below the pressure at which contact percolates. We also find that increases with load relatively slowly far away from contact percolation. Results for can be estimated from the stress autocorrelation function with the following argument: the radius of characteristic contact patches, , cannot be so large that is much less than . Our findings provide a possible mechanism for the breakdown of the proportionality between friction and wear with load at large contact pressures and/or for surfaces with a large roll-off wavelength.
1. Introduction
As stated in Amontons’ law and Reyes–Archard’s’ law, friction and wear in many mechanical contacts turn out to be approximately proportional to the load but are independent of the apparent contact area, unless normal stresses are very large [1,2]. These two observations can be easily rationalized for randomly rough surfaces [3]: The distribution of contact stresses in macroscopic contacts—when normalized to the true contact area—barely changes with load, unless the relative contact area clearly exceeds 10% [4,5,6]. Thus, increasing the normal load does not mean (much) more extreme local contact stresses but a larger number of contact spots [5,7,8]. Loosely speaking, increasing load leads to more of the same, i.e., doubling the load—at small loads—is expected to induce roughly twice the number of contact patches having a given real contact area A. Amontons’ law and Reyes–Archard’s law follow unless friction and wear processes are non-local or sliding dynamics [9] or wear [10,11] are strongly effected by the number-density of contact patches.
The analysis of the contact-patch-size distribution supposedly started with an experimental work by Dieterich and Kilgore [12], who found evidence for an algebraic decay with increasing patch area A—in contacts between quartz, calcite, and glass with acrylic plastic—according to
The value of the exponent was found to be between one and three. However, when the fitting range included large domains, a value of turned out to be most likely. Simple models for contacts produced by cuts through randomly rough, self-affine surfaces [13,14] also found power law distributions, in which the exponent was found to obey , where H is the Hurst roughness exponent, which is defined in the Section 2.2. This result reproduced the experimental observation of an increasing exponent with decreasing H. First contact-mechanics simulations of randomly rough rough surfaces could not confirm this trend [7]. However, in hindsight, these simulations may have suffered from insufficiently fine spatial discretization cells, and perhaps more importantly—given the results of this study—the power law may have been fitted to the branch of the distribution on which A is too large to obey the power-law scaling. Later, the same group considered larger-scale simulations as well as finer resolution and also included plasticity, which led them to revise their estimate to [5].
Ten years ago, Campaña [8] ran even larger-scale simulations of system sizes going up to discretization points of the elastic solid, allowing him to obtain good resolution of contact at small scales. This proved to be important to identify a new scaling regime at small A, where turned out approximately constant and where individual clusters on that branch obeyed the area-load relation for Hertzian contact, namely . For larger-scale clusters, he identified the scaling relation of Equation (1) to hold. These patches showed a linear relation on an individual basis. Campaña’s data were again consistent with a decrease of with H, however, no clear claim was made, or could be made, about whether the relation also applied to elastic contacts. Similarly, a recent study by Molinari’s group [15] found to be close to but not necessarily identical with the exponent obtained from cuts through Gaussian surfaces. As Campaña superimposed different distributions function for different loads, the impression could arise that the predominant effect of doubling the load is an approximate doubling the number of contact patches of a given size.
The increasing-load-only-leads-to-more-of-the-same dictum cannot be exact. For any given finite contact, there exists a largest contact patch, the size of which should generally increase with load. Two growth mechanisms exist: A continuous growth process due to contact lines being pushed out further when a patch carries more load—as it happens, for example, in an isolated Hertzian contact—and a discontinuous mechanism, which is due to the merging of two patches into a single one. The latter process requires contact formation at a saddle point, as described in Ref. [16], and as modeled quantitatively in an advanced bearing model, which accounts for the merging of and the elastic interaction between contact patches [17,18].
The existence of a largest patch implies that the cannot extend to arbitrarily large A. In fact, numerical data produced for with high local resolution reveals a strong reduction of for large patch sizes compared to the self-affine scaling regime [8,15,19]. This brings up the question of whether there is a characteristic patch size above which the scaling relation no longer holds even in an infinitely large system, or, whether the existence of a largest cluster is merely a finite-size effect, as a prominent theorist suggested in a personal communication to the authors.
In this paper, we argue that there is a maximum characteristic patch size, above which the relation breaks down. The main reason, on which we also base our estimate for characteristic contact areas is related to the following argument: Contact seizes to be connected with a significant probability when the expected (square of the) stress at a distance r from a given contact point has fallen below the (square of the) pressure , at which contact percolates macroscopically. By definition, this distance is finite when the mean contact pressure is less than and infinite (in the thermodynamic limit) when .
The remainder of the article is organized as follows: Section 2 introduces our contact model and the methods with which we solve the model; it defines the quantities of interest and also contains our theoretical estimates on the range of validity for the self-affine scaling regime. Results are presented in Section 3, while conclusions are drawn in Section 4.
2. Model, Methods, and Theory
2.1. Model
Our model consists of a perfectly rigid, rough indenter and a perfectly flat, linearly elastic counterbody. They interact through a hard-wall repulsion and no friction is assumed to act between them. Owing to the small-slope approximation [20], results obtained for the system apply to other cases, in which roughness and compliance are distributed more evenly between the two solids.
The indenter is set up as a randomly rough substrate whose height spectrum satisfies
where H is the Hurst roughness exponent, is the roll-off wavevector, and the wavelength associated with the short-wavelength cutoff. This shape of the height spectrum is motivated from experimental observations [21,22,23,24]. The Fourier transform of the height profile is drawn according to
where is a uniform random number on . With the so-defined height spectrum, the mean square of the height difference is proportional to when the two points, at which the height is taken are a distance apart and it levels off to the mean-square roughness for [25]. We chose the value such that the root-mean-square (rms) height gradient turns out to be .
In this study, we use different ratios for , , and , where is the linear dimension of the periodically repeated domain, and a the discretization length. Sensible choices for these dimensionless numbers depend critically on the Hurst exponent, the load, and the type of observable [26]. For example, detecting contact at small pressure and small Hurst exponents requires a much finer discretization than at large pressures and large Hurst exponents. The dimensionless numbers used in this work span , , and . We attempted to select them such that statistical errors (due to finite roll-off domains) as well as discretization errors (due to being finite) remained smaller than symbol size. The largest simulated systems were grid points large.
The areal elastic-energy density of the counterbody is taken to be
The interaction between indenter and counterbody consists of a non-overlap constraint. To reduce finite-size effects, periodic boundary conditions are employed in the interfacial plane.
Since this paper uses many different variables and abbreviations, Table 1 summarizes the most important definitions. Some of the variables in this table have not yet been introduced up to this point.
2.2. Methods and Observables
In this paper, we use the Green’s function molecular dynamics (GFMD) method, in which the are the degrees of freedom propagated in time [27,28]. To speed up convergence, we combine two optimization methods, namely mass-weighted dynamics and the so-called FIRE algorithm [29], as described recently [30]. The main idea of mass-weighting is to assign smaller inertia to the originally slow long-wavelength modes such that the system’s intrinsic frequencies collapse as well as possible, while FIRE is an optimization scheme, which is predominantly an on-the-fly adjusted compromise between Newtonian and steepest-descent dynamics.
Due to the progress of the GFMD method, all simulations could be run on single cores, although systems exceeding 8k × 8k can only be simulated on computers with significant memory. Relaxation of a typical simulation of size 4k × 4k and to six relevant digits in the displacement field necessitates roughly 1 h on a standard desktop computer, where, however, preequilibration on systems with less fine discretization is needed. Quadrupling the number of grid point to 8k × 8k takes four times longer, etc.
There are two central quantities or observables of interest in this paper. First, the contact-patch size distribution defined in the introduction including quantities that can be derived from it, such as a characteristic cluster size. We define the latter as
which is also known as the contraharmonic mean. It gives the expectation value of the contact patch size that a randomly picked contact point—not patch (!)—belongs to. Unlike the first moment of , the measure remains invariant when a patch of size zero is added to or removed from the statistics.
To obtain accurate results for contact areas, a fine discretization is required, or, alternatively well-chosen observables that correct for deviations from the continuum limit. In this respect, it may be worth discussing the suggestion by Yastrebov et al. [31] to estimate the size of contact patches according to
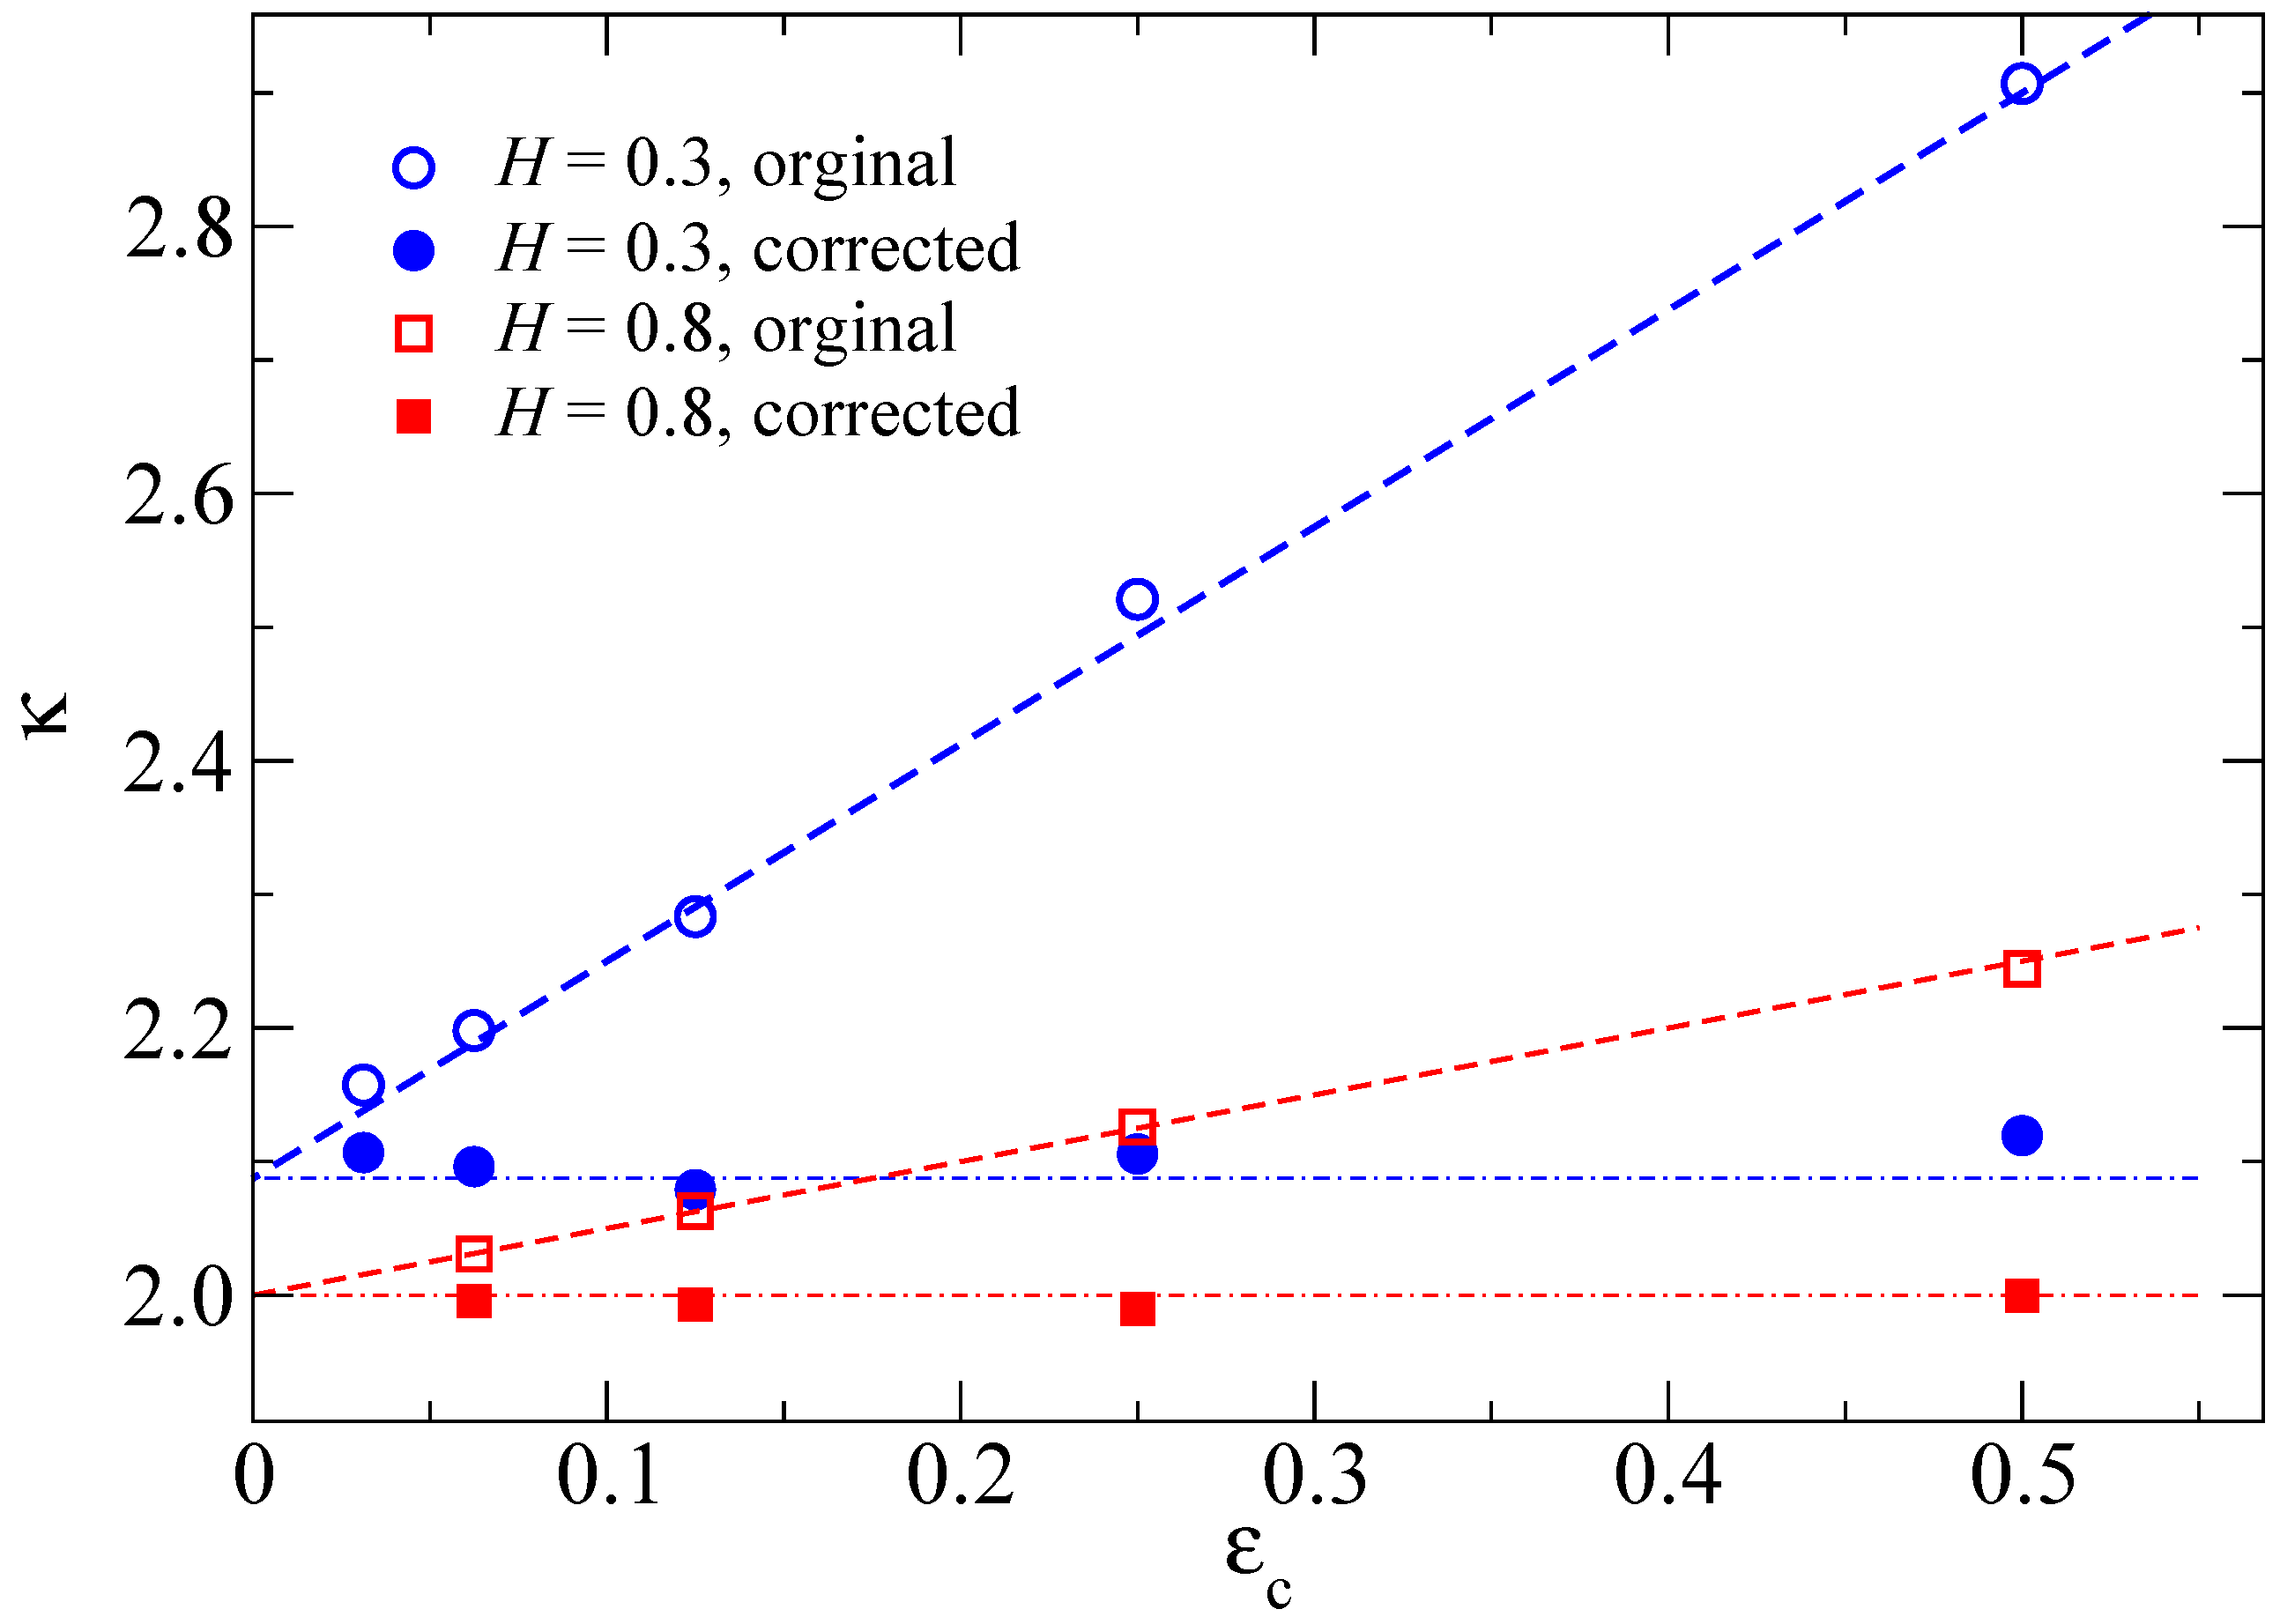
where c is a dimensionless fit parameter, , is the contact-patch size of cluster n at a given real-space discretization of , and is the length of the contact line. We found that these corrections are indeed very useful when applied to the total contact area and thus the ratio between relative contact area and reduced pressure . Unlike Ref. [31], we found , rather than , to work very well, as demonstrated in Figure 1. The origin of this discrepancy is not quite clear to us.
We note in passing that the values of presented here are not meant as new best possible estimates for how depends on H. To improve current standards, disorder averaging as well as extrapolation to large systems and to the “fractal limit” is needed besides continuum corrections () [26].
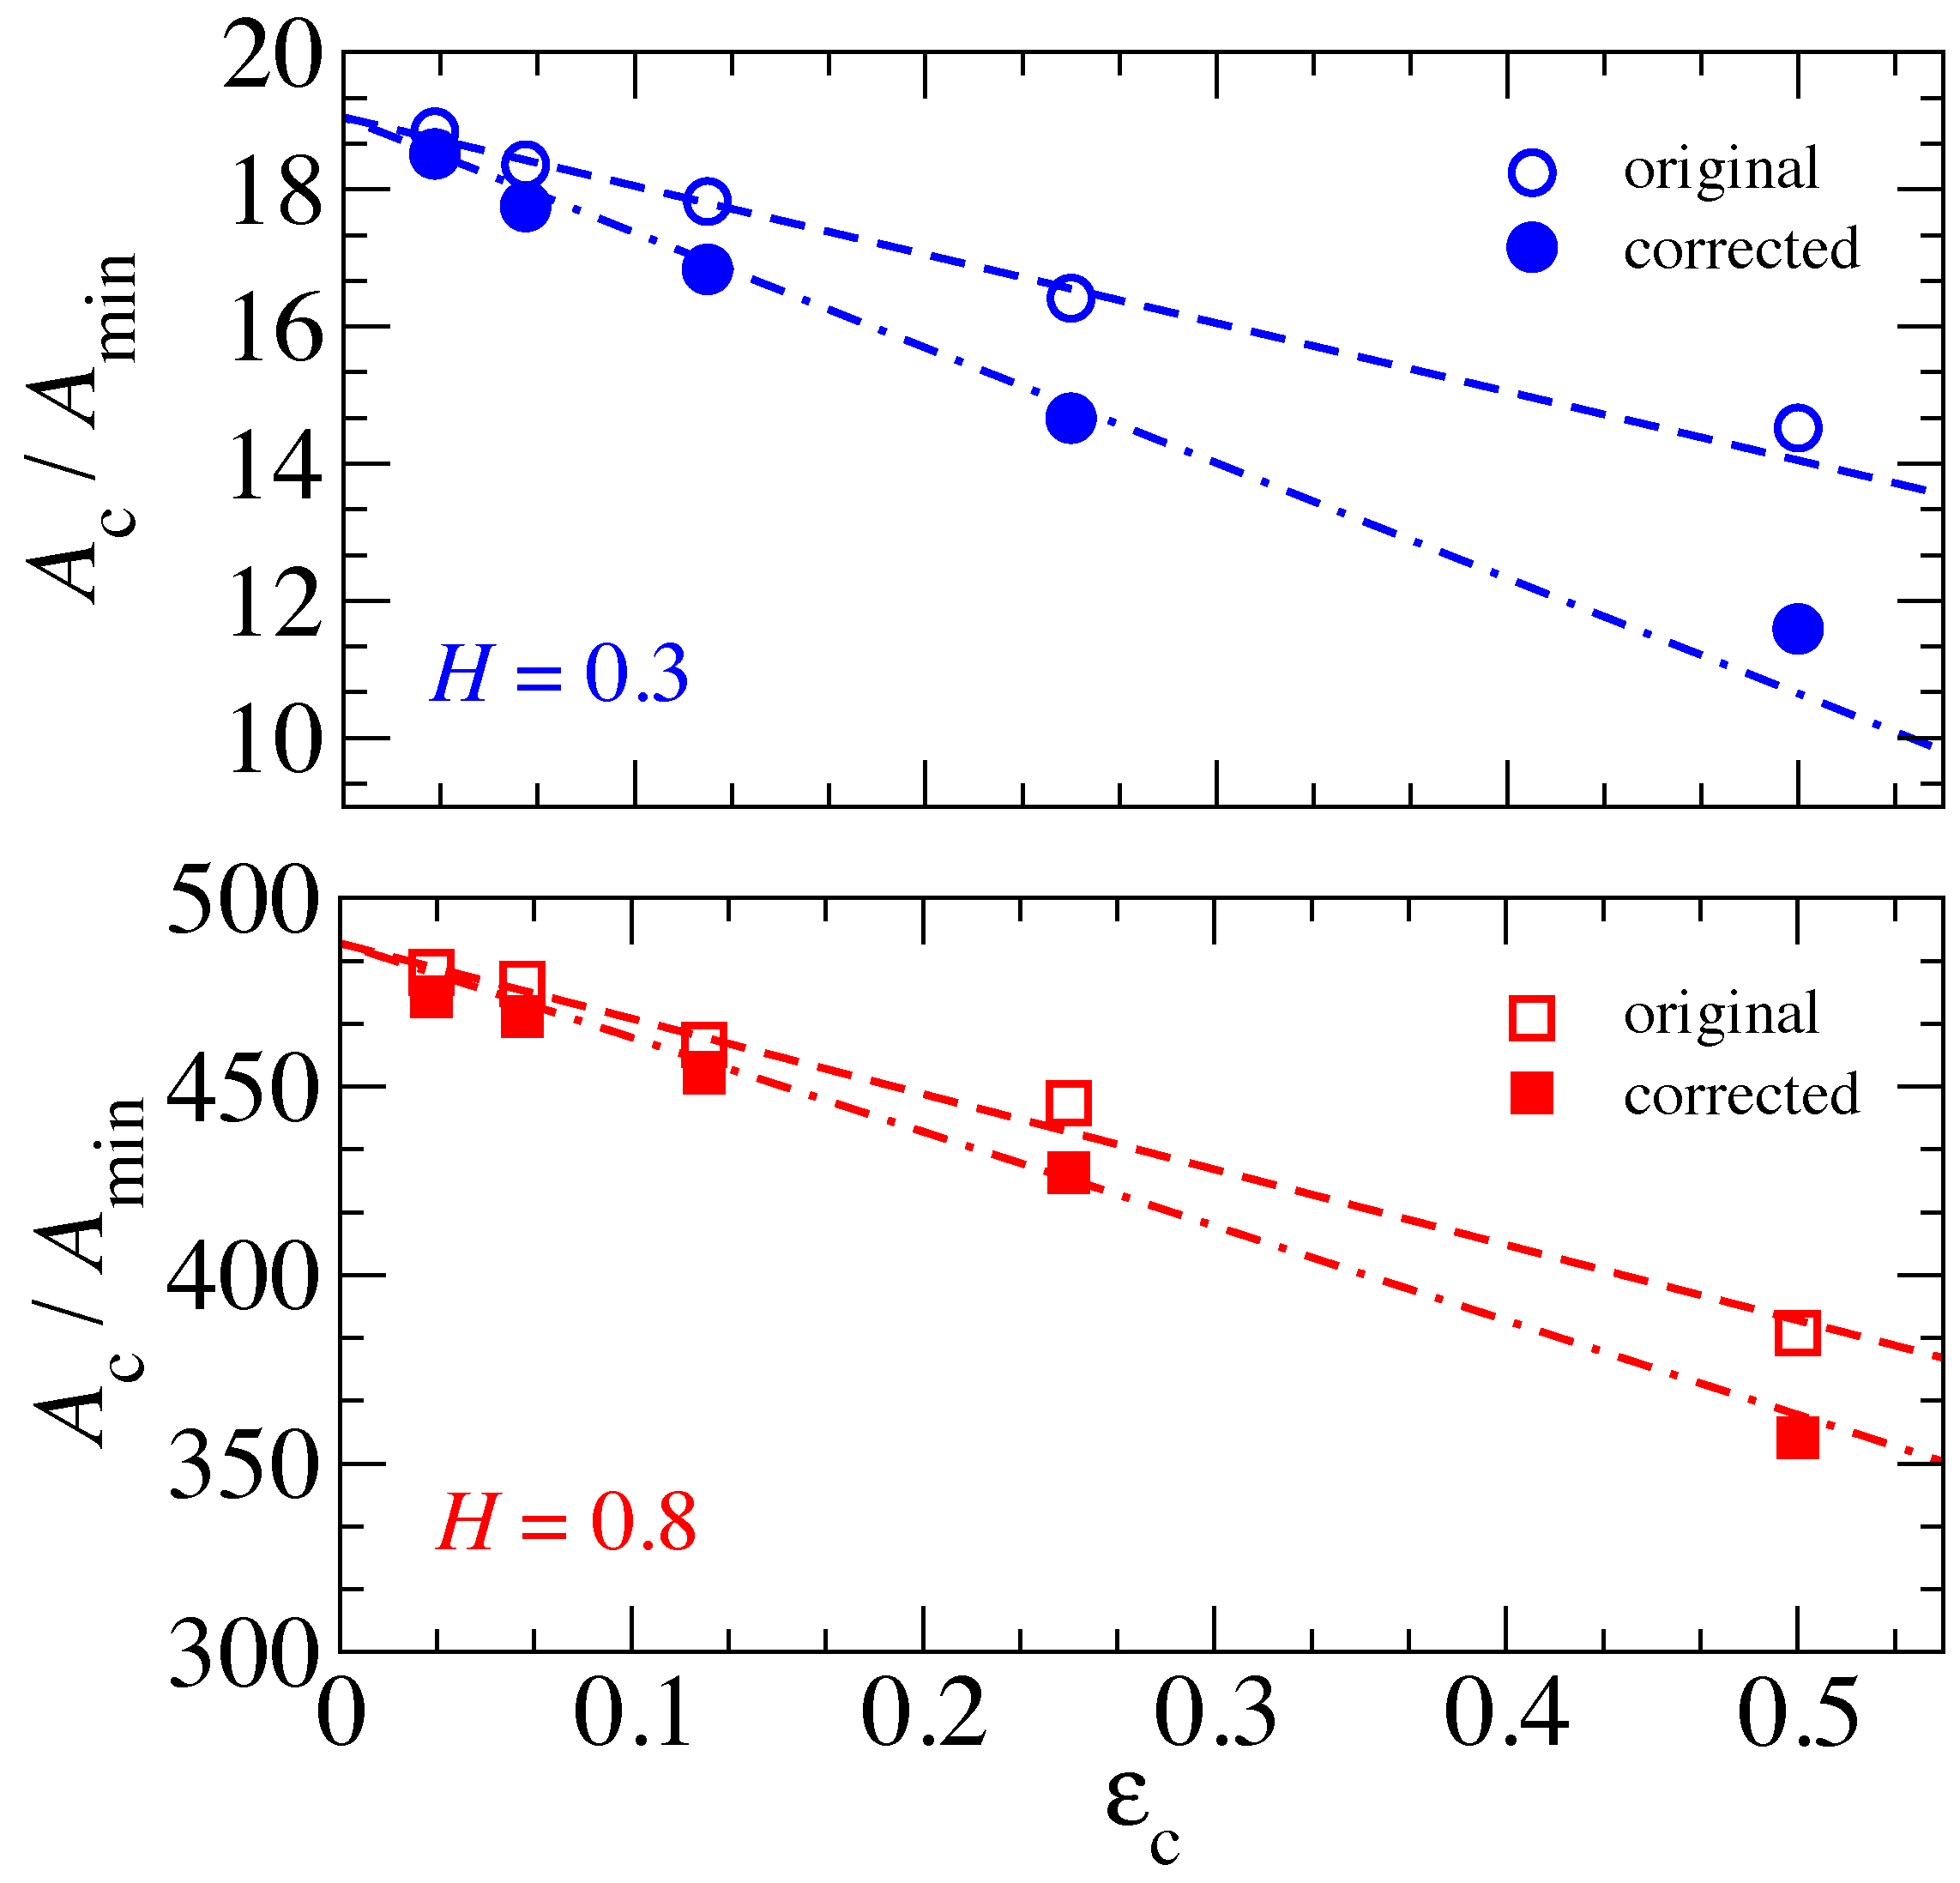
Unfortunately, the determination of the characteristic contact-patch size is adversely affected by the patch-size corrections, which is demonstrated in Figure 2. We rationalize this negative result with the observation that clusters may break up or unite when the accuracy of the calculation is increased by decreasing , the latter process happening with a greater probability. These two processes have essentially no effect on the net contact area but can leave significant traces in the determination of , in particular near the percolation threshold and/or in the vicinity of a pressure where two large clusters merge. We nevertheless attempted to ensure that the (deterministic) uncertainties of , which are due to being finite, are well below 20%. This was done by simulating each individual random realization with at least three values of .
The second central observable is the stress autocorrelation function (ACF). Here, we define it as
where denotes an average over all interfacial points . In this definition, the stress ACF is normalized to the true contact area to facilitate comparison of results for different pressures, while the text in the abstract assumes no division by . With the definition in the main text, is the second moment of the stress averaged over true contact only and tends to for . In a previous work [25], we subtracted from the numerator on the right-hand side of Equation (7) to make go to zero at large r.
2.3. Theory
In this section, we propose simple arguments for the estimation of the range of values of A, in which the self-affine scaling holds. This includes separate guesses for the breakdown of the relation for small A at and for large A at . We note that has no choice but to be strongly correlated with—or even close to—the characteristic patch size if the exponent satisfies . (Corrections to originate from the branch on which disappears superexponentially. They make move closer to than if were a rigorous upper bound for the allowed values of A.)
To set the stage for the discussion, we note that we only consider systems that are homogeneously loaded with normal stress, acting on the elastic solid’s surface opposite to the interface. Likewise, the roll-off domain () is assumed to be large enough for finite-size effects [32] to be minor.
2.3.1. Rough Estimate of
The maximum radius of curvature of a single, one-dimensional sinusoidal height wave satisfies
where the expectation value is taken over an integer multiple of a (half) wavelength. In the following, we assume this relation to also apply to the maxima of randomly rough surfaces. We kept the factor of two in the denominator on the right-hand side of Equation (8) for heuristic reasons. The such obtained value of is then used to relate the contact area of typical small Hertzian contact patches with the load they carry via with the well-known equation .
For self-affine patches, the macroscopic relation holds with little statistical scatter on an individual basis. The cross-over between the two power laws occurs at the load where both equations predict the same contact area at the same load. This leads to a cross-over area of
between Hertzian and self-affine scaling of , which thus constitutes an approximation for the minimum area on the self-affine branch.
When the scaling regime of the self-affine roughness extends over many decades, the term can be readily estimated to be
For a precise determination of , it might be in place to introduce a scale-dependent radius of curvature. However, we do not see that such a detailed treatment adds much to our rough estimate, which we are interested here and which actually turns out to be quite reasonable. Conversely, the calculation needs to be altered when short-range adhesion is present. In the latter case, small contact patches are no longer stable, which effects the functional form of at small A and the cross-over to the self-affine scaling regime [33].
In the Section 3, patch sizes are reported in units of . For this quantity, Equation (11) is used with the value of and the analytical result for . This choice facilitates the interpretation of the data, even if potentially more accurate guesses could be obtained for , e.g., by taking into account the weak dependence and the exact value of .
2.3.2. Rough Estimate of
Perfectly elastic, self-affine contacts percolate when their relative contact area is above the contact-percolation threshold of [34]. To estimate a characteristic patch size, we thus assume that contact remains percolated when the (expected) second moment of the stress has not dropped below the square of the minimum, macroscopic pressure needed to induce contact percolation. This gives a characteristic patch radius satisfying
at .
For , the value of must obviously turn out greater than , since is divergent (in the thermodynamic limit) and thus the ratio of simply becomes . Right at the percolation threshold, the percolating cluster is also infinitely large so that the equality must hold. With increasing distance from the percolation point, e.g., with decreasing pressure, it then appears reasonable that keeps getting smaller. However, it is counterintuitive that it can drop by as much as a factor of ten for realistic values of .
Let us estimate the value of . While subtle differences for the relation between different H exist, we use an overall fit (Equation (15) in Ref. [35]) to numerical data [26] to get a first guess for the right-hand side of Equation (12). We consider the data of Ref. [26] to be reliable from no to complete contact, as it actually includes finite-size as well as fractal corrections in addition to continuum corrections. It turns out that the linear relation between and p is reasonable up to the percolation point, partly because the leading-order corrections to the linear relation are of order . Thus, our first guess for the characteristic patch radius at reads
due to the well-known approximation, which is valid at a small reduced pressure of with a numerical value of [6,7,26,31,36,37].
3. Results
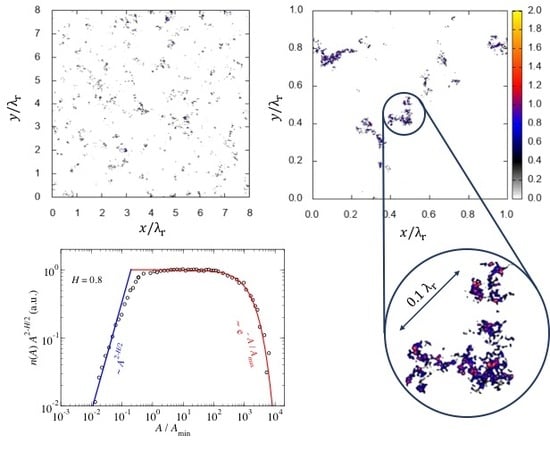
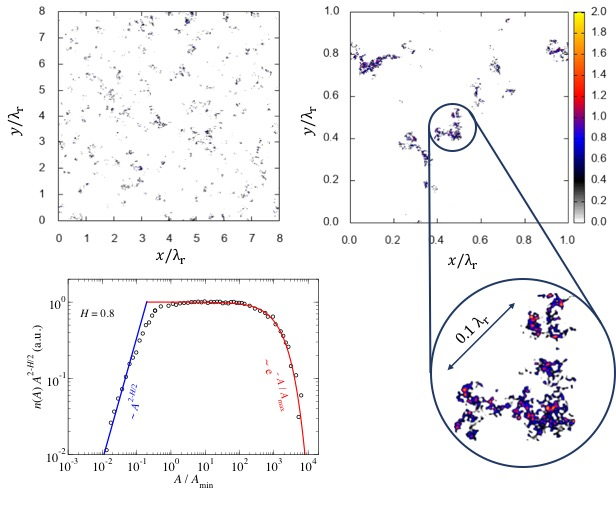
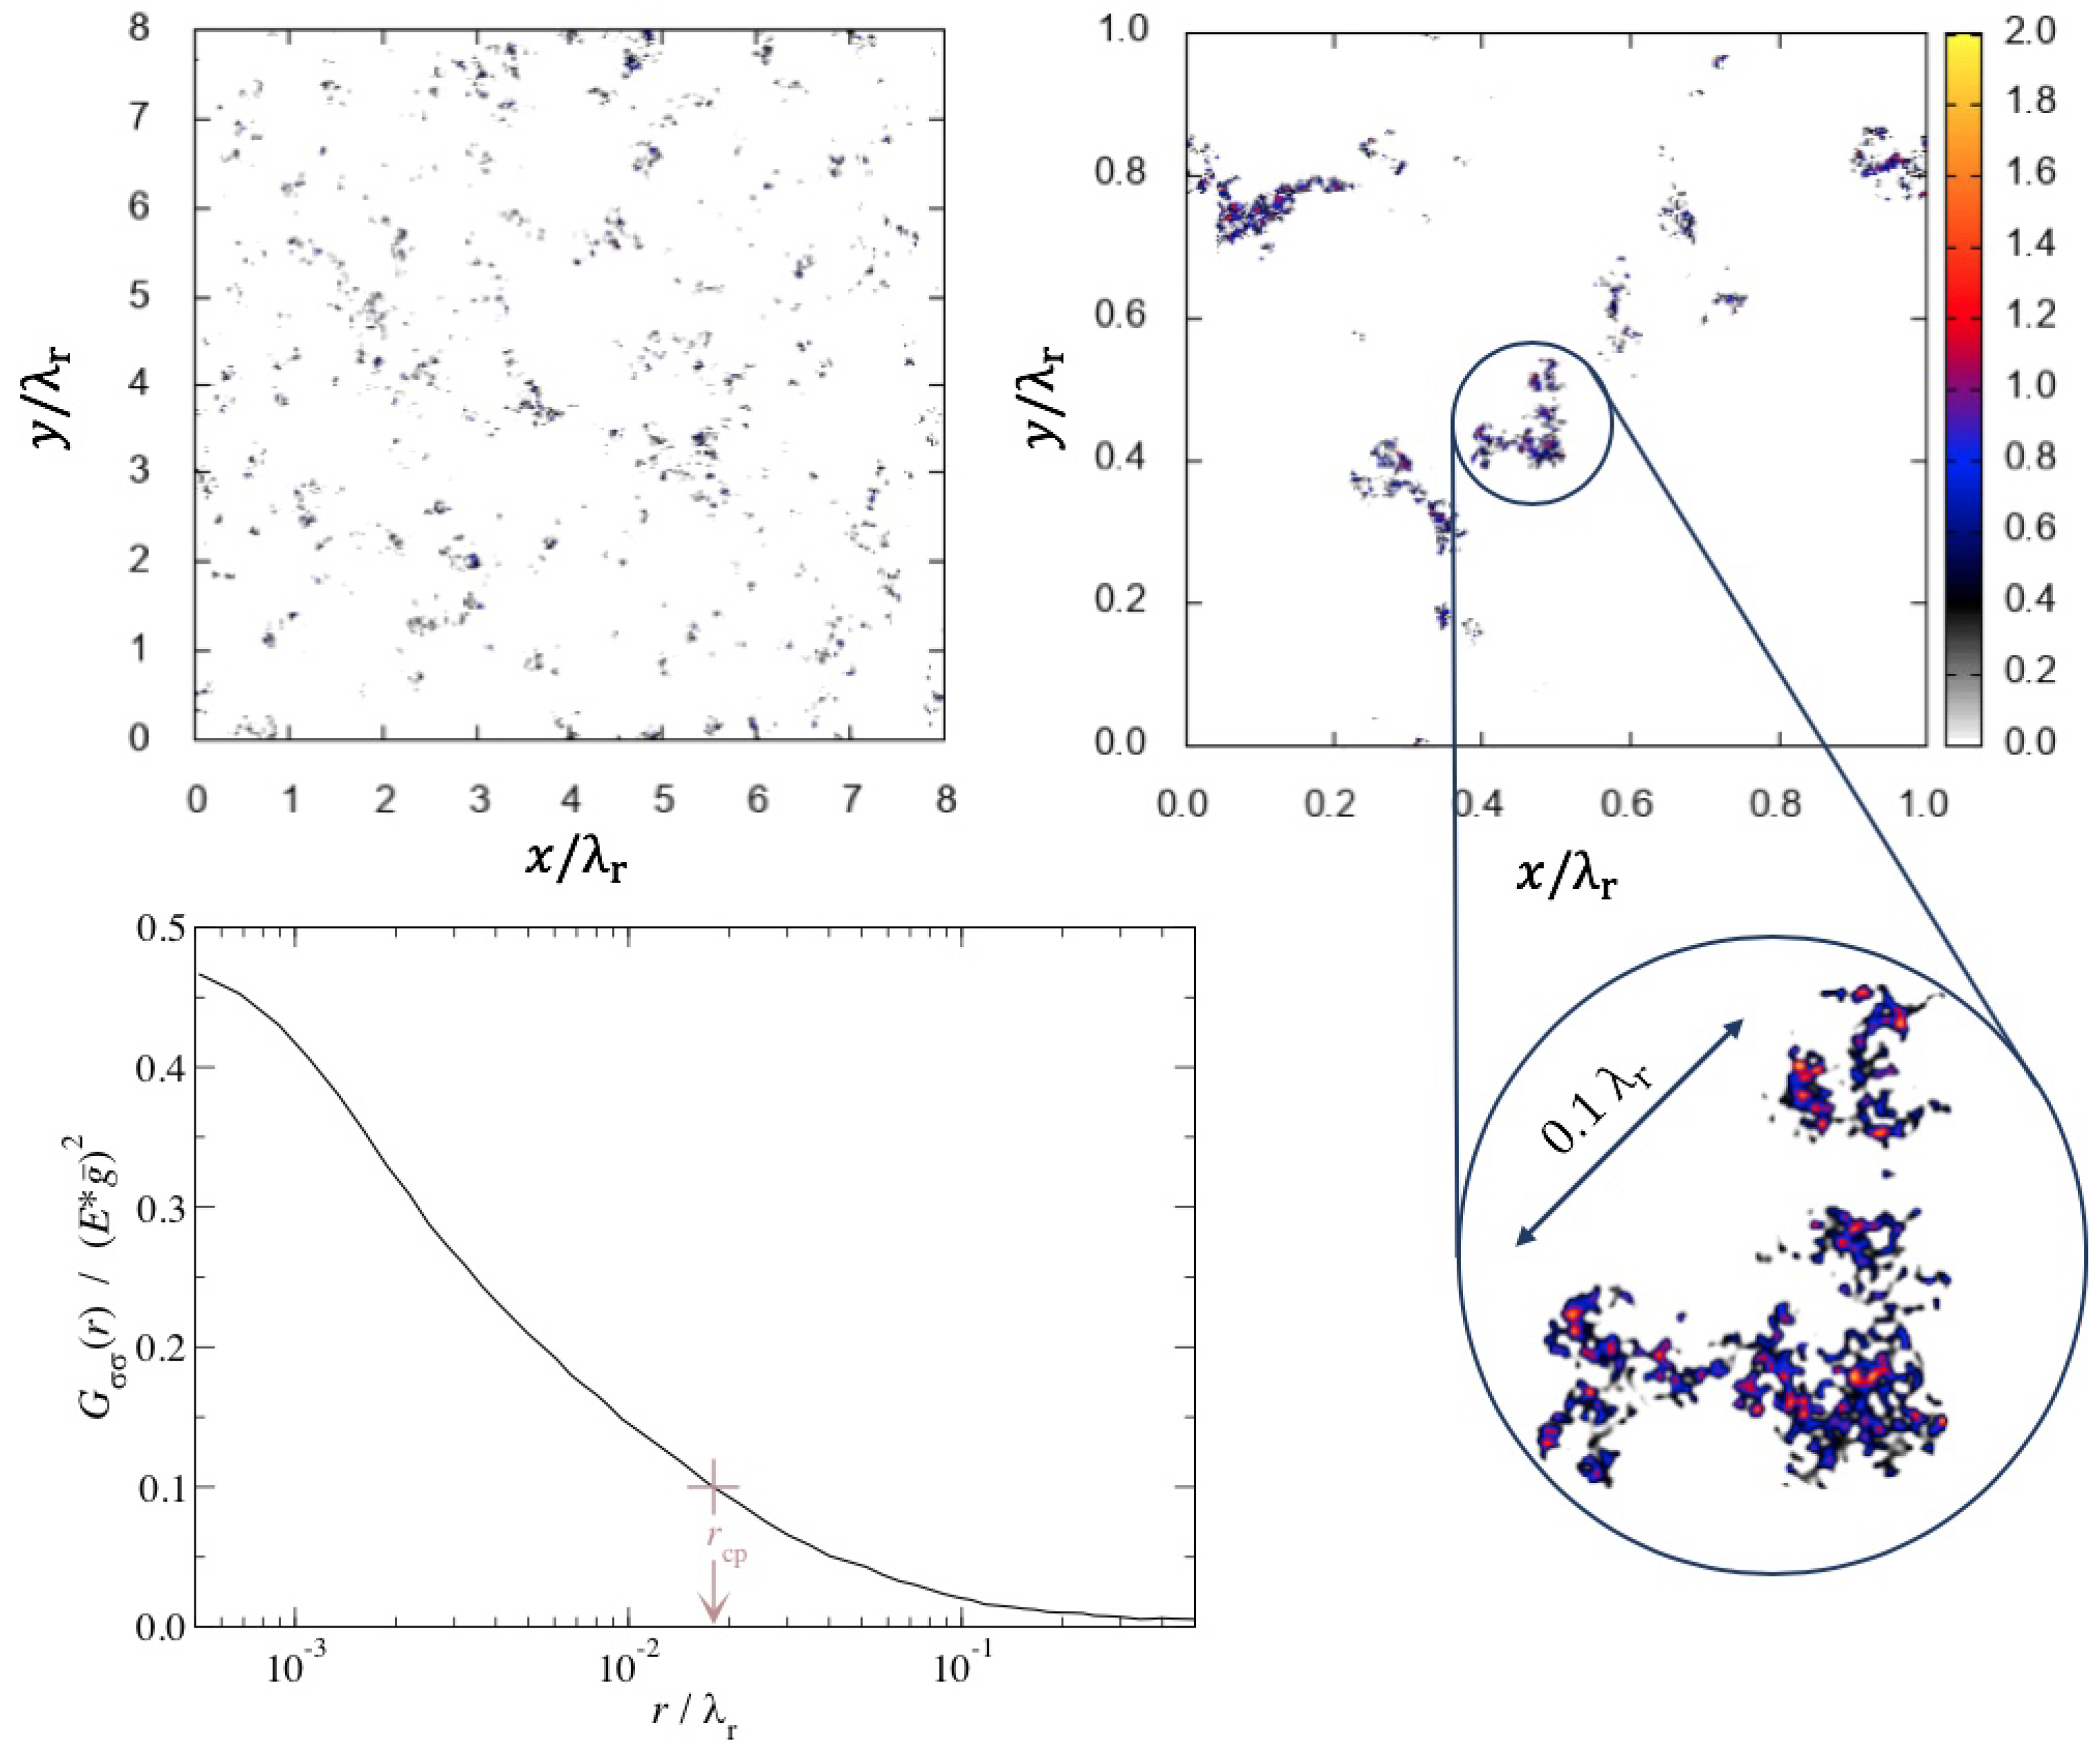
To set the stage for a later discussion, results of a medium-sized contact-mechanics simulation are shown in Figure 3, in which the relative contact area has been obtained to . The figure reveals that the real contact area becomes roughly isotropic for a surface when averaged over apparent contacts clearly exceeding . It also shows that there are many more small than large contact patches. However, most contact points belong to large patches. Moreover, the linear size of the largest cluster shown in the circular call-out box corresponds roughly to twice the value of r, at which has fallen to , which defines a rough estimate of a characteristic patch radius.
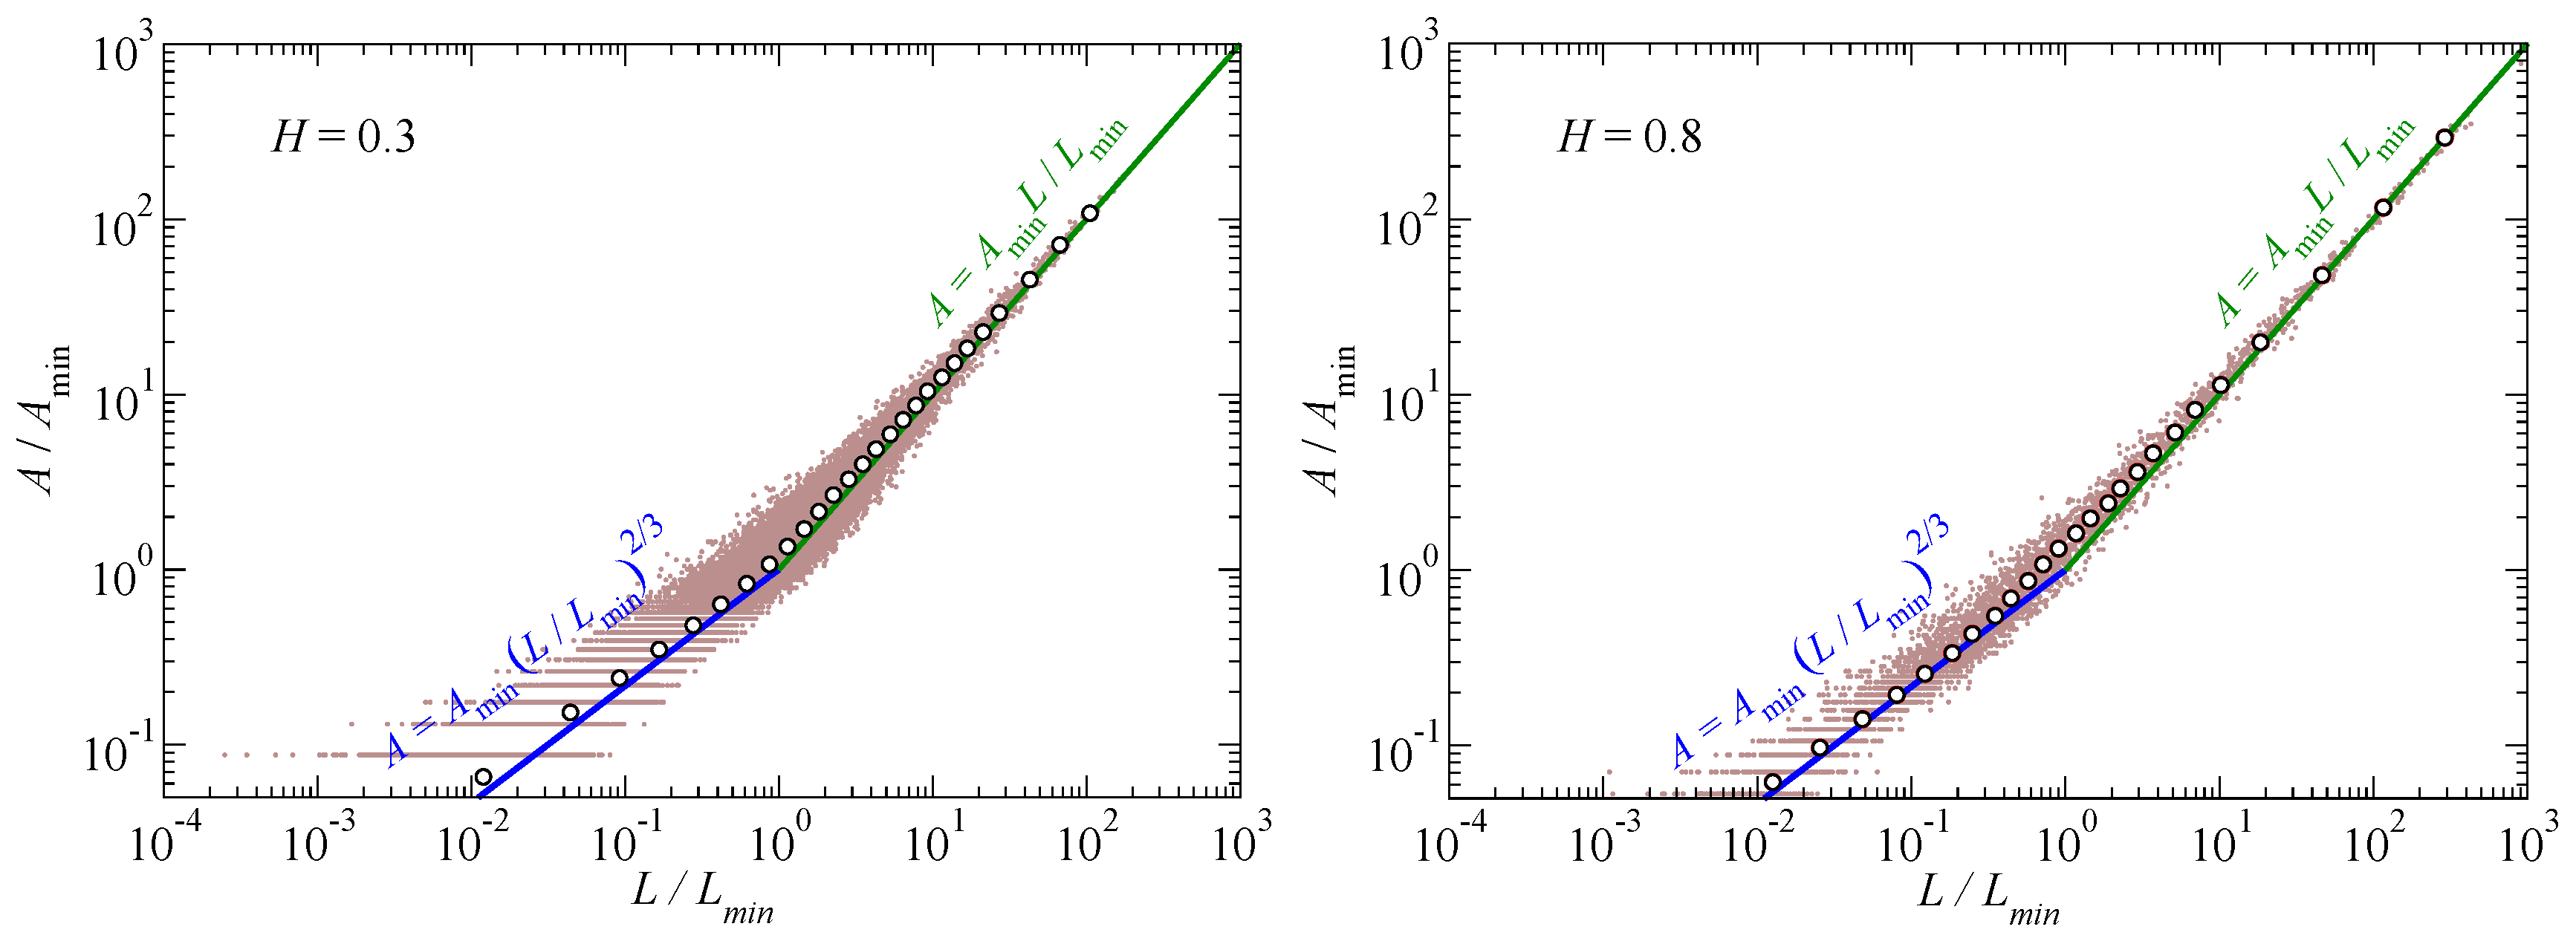
We begin our quantitative analysis with a reproduction of the trends published by Campaña on the load-area relation of individual contact patches in Figure 4. An added value with respect to the original data is the realization that the estimate for the contact area at which the Hertzian scaling crosses over to the linear relation for self-affine patches is quite reasonable. After coarse graining load and area over many patches in an interval , we always found the running averages to lie within 20% of the running averages, deviations being obviously largest near the transition from the Hertzian to the self-affine branch.
Figure 4 also gives a clue as to why the dimensionless proportionality coefficient increases with decreasing H. A smaller value for H clearly leads to more small patches lying above the (extrapolated) line , which was drawn in Figure 4 both times assuming a value of . At the same time, the relative weight of large clusters becomes smaller. It turns out that is not sensitive to the dimensionless numbers and as long as the latter remains sufficiently large in order for the surface to qualify as self-affine.
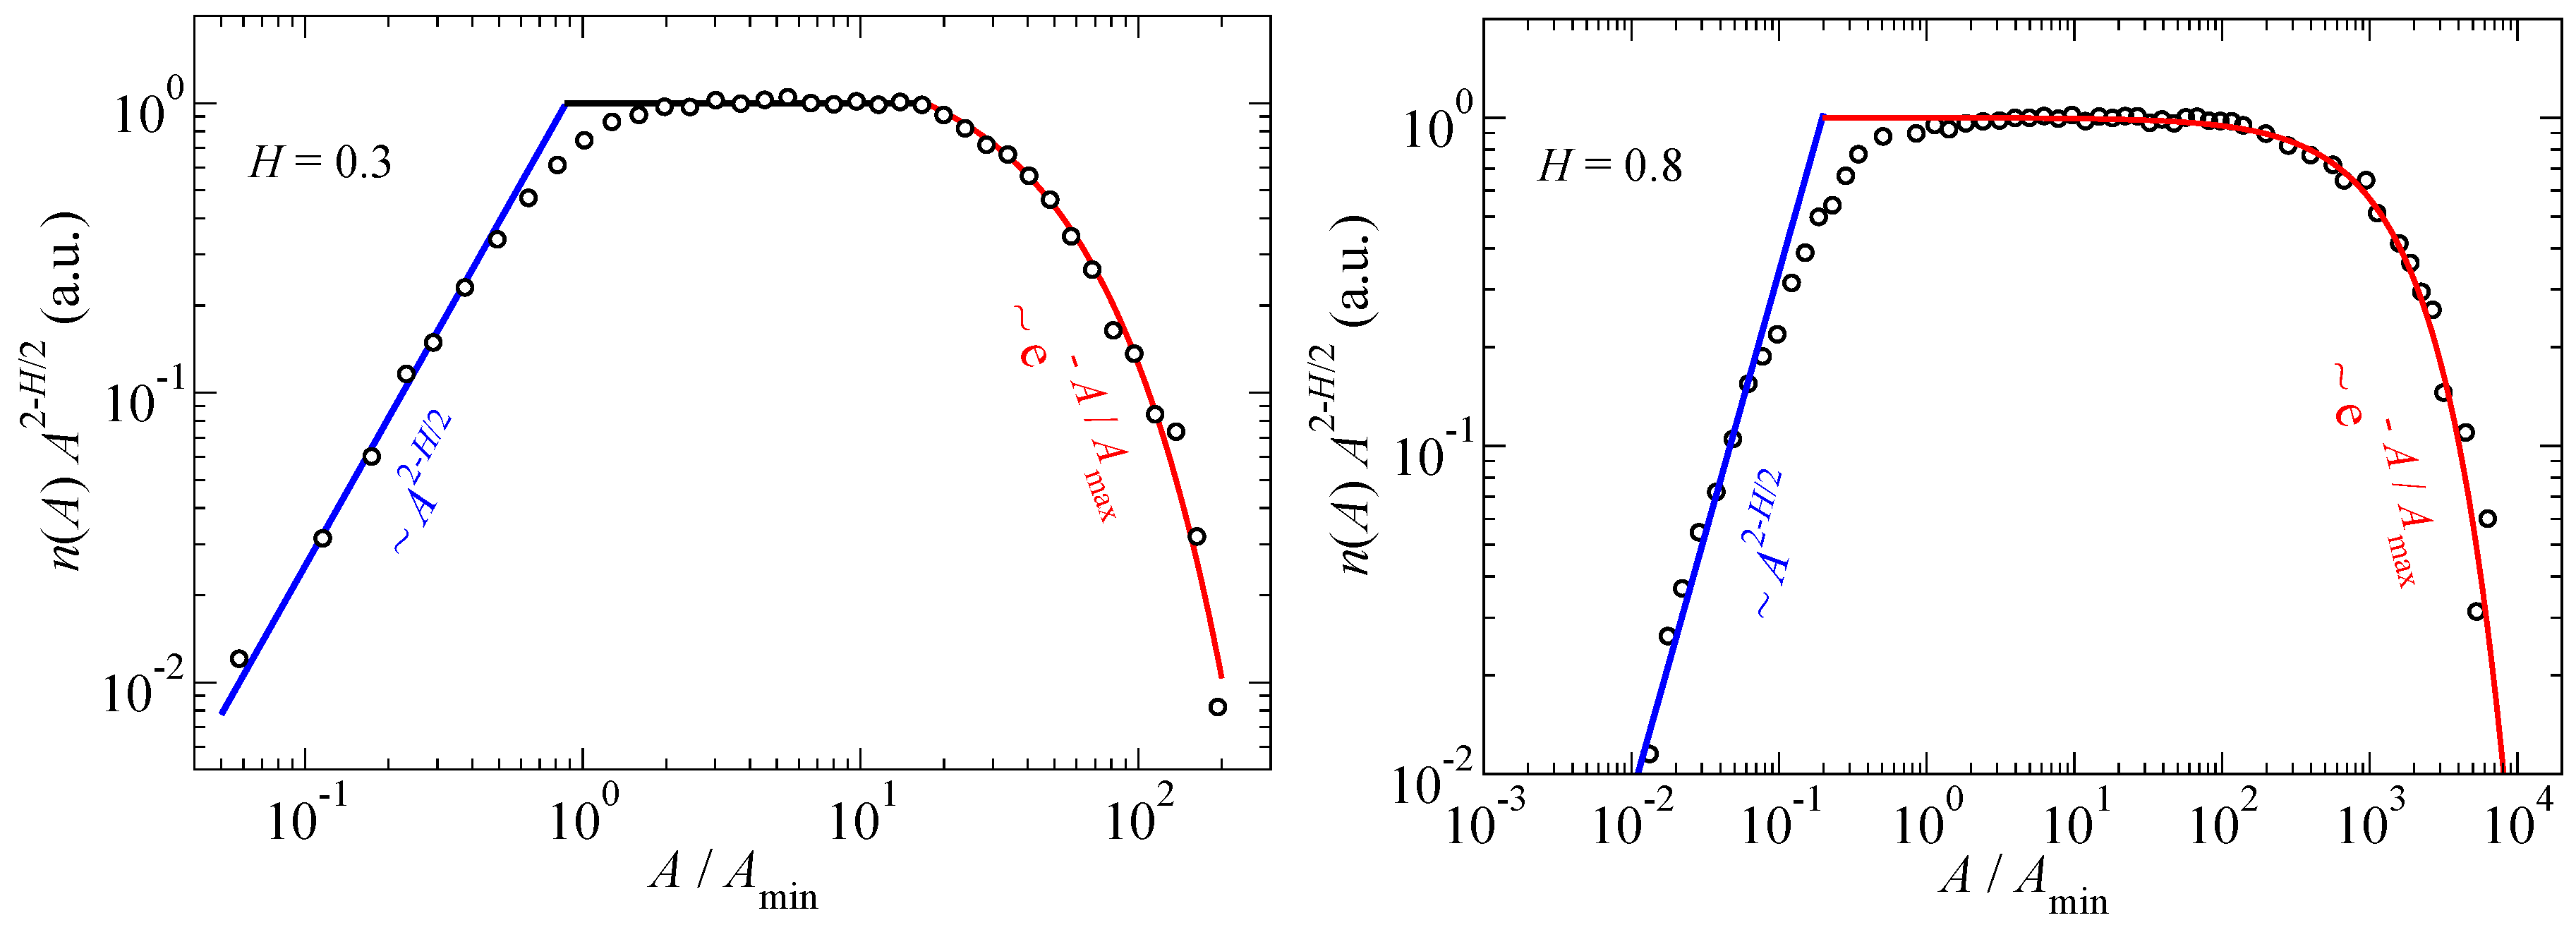
We next analyze the contact-patch-size distribution in Figure 5. The product states the probability that a randomly picked contact patch has a size between A and , where is assumed to be infinitesimally small. When measuring at sufficiently small loads, we find that all data, i.e., many more datasets than the ones shown in Figure 5, are consistent with the Equation (1) and dependence identified for cuts through Gaussian surfaces
in a non-negligible range of values for .
An exponent in the range indicates that the mean contact area is determined by the small patches on the self-affine branch, while the characteristic contact area is determined by the large patches and strongly affected by the value above which power law scaling no longer holds. We also note that the contact area at which the scaling relation changes is within a few 10% of the contact area at which the relation crosses from Hertzian to linear. In addition, the probability of very large clusters to occur is strongly suppressed compared to the scaling at intermediate A. In fact, for , the relation
where is a fitting parameter turning out close to , gives a satisfactory representation of the complete range of -data for and , provided the reference area is appropriately chosen.
The next question to be tackled is to what degree the characteristic patch size changes with the normal pressure. The increasing-load-only-leads-to-more-of-the-same dictum is certainly counterintuitive as each existing patch, including the largest one, is expected to grow with increasing load. Figure 6 reveals that in fact increases with pressure from small to large loads. The pressure dependence of becomes particularly significant near the percolation transition, above which is macroscopically large, whereas it is finite (even in an infinite system) for .
It is interesting to note that, near the percolation threshold, the relation for both and appears to satisfy a power law with a value of . At very small pressures, however, the functional form of —and thus of —seems to differ between and . The is consistent with a rather weak exponential increase of with , while the low-pressure data are better described with a power law and .
Before discussing the results in detail, we note that acquiring statistics is a non-trivial undertaking, since a few large clusters dominate the statistics for the value of . Moreover, one disorder realization gives exactly one data point. It is not obvious how to perform a disorder average without increasing , which is highly demanding computationally. For these reasons, it is currently difficult to determine with certainty whether the low-pressure dependence is indeed exponential for and a power law for . For similar reasons, it is much more difficult to determine critical exponents near the percolation threshold for elastic contacts than for simple percolation models, such as the random-on/off-bond model defined on lattices. Some aspects pertaining to this issue have been touched upon in the context of the Reynolds flow through the thin gap between a randomly rough substrate and an elastic manifold that is squeezed against it [34,38].
The growth of with load well below the percolation threshold, i.e., at loads where the stress distribution function is only weakly dependent on load, may affect the likelihood of plastic events. A larger contact patch effectively corresponds to a larger indenter exerting the same mean stress on the deformable body as a smaller indenter. Since plasticity, in contrast to elasticity, is not scale free, plastic events are very likely to be superlinear in load once the pressure is sufficiently large for to noticeably grow with p.
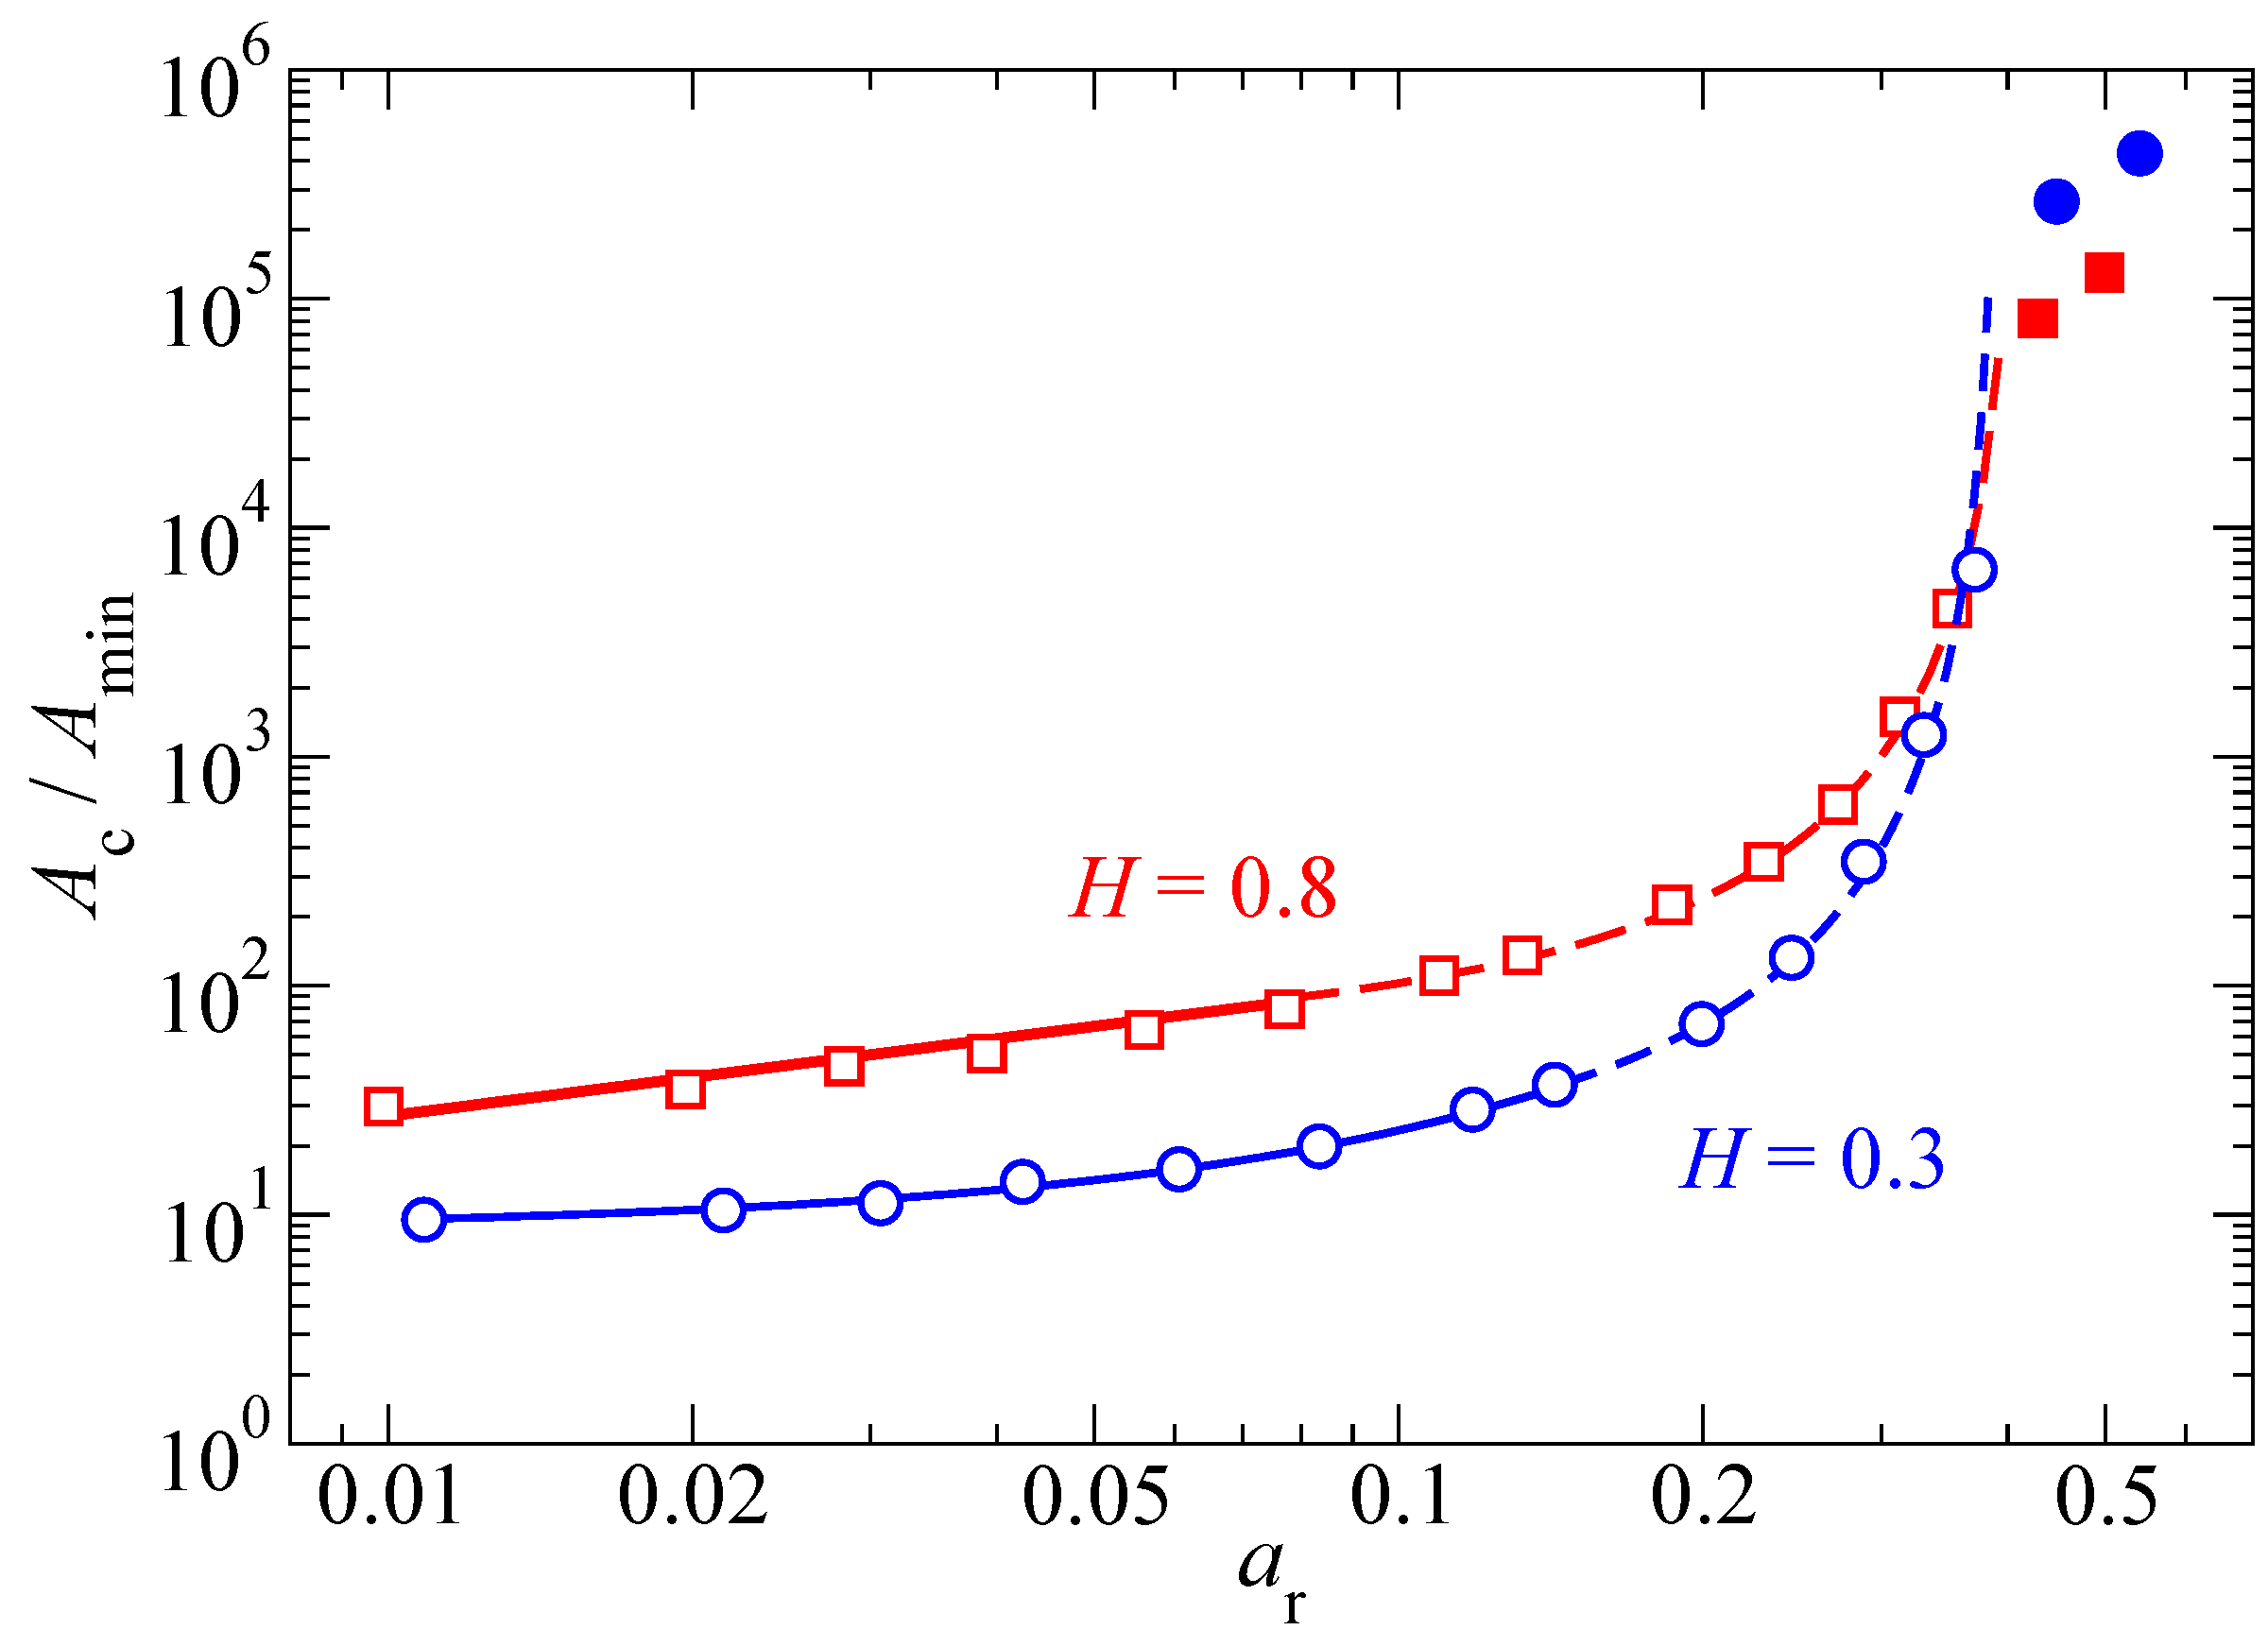
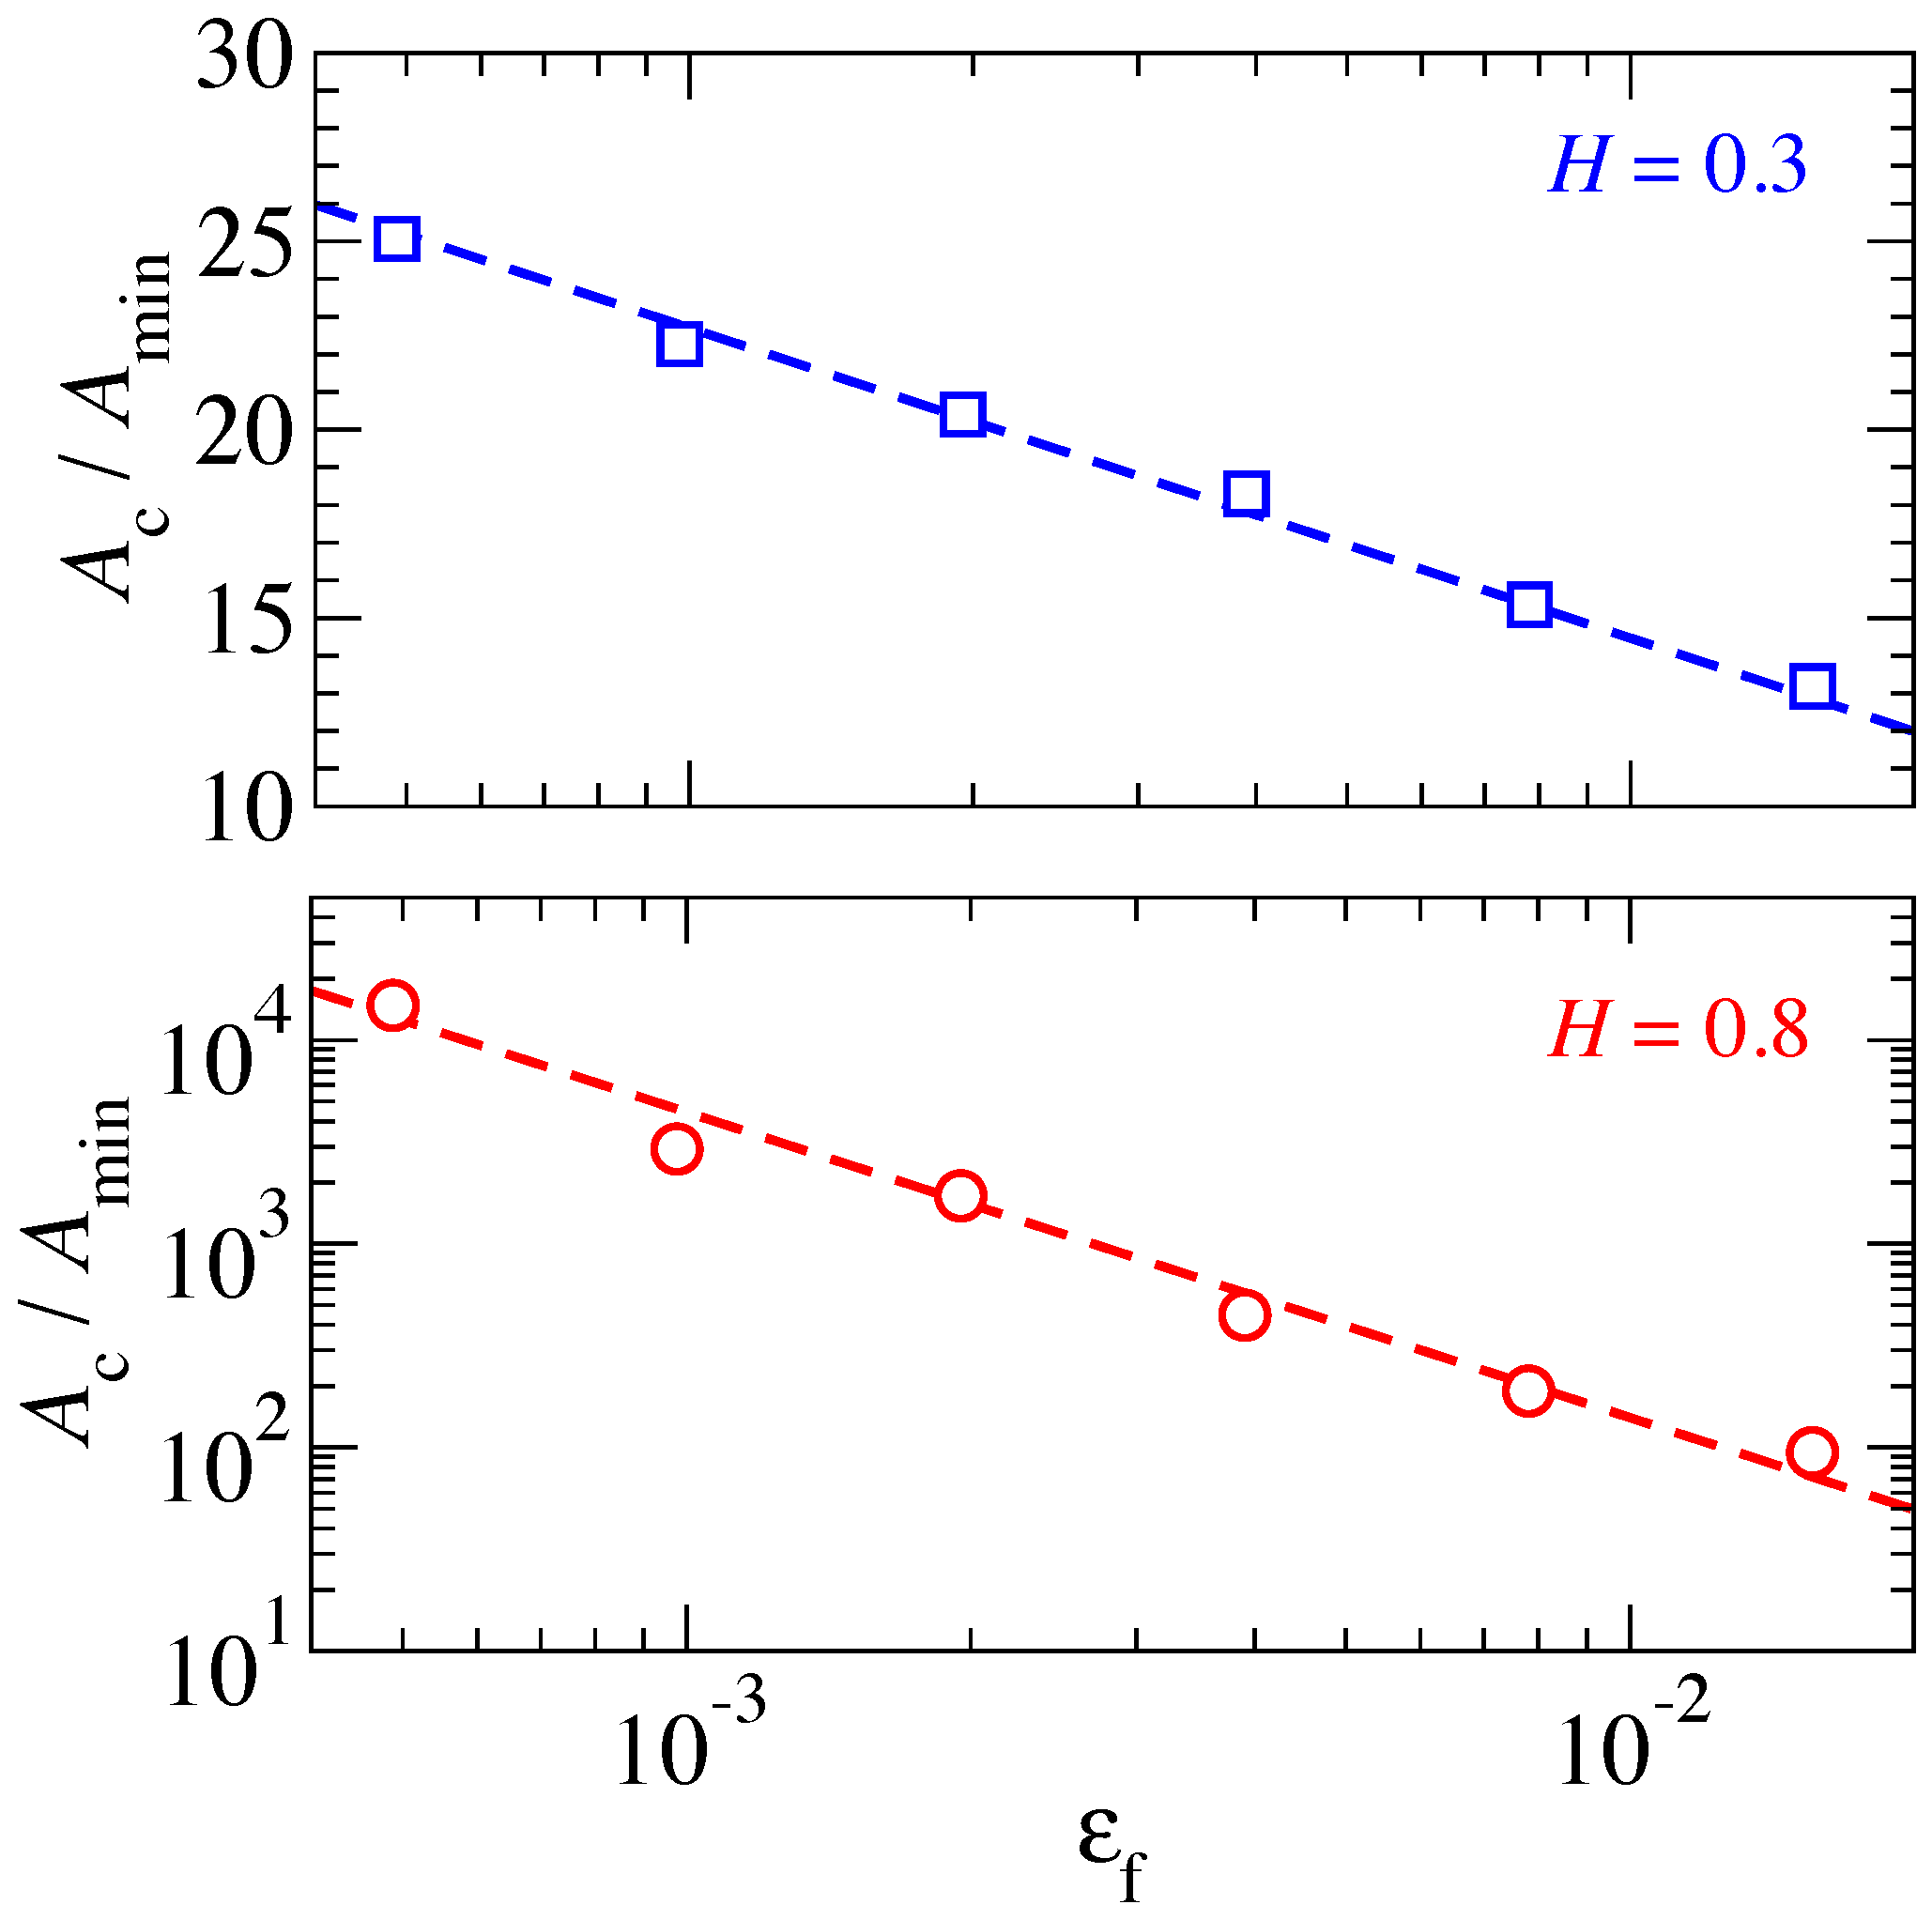
Another dimensionless variable, which affects the patch-size distribution and thus the characteristic patch size quite substantially, is the dimensionless ratio (see Figure 7). This time, a qualitative difference is clearly borne out for the two investigated Hurst exponents. For , a systematic increase of with in form of a power law is observed in the investigated range of . In contrast, the system shows a rather weak dependence at fixed load, which is roughly logarithmic. The difference between the largest and smallest value of for the system is a factor of two, while it is more than a factor of 200 for the system.
This difference in scaling of can be rationalized as follows: For , the dominant part of the elastic energy needed to conform two surfaces is dominated by the short-wavelength deformations, while the opposite holds for . Consequently, a substrate bears many patches of size on a scale , since it is not energetically expensive to form contact at distant asperities. In contrast, a substrate only has at best a few dominant mesoscale asperities in contact over an area of order . Due to this qualitative difference, we expect that not only the functional form of the laws differ between Hurst exponents above and below , but also the functional form of the low-pressure dependence, even if the currently available data on by itself is too meager to provide strong support for this latter claim.
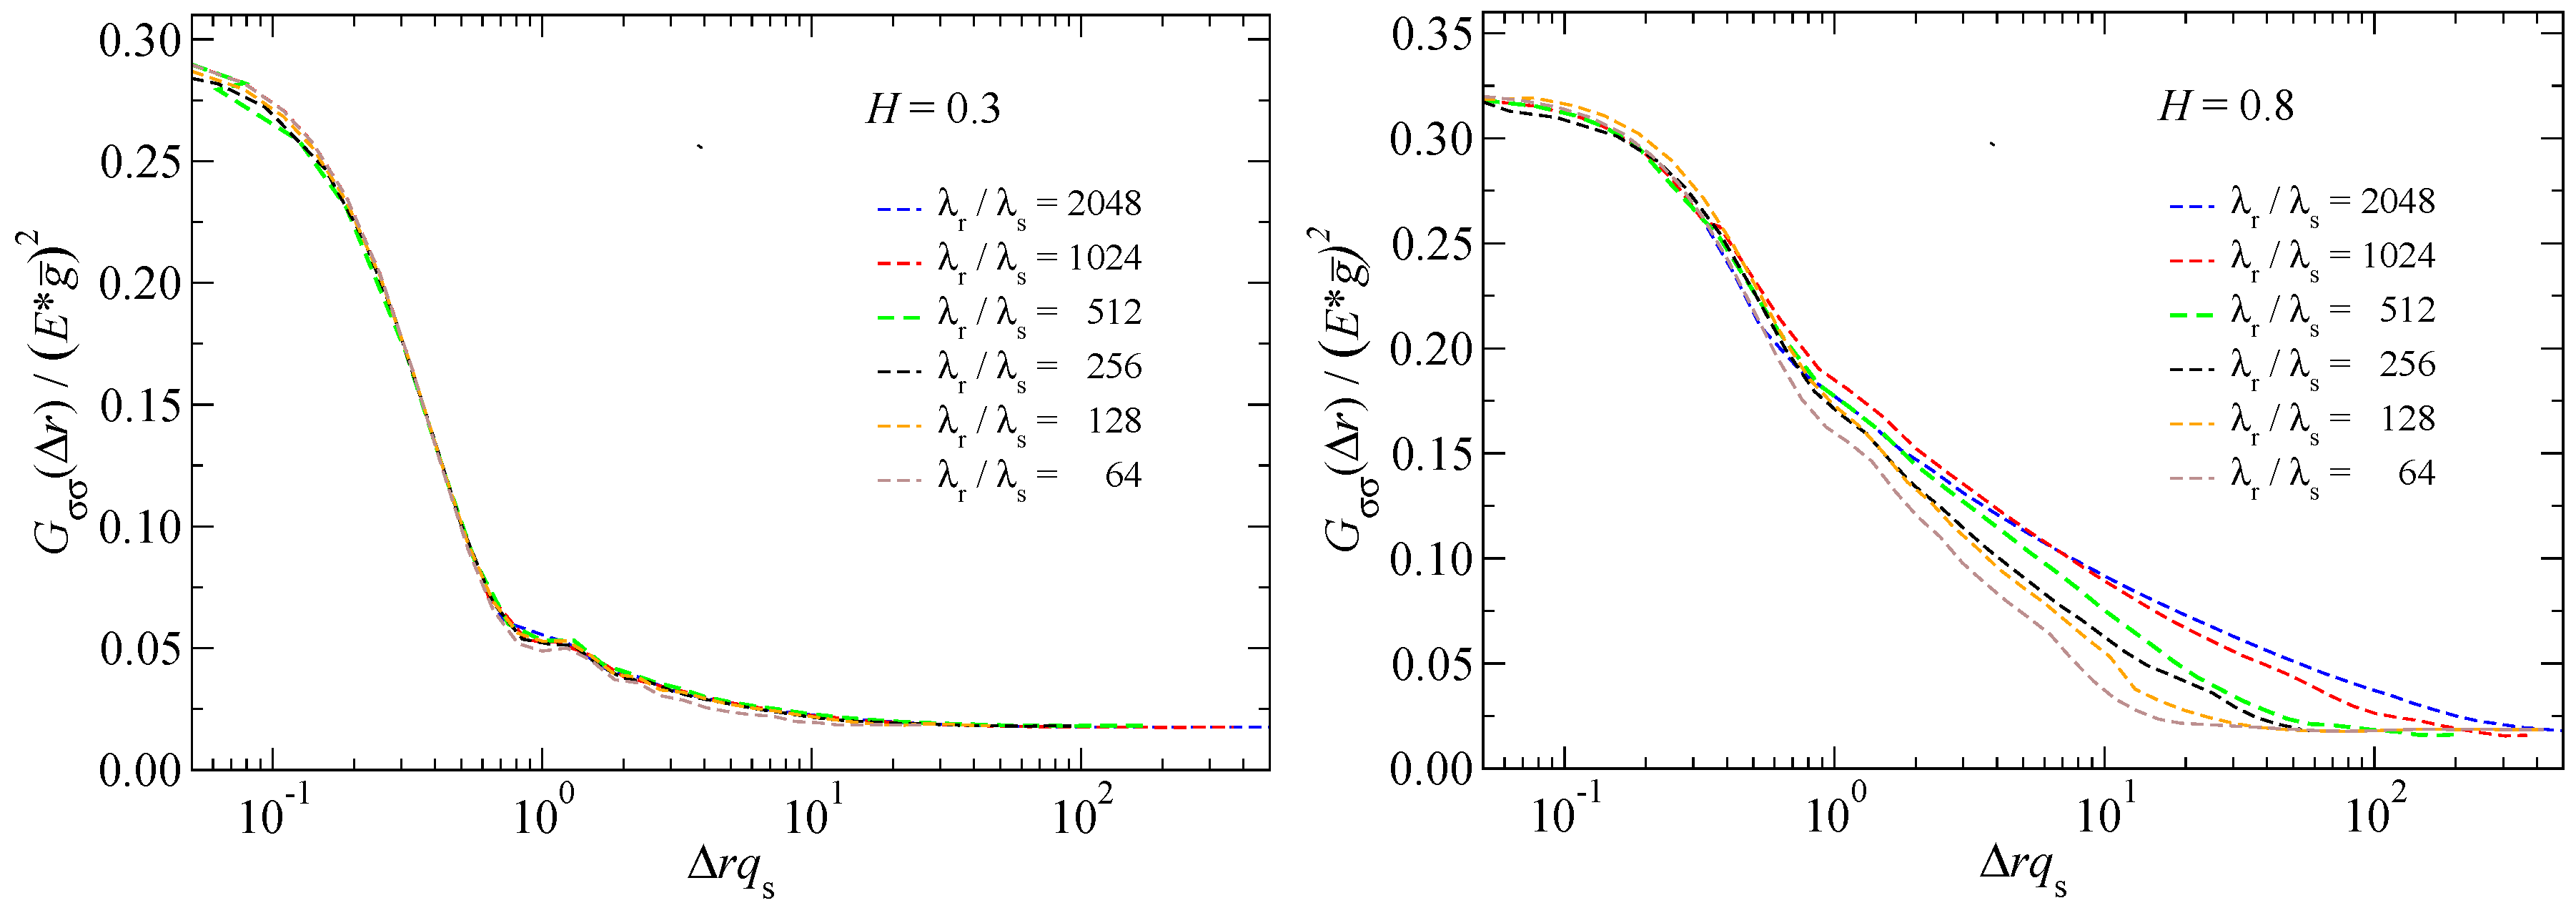
It still needs to be shown that the radius of a characteristic cluster correlates with the distance at which the stress ACF drops to a value near . Towards this end, the stress ACF is shown in Figure 8 at different values of . It can be seen that the stress ACF has decayed to a rather small value at a relatively short distance, i.e., to a value well below on a distance that is of . Subsequently, there is little dependence of the stress ACF for . This is different for the surface, where stress correlations are much longer ranged than for , and, moreover, distinctly more sensitive to the ratio .
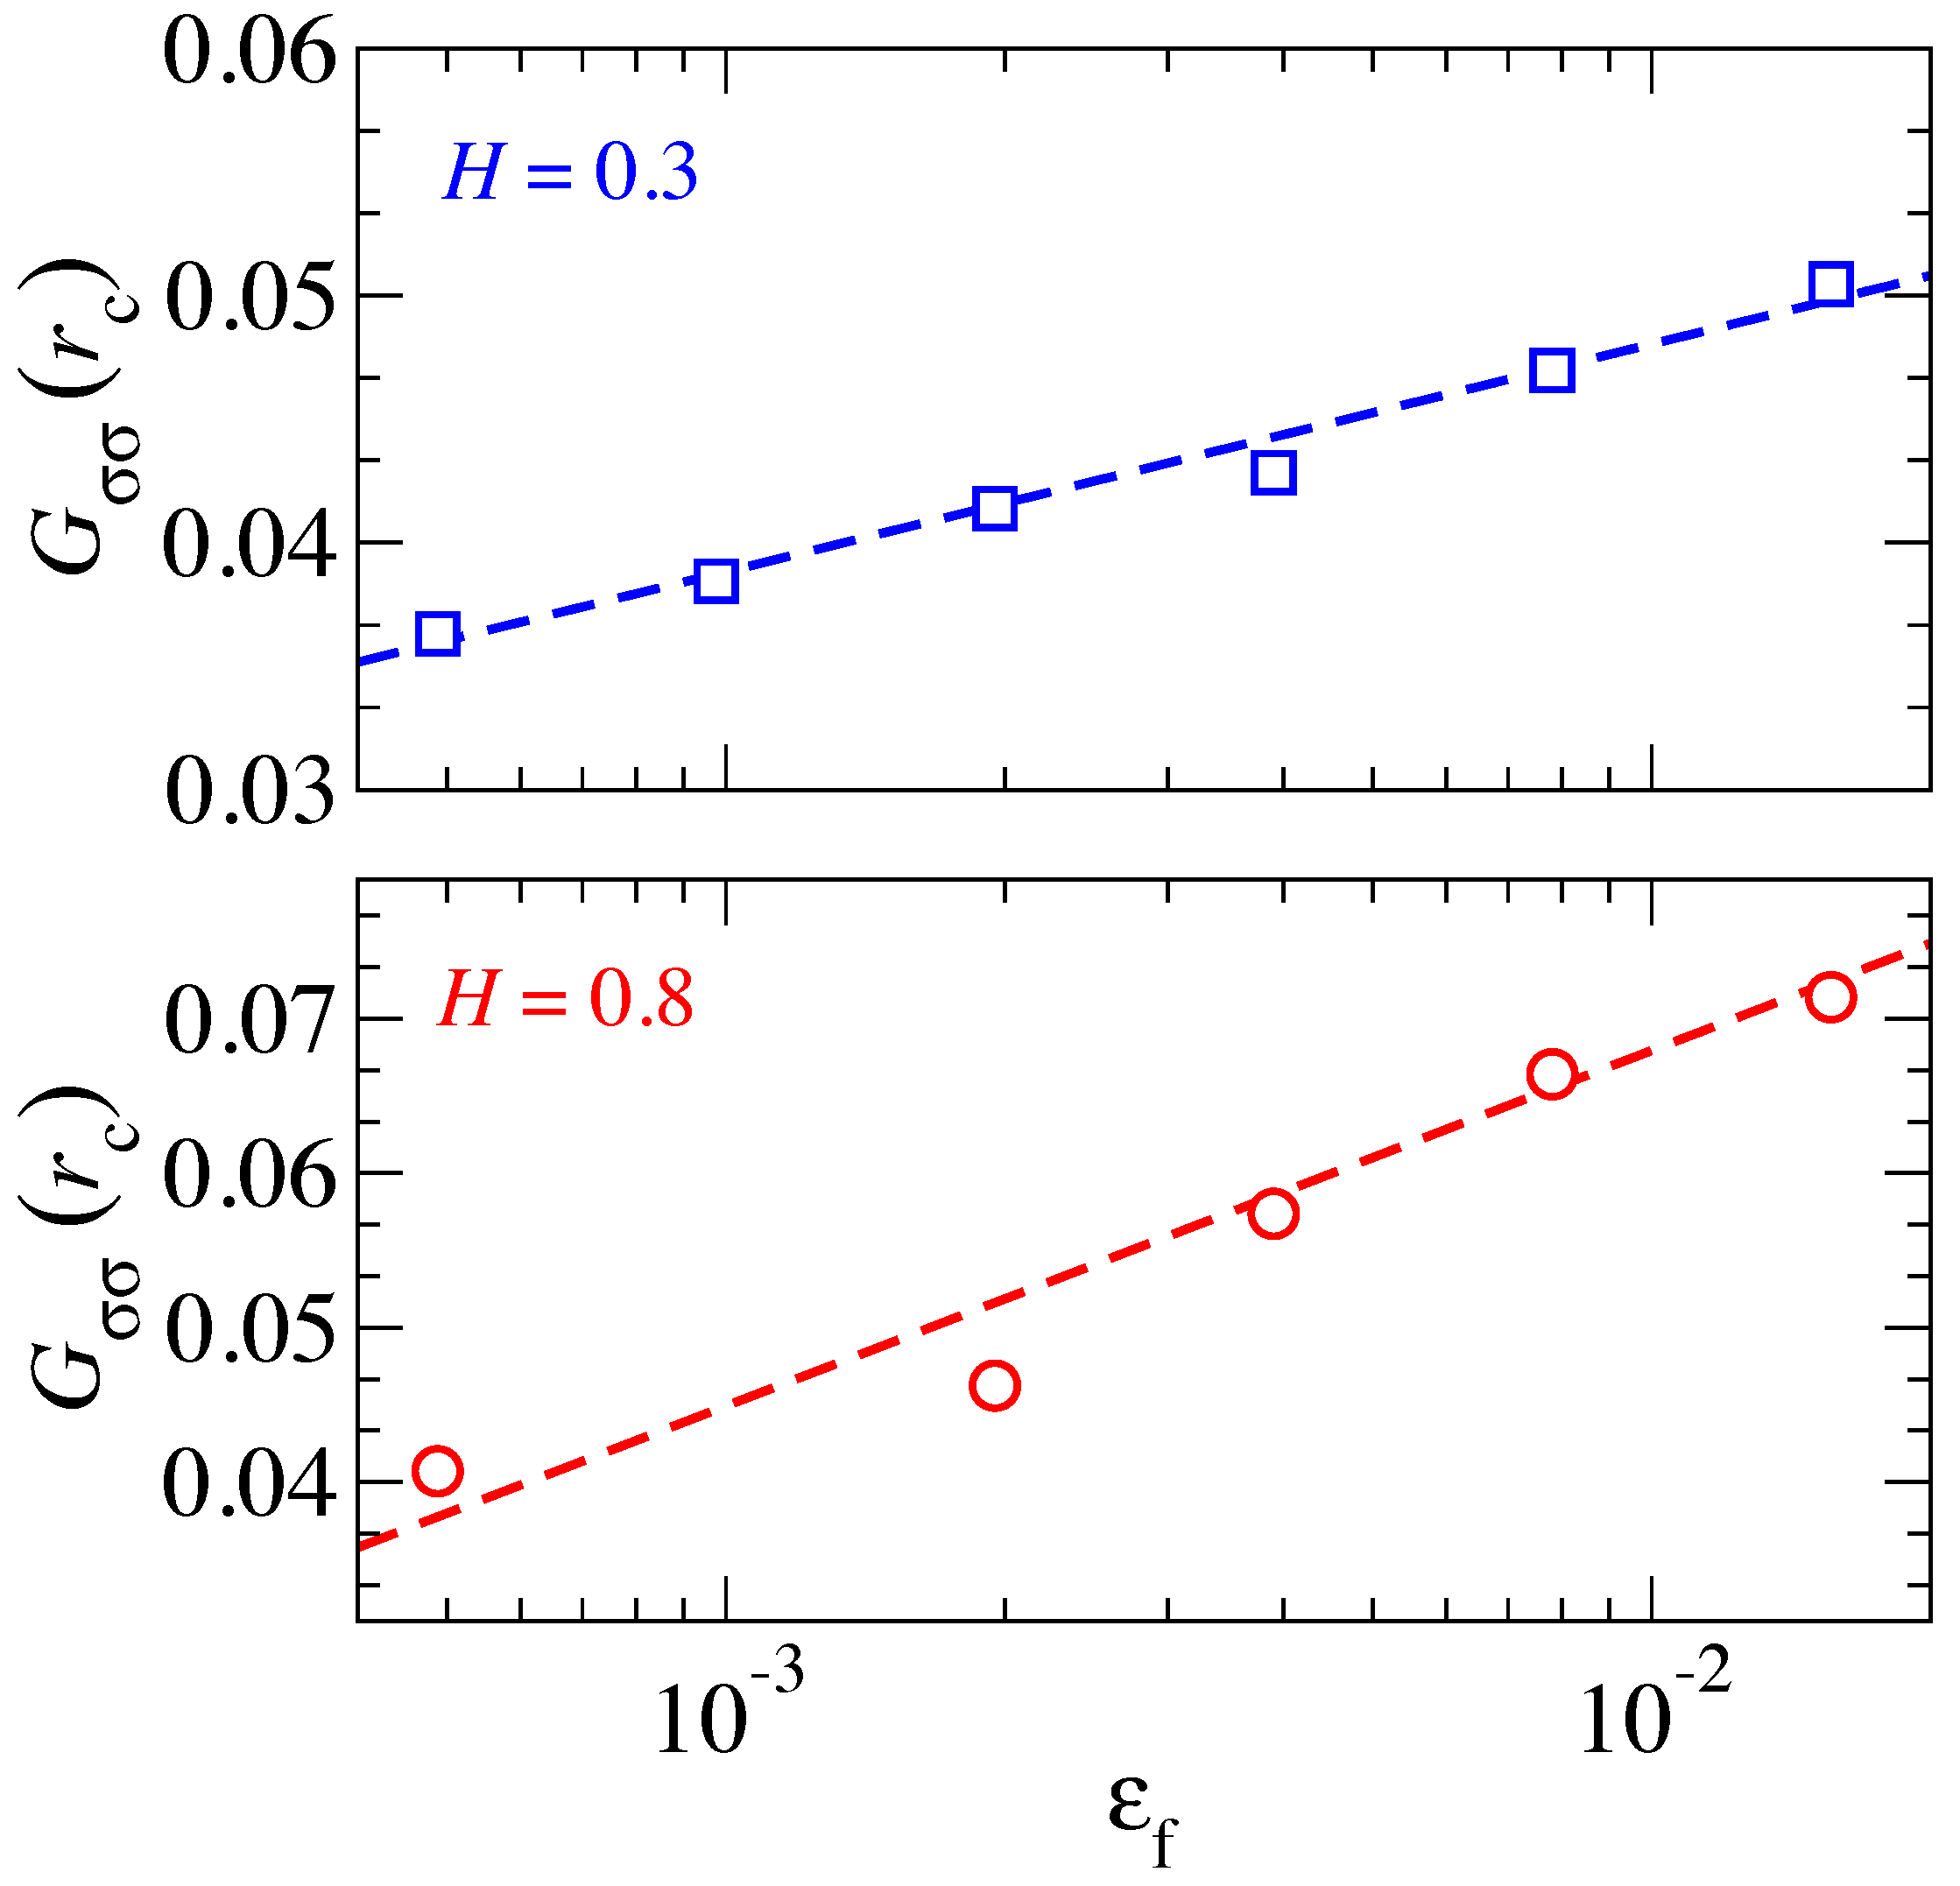
Figure 9 tests our hypothesis that contact patch radii defined as should satisfy . Towards this end, we show at a fixed load for a variety of ratios of . It turns out that the inequality is well obeyed and that the value of only depends weakly, i.e., logarithmically, on .
For completeness, Figure 10 shows how the stress ACF changes with dimensionless pressure, when all other (dimensionless) parameters are kept constant. Similar curves (with a slightly different definition of the stress ACF) have been reported before, see, e.g., Figures 7 and 8 in Ref. [25], where we also tested and thereby validated the suitability of Persson theory with respect to the prediction of stress-ACF’s.
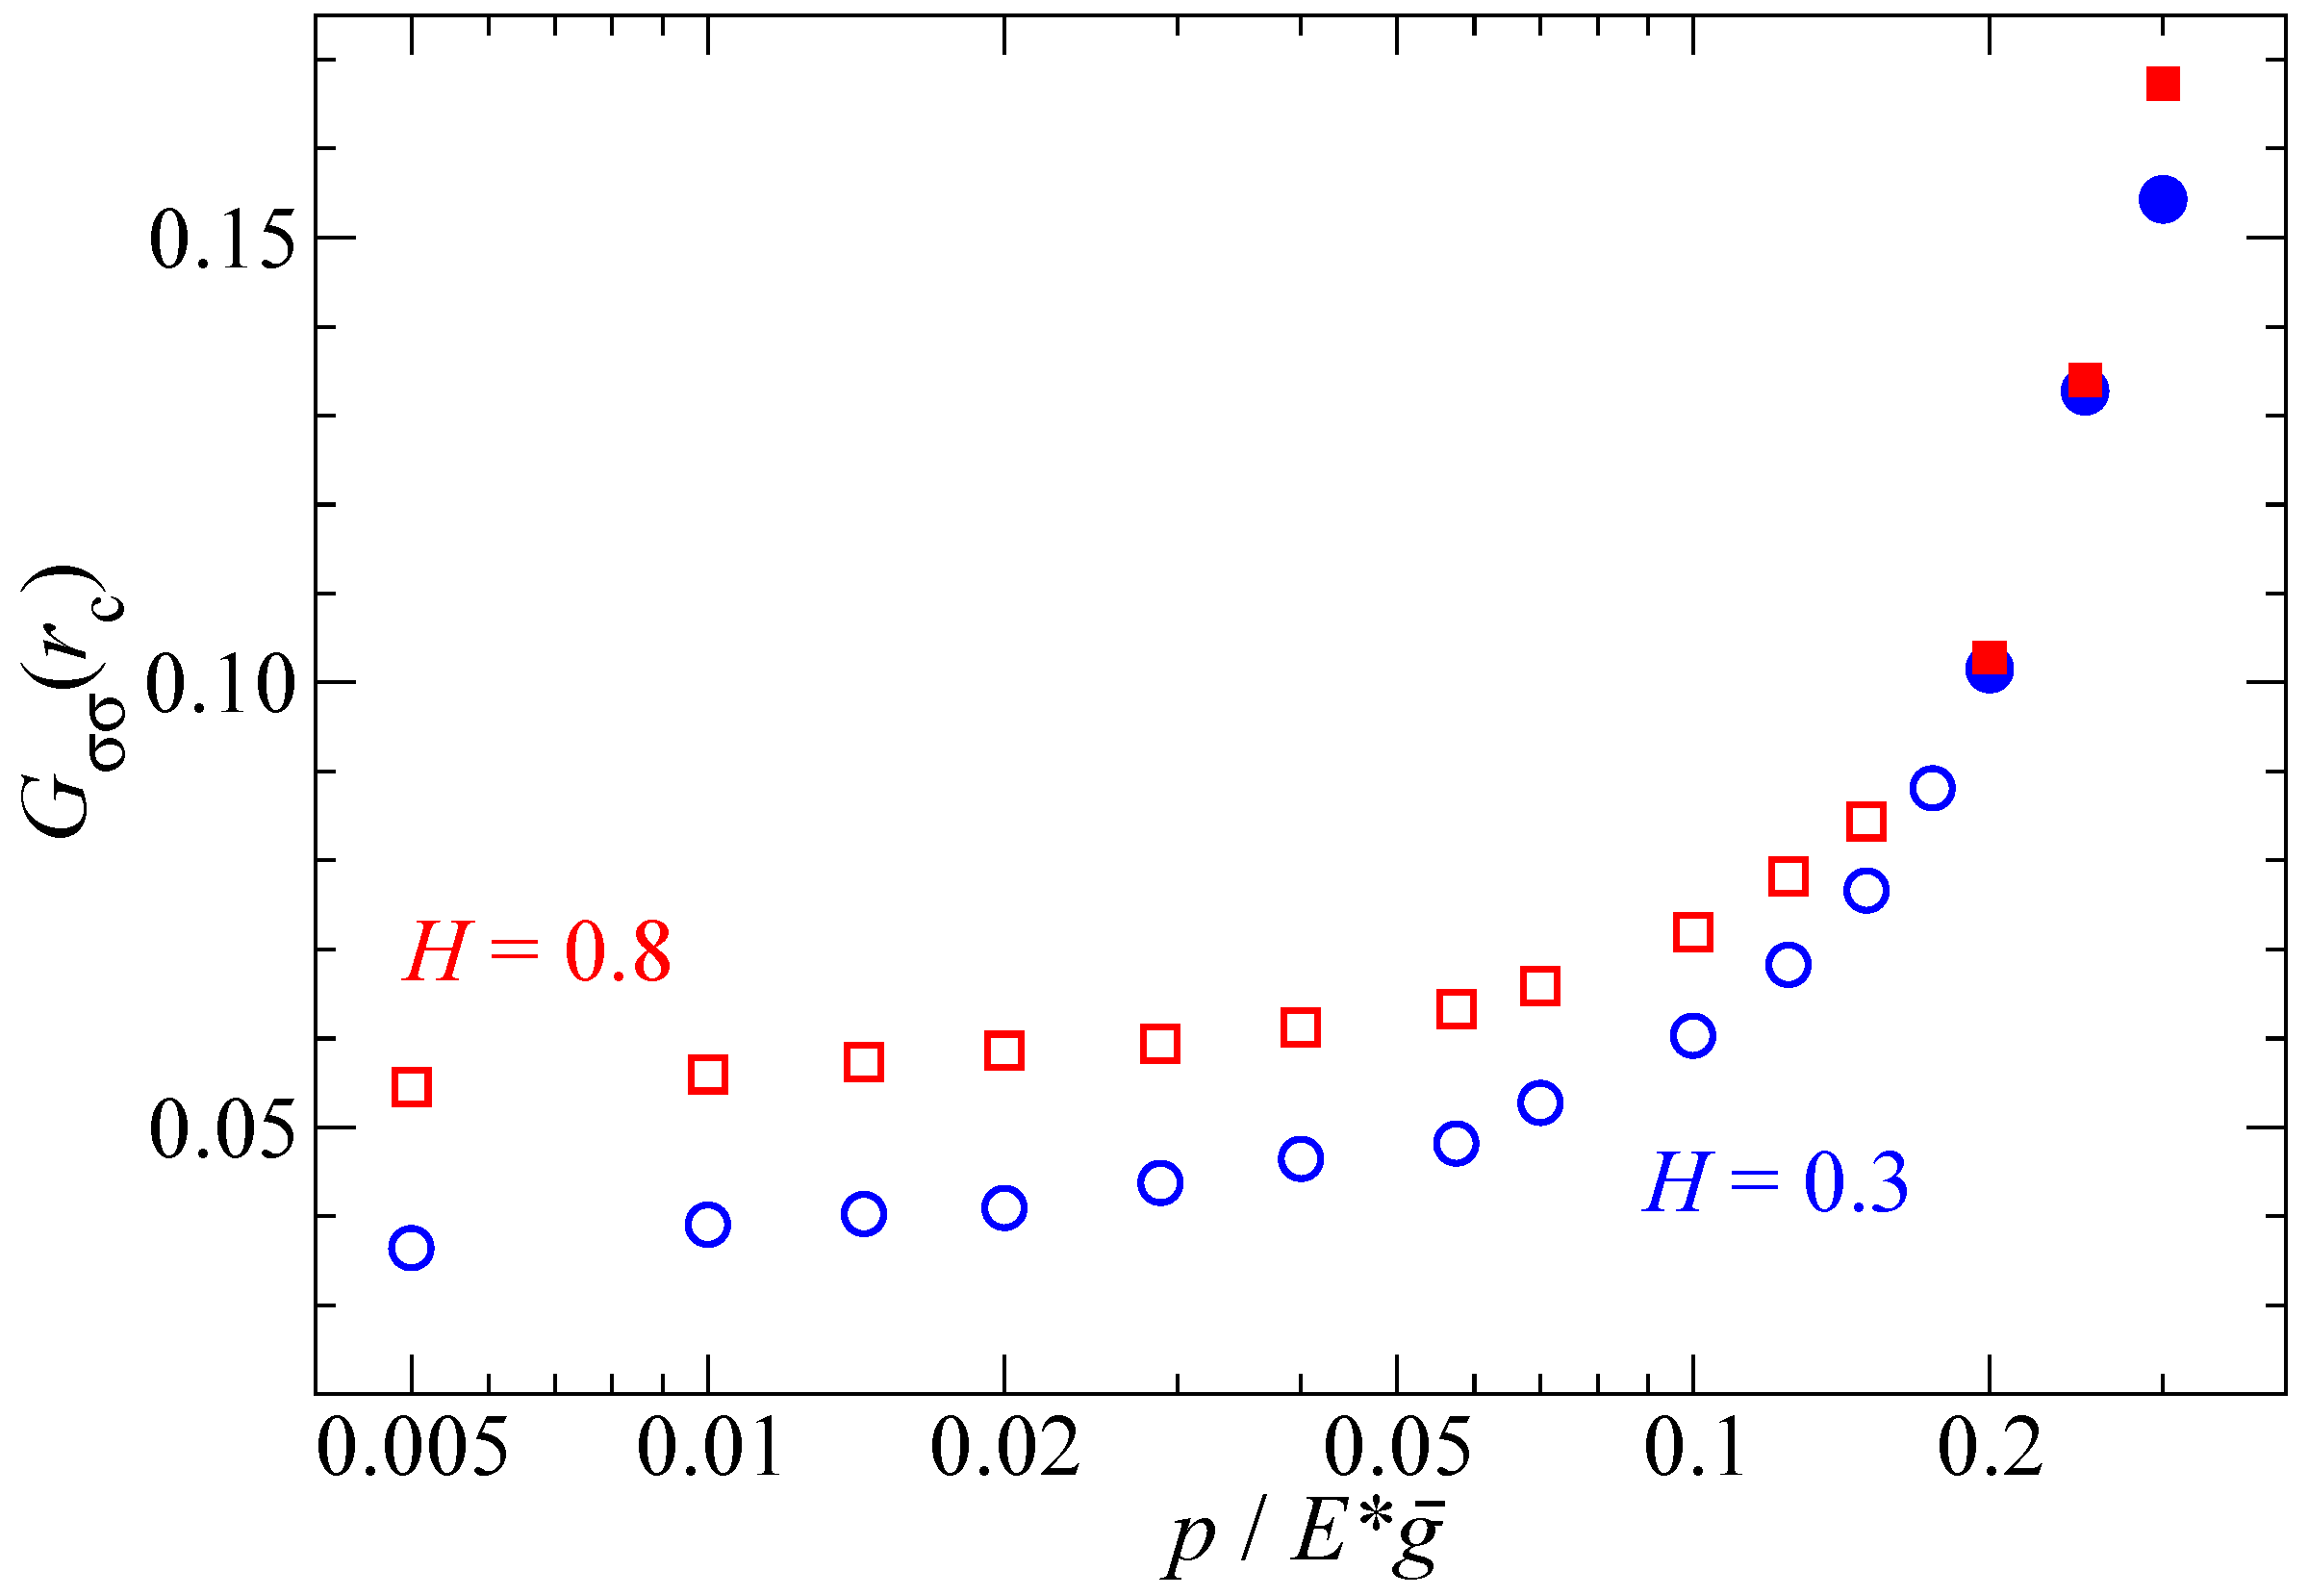
Curves such as those shown in Figure 10 are then used to deduce the value of , which then enters the test of our hypothesis that the radius of characteristic patches satisfies at . Another such test is shown in Figure 11, which includes percolated contacts.
As argued in Section 2.3, exceeds for . Because of the relatively small system system sizes investigated here (the relevant number is , at least for ), the standard deviation with respect to the quite accurate literature estimate [34] of is non-negligible. For the two investigated samples (different values of H but identical seeds used for the random number generator defining the surface realization), percolation occurred slightly below the value of , which was obtained using much larger values of . The transition between percolated and non-percolated contact occurs, as argued in the theory section, near .
4. Conclusions
In this article, we have analyzed and rationalized the distribution of contact patch sizes in contacts between adhesionless, randomly rough, elastic solids. Our simulations revealed that the scaling relation known for the number density of large contact patches, i.e., , breaks down at a characteristic (maximum) patch size , where the scaling crosses over to a superexponential decay. Our theoretical considerations allow the range of validity for the scaling relation to be crudely estimated. Likewise, it allows the characteristic contact-patch size to be estimated from any theory that allows a reliable calculation of the stress ACF. Thus far, Persson’s approach to contact mechanics has been successful in this regard [25,33,39,40], while bearing models that do not incorporate pairwise elastic interactions between asperities are doomed to fail by design [40]. Additional theory is nonetheless required to explain the observed dependence of the exponent on the Hurst exponent, which we identify as . Since the total contact area is readily predicted, as are and , this theory would have to explain either the exponent directly or indirectly through the prediction of the prefactor for the number density .
The dependence of the exponent on H is consistent with results deduced from cuts through Gaussian surfaces [13,14]. This is quite surprising, because the exponents describing the spatial correlation of contact differ quite substantially between those valid for elastic contacts from those obtained from cuts through the surface [19,40]. However, it seems as if changes to the model can alter the precise value of exponents. For example, the problem assigned in the contact-mechanics challenge [19] included moderate adhesion (large enough to increase by 50%, but too small to induce substantial stickiness) reduced the value for a surface from to . This result can be rationalized with the argument that adhesion favors the existence of large patches, because a small separation between two clusters become energetically unfavorable, whereby small contact patches are removed and added to large patches.
Our simulations demonstrated that the increasing-load-only-leads-to-more-of-the-same (ILOL2MOTS) dictum—which is approximately valid for the contact mechanics of self-affine, randomly surfaces at small stresses—starts to be a poor approximation well below the percolation pressure. As proposed in the Introduction, this observation provides a possible explanation for why Amontons’ law or Ryes–Archard’s law break down at large loads, even if the pressure is sufficiently small for the stress distribution (within the contact) to remain essentially unchanged when is multiplied or divided by a factor of two. We certainly do not mean to claim that it is the only possible explanation and perhaps not even a very common one. After all, in many practical applications, the generation of debris and the subsequent third-body distribution—as discussed, for example, by Blau in the context of running-in [41]—may be more critical than surface topography and contact mechanics.
When considering debris particles, whose presence leads to more wear and thus to more debris particles and higher friction, it is clear that the ILOL2MOTS dictum may not even hold at low pressures. In addition, elastic coupling between asperities can affect the friction-load [9] or the wear-load [11] dependence under certain circumstances However, when these mechanisms are irrelevant, our findings suggest that the dictum may still break down at a lower pressure than would be expected based on the study of the stress distribution function alone. The latter can look essentially indistinguishable for a system with, say, 0.05% and 10% relative contact area. However, since the way in which stress is spatially distributed differs between the two characteristic patch sizes are distinctly smaller at 0.05% than at 10% contact area, it is clear that any size dependence of plasticity can be revealed before (predicted, elastic) contact stresses start to raise. This issue is discussed in more detail in the next paragraph with an emphasis on Amontons’ law.
In systems where plasticity (and thus wear) are negligibly small at small loads, dissipation must be expected to occur predominantly within the boundary lubricant. Friction then results as a surface integral over the shear stress, which is a function of normal stress—and potentially velocity. Since the normal, interfacial stress distribution in a randomly rough contact barely changes with load (when normalized to the real contact area), not only the contact area but also friction can turn out linear in load even when the local dependence of shear on normal stress is non-linear. This argument is no longer correct, when the characteristic patch size exceeds a critical value, above which plasticity is no longer negligible or independent of patch size. Additional dissipation mechanisms come into play so that friction increases superlinearly with load. Thoughts along these lines might also matter for adhesive surfaces, for which the existence of a critical contact-patch size has been proposed, below which plastic deformation within the bulk prevails and above which surfaces yield through adhesive wear [10,15].
Let us conclude this work with an answer to the question how much grows—at small stresses for a surface—when the roughness, i.e., the root-mean-square (rms) height is doubled. The doubling can be achieved, for example, by leaving , as well as the load L unchanged, while the height spectrum is replaced with . Dimensional analysis reveals that—within linear elasticity and the small-slope approximation—the effect on contact mechanics is the same as if the load were doubled or the apparent contact were halved and all geometric surface parameters kept unchanged [26]. Under such a transformation, would roughly increase by a factor , which amounts to an increase of approximately 50% for of a generic surface.
The doubling of the rms-height can also be achieved by leaving the pressure and the prefactor of constant, while increasing the ratio . For sufficiently small , this means that also the reduced pressure remains unchanged. It is readily found that scales with , so that doubling the roughness necessitates an increase of for our surface. This in turn means an increase of by approximately .
An increase of by a factor of 3.7 (induced by the doubling of the rms-height through a pertinent change of ) might not sound much more dramatic than an increase by 1.5 (induced by scaling all heights at a given in-plane position with a factor of 2). However, if is changed by a factor of say 100 (the difference between two surfaces being polished to either 1 m or 0.1 mm), these numbers change to 12.5 and 5600, respectively. Thus, polishing not only reduces the local stress by a reduction of root-mean-square height gradients but also by a lowering of the roll-off wavevector leading to smaller, more resilient contact patches.
Author Contributions
M.H.M. conceived the simulation. A.W. and M.H.M. performed the simulations and analyzed the data. M.H.M. wrote the manuscript.
Funding
M.H.M. acknowledges financial support from the DFG through grant Mu-1694/5-2.
Acknowledgments
M.H.M. acknowledges ten-year-old but still inspiring discussions with Carlos Campaña.
Conflicts of Interest
The authors declare no conflict of interest.
References
- Dowson, D. History of Tribology; John Wiley & Sons, Inc.: New York, NY, USA, 1998. [Google Scholar]
- Bowden, F.P.; Tabor, D. Friction and Lubrication; Wiley: New York, NY, USA, 1956. [Google Scholar]
- Persson, B.N.J.; Sivebaek, I.M.; Samoilov, V.N.; Zhao, K.; Volokitin, A.I.; Zhang, Z. On the origin of Amonton’s friction law. J. Phys. Condens. Matter 2008, 20, 395006. [Google Scholar] [CrossRef]
- Persson, B.N.J. Theory of rubber friction and contact mechanics. J. Chem. Phys. 2001, 115, 3840. [Google Scholar] [CrossRef]
- Pei, L.; Hyun, S.; Molinari, J.; Robbins, M.O. Finite element modeling of elasto-plastic contact between rough surfaces. J. Mech. Phys. Solids 2005, 53, 2385–2409. [Google Scholar] [CrossRef]
- Campañá, C.; Müser, M.H. Contact mechanics of real vs. randomly rough surfaces: A Green’s function molecular dynamics study. Europhys. Lett. (EPL) 2007, 77, 38005. [Google Scholar] [CrossRef]
- Hyun, S.; Pei, L.; Molinari, J.F.; Robbins, M.O. Finite-element analysis of contact between elastic self-affine surfaces. Phys. Rev. E 2004, 70, 026117. [Google Scholar] [CrossRef] [PubMed] [Green Version]
- Campañá, C. Using Green’s function molecular dynamics to rationalize the success of asperity models when describing the contact between self-affine surfaces. Phys. Rev. E 2008, 78, 026110. [Google Scholar] [CrossRef] [PubMed]
- Braun, O.; Miyashita, N.; Fujii, H.; Persson, B. On the load dependence of friction: Role of the long-range elastic coupling. Tribol. Int. 2018, 123, 209–215. [Google Scholar] [CrossRef]
- Aghababaei, R.; Warner, D.H.; Molinari, J.F. Critical length scale controls adhesive wear mechanisms. Nat. Commun. 2016, 7, 11816. [Google Scholar] [CrossRef] [PubMed] [Green Version]
- Aghababaei, R.; Brink, T.; Molinari, J.F. Asperity-Level Origins of Transition from Mild to Severe Wear. Phys. Rev. Lett. 2018, 120. [Google Scholar] [CrossRef] [PubMed]
- Dieterich, J.H.; Kilgore, B.D. Direct observation of frictional contacts: New insights for state-dependent properties. Pure Appl. Geophys. PAGEOPH 1994, 143, 283–302. [Google Scholar] [CrossRef] [Green Version]
- Kondev, J.; Henley, C.L. Geometrical Exponents of Contour Loops on Random Gaussian Surfaces. Phys. Rev. Lett. 1995, 74, 4580–4583. [Google Scholar] [CrossRef] [PubMed]
- Rak, M. Fractals, Scaling and Growth Far from Equilibrium, Paul Meakin, Cambridge Non-linear Science Series 5, Cambridge University Press, Cambridge, 1998, ISBN 0-521-45253-8, pp. 674, £75 (hardback). Int. J. Numer. Model. Electron. Netw. Devices Fields 1999, 12, 493–494. [Google Scholar] [CrossRef]
- Frérot, L.; Aghababaei, R.; Molinari, J.F. A mechanistic understanding of the wear coefficient: From single to multiple asperities contact. J. Mech. Phys. Solids 2018, 114, 172–184. [Google Scholar] [CrossRef] [Green Version]
- Dapp, W.B.; Müser, M.H. Contact mechanics of and Reynolds flow through saddle points: On the coalescence of contact patches and the leakage rate through near-critical constrictions. EPL (Europhys. Lett.) 2015, 109, 44001. [Google Scholar] [CrossRef] [Green Version]
- Afferrante, L.; Carbone, G.; Demelio, G. Interacting and coalescing Hertzian asperities: A new multiasperity contact model. Wear 2012, 278–279, 28–33. [Google Scholar] [CrossRef]
- Afferrante, L.; Bottiglione, F.; Putignano, C.; Persson, B.N.J.; Carbone, G. Elastic Contact Mechanics of Randomly Rough Surfaces: An Assessment of Advanced Asperity Models and Persson’s Theory. Tribol. Lett. 2018, 66. [Google Scholar] [CrossRef]
- Müser, M.H.; Dapp, W.B.; Bugnicourt, R.; Sainsot, P.; Lesaffre, N.; Lubrecht, T.A.; Persson, B.N.J.; Harris, K.; Bennett, A.; Schulze, K.; et al. Meeting the Contact-Mechanics Challenge. Tribol. Lett. 2017, 65. [Google Scholar] [CrossRef]
- Johnson, K.L. Contact Mechanics; Cambridge University Press: Cambridge, UK, 1985. [Google Scholar]
- Majumdar, A.; Tien, C.L. Fractal characterization and simulation of rough surfaces. Wear 1990, 136, 313–327. [Google Scholar] [CrossRef]
- Palasantzas, G. Roughness spectrum and surface width of self-affine fractal surfaces via the K-correlation model. Phys. Rev. B 1993, 48, 14472–14478. [Google Scholar] [CrossRef] [Green Version]
- Persson, B.N.J. On the Fractal Dimension of Rough Surfaces. Tribol. Lett. 2014, 54, 99–106. [Google Scholar] [CrossRef]
- Jacobs, T.D.B.; Junge, T.; Pastewka, L. Quantitative characterization of surface topography using spectral analysis. Surf. Topogr. Metrol. Prop. 2017, 5, 013001. [Google Scholar] [CrossRef] [Green Version]
- Wang, A.; Müser, M.H. On the usefulness of the height-difference-autocorrelation function for contact mechanics. Tribol. Int. 2018, 123. [Google Scholar] [CrossRef]
- Prodanov, N.; Dapp, W.B.; Müser, M.H. On the Contact Area and Mean Gap of Rough, Elastic Contacts: Dimensional Analysis, Numerical Corrections, and Reference Data. Tribol. Lett. 2014, 53, 433–448. [Google Scholar] [CrossRef]
- Karpov, E.; Wagner, G.; Liu, W.K. A Green’s function approach to deriving non-reflecting boundary conditions in molecular dynamics simulations. Int. J. Numer. Methods Eng. 2005, 62, 1250–1262. [Google Scholar] [CrossRef]
- Campañá, C.; Müser, M.H. Practical Green’s function approach to the simulation of elastic semi-infinite solids. Phys. Rev. B 2006, 74, 075420. [Google Scholar] [CrossRef]
- Bitzek, E.; Koskinen, P.; Gähler, F.; Moseler, M.; Gumbsch, P. Structural relaxation made simple. Phys. Rev. Lett. 2006, 97, 170201. [Google Scholar] [CrossRef] [PubMed]
- Zhou, Y.; Moseler, M.; Müser, M.H. Setting boundary-element methods on FIRE. 2018; submitted. [Google Scholar]
- Yastrebov, V.A.; Anciaux, G.; Molinari, J.F. From infinitesimal to full contact between rough surfaces: Evolution of the contact area. Int. J. Solids Struct. 2015, 52, 83–102. [Google Scholar] [CrossRef] [Green Version]
- Pastewka, L.; Prodanov, N.; Lorenz, B.; Müser, M.H.; Robbins, M.O.; Persson, B.N.J. Finite-size scaling in the interfacial stiffness of rough elastic contacts. Phys. Rev. E 2013, 87, 062809. [Google Scholar] [CrossRef] [PubMed]
- Wang, A.; Müser, M.H. Gauging Persson theory on adhesion. Tribol. Lett. 2017, 65. [Google Scholar] [CrossRef]
- Dapp, W.B.; Lücke, A.; Persson, B.N.J.; Müser, M.H. Self-Affine Elastic Contacts: Percolation and Leakage. Phys. Rev. Lett. 2012, 108, 244301. [Google Scholar] [CrossRef] [PubMed]
- Dapp, W.B.; Prodanov, N.; Müser, M.H. Systematic analysis of Persson’s contact mechanics theory of randomly rough elastic surfaces. J. Phys. Condens. Matter 2014, 26, 355002. [Google Scholar] [CrossRef] [PubMed] [Green Version]
- Akarapu, S.; Sharp, T.; Robbins, M.O. Stiffness of Contacts between Rough Surfaces. Phys. Rev. Lett. 2011, 106. [Google Scholar] [CrossRef] [PubMed] [Green Version]
- Putignano, C.; Afferrante, L.; Carbone, G.; Demelio, G. A new efficient numerical method for contact mechanics of rough surfaces. Int. J. Solids Struct. 2012, 49, 338–343. [Google Scholar] [CrossRef]
- Dapp, W.B.; Müser, M.H. Fluid leakage near the percolation threshold. Sci. Rep. 2016, 6, 19513. [Google Scholar] [CrossRef] [PubMed] [Green Version]
- Persson, B.N.J. On the elastic energy and stress correlation in the contact between elastic solids with randomly rough surfaces. J. Phys. Condens. Matter 2008, 20, 312001. [Google Scholar] [CrossRef] [Green Version]
- Campañá, C.; Müser, M.H.; Robbins, M.O. Elastic contact between self-affine surfaces: Comparison of numerical stress and contact correlation functions with analytic predictions. J. Phys. Condens. Matter 2008, 20, 354013. [Google Scholar] [CrossRef]
- Blau, P.J. On the nature of running-in. Tribol. Int. 2005, 38, 1007–1012. [Google Scholar] [CrossRef]
Figure 1.
The dimensionless coefficient as a function of the discretization obtained with and without continuum corrections for and . A value of was used in Equation (6) for the corrected contact area. , where is the reduced pressure. System specification: , , and .
Figure 1.
The dimensionless coefficient as a function of the discretization obtained with and without continuum corrections for and . A value of was used in Equation (6) for the corrected contact area. , where is the reduced pressure. System specification: , , and .

Figure 2.
Characteristic contact area with and without continuum corrections as a function of for (top) and (bottom). System specifications: , , and .
Figure 2.
Characteristic contact area with and without continuum corrections as a function of for (top) and (bottom). System specifications: , , and .

Figure 3.
(Top left, top right, bottom right) Visualization of contact stresses in a randomly rough contact at different magnifications. Stresses in the color bar are given in units of ; and (Lower left) stress autocorrelation function. System specification: , , and , leading to a relative contact area of .

Figure 4.
Individual patch size versus load carried by each patch (dots): (Left) ; and (Right) . Stripes in the scatter plot at small A result from the spatial discretization. The open circles indicate running averages of the numerical data. Solid lines represents the theoretical prediction. System specifications: , , and . , which is used to undimensionalize the contact area, is determined from Equation (11) and estimated as .

Figure 5.
Distribution of contact-patch sizes divided by the scaling law at a reduced pressure of : (Left) ; and (Right) . System specification: and .
Figure 5.
Distribution of contact-patch sizes divided by the scaling law at a reduced pressure of : (Left) ; and (Right) . System specification: and .

Figure 6.
Characteristic contact-patch size as a function of load. Closed symbols indicate the cluster size of percolated patches. Broken lines are based on fits of the form . The exponents turned out to lie within , while and were used. Solid lines represent fits to the small-contact-area domain. For the system, an exponential law of the form appeared best, while data were best represented at small with a power law with . System specification: and .

Figure 7.
Characteristic contact-patch size as a function of the ratio at a fixed load: for a surface (top); and for a surface (bottom). The dashed lines are drawn to guide the eye. For the , the dashed line reflects an power law. Note that the ordinate is linear for but logarithmic for . System specification: and .

Figure 8.
Stress ACF as a function of distance r for various values of the ratio at a fixed load for (left) and (right). System specifications: and .
Figure 8.
Stress ACF as a function of distance r for various values of the ratio at a fixed load for (left) and (right). System specifications: and .

Figure 9.
Value of the stress ACF, , at the characteristic contact radius for various values of for (top) and (bottom). System specification: and .
Figure 9.
Value of the stress ACF, , at the characteristic contact radius for various values of for (top) and (bottom). System specification: and .

Figure 10.
Stress ACF as a function of distance r at selected values of the reduced pressure for: (left); and (right). System specification in both cases: and .
Figure 10.
Stress ACF as a function of distance r at selected values of the reduced pressure for: (left); and (right). System specification in both cases: and .

Figure 11.
Value of the stress ACF evaluated at the characteristic patch radius as a function of reduced pressure for two different Hurst exponents. Open and closed symbols refer to data representing non-percolated and percolated contacts, respectively. System specification: and .
Figure 11.
Value of the stress ACF evaluated at the characteristic patch radius as a function of reduced pressure for two different Hurst exponents. Open and closed symbols refer to data representing non-percolated and percolated contacts, respectively. System specification: and .


Table 1.
Definitions of the most important variables and abbreviations.
| exponent in the relation, valid at low-pressures for | |
| exponent in the relation, valid for large systems just below | |
| , | |
| dimensionless proportionality coefficient | |
| roll-off wavelength and short-wavelength cutoff | |
| stress | |
| exponent in the relation | |
| A | area of an individual contact patch |
| characteristic contact-patch area | |
| crossover area from Hertz to self-affine scaling | |
| ACF | autocorrelation function |
| height spectrum | |
| contact modulus | |
| stress ACF | |
| GFMD | Green’s function molecular dynamics |
| H | Hurst exponent |
| L | load or normal force |
| a | discretization length used in the simulation |
| relative contact area at percolation threshold | |
| relative contact area | |
| rms height gradient | |
| rms height | |
| height in real-space and Fourier representation | |
| number density of contact-patch areas | |
| nominal contact pressure | |
| dimensionless contact pressure | |
| pressure at contact-percolation transition | |
| wave vector and its magnitude | |
| , | |
| in-plane vector and its magnitude | |
| characteristic patch radius | |
| rms | root-mean square |
| displacement in real-space and Fourier representation |
© 2018 by the authors. Licensee MDPI, Basel, Switzerland. This article is an open access article distributed under the terms and conditions of the Creative Commons Attribution (CC BY) license (http://creativecommons.org/licenses/by/4.0/).
Share and Cite
MDPI and ACS Style
Müser, M.H.; Wang, A. Contact-Patch-Size Distribution and Limits of Self-Affinity in Contacts between Randomly Rough Surfaces. Lubricants 2018, 6, 85. https://doi.org/10.3390/lubricants6040085
AMA Style
Müser MH, Wang A. Contact-Patch-Size Distribution and Limits of Self-Affinity in Contacts between Randomly Rough Surfaces. Lubricants. 2018; 6(4):85. https://doi.org/10.3390/lubricants6040085
Chicago/Turabian StyleMüser, Martin H., and Anle Wang. 2018. "Contact-Patch-Size Distribution and Limits of Self-Affinity in Contacts between Randomly Rough Surfaces" Lubricants 6, no. 4: 85. https://doi.org/10.3390/lubricants6040085
Note that from the first issue of 2016, this journal uses article numbers instead of page numbers. See further details here.