1. Introduction
Surface texturing is an option of surface engineering resulting in significant improvements in tribological properties of mechanical components. Well-designed surface texturing leads to friction reduction under lubricated contact [
1,
2,
3] because oil pockets act like lubricant reservoirs or they can create additional hydrodynamic lift. Effects of surface texturing in a dry-friction regime were analysed rarely, typically for studying its effectiveness in dry machining. Under dry friction, dimples typically act as traps for wear debris, thus reducing wear. This effect also exists in the mixed-friction regime [
4]. Conradi et al. [
5] found that steel specimens with small line density contacted with ceramic counter specimens under disc-on-ball configuration led to a low friction resistance in dry sliding conditions. Tribological experiments were carried out using textured and nontextured disc specimens under a dry-friction regime at pin-on-disc configuration. Tribological tests revealed a significant reduction in the coefficient of friction due to surface texturing of a disc sample [
6]. The tribological tests of a textured disc sliding against a PTFE pin were conducted under dry-friction condition [
7]. It was found that the ridge had a positive effect on the frictional resistance. The nonpolished textured surface reduced the friction coefficient while the polished surface with dimples increased the friction force. The tribological properties of the textured ceramic disc samples in sliding contact with steel balls were investigated [
8]. The results of tests revealed that the laser-textured samples exhibited higher wear resistance and friction coefficient compared to the smooth disc under a dry-friction regime. The tribological performance of the textured surfaces from the Al alloy in contact with steel balls under dry-friction condition was studied [
9]. It was found that surface texturing could reduce friction. Bhaduri et al. [
10] compared the tribological performance of textured and untextured tungsten carbide (WC) blocks under dry sliding conditions. Surface texturing stabilized friction. The surface friction of smooth and textured aluminum flat specimens against a half-ball counter specimen from polydimethylsiloxane rubber was investigated [
11]. Under dry-friction conditions, surface texturing led to an increase in the friction force. It was found that groove spacing affected frictional behavior and wear performance of a steel–steel assembly under dry contact condition [
12]. Wang et al. [
13] obtained a similar conclusion after reciprocating tests of textured steel flat samples against ceramic balls in dry-friction conditions. The tribological properties of the textured and smooth samples from Si
3N
4/TiC ceramic were investigated by performing sliding wear tests against steel balls under dry condition in a reciprocating motion [
14]. The textured surfaces exhibited a smaller coefficient of friction and wear compared to smooth surfaces. The tribological performance depended mainly on the size and density of the grooves. However, surface texturing caused larger wear of co-acting balls. Borghi et al. [
15] obtained a decrease in the coefficient of friction of about 10% in dry tests using a pin-on-disc tribotester, due to the entrapment of wear particles within the oil pockets. Sun et al. [
16] performed tests in dry unidirectional sliding (pin-on-disc configuration) at a temperature of 500 °C. They found that creation of dimples on disc from the TC1 alloy led to a decrease in volumetric wear of about 50%, due to debris entrapment within the dimples. Ball-on-disk tests showed that a reduction in wear under dry conditions depended on the periodicity of grooved TiAl specimens [
17].
In most of the presented above works, the effect of surface texturing under dry sliding depended on texture dimensions and densities. Gachot et al. [
18,
19] found that the effect of the relative orientation was also important. The coefficient of friction of a steel–steel assembly under flat-on-ball configuration under dry reciprocating sliding was smaller in perpendicular sliding compared to parallel sliding, due to different contact areas.
Fretting is a relative motion with a small amplitude between two oscillating surfaces. Depending on the relative displacements and the normal load, different sliding regimes can be identified: partial-slip and gross-slip regimes [
20,
21]. Fretting damage mode depends on sliding regimes, leading to cracking under partial-slip (lower amplitude) and wear under gross-slip (higher amplitude) conditions. Fretting wear combines various basic types of wear, including adhesion, abrasion, surface fatigue, and oxidation. In fretting wear, the generated oxide debris is of huge importance. Two opposite effects of wear debris on material loss were identified, harmful due to the abrasive action or beneficial due to formation of the oxide layer; these effects depend on the kind of wear (abrasion or adhesion) [
22]. Varenberg at al. [
23] studied various roles of oxide wear particles present during dry fretting by allowing them to escape from the contact zone during sliding into dimples. It was found that their presence in the interface protected surfaces when adhesion was the dominant wear type and harmed surfaces when abrasion dominated. However, Varenberg et al. [
23] did not calculate directly volumetric wear; they analysed only the mean coefficient of friction. They also found that surface texturing improved the electrical conductivity under fretting conditions.
Surface texturing was also applied in lubricated fretting in order to improve tribological performances of sliding pairs. The presence of dimples led to acceleration of running-in [
24,
25].
In most of the cited papers related to tribological effects of surface texturing in a dry-friction regime, ball-on disc tests were used. In the study of fretting devices that form single point contact, ball-on flat are frequently used. Only Varenberg at al. [
23] applied surface texturing for dry fretting conditions.
The aim of this work is to study the effect of surface texturing on dry gross fretting in dependence of dominant wear type.
2. Materials and Methods
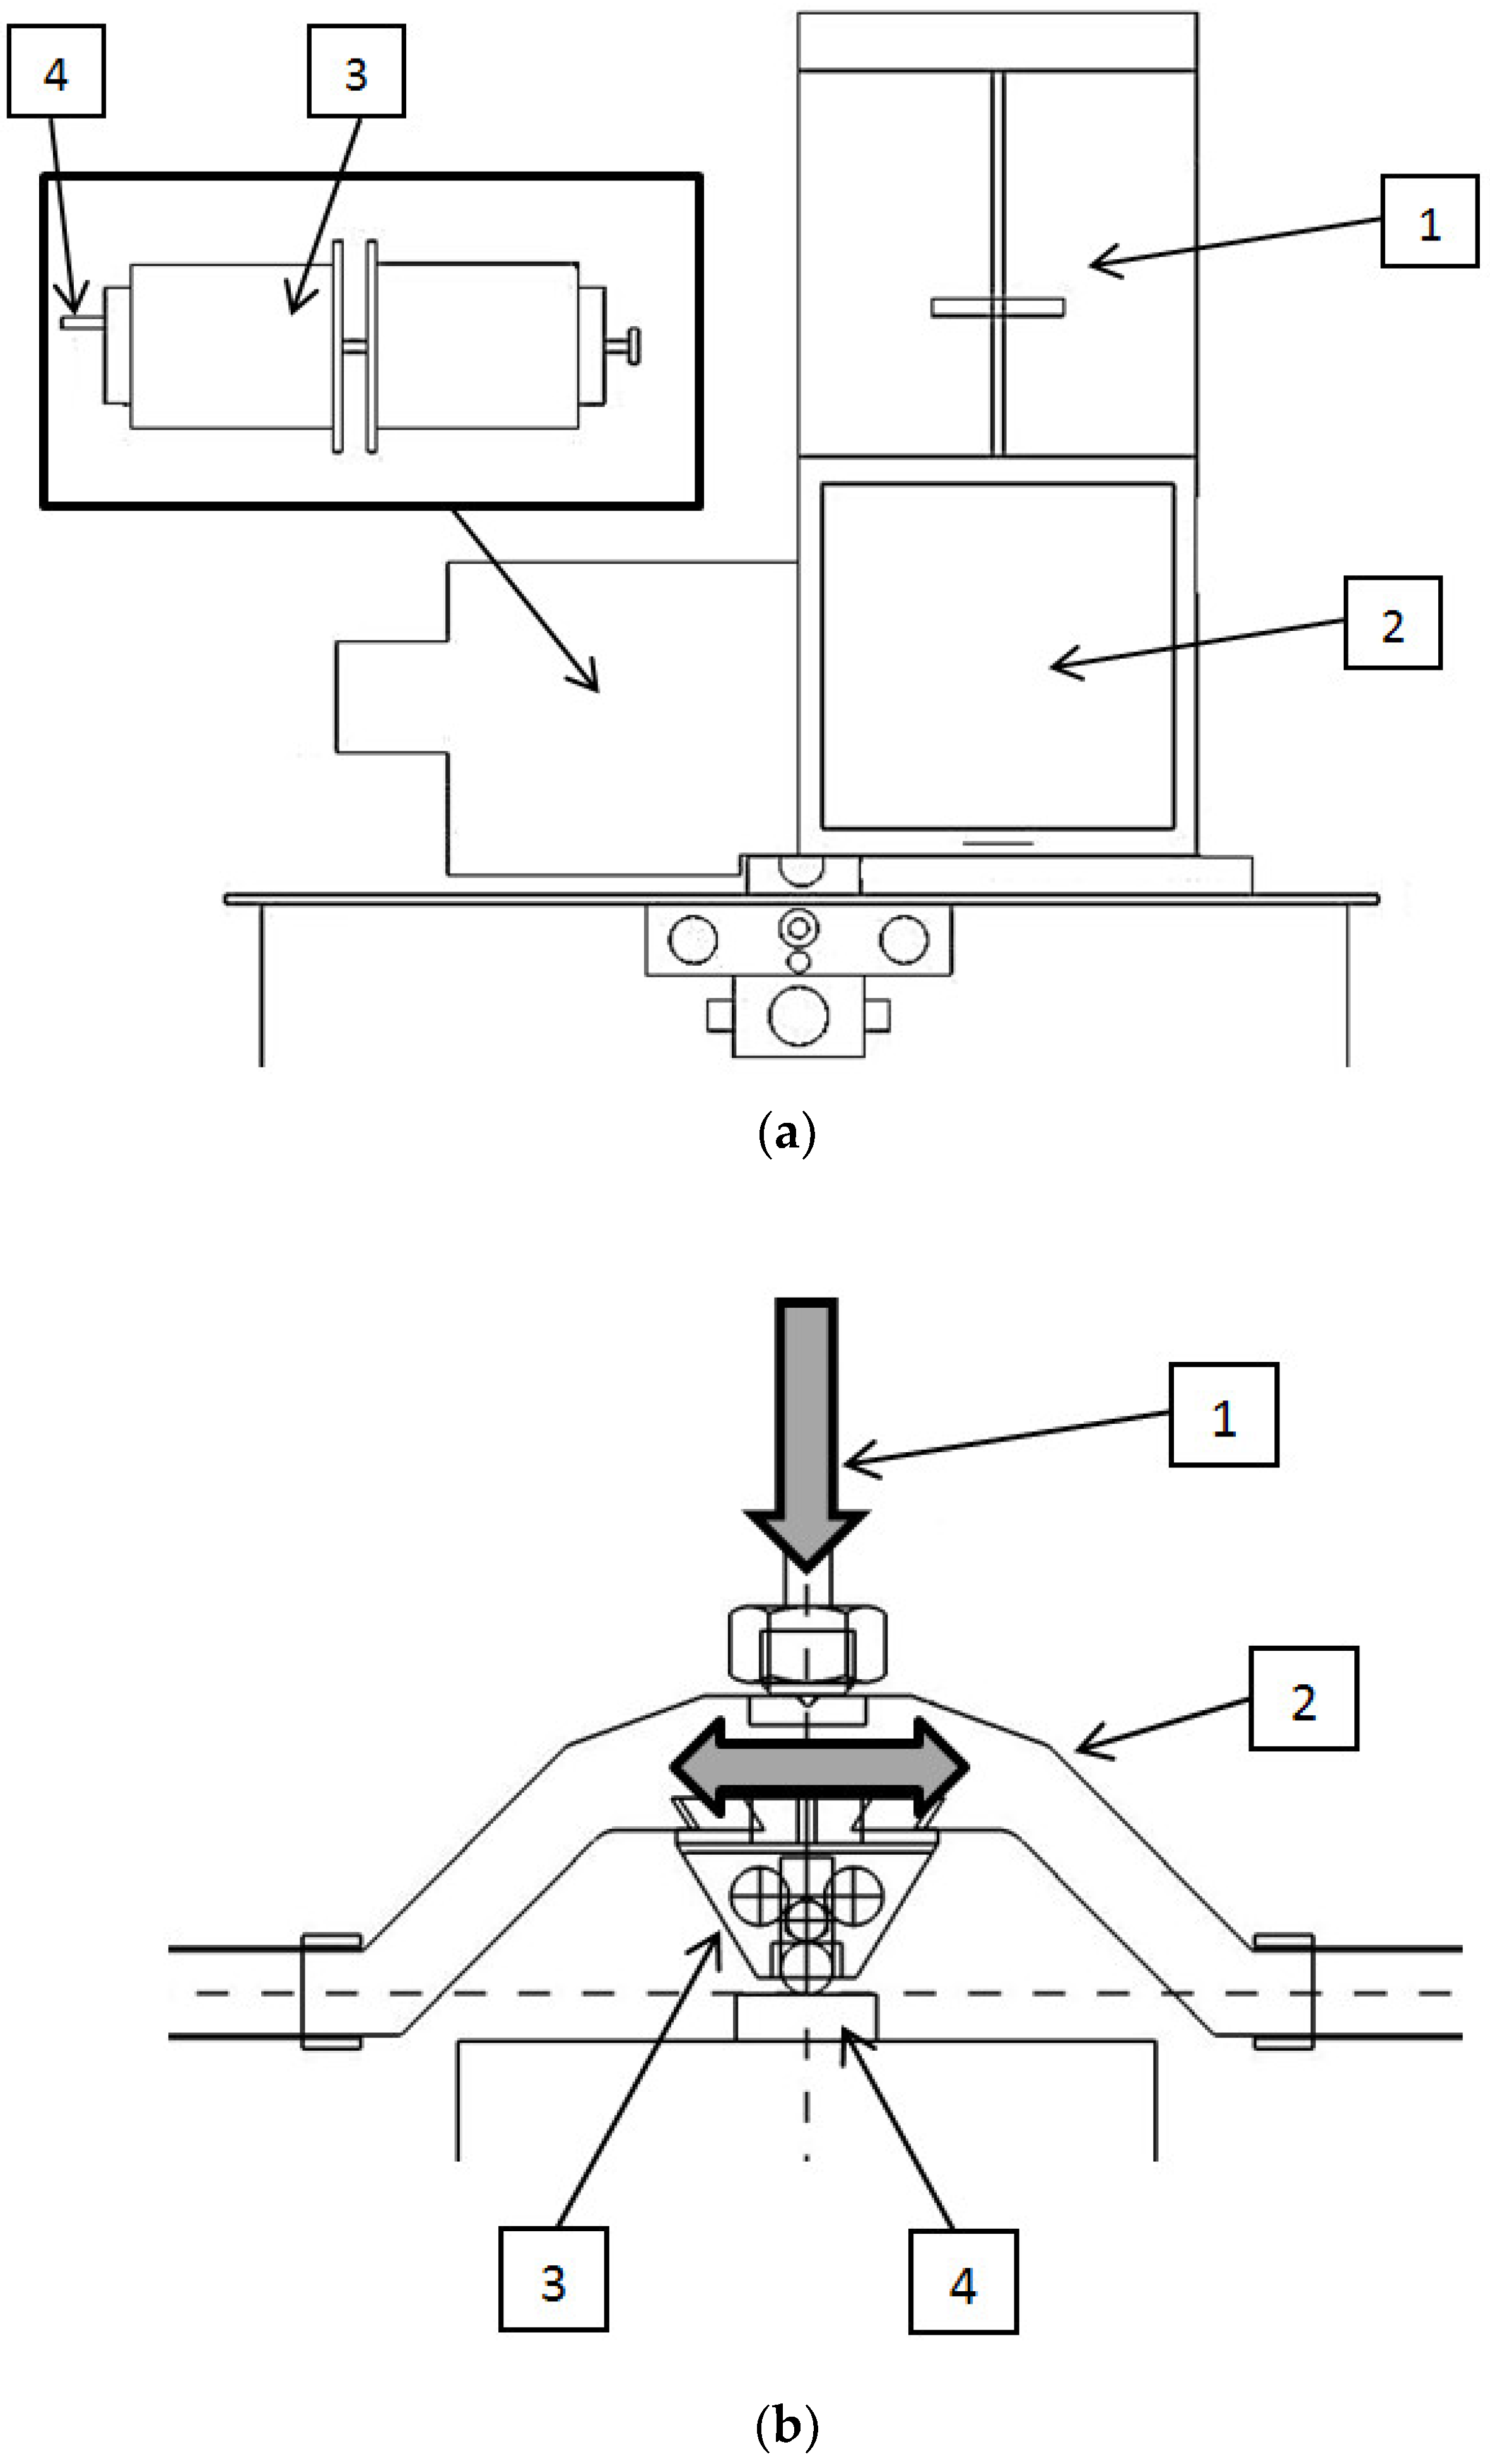
Experiments were carried out under dry-friction conditions using Optimol SRV5 tribotester (Optimol Instruments Prüftechnik GmbH, Munich, Germany) in a ball-on-flat configuration. This tester was previously used in other fretting tests [
26,
27]. The displacement of a ball was measured by an inductive displacement sensor which was mounted next to the oscillating module (
Figure 1). Oscillation was produced by both AC and DC coils and transmitted on ball mounting frame.
Experiments were carried out for two kinds of sliding pairs, steel–steel and steel–ceramics, in order to study the effect of disc surface texturing on dry gross fretting for adhesive and abrasive wear types. It was found from the previous investigations that for the steel–ceramic pair, abrasion was the dominant wear type, and for steel–steel contact, adhesive wear occurred [
26,
27]. Therefore, balls were made from WC ceramics and 100Cr6 steel of 60 HRC hardness. Textured and untextured discs from 42CrMo4 steel of 47 HRC hardness and from 100Cr6 steel of 60 HRC hardness were tested. Steel discs of different hardness were selected for this study because the difference in hardness of the counter-parts considerably affected their wear levels [
28]. The temperature was set to 30 °C, the relative humidity was between 20 and 30%, the amplitude of oscillations was set to 0.1 mm.
Table 1 presents the operating conditions of tests. The authors tried to study the effect of the dimples’ presence on friction and wear for smaller and larger amounts of wear particles (various frequencies, normal load and test durations). In order to obtain contact between a ball and dimples, the largest amplitude of oscillation was used, allowing the presence of fretting for smaller normal load; for technical reasons, the minimum distance between oil pockets was 0.5 mm. When the stroke is smaller than the Hertzian contact diameter, reciprocating sliding occurs [
29]. For the steel–ceramics contact with the normal load of 50 N, the maximum elastic contact pressure was 2248 MPa and the diameter of the elastic contact was 0.206 mm; this diameter was a little higher than the stroke of 0.2 mm. For higher normal load of 100 N, the maximum Hertzian contact pressure and the contact diameter increased to 2794 MPa and 0.261 mm, respectively. For the steel–steel contact and the normal load of 50 N, the maximum elastic contact pressure was 1713 MPa, the diameter of the elastic contact was 0.236 mm, while for the higher normal load of 100 N, the maximum Hertzian contact pressure and the elastic contact diameter increased to 2198 MPa and 0.297 mm, respectively.
Because the effect of surface texturing on the tribological properties under dry-friction regime depends on dimple dimensions [
12,
13,
14,
23], oil pockets of different sizes (depths and widths) were machined.
Texturing was performed using abrasive jet machining with the use of laser-cut masks made of two-layer engraving foil. Masks were cut with the use of a 45 W CO
2 laser. The abrasive used for texturing was aluminum oxide (Al
2O
3) with 99.9% purity with grain size between 75 and 106 µm. The nozzle diameter was 8 mm, the work pressure of compressed air was 0.6 MPa, and the distance between the nozzle and the processed surface was 100 mm. The exposition time was 15 s for dimples with depth of 2 µm and 20 s for dimples with higher depths. The average distance between dimple centers was 0.5 mm. This method was applied in the previous research [
1,
30,
31].
During the contact of elements from materials, 42CrMo4/100Cr6 and 42CrMo4/WC, a textured polished disc was used. The surface texture of this disc was characterised by the Sq parameter (the standard deviation of the roughness height) of 0.001 µm; this disc was denoted by PI. Textured discs called TPI1 and TPI2 (
Figure 2) were also tested. During the co-action of sliding pairs from materials 100Cr6/100Cr6 and 100Cr6/WC, untextured disc after polishing PII was characterised by surface height determined by the Sq parameter of 0.03 µm; textured discs TPII1 and TPII2 (
Figure 3) were also tested. The textured disc surfaces had the same square dimple array. Increases of sizes of dimples for the discs TPI2 and TPII2 compared to the discs TPI1 and TPII1 were caused by higher exposition time during abrasive jet machining. An increase in this time resulted from higher increase in dimple sizes for a disc of higher hardness, which was probably caused by its higher brittleness.
The number of test repetition for assemblies containing the same disc was at least three. Machined and worn surface topographies of balls and discs were measured with a Talysurf CCI Lite white light interferometer. Roughness of steel balls determined by the Ra parameter was 0.15 µm, while of ceramic balls, 0.4 µm.
Before computing wear of balls, their form was removed using a sphere. Wear level of discs was estimated after surface levelling. The total net volume
Vtotal of the tribological system was calculated as
Vtot = (
Vdisc−) − (
Vdisc+) + (
Vball−) − (
Vball+),
Vdisc = (
Vdisc−) − (
Vdisc+),
Vball = (
Vball−) − (
Vball+), where (
Vdisc+) and (
Vball+) were considered as transferred materials or buildup while (
Vdisc−) and (
Vball−) as lost material [
29,
32]. These volumes were computed using TalyMap software (Taylor Hobson, Leicester, UK); (
Vdisc+) or (
Vball+)—volume of peak, while (
Vdisc−) or (
Vball−)—volume of hole.
Figure 4 presents an example of Vtotal calculation.
3. Results and Discussion
In most cases, the scatter of the coefficient of friction was smaller than 0.02; the scatter of volumetric wear was typically smaller than 10%.
Table 2 lists the results of the tribological tests during which a disc from 42CrMo4 steel was in contact with a ball from 100Cr6 steel or WC ceramics (tests TI). When the test duration was 15 min (tests TAI, TBI, TDI, and TEI), the average value of the maximum coefficient of friction COF
av. was evaluated after eliminating initial fluctuations, between 50 and 900 s, however, the final coefficient of friction COF
final was assessed by averaging its values received between 600 and 900 s. For smaller test durations of 3 min and 45 s (tests TCI and TFI), the mean value of the maximum coefficient of friction COF
av. was evaluated between 50 and 225 s and the final value COF
final between 200 and 225 s.
Figure 5 shows example curves presenting the maximum coefficient of friction versus time for selected tests TI. In the tests TAI, TBI, and TCI, wear of ball was larger than wear of disc. Similar tendency was noticed in previous research [
27]. It was caused by wear debris embedding into softer disc surface preventing disc from wear.
In tests TAI, wear of textured disc was negative, while wear of untextured disc was positive. Introduction of dimples caused increases in wear of discs and of total wear of the tribological system. The changes of total volumetric wear were higher for larger dimple sizes; they amounted for sliding pairs containing discs TPI1 and TPI2 to 19 and 31%, respectively. The presence of dimples led to growth of the final values of the coefficient of friction, however, the changes were small: 0.02–0.03, on average. Independently of disc surfaces (textured or not), the frictional resistance was stable after about 400 s.
In the TBI tests, larger wear levels and lower coefficients of friction were obtained, compared to the TAI tests. These changes resulted from higher normal load in the TBI tests. Contrary to the TAI tests, similar wear values and coefficients of friction were obtained for sliding pairs with both textured and untextured disc samples. The coefficient of friction initially decreased and was stable after about 400 s.
In the TCI tests, due to a decrease of test duration, lower values of the coefficient of friction and wear levels were obtained compared to the TBI tests. Similar to the TBI tests, the effect of dimples present on disc surfaces on tribological properties of sliding assembly was negligible.
In the tests TDI and TEI, scatters of volumetric wear levels were comparatively low, smaller than 6%. Change from steel ball into ceramic one caused lower wear of the tribological system. When normal load and frequency were lower (tests TAI and TDI), the coefficient of friction decreased due to the change of ball material from steel to ceramics; the opposite results were obtained for higher normal load and frequency (tests TBI and TEI). The material losses of both disc and ball were noticed. Wear of disc was substantially higher than wear of balls. Similar results were obtained in the other tests [
26].
In the TDI tests, the presence of dimples of smaller sizes (disc TPI1) had negligible effect of friction and wear. However, introduction of cavities of larger dimensions (disc TPI2) led to a decrease in wear of disc and total wear of 11%, and to a decrease in the mean coefficient of friction of 10% (the final coefficient of friction also decreased). After initial fluctuation, the frictional resistance became stable after 300 s with further small increase.
Disc surface texturing caused also a decrease of wear of disc and tribological system in the TEI tests of about 12% for sliding pairs with both kinds of textured discs. The presence of dimples led also to a decrease in the mean coefficient of friction. These changes were smaller for the sliding pair with disc TPI1 (5%) compared to the assembly with disc TPI2 (10%). The friction force after abrupt initial fluctuations slowly increased as the test progressed. The highest difference between the coefficient of friction for sliding pairs with smooth and textured samples was found in the initial 250 s of tests.
In the TFI tests, because of smaller test duration compared to the TEI tests, disc surface texturing caused not only a decrease in the average coefficient of friction (7% on average) but also a reduction of the final friction coefficient (9% on average). The coefficient of friction increased when the test progressed, and the profitable effect of dimples’ presence was visible after 100 s. Disc surface texturing led to a substantial decrease of volumetric wear (up to 21%) of the tribological system. Both kinds of disc surface texturing led to decreases of friction and wear.
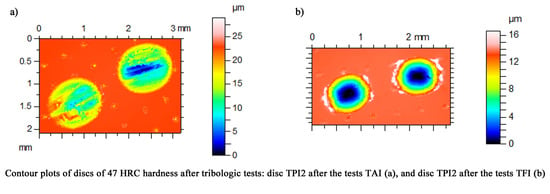
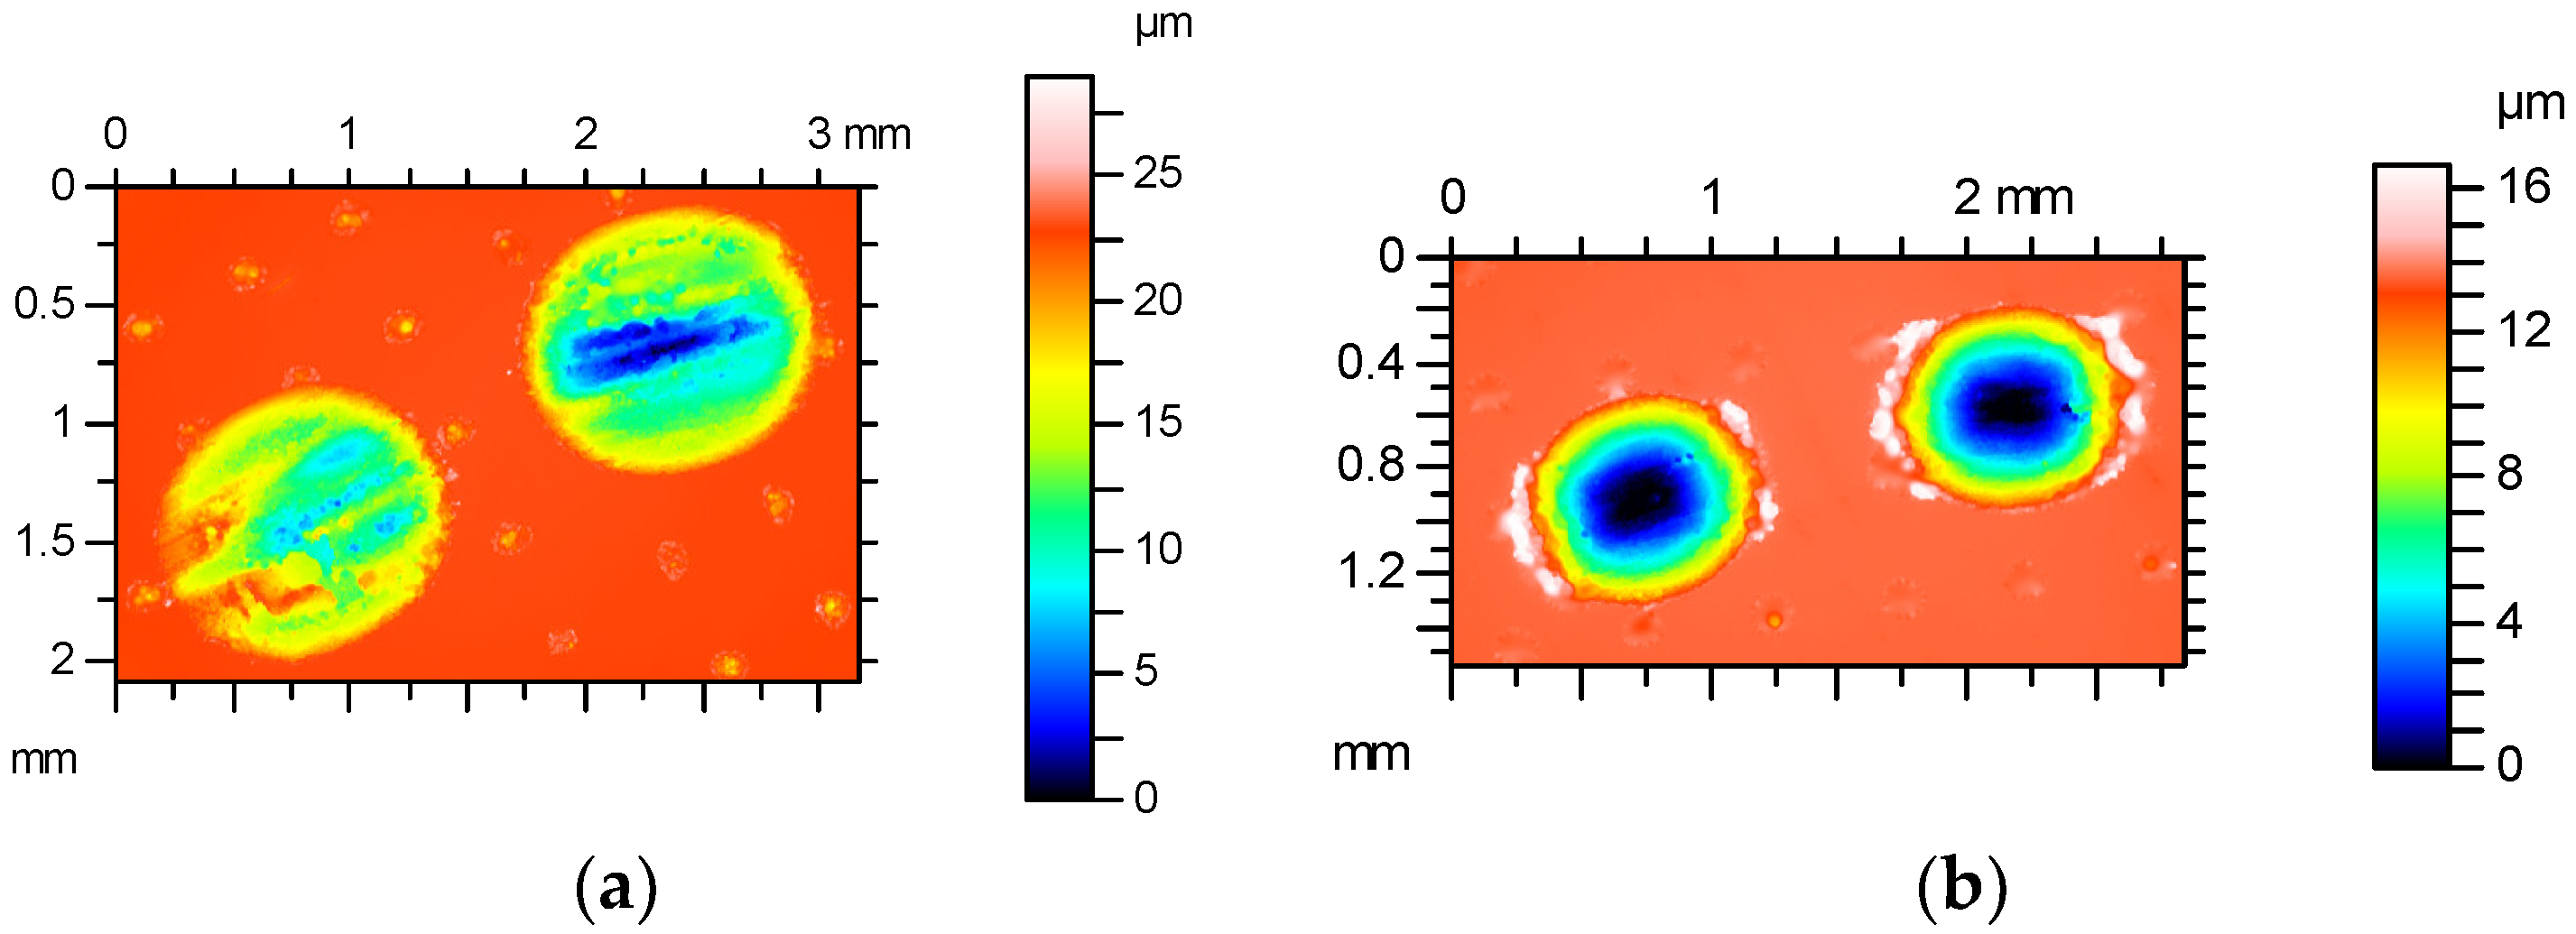
Figure 6 presents contour plots of textured disc TPI2 surfaces after tribological tests. The adhesive junctions are visible for contact of disc with steel ball (
Figure 6a). In this case, the roughness height of the bottom of the wear scar, determined by the Ra parameter, was between 0.65 and 0.85 µm. However, wear of discs co-acted with ceramic ball had abrasive character (
Figure 6b) with tendency to plastic deformation. Without adhesive junctions, the roughness height Ra in the bottom of the wear scar was smaller, between 0.2 and 0.4 µm.
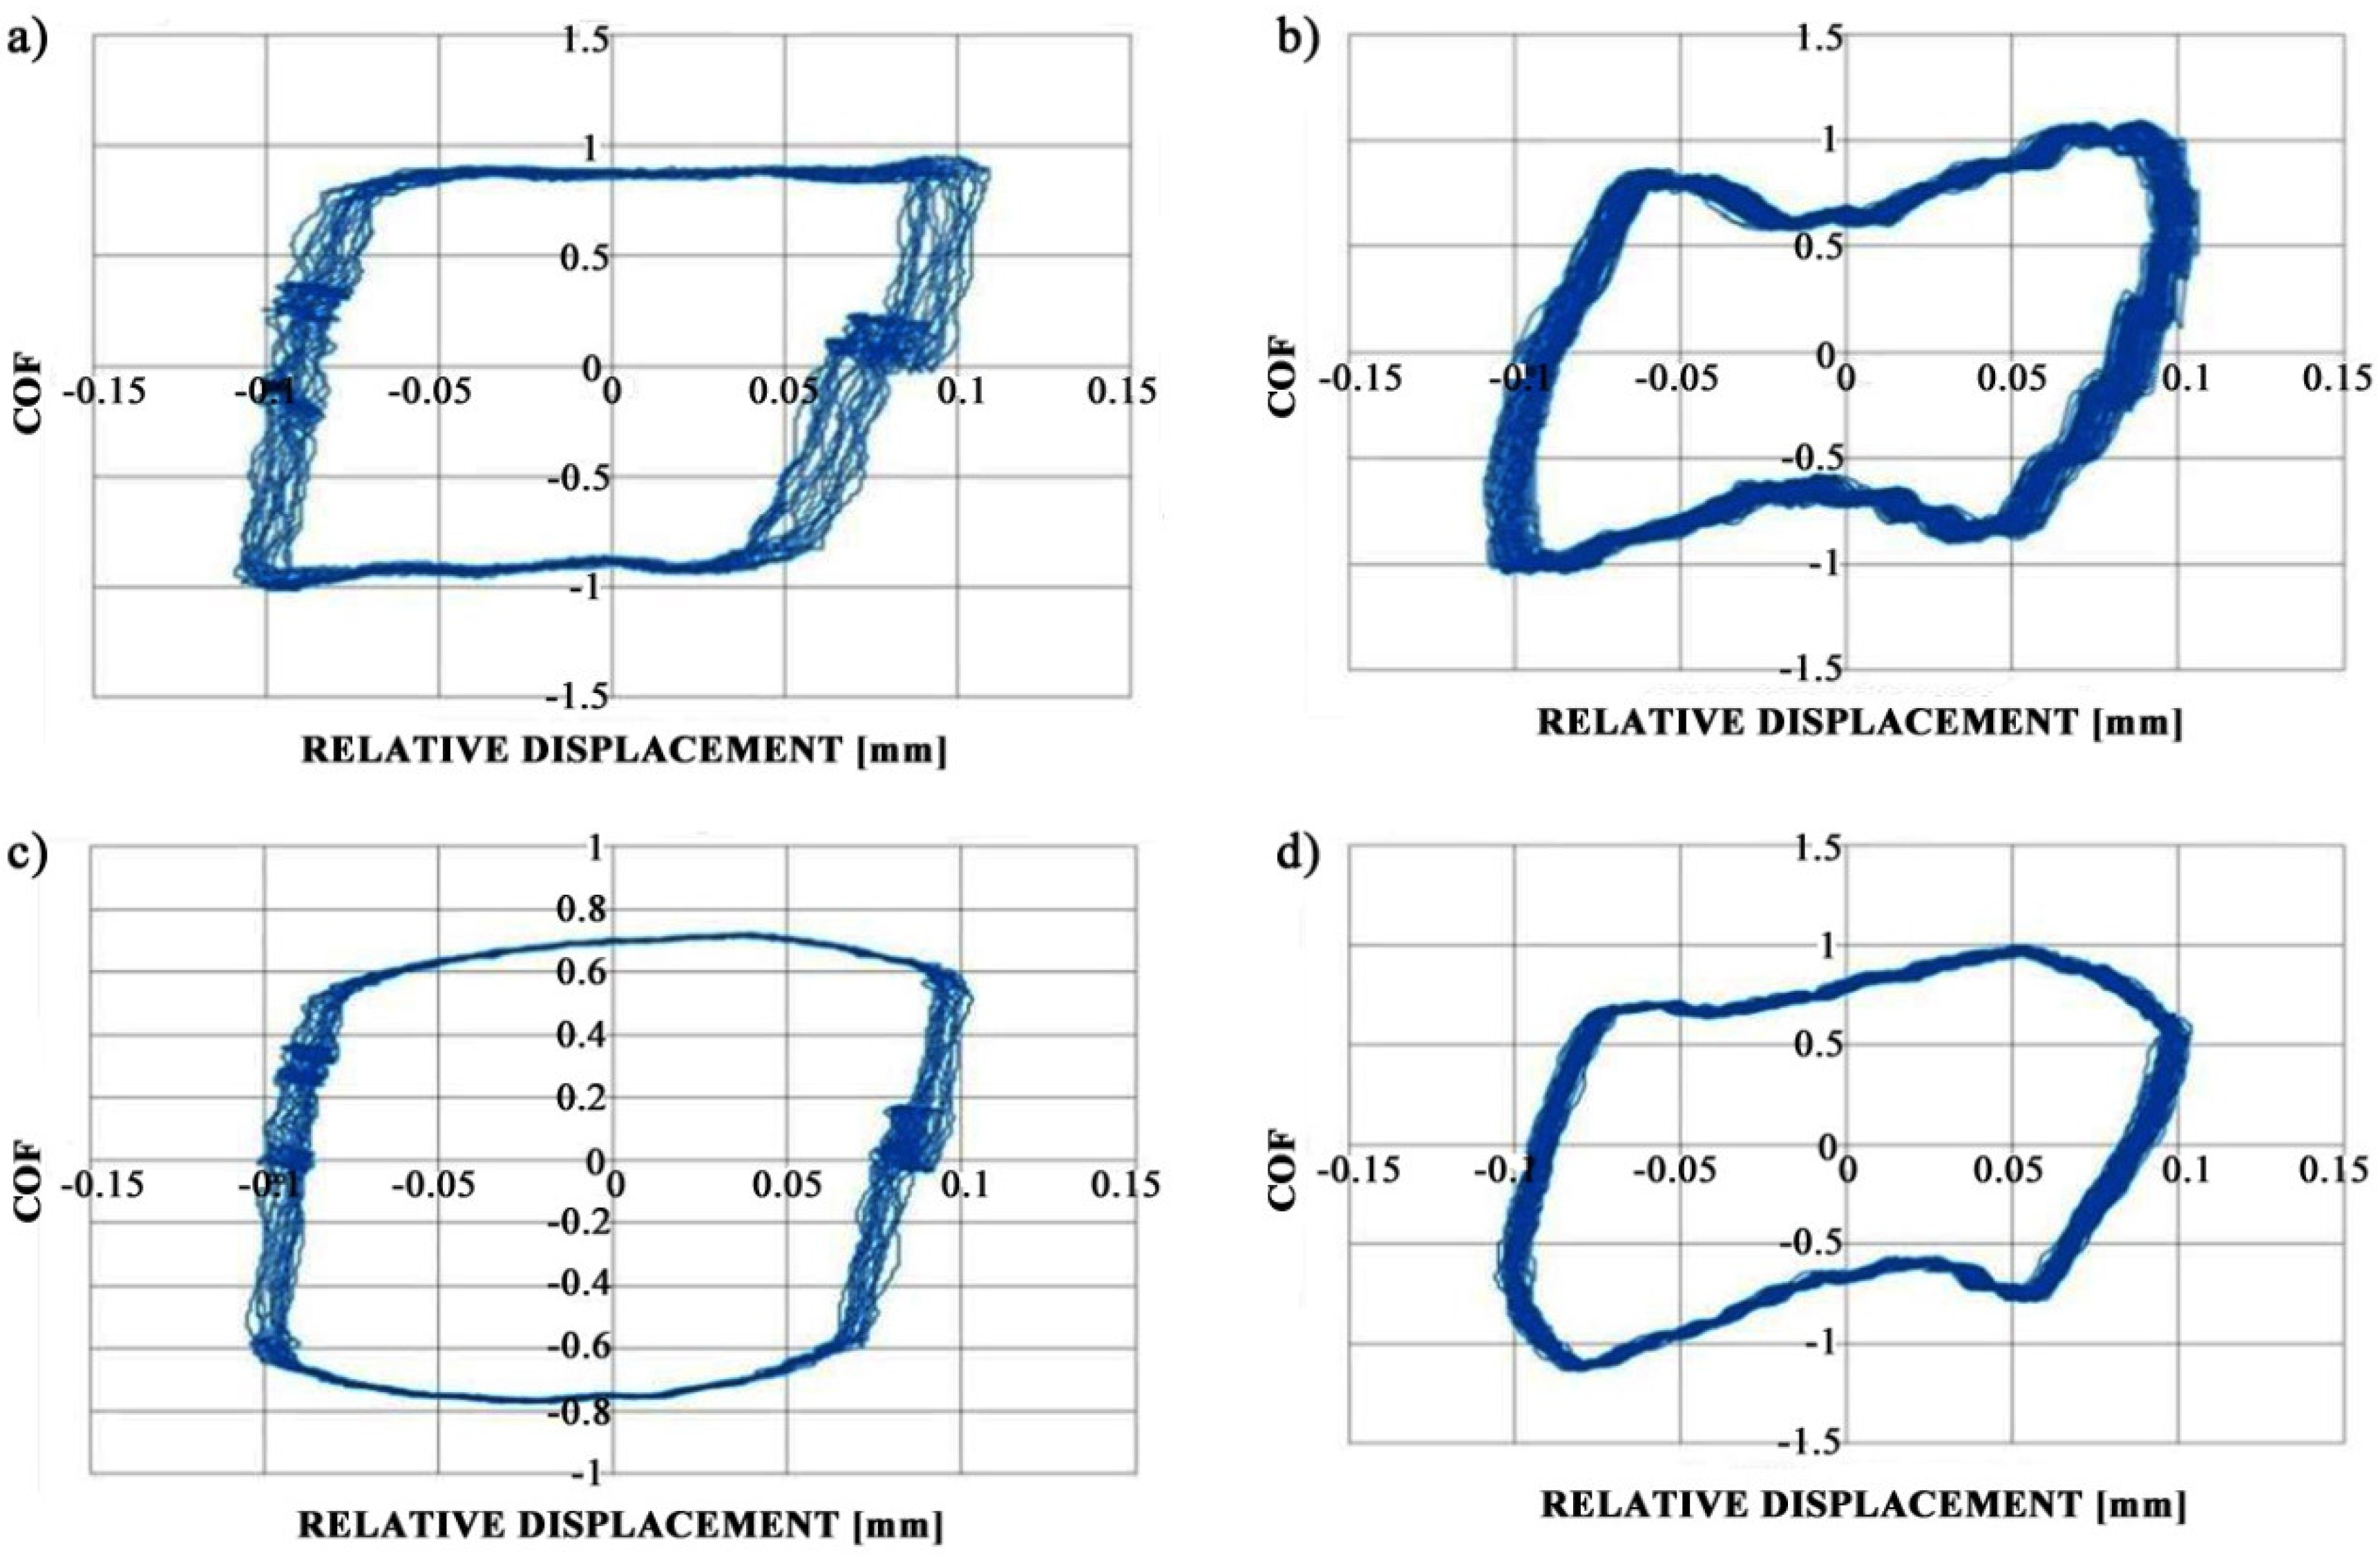
Figure 7 shows fretting loops for selected assemblies containing the textured discs TPI2. Shapes of fretting loop and values of the slip index δ proved that dry gross fretting occurred. The slip index represents various sliding regimes and the transition from fretting to reciprocal sliding. It is calculated from the friction loop presenting the dependence between relative displacement and the friction force. It is a product of the imposed displacement amplitude and the slope of the friction loop divided by the normal force. For partial slip, the slip index δ calculated on the basis of fretting loops should be between 0.5 and 0.6, however, for gross slip, between 0.6 and 10 [
33,
34]. The values of obtained slip index in the TI tests were between 3 and 9.5. An increase in the normal load caused a decrease in the slip index. For lower normal load (
Figure 7 a,c) the values of the slip index were higher compared to those obtained for bigger normal load (
Figure 7 b,d).
Table 3 presents the results of the tribological tests TII when disc from steel 100Cr6 co-acted with ball from 100Cr6 steel or WC ceramics. The value of wear of disc TPII was corrected (reduced) taking volumes of dimples into consideration. This correction resulted from comparatively large dimensions of oil pockets.
Figure 8 shows examples of curves presenting maximum coefficient of friction versus time for selected tests TII.
When steel disc slid against steel ball, an increase in disc hardness in tests TII compared to tests TI caused smaller total wear of the tribologic system and higher wear of the disc than of the ball. Lemm at al. [
28] obtained similar results. An increase in disc hardness did not affect frictional resistance in tests TA, while it led to higher friction force in tests TB. The coefficient of friction after an initial abrupt increase (before about 50 s) and obtaining value of 0.8 further increased, slower in tests TAII compared to tests TBII. The introduction of disc surface texturing had negligible effect on friction and wear in tests TAII, TBII, and TCII.
For steel/ceramics contact, an increase in hardness of disc in tests TII in comparison to tests TI caused a reduction of wear. Wear of the disc was larger than wear of the ball. The coefficient of friction slowly decreased as the test progressed after about 100 s, and the rate of increase was higher in tests TEII, compared to TDII. Disc surface texturing did not substantially affect friction and wear of the tribological system in the tests TDII and TEII. Only in the tests TEII, lower coefficient of friction was noticed in initial parts of tests for sliding pairs with textured discs (especially TPII2), however, the mean and final values of the coefficient of friction for all tested assemblies in the tests TEII were similar to each other. The observed tendency was confirmed during tests TFII. Introduction of dimples on the disc surface substantially affected both wear and the coefficient of friction; wear of the tribologic system was reduced by 18%, on average, however, the final coefficient of friction decreased by about 6%, on average. Changes of mean coefficient of friction were higher for sliding assembly with disc TPII2 of larger sizes of dimples (7%).
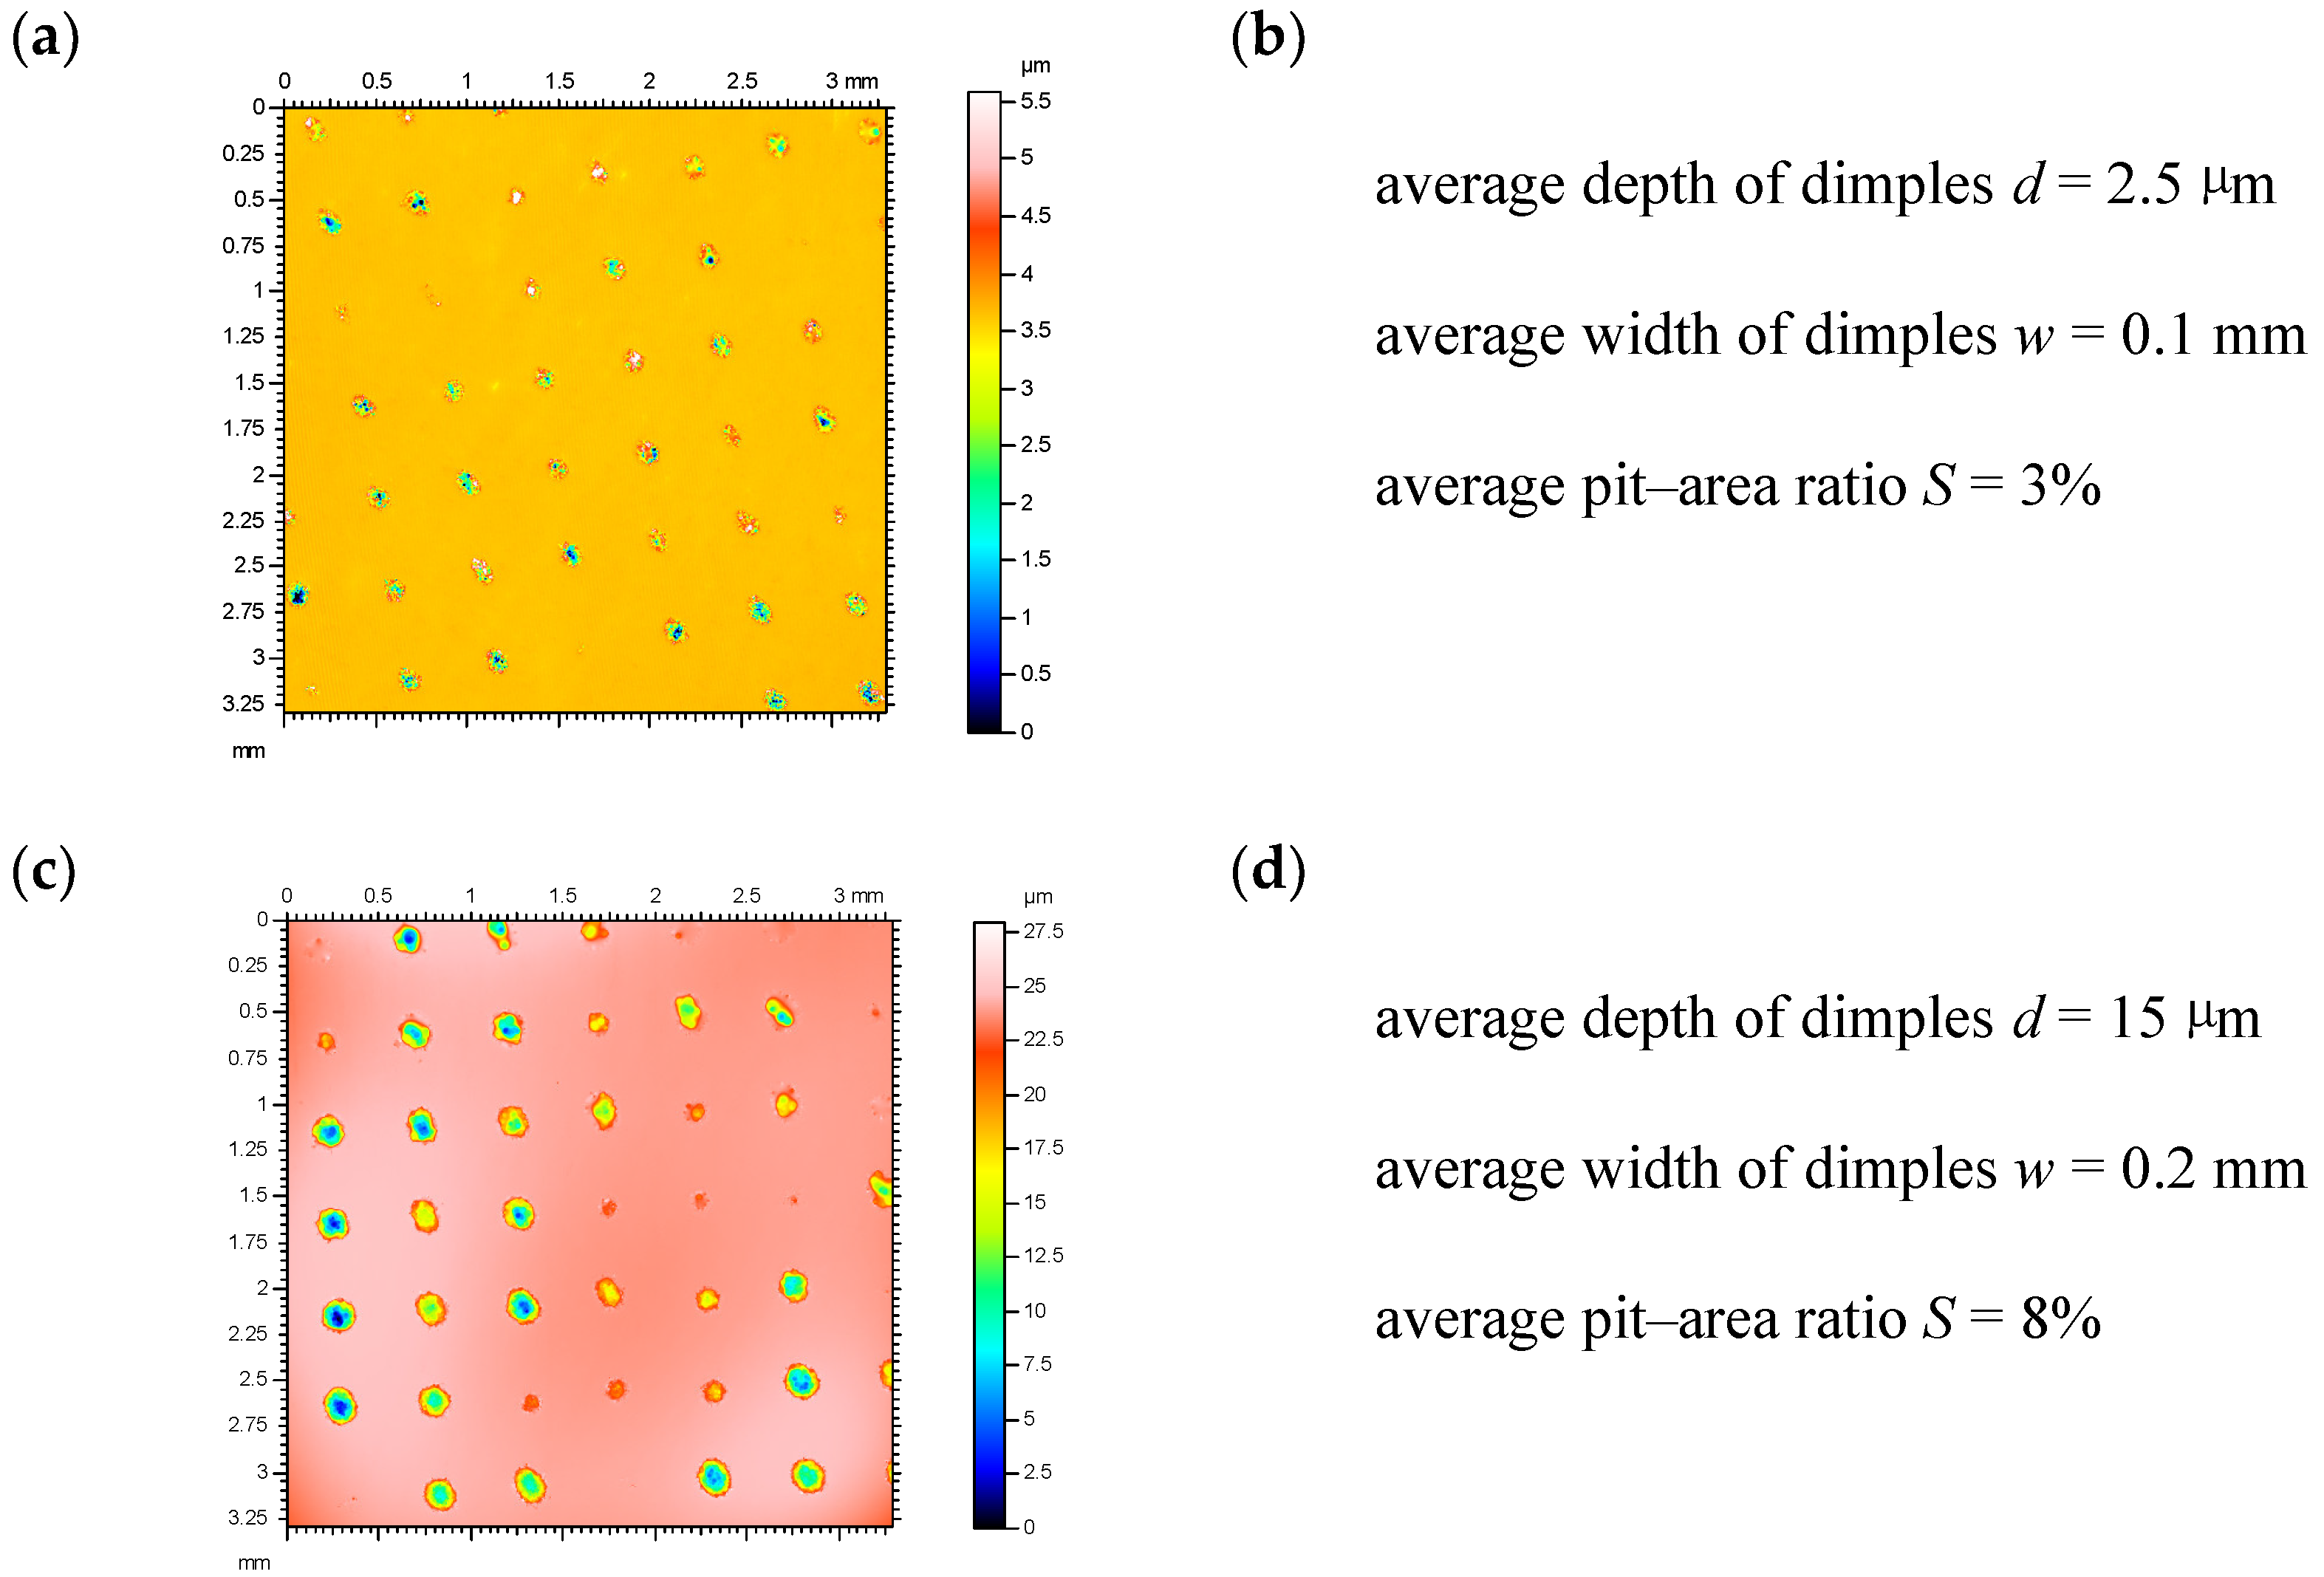
Figure 9 presents contour plots of textured disc TPII2 surfaces after tribological tests TAII and TDII. Due to change of ball material from steel to ceramics, disc wear became lower in the tests TDII (
Figure 9b) compared to the test TAII (
Figure 9a). The presence of adhesive junctions caused an increase in the roughness height, determined by the Ra parameter from values smaller than 0.3 to higher than 0.6 µm.
Figure 10 shows fretting loops for selected sliding pairs containing the textured discs TPII2. The values of the slip index were between 4 and 7, which proved gross slip occurrence. Similar to tests TI, for higher normal load (
Figure 10b,d), the values of the slip index were smaller compared to those received for lower normal load (
Figure 10a,c).
During contact between steel elements, disc surface texturing caused an increase of disc wear, total wear of the tribologic system, and a small increase of the frictional resistance for lower disc hardness and lower normal load and frequency of oscillations (tests TAI). An increase in wear was higher for larger dimples. In the other analysed cases of steel surfaces contact, the presence of cavities had negligible effect on the tribological performance of the analysed system. These results well correspond with those obtained by Varenberg et al. [
23], who found that during tests of elements of the same materials with inclination to adhesive junctions, the wear debris layer gave profitable effect and its removal led to an increase of wear and friction. The adhesive junctions were visible on disc surfaces after the test TAI (
Figure 6a). When steel discs of higher hardness was put in contact with steel balls, the introduction of cavities did not affect tribological properties of the steel–steel system. This behavior is probably related to the smaller ability to adhesive junctions of harder surfaces.
However, the effect of disc surface texturing on friction and wear of steel–ceramics friction pair were different to that of the steel–steel assembly. When steel discs of lower hardness were tested, the presence of dimples led to a decrease in friction and wear in all kinds of tests (TDI, TEI, and TFI). For larger normal load, speed, and number of cycles (tests TEI), the profitable effect of disc surface texturing was visible in initial parts of tests. However, when hardness of steel discs was higher, disc surface texturing caused a reduction of wear and friction only for higher normal load, higher speed, and lower test duration (tests TFII). When sliding time increased, the profitable effect of surface texturing disappeared (tests TEII). These results are also in accordance with those presented by Varengerg et al. [
23], who found that for contact of elements from different materials, with small inclination to adhesive junction, removal of wear debris caused a decrease of friction and wear. It should be noticed that abrasion was the dominant type of wear of the steel–ceramics tribological system.
Dimples of larger sizes affected more tribological properties of sliding elements. The tendency was found that for a smaller amount of wear particles, the effect of disc surface texturing was higher. This effect was lower when the ratio of volume of wear debris to oil pockets volume was higher.
Surface texturing had a profitable effect on friction and wear of the steel–ceramics assembly without tendency to adhesive junctions. Based on this and other research [
23], it can be found that dimples’ presence could reduce friction of wear when abrasion dominated due to the entrapment of wear particles within the oil pockets. This effect was larger when dimple dimensions were bigger. Perhaps the dimple diameter played a bigger role than its depth [
23]. However, it is difficult to determine the proper dimple dimensions for different applications based on this research, thus additional experiments are needed.


