Models for Prediction of Surface Roughness in a Face Milling Process Using Triangular Inserts

Automotive Tribology Center, Department of Mechanical Engineering, School of Engineering and Computer Science, Oakland University, Rochester, MI 48309, USA
*
Author to whom correspondence should be addressed.
Lubricants 2019, 7(1), 9; https://doi.org/10.3390/lubricants7010009
Submission received: 30 November 2018
/
Revised: 8 January 2019
/
Accepted: 14 January 2019
/
Published: 16 January 2019
(This article belongs to the Special Issue Industrial Tribo-Systems and Future Development Trends)
Abstract
:Research was carried out to develop a mathematical model based on the cutting tool surface profile geometry to predict surface roughness in face milling. Previous models were derived using either the simple assumption of a perfectly round tool nose or statistical analysis based on a large number of experiments. In this research, three milling cases were defined based on the magnitude of the feed rate using a triangular insert with a round corner. In case 1, the machine marks only consisted of a series of arcs. In case 2, the machine marks included a series of an arc and one straight line. In case 3, the machine marks consisted of a series of an arc and two straight lines. Three different equations for surface roughness prediction were obtained based on each of the three cases. Experiments were done to validate the models, and the results showed that the mathematical models had good correlation with experimental results.
1. Introduction
In manufacturing industries, milling processes have been widely utilized to remove material from workpieces, producing various sizes, shapes, and features. Face milling is one of the most common milling processes, due to its high efficiency and excellent productivity. In face milling, the cutter is mounted on a spindle, which rotates perpendicular to the machined surface of the workpiece, and material is removed along the path parallel to the machined surface. In the milling process, surface roughness is considered to be one of the most important quality aspects to determine if machine parts will function properly and can be assembled smoothly [1,2]. In the measurement of surface roughness, arithmetic average roughness, Ra, is the most common parameter to describe the topography of a machined surface on a workpiece. Ra is defined as the arithmetic mean of the deviation of the surface profile from the mean line. Poor workpiece surface quality may cause high wear and friction which can significantly reduce the performance and service duration of sliding components [3,4,5,6,7]. Wong et al. [8] and Tung [9] both suggested the fuel consumption and performance of automotive engines were mostly controlled by the wear, friction, and lubrication issues between the components in the subsystems which were strongly associated with the machined surfaces. Siripuram et al. [10] thoroughly studied the effects of asperity geometry on the contact surfaces including the circular square, diamond, hexagonal, and triangular sections. They concluded that thecoefficient of friction between the sliding surfaces was insensitive to the asperity geometry, but quite sensitive to the cross-sectional size. Jocsak et al. [11] developed a rough surface flow simulation program to model the effects of three-dimensional cylinder liner surface anisotropy on piston ring-pack performance. They found the ring-pack friction could be reduced by decreasing the liner honing cross-hatch angle, which could be achieved using low feed-to-speed ratio in the honing process. Jocsak et al. [12] also focused on the effects of non-Gaussian surface roughness on piston ring-pack friction in reciprocating natural gas engines.
Most of the models used to predict the surface roughness of a machined surface in milling processes are regression analysis models and neural network models based on empirical formulas derived from a large number of experiments. Kalidass et al. [13] developed a mathematical model for surface roughness prediction in terms of several cutting parameters, such as rotational speed, feed rate, and depth of cut using a response surface methodology. Tseng et al. [14] developed an equation to predict surface profile of machined parts in Computerized Numerical Control (CNC) milling by determining the significant factors from experiments and fuzzy set theory.
Franco et al. [15] derived a numerical model to predict the surface roughness by studying round insert cutting tools and the influence of tool errors, such as radial and axial runouts. Gu et al. [16] proposed a mathematical model of surface roughness in face milling based on a surface profile produced by a perfectly round insert. Their research was applicable to face milling using a feed rate below a critical value. Felho et al. [17] developed software to predict the theoretical surface roughness produced by milling inserts of different geometries in arbitrary directions and for any surface size. However, no specific details were given for the theoretical development correlating with the various tool geometries. Munoz-Escalona et al. [18] produced a surface model based on geometrical analysis of the tool on the machined surface.
Most of the previous models were derived by either assuming perfectly round machine marks for all feed rates, or using statistical analysis based on a large number of experiments. In this research, a model based on the surface profile of the workpiece produced by face milling was developed to predict the mean roughness for three different cases based on the magnitude of feed rate. The approach for modeling is the same as one the used by Gu et al. [16]. However, additional analysis has been carried out in the present research to allow for prediction of mean roughness at feed rates above those considered in the previous research. In addition, surface roughness values of workpieces in face milling produced using various feed rates were measured using a 3D surface profilometer to determine the correlation between the mathematical model and experimental results.
2. Experiment Procedure
2.1. Aluminum Alloy
The workpiece used in this research was composed of 6061 aluminum alloy. The chemical composition is shown in Table 1. Compared with hard ferrous materials, aluminum alloy is one of the most commonly used soft materials in industry, which typically has well-defined machine marks on the workpiece surface after face milling. The hardness of the aluminum alloy was 45 HRB, and the dimensions were 30 mm (L) × 15 mm (W) × 15 mm (H).
2.2. Face Milling Machine and Insert
The face milling process was carried out using the Bridgeport milling machine shown in Figure 1a. The depth of cut, feed rate, and spindle speed could be set directly through the built-in control interface. Only one insert was utilized, to simplify the analysis of the machine marks. The geometry of the insert is shown in Figure 1b. The specification of this insert was Grade K313 with a nose radius of 0.397 mm (1/64 in). One side of the triangular insert when installed was perpendicular to the surface of workpiece, see Figure 1c.
2.3. Three Milling Cases Defined by Feed Rate
In this research, three mathematical models were developed based on different feed rate ranges. For the small feed rate (case 1), only the round portion of the insert was engaged in the cutting process, see Figure 2a. The machine marks consist of a series of arcs, see Figure 2b. For the medium feed rate (case 2), the round portion with one of the straight portions of the insert were involved in the cutting process, see Figure 3a. The machine marks consist of a series of arcs with one straight line, see Figure 3b. For the large feed rate (case 3), the round portion with both straight portions of the insert were used in the cutting process, see Figure 4a. The machine marks consist of a series of arcs with two straight lines, see Figure 4b.
The critical feed rate to specify the different cases is related to the nose radius of the insert used in the face milling process. For the critical threshold between case 1 and case 2, the feed rate is equal to the nose radius of the insert. When the feed rate was smaller than R, case 1 applied, see Figure 2b. For the critical threshold between case 2 and case 3, the feed rate was equal to 3R. When the feed rate was in the range between R and 3R, case 2 applied, see Figure 3b. When the feed rate was greater than 3R, case 3 applied, see Figure 4b.
In the experiments, various feed rates were applied to the aluminum specimens for case 1 and case 2. A depth of cut of 0.15 mm was used to ensure full machine marks on the workpiece for all cutting conditions. The parameters used in the milling process are summarized in Table 2. Also, the insert may fracture if the feed rate was too high, as per example case 3. Large feed rates such as these are not commonly used in industry. Therefore, no experiments with large feed rates were conducted in this research.
2.4. Surface Profile Measurement
The profile of the machine marks on the milled surface was measured using a 3D surface profilometer. In this research, it is assumed that the workpiece roughness consists of the machine marks which are considered to “match” the surface profile of the cutting tool insert. Waviness, which typically results from machine tool vibration, is also included in the surface profile and is removed by filtering. A Gaussian cut-off filter was used to separate the roughness and waviness in the surface topography. The cut-off values for the Gaussian filter were determined by the specific feed rate. Any wavelength larger than the feed rate was considered as waviness. Therefore, a cut-off value equal to the feed rate was used for surface roughness measurement under each milling condition. A typical surface profile before and after removing the waviness is shown in Figure 5. The roughness measurement was repeated five times at locations along the symmetric line of the workpiece, see Figure 6. Average roughness was reported in this research. Other factors, such as cutting tool wear and built-up edge on the cutting tool, could also affect the surface roughness. It was observed that the cutting conditions used in the experiments did not produce any significant insert wear. Also, no built-up edge was found on the cutting tool after each milling operation. The flowchart in Figure 7 shows the steps to extract the surface roughness from the raw surface profile.
3. Results and Discussion
3.1. Mathematical Roughness Prediction Model
3.1.1. Milling Case 1 (Small Feed Rate, f < R)
A sketch of a single machine mark is shown in Figure 8. When using the small feed rate, the machine mark only consisted of an arc (DE). Points B and C were the tangential points between the arc portion and straight portion of insert. The dashed line was defined as the mean line which made the area A1 plus A2 equal to the area A3. Mean roughness could be then defined by the following equations using geometric relationships. f is the feed rate, R is the radii of the round portion of the insert, θ is the angle between the lowest point and the point intersecting the mean line and round profile. γ is the angle between the lowest point and the intersecting point between two continuous machine marks. Points H and I are the intersecting points of the mean line and the machine mark to achieve equal area above and below the mean line.
Based on the areas
Substituting Equations (5)–(7) into Equation (4) and solving
Finally,
Note: Case 1 analysis above is identical to that reported in previous research [16], shown in Equations (32) and (33).
3.1.2. Milling Case 2 (Medium Feed Rate, R < f < 3R)
A sketch of a single machine mark is shown in Figure 9. When using the medium feed rate, the machine mark consisted of one arc portion (BM) and one straight line portion (EB). Mean roughness could be defined using the following equations based on geometric relationships. θ is the angle between the lowest point and the point intersecting the mean line and round profile. γ is the angle between the lowest point and the intersection point between two continuous machine marks.
For this situation, γ is determined first as follows:
Substituting Equations (12)–(15) into Equation (11) and solving
Based on the areas
Substituting Equations (18) and (19) into Equation (17) and solving
Finally,
3.1.3. Milling Case 3 (Large Feed Rate, f > 3R)
A sketch of a single machine mark is shown in Figure 10. When using the large feed rate, the machine mark consisted of one arc portion (BC) and two straight line portions (DB, EC). Mean roughness could be determined using the following equations based on geometric relationships. θ is the angle between the lowest point and the point intersecting the mean line and round profile.
For this situation, the length of FA should be expressed first. The area DFAB can be calculated as follows. For simplification, let area DFAB = S.
Then, FA can be expressed as
Based on the areas
Substituting Equations (27) and (28) into Equation (26) and solving
Finally,
3.2. Experimental Surface Roughness in Milling Process
The experimental results for surface roughness in the face milling process are shown in Table 3. One triangular insert was used for all eight workpieces. The surface of the workpiece and insert were carefully examined by using optical microscopy to make sure there were no defects before each test, and there was no significant tool wear or built-up edge on the tool after tests. For the first four tests, the feed rates were smaller than the nose radius, R, for case 1, and the feed rates were greater than R but smaller than 3R in the remaining four tests for case 2. Case 3 with larger feed rate was not included in experiments due to the high possibility of insert fracture.
3.3. Comparison of Mathematical Model and Experimental Surface Roughness
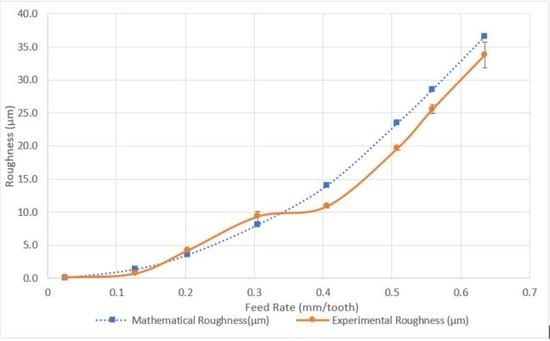
The different feed rates were input to the appropriate mathematical models developed in the present research, and outputs were compared with experimental surface roughness, see Table 4 and Figure 11. In Figure 11, it can be seen that the mathematical and experimental roughness is increasing with increasing feed rate. The mathematical results showed reasonable correlation with experimental data when feed rates were larger than 0.2 mm/tooth. Large percentage discrepancies were found while using small feed rates, such as 0.0254 mm/tooth and 0.127 mm/tooth.
Gu et al. [16] derived a model to predict the mean roughness under an assumption of perfect round insert, see Equations (32) and (33).
In Table 5, it can be seen that current and previous mathematical models predict the same surface prediction when the surface profile consisted of only a series of arcs using small feed rates. However, there are differences between the predicted values for larger feed rates. The previous mathematical model had a limitation in which feed rate should be smaller than 2R. In Figure 12, both mathematical models are used to predict the surface mean roughness. It can be seen that models developed in the current research are more accurate in roughness prediction for larger feed rates.
Equation (34) [19] is a common theoretical formula used to calculate the mean surface roughness related with feed rate and nose radius, where is the nose radius. It can be seen in Table 6 there is a deviation in percentage difference obtained using Equation (34) and the equations in the present research, especially when using the feed rate larger than the nose radius. Equation (34) should not be used for high feed rates, but this limitation is not given in [19].
4. Summary and Conclusions
In this research, mathematical models for mean roughness in a face milling process were developed for three cases depending on the magnitude of the feed rate. Milling experiments were performed to verify the accuracy of these mathematical models. Major findings from this research are:
1. Three different types of machine marks could be obtained when using a triangular insert in the face milling process. When the feed rate was smaller than the nose radius, R, of the insert, the machine mark consisted of only one arc portion. When the feed rate was greater than R and smaller than 3R, the machine mark included one arc portion and one straight line portion. When the feed rate was greater than 3R, the machine mark had one arc portion and two straight lines.
2. Three different mathematical models were developed to predict mean roughness based on the feed rate. The mathematical models presented in this research showed good consistency with the experimental data when using feed rates larger than 0.2 mm/tooth. The developed equations are as follows.
Small feed rate (f < R):
Medium feed rate (R < f < 3R):
Large feed rate (f > 3R):
3. Previous models which assume round cutting tools should not be used when the feed rate is large (f > R), but references do not always mention this limitation. As expected, the predicted results for larger feed rates correlated better with experimental results than predictions done simply assuming a round cutting tool for all feed rates.
Author Contributions
Conceptualization, R.W., B.W., G.C.B. and J.G.; Methodology, R.W., B.W., G.C.B., J.G. and J.S.; Software, R.W., B.W. and G.C.B.; Validation, R.W., B.W. and J.G.; Formal Analysis, R.W. and B.W.; Investigation, R.W., B.W., G.C.B., J.G. and J.S.; Resources, G.C.B., J.G. and J.S.; Data Curation, R.W., G.C.B. and J.G.; Writing—Original Draft Preparation, R.W. and B.W.; Writing—Review & Editing, B.W., G.C.B., J.G. and J.S.; Visualization, G.C.B., J.G. and J.S.; Supervision, G.C.B. and J.G.; Project Administration, R.W., B.W., G.C.B. and J.G.; Funding Acquisition, G.C.B.
Funding
This research received no specific grant from any funding agency in the public, commercial, or not-for-profit sectors.
Acknowledgments
All authors declared that no applicable individuals or groups in “Acknowledgement” section.
Conflicts of Interest
The authors declare that there is no conflict of interest.
References
- Hu, W.; Guan, J.; Li, B.; Cao, Y.; Yang, J. Influence of Tool Assembly Error on Machined Surface in Peripheral Milling Process. Procedia CIRP 2015, 27, 137–142. [Google Scholar] [CrossRef] [Green Version]
- Medicus, K.; Davies, M.; Dutterer, B.; Evans, C.; Fielder, R. Tool Wear and Surface Finish in High Speed Milling of Aluminum Bronze. Mach. Sci. Technol. 2001, 5, 255–268. [Google Scholar] [CrossRef]
- Luejanda, S.; Jirapattarasilp, K. The Study of Surface Finish in Face Milling of Stainless Steel: AISI 304. Adv. Mater. Res. 2013, 650, 606–611. [Google Scholar] [CrossRef]
- Habeeb, H.; Abou-El-Hossein, K.; Mohamad, B.; Ghani, J.; Kadirgama, K. Investigating of Tool Wear, Tool Life and Surface Roughness When Machining of Nickel Alloy 242 with Using of Different Cutting Tools. Asian J. Sci. Res. 2008, 1, 222–230. [Google Scholar] [CrossRef]
- Caldeirani Filho, J.; Diniz, A. Influence of Cutting Conditions on Tool Life, Tool Wear and Surface Finish in the Face Milling Process. J. Braz. Soc. Mech. Sci. 2002, 24, 10–14. [Google Scholar] [CrossRef]
- Hsu, S. Integrated Surface Modification Technology Development; Presentation in Seminar; Oak Ridge National Laboratory: Knoxville, TN, USA, 2005. [Google Scholar]
- Michail, S.K.; Barber, G. The Effects of Roughness on Piston Ring Lubrication Part I: Model Development. Tribol. Trans. 1995, 38, 19–26. [Google Scholar] [CrossRef]
- Wong, V.; Tung, S. Overview of Automotive Engine Friction and Reduction Trends—Effects of Surface, Material, and Lubricant-Additive Technologies. Friction 2016, 4, 1–328. [Google Scholar] [CrossRef]
- Tung, S. The Critical Role of Surface Engineering in Automotive Tribology-Overview of Modern Advances and Challenges for the Future. In Proceedings of the Third Asia International Conference on Tribology, Kanazawa, Japan, 16–19 October 2006. [Google Scholar]
- Siripuram, R.; Stephens, J. Effects of Deterministic Asperity Geometry on Hydrodynamic Lubrication. ASME J. Tribol. 2004, 126, 527–534. [Google Scholar] [CrossRef]
- Jocsak, J.; Li, Y.; Tian, T.; Wong, V. Analyzing the Effects of Three-Dimensional Cylinder Liner Surface Texture on Ring-Pack Performance with a Focus on Honing Groove Cross-Hatch Angle. In Proceedings of the ASME 2005 Internal Combustion Engine Division Fall Technical Conference, Ottawa, ON, Canada, 11–14 September 2005; pp. 621–632. [Google Scholar]
- Jocsak, J.; Wong, V.; Tian, T. The Effects of Cylinder Liner Finish on Piston Ring-Pack Friction. In Proceedings of the ASME 2004 Internal Combustion Engine Division Fall Technical Conference, Long Beach, CA, USA, 24–27 October 2004; pp. 841–849. [Google Scholar]
- Kalidass, S.; Palanisamy, P. Effect of Machining Parameters on Surface Roughness in End Milling of AISI 304 Steel Using Uncoated Solid Carbide Tools. Aust. J. Mech. Eng. 2014, 12, 223–232. [Google Scholar] [CrossRef]
- Tseng, T.; Konada, U.; Kwon, Y. A Novel Approach to Predict Surface Roughness in Machining Operations Using Fuzzy Set Theory. J. Comput. Des. Eng. 2016, 3, 1–13. [Google Scholar] [CrossRef]
- Franco, P.; Estrems, M.; Faura, F. Influence of Radial and Axial Runouts on Surface Roughness in Face Milling with Round Insert Cutting Tools. Int. J. Mach. Tools Manuf. 2004, 44, 1555–1565. [Google Scholar] [CrossRef]
- Gu, J.; Barber, G.; Jiang, Q.; Tung, S. Surface Roughness Model for Worn Inserts of Face Milling: Part I—Factors that Affect Arithmetic Surface Roughness. Tribol. Trans. 2001, 44, 47–52. [Google Scholar] [CrossRef]
- Felho, C.; Karpuschewski, B.; Kundrak, J. Surface Roughness modelling in Face Milling. In Proceedings of the 15th CIRP Conference on Modelling of Machining Operations, Karlsruhe, Germany, 11–12 June 2015; pp. 136–141. [Google Scholar]
- Munoz-Escalona, P.; Maropoulos, P.G. A Geometrical Model for Surface Roughness Prediction When Face Milling Al 7075-T7351 with Square Insert Tools. J. Manuf. Syst. 2015, 36, 216–223. [Google Scholar] [CrossRef]
- Boothroyd, G.; Knight, W.A. Fundamentals of Machining and Machine Tools, 2nd ed.; CRC Press: Boca Raton, FL, USA, 2005; p. 168. [Google Scholar]
Figure 1.
(a) Bridgeport face milling machine; (b) triangular carbide insert; (c) installation of insert on spindle.
Figure 1.
(a) Bridgeport face milling machine; (b) triangular carbide insert; (c) installation of insert on spindle.

Figure 2.
Surface profile of machine marks in case 1 containing only the round portion of the insert. (a) Single machine mark; (b) a series of machine marks.
Figure 2.
Surface profile of machine marks in case 1 containing only the round portion of the insert. (a) Single machine mark; (b) a series of machine marks.

Figure 3.
Surface profile of machine marks in case 2 containing the round portion and one of the straight portions of the insert. (a) Single machine mark; (b) a series of machine marks.
Figure 3.
Surface profile of machine marks in case 2 containing the round portion and one of the straight portions of the insert. (a) Single machine mark; (b) a series of machine marks.

Figure 4.
Surface profile of machine marks in case 3 containing the round portion and both straight portions of the insert. (a) Single machine mark; (b) a series of machine marks.
Figure 4.
Surface profile of machine marks in case 3 containing the round portion and both straight portions of the insert. (a) Single machine mark; (b) a series of machine marks.

Figure 5.
Typical machined surface profile for feed rate of 0.203 mm/tooth. (a) Raw data before removing the waviness; (b) roughness after removing the waviness.
Figure 5.
Typical machined surface profile for feed rate of 0.203 mm/tooth. (a) Raw data before removing the waviness; (b) roughness after removing the waviness.

Figure 6.
Locations along middle line for roughness measurement.

Figure 7.
Steps in surface roughness measurement.

Figure 8.
Sketch of one machine mark produced by small feed rate.

Figure 9.
Sketch of one machine mark produced by medium feed rate.

Figure 10.
Sketch of one machine mark produced by large feed rate.

Figure 11.
Comparison between mathematical and experimental roughness for different feed rates.

Figure 12.
Comparison between mathematical and experimental roughness for different feed rates with previous and current models.
Figure 12.
Comparison between mathematical and experimental roughness for different feed rates with previous and current models.


Table 1.
6061 Aluminum Alloy Chemical Composition.
| Elements | Percentage Composition |
|---|---|
| Si | 0.4–0.8 |
| Cu | 0.15–0.4 |
| Zn | 0.25 |
| Fe | 0.7 |
| Mn | 0.15 |
| Cr | 0.04–0.35 |
| Ni | 0.05 |
| Pb | 0.05 |
| Sn | 0.05 |
| Ti | 0.15 |
| Mg | 0.8–1.2 |
| Al | 95.85–98.56 |
Table 2.
Experimental parameters in face milling process.
| Nose Radius (mm) | Feed Rate (mm/tooth) | Spindle Speed (rpm) | Depth of Cut (mm) |
|---|---|---|---|
| 0.397 | 0.0254 | 300 | 0.15 |
| 0.127 | |||
| 0.203 | |||
| 0.305 | |||
| 0.406 | |||
| 0.508 | |||
| 0.559 | |||
| 0.635 |
Table 3.
Experimental surface roughness.
| Nose Radius (mm) | Case I or II | Feed Rate (mm/tooth) | Filter (µm) | Roughness (µm) | |||||
|---|---|---|---|---|---|---|---|---|---|
| 1st | 2nd | 3rd | 4th | 5th | Average | ||||
| 0.397 | Small | 0.0254 | 25.4 | 0.160 | 0.171 | 0.162 | 0.160 | 0.176 | 0.170 |
| 0.127 | 127 | 0.730 | 0.751 | 0.739 | 0.756 | 0.740 | 0.740 | ||
| 0.203 | 203 | 4.056 | 4.159 | 4.197 | 4.307 | 4.331 | 4.210 | ||
| 0.305 | 305 | 8.722 | 8.961 | 9.074 | 10.827 | 9.149 | 9.347 | ||
| Medium | 0.406 | 406 | 11.197 | 10.912 | 10.442 | 10.940 | 11.068 | 10.912 | |
| 0.508 | 508 | 23.171 | 20.184 | 17.871 | 19.105 | 18.089 | 19.684 | ||
| 0.559 | 559 | 26.109 | 24.352 | 25.676 | 26.108 | 25.677 | 25.584 | ||
| 0.635 | 635 | 30.886 | 31.055 | 35.021 | 36.829 | 35.192 | 33.797 | ||
Table 4.
Comparison of mathematical model and experimental surface roughness.
| Feed Rate (mm/Tooth) | γ | θ | Mathematical Roughness (µm) | Experimental Roughness (µm) | Error | Feed Rate |
|---|---|---|---|---|---|---|
| 0.0254 | 0.033 | 0.019 | 0.054 | 0.170 | 214.81% | Small feed rate |
| 0.127 | 0.167 | 0.096 | 1.365 | 0.740 | 45.79% | |
| 0.203 | 0.270 | 0.155 | 3.527 | 4.210 | 19.36% | |
| 0.305 | 0.412 | 0.234 | 8.089 | 9.350 | 15.59% | |
| 0.406 | 0.562 | 0.316 | 14.036 | 10.912 | 22.26% | Medium feed rate |
| 0.508 | 0.707 | 0.4 | 23.444 | 19.684 | 16.04% | |
| 0.559 | 0.777 | 0.441 | 28.521 | 25.584 | 10.30% | |
| 0.635 | 0.88 | 0.501 | 36.545 | 33.797 | 7.52% |
Table 5.
Comparison between the previous model [16] and current research.
Table 5.
Comparison between the previous model [16] and current research.
| Nose Radius (mm) | Feed Rate (mm/Tooth) | Previous Research Ra (µm) [9] | Current Research Ra (µm) | Percentage Difference |
|---|---|---|---|---|
| 0.397 | 0.0254 | 0.054 | 0.054 | 0 |
| 0.127 | 1.365 | 1.365 | 0 | |
| 0.203 | 3.527 | 3.527 | 0 | |
| 0.305 | 8.089 | 8.089 | 0 | |
| 0.406 | 14.8 | 14.036 | 5.16% | |
| 0.508 | 24.101 | 23.444 | 2.73% | |
| 0.559 | 29.962 | 28.521 | 4.81% | |
| 0.635 | 40.765 | 36.545 | 10.35% |
Table 6.
Comparison between previous model [19] and current research.
Table 6.
Comparison between previous model [19] and current research.
| Nose Radius (mm) | Feed Rate (mm/Tooth) | Previous Research Ra (µm) [12] | Current Research Ra (µm) | Percentage Difference |
|---|---|---|---|---|
| 0.397 | 0.0254 | 0.052 | 0.054 | 3.85% |
| 0.127 | 1.304 | 1.365 | 4.67% | |
| 0.203 | 3.332 | 3.527 | 5.85% | |
| 0.305 | 7.527 | 8.089 | 7.54% | |
| 0.406 | 13.328 | 14.036 | 5.31% | |
| 0.508 | 20.866 | 23.444 | 12.36% | |
| 0.559 | 25.266 | 28.521 | 12.88% | |
| 0.635 | 32.603 | 36.545 | 12.09% |
© 2019 by the authors. Licensee MDPI, Basel, Switzerland. This article is an open access article distributed under the terms and conditions of the Creative Commons Attribution (CC BY) license (http://creativecommons.org/licenses/by/4.0/).
Share and Cite
MDPI and ACS Style
Wang, R.; Wang, B.; Barber, G.C.; Gu, J.; Schall, J.D. Models for Prediction of Surface Roughness in a Face Milling Process Using Triangular Inserts. Lubricants 2019, 7, 9. https://doi.org/10.3390/lubricants7010009
AMA Style
Wang R, Wang B, Barber GC, Gu J, Schall JD. Models for Prediction of Surface Roughness in a Face Milling Process Using Triangular Inserts. Lubricants. 2019; 7(1):9. https://doi.org/10.3390/lubricants7010009
Chicago/Turabian StyleWang, Rui, Bingxu Wang, Gary C. Barber, Jie Gu, and J.David Schall. 2019. "Models for Prediction of Surface Roughness in a Face Milling Process Using Triangular Inserts" Lubricants 7, no. 1: 9. https://doi.org/10.3390/lubricants7010009
Note that from the first issue of 2016, this journal uses article numbers instead of page numbers. See further details here.