
Macroecology of Dung Beetles in Italy


1
Department of Life, Health and Environmental Sciences, University of L’Aquila, Via Vetoio, 67100 L’Aquila, Italy
2
Department of Statistical Sciences, Sapienza University of Rome, Piazzale Aldo Moro 5, 00185 Rome, Italy
3
Department of Entomology, Forbes 410, The University of Arizona, Tucson, AZ 85721, USA
*
Authors to whom correspondence should be addressed.
Insects 2024, 15(1), 39; https://doi.org/10.3390/insects15010039
Submission received: 9 December 2023
/
Revised: 1 January 2024
/
Accepted: 4 January 2024
/
Published: 7 January 2024
(This article belongs to the Section Insect Ecology, Diversity and Conservation)
Abstract
:Simple Summary
Dung beetle communities include three groups of insects: the true dung beetles (scarabaeines), the small dung beetles (aphodiines), and the earth-boring dung beetles (geotrupids). The Italian dung beetle fauna is one of the richest in Europe due to the position of the Italian peninsula in the middle of the Mediterranean global hotspot of biodiversity. Dung beetle faunas in the Italian peninsula appear to be richer than that of Sardinia, which has a distinctly impoverished fauna due to its strong isolation from the mainland. Dung beetle species richness varies along the Italian peninsula in response to climatic factors. Aphodiines (that need to use the dung before it dries) are mainly associated with humid and cold climates and do not show a latitudinal pattern, while scarabaeines (which can cope with dry conditions) increase their diversity southward. Dung beetle species composition in Italian regions reflects both random processes of dispersal (possibly favored by human influences due to millennia of grazing activities) and the role of southern areas as refugia during Pleistocene glacials.
Abstract
The Italian fauna includes about 170 species/subspecies of dung beetles, being one of the richest in Europe. We used data on dung beetle distribution in the Italian regions to investigate some macroecological patterns. Specifically, we tested if species richness decreased southward (peninsula effect) or northward (latitudinal gradient). We also considered the effects of area (i.e., the species–area relationship), topographic complexity, and climate in explaining dung beetle richness. Finally, we used multivariate techniques to identify biotic relationships between regions. We found no support for the peninsula effect, whereas scarabaeines followed a latitudinal gradient, thus supporting a possible role of southern areas as Pleistocene refuges for this group of mainly thermophilic beetles. By contrast, aphodiines were more associated with cold and humid climates and do not show a distinct latitudinal pattern. In general, species richness was influenced by area, with the Sardinian fauna being however strongly impoverished because of its isolation. Faunal patterns for mainland regions reflect the influence of current ecological settings and historical factors (Pleistocene glaciations) in determining species distributions.

1. Introduction
Dung beetles are a taxonomically composite group of coprophagous Scarabaeoidea belonging to Geotrupidae (known as earth-boring dung beetles or dor beetles), Scarabaeidae Scarabaeinae (known as true dung beetles), and Scarabaeidae Aphodiinae (known as small dung beetles) [1,2]; the latter two groups are sometimes regarded as deserving the taxonomic rank of family (Scarabaeidae and Aphodiidae) [3,4].
The feeding habits of all of these three taxonomic groups are extremely variable, although dung is the most commonly used food for most species [1,2,5,6,7,8,9,10]: Geotrupidae (about 400 known species worldwide) include mycophagous, phytophagous, necrophagous, saprophagous, and coprophagous species; Aphodiinae (about 3200 known species worldwide) include saprophagous, necrophagous, and mycophagous species, but most species are coprophagous; Scarabaeinae (more than 5000 known species worldwide) are virtually invariably coprophagous, although a few species are known to be saprophagous, necrophagous, or mycophagous.
Because of their peculiar trophic niche and behaviors, dung beetles are among the most iconic insects [11,12,13,14], with members of the Scarabaeinae (namely, the scarab beetle Scarabaeus sacer Linnaeus, 1758, and allied taxa) being universally known for their complex parental cares (which were among the first to be investigated by early entomologists interested in insect ethology [11,15,16]) and the importance that they had in the culture of Ancient Egypt [13,17,18]. Based on their nesting behavior, dung beetles are frequently grouped into three main categories: dwellers (species that feed in the dung pat as adults and lay eggs within or under the dung mass where they undergo larval development; most aphodiines belong to this category), tunnellers (species that dig chambers more or less directly underneath the pat for breeding; geotrupids and many scarabaeines), and rollers (species that form a ball of dung that can be rolled away from the pat and buried for breeding; this category is found only among the scarabaeines) [1,2,19,20,21].
By removing substantial amounts of dung, dung beetles provide essential ecosystem services, including nutritional cycling, maintenance of soil characteristics, seed dispersal, reduction in greenhouse gases, and livestock protection from dung breeding dipterans and gastrointestinal parasites [22,23,24,25,26,27,28,29,30,31,32,33,34]. Because of their sensitivity to several forms of anthropogenic impacts on their ecosystems, dung beetles are globally declining [35,36,37,38,39,40].
The Italian fauna of dung beetles includes about 19 species of Geotrupidae and 170 species of Scarabaeidae (46 Scarabaeinae, about 90 dung-feeding Aphodiinae, and about 36 Aphodiinae feeding prevalently or exclusively on resources different from dung), being one of the richest in Europe [10]. This exceptional diversity parallels that recorded for the most disparate taxa in Italy, e.g., [41,42,43,44], which represents an important hub of biodiversity within the Mediterranean global hotspot [45,46,47,48,49] because of its environmental heterogeneity and complex biogeographical history [50,51,52,53,54,55,56,57,58,59,60,61]. Thanks to a long history of entomological research, the Italian fauna of dung beetles is taxonomically and ecologically well known, and accurate distributional information are available at a coarse (regional) scale [10]. However, despite the availability of relatively good ecological and distributional data, no comprehensive study addresses the macroecology of dung beetles in Italy.
Here, we used data on dung beetle distribution in the Italian regions to test the following macroecological hypotheses:
- (1)
- Species richness increases with area. One of the most universal biogeographical patterns is the species–area relationship (SAR), that is, the increase in species richness with increasing area [62]. Thus, we tested if dung beetle richness in Italy increased with the area of the Italian regions.
- (2)
- Islands have depauperate faunas. The Italian territory is composed of a long peninsula and two main islands (Sicily and Sardinia). Island biotas are known to be impoverished when compared to those of mainland regions of equal size [63,64]. Thus, we tested if island dung beetle faunas were impoverished in comparison with the mainland fauna.
- (3)
- Dung beetles conform to the peninsula effect. The Italian peninsula stretches from the European mainland at the north toward the center of the Mediterranean basin at the south. If the biota of a peninsula results from colonization processes starting from the mainland, species richness should decrease from the base to the tip of the peninsula, a phenomenon recorded for a variety of taxa and peninsulas worldwide [60,61,65,66]. In the case of the Italian peninsula, given its north–south alignment, species richness should decrease from the north (base of the peninsula) to the south (tip of the peninsula) [56,60,61]. To test this hypothesis, we correlated dung beetle richness with the latitude of the regions.
- (4)
- Dung beetles conform to the latitudinal gradient. One of the most widespread macroecological patterns is the latitudinal gradient: species richness tends to decrease from the equator to the poles [53,55,61,67,68,69,70,71,72,73,74,75,76,77,78,79,80,81,82]. In the case of the Italian territory, this should translate to a pattern of decreasing richness from south to north, thus leading to a pattern opposite to that predicted by the peninsula effect but which might be explained by the current climate (if species respond positively to increasing temperatures) and the role of southern Italian regions as a Pleistocene refugial center. During the Pleistocene glacials, most European areas northern to the Alps were covered by ice, forcing species to retreat to the southern, ice-free areas; these areas acted as both refugial and speciation centers, from which species recolonized the northern areas after deglaciation [56,60,61]. Within the Italian peninsula, if dung beetles are positively influenced by temperatures and/or southern regions acted as Pleistocene refuges, a negative relationship between latitude and richness is expected [56].
- (5)
- Climate influences dung beetle richness, with differences between aphodiines and scarabaeines that reflect their main ecological characteristics. To test this hypothesis, we investigated the influence of climatic characteristics of Italian regions on their dung beetle diversity. Precipitation and temperature are expected to influence dung beetle diversity because of their effects on excrement persistence and quality. In cold and humid climates, excrement degradation is slow, while it proceeds faster in hot and arid climates, thus favoring species that can protect the offspring through subterranean pedotrophic nests [1,83,84,85]. Thus, dung beetle communities of temperate areas tend to be dominated by aphodiines (which are mainly dwellers), whereas scarabaeines (which are rollers and tunnellers) predominate in tropical and Mediterranean communities [85,86]. We expect that the amount of precipitation should influence positively the aphodiine richness in Italy and the overall dung beetle richness, given the prevalence of aphodiines in the Italian fauna, but not scarabaeines. We also expect that aridity should affect negatively aphodiines and the total dung beetle richness but not scarabaeines. In general, we expect that, given their different ways of food utilization, aphodiine will be negatively influenced by temperatures, whereas scarabaeines should be positively influenced or not influenced. These contrasting responses should lead to a lack of relationship between total dung beetle richness and temperature. We also expect that climatic variability should have a negative influence on aphodiines and possibly on dung beetles in general, but not on scarabaeines, which should be more adapted to tolerate high temporal variation in temperatures.
- (6)
- Elevation influences dung beetle richness negatively. Dung beetle diversity tends to decline with increasing elevation [1,85,87,88,89,90,91,92,93,94,95,96,97], although mid-elevation peaks [89,91,98] or a lack of relationship have been also reported [85,99]. Not only at higher elevations temperatures might be too low, especially in winter, but the drying effects of increased windiness and insulation might lead to the rapid desiccation of excrements, especially in the summer, when precipitation may be completely absent [85]. Thus, we hypothesize that more mountainous regions should have fewer species of dung beetles than the less mountainous ones, leading to an inverse relationship between dung beetle richness and regional average elevation.
- (7)
- Species distributions may result from three, mutually non-exclusive processes: influences of current (present day) ecological conditions, random processes, and historical (paleogeographical and paleoecological) events. As among current factors, climate and topography are major drivers of species distributions, we expect that inter-regional dissimilarities in species composition (β-diversity) correlate with similarity in these environmental conditions [53,56,60,61,100]. If species distributions result from random processes (from stochastic population dynamics and spatially constrained dispersal), spatial patterns of species similarity among regions should simply reflect their geographical proximity [53,56,60,61,101]. This means that we expect a distance decay of similarity independently from ecological differences among regions. Finally, if current species distributions have been influenced by historical factors (such as the effects of glacials), this would produce regional groupings characterized by distinct biogeographical discontinuities [53,56,60,61].
2. Materials and Methods
2.1. Data Collection
Dung beetle species distributions in Italy were coded as presence/absence at the regional level using information reported in Ballerio et al. [10], updated with subsequent findings retrieved from Forum Entomologi Italiani [102] (Figure 1).
Uncertain records were excluded. We only considered species that feed at least regularly on dung. We considered both species and subspecies not only because subspecies are biogeographically informative but also because there is evidence that at least some subspecies might deserve the taxonomic rank of species and the dividing line between species and subspecies in these insects is rather arbitrary [10]. The word species will be applied to both species and subspecies for simplicity. Although the use of regions as geographical units instead of regular grids is afflicted by problems arising from their different size and internal high heterogeneity in environmental conditions, regional data are well suited for biogeographical and macroecological studies [103,104,105] because they are more accurate and comprehensive than point records [106,107,108], being also robust to the violation of constant grain size [109].
Areas of the regions, their limits, and centroids (latitude and longitude, decimal degrees) were extracted from ISTAT [110]. To investigate the influence of climatic factors on dung beetle diversity, for each region, we calculated the following parameters: average of the annual mean temperatures (MEANTEMP), average of the maximum temperatures of the warmest month (MAXTEMP), average of the minimum temperatures of the coldest month (MINTEMP), average of temperature annual ranges (TEMPRAN, calculated as the average of the differences between MAXTEMP and MINTEMP values), spatial range of the mean annual temperatures (SRTEMP, i.e., the range of TEMP), average of annual precipitations (PREC), spatial range of precipitation (SRPREC, i.e., the range of PREC), precipitation of the driest quarter (PRECDQ), and spatial range of precipitation of driest quarter (SRPRECDQ). Temperatures were expressed in °C and precipitations in mm. Climatic variables were obtained from WorldClim 2.1 (period 1970–2000, resolution 30 s) [111]. Data were extracted by using ArcGis Pro 3.1.3 [112].
As topographical variables, we considered minimum elevation (MINELE), maximum elevation (MAXELE), mean elevation (MEANELE), and spatial range of elevation (SRELE, calculated as the difference between maximum and minimum values). All elevations were in m above sea level. Topographical variables were obtained from TINITALY (resolution 10 m) [113]. Data were extracted by using ArcGis Pro 3.1.3 [112].
2.2. Data Analysis
Analyses were conducted separately for the entire dataset (Geotrupidae, Scarabaeinae, and Aphodiinae) and for Scarabaeinae and Aphodiinae separately (Geotrupidae were not analyzed separately because of the small number of species).
The species–area relationship (SAR; hypothesis 1) was modeled using the power function, as this model describes adequately most empirical data [114,115,116].
The model is expressed by the following equation:
where S is the species number, A is area, and c and z are fitting parameters.
S = cAz,
This model was applied here by using its linearized form:
where c represents the expected number of species per unit area, and z is the slope of the function [116].
ln(S) = ln(c) + z ln (A),
For ease of interpretation, areas were expressed as 103 km2. Data were fitted using ordinary least squares (OLS) regressions, both including (overall models) and excluding island regions (Sicily and Sardinia) (mainland models). Residuals of Sicily and Sardinia from the regression line of the overall model were inspected to determine whether islands had impoverished faunas, with negative residuals indicating impoverishment (hypothesis 2) [63]. Analysis of covariance (ANCOVA) was applied to aphodiine and scarabaeine mainland regressions to test for homogeneity of slopes and differences between intercepts [116].
To test the peninsula effect (hypothesis 3) and the latitudinal gradient (hypothesis 4), correlation analyses were performed between the latitude (centroid) of mainland regions and dung beetle diversity. As measures of dung beetle diversity, we used the residuals (calculated from Equation (1) after back-transformation of Equation (2)) from the mainland SAR model; the use of residuals allowed us to consider the possible influence of differences in area size among regions in determining differences in species richness.
To test the importance of climatic and topographical variables as predictors of dung beetle diversity (hypotheses 5 and 6), we adopted a multimodel inference procedure. With this approach, we constructed models representing every possible combination of explanatory variables. Then, models were ranked in increasing order of their corrected Akaike information criterion value (AICc); models with a ΔAIC ≤ 2 were considered as equally supported and averaged using both full and conditional averages. In the full average, regression coefficients for variables that are not included in a given model are set to zero, whereas conditional average only averages over the models where the parameter appears. Analyses were conducted using residuals of richness from Equation (1) as SAR-corrected estimates of species richness. Before analyses, we checked multicollinearity among covariates using the Spearman correlation coefficient to consider both linear and non-linear monotonic relationships, and in the case of strong collinearity (rs > |0.6|) [117], we decided which variable to retain in the analyses as follows. For temperatures, we found pairwise collinearity between MEANTEMP, MAXTEMP, MINTEMP, and SRTEMP. Therefore, we decided to retain MEANTEMP. For precipitation, we found that PREC was strongly correlated with SRPREC, thus we retained PREC. For aridity, PREDQ was strongly correlated with SRPREDQ, and we retained PREDQ. For topographical variables, MEANELE was strongly correlated with MINELE, MAXELE, and SRELE. Thus, only MEANELE was maintained in the analyses.
Faunal relationships between regions (hypothesis 7) were investigated using two coefficients of dissimilarity (β-diversity): the Dice–Sørensen coefficient (βsor, which expresses the total β-diversity) and the Simpson coefficient (βsim, which expresses the pure turnover component, i.e., the compositional differences after removing the effect of nestedness, that is, the compositional change caused by ordered species loss) [118,119,120,121,122,123]). Biogeographical distances were correlated with (1) environmental distances between regions calculated as Euclidean distances for the environmental variables (MEANTEMP, MAXTEMP, MINTEMP, TEMPRAN, SRTEMP, PREC, SRPREC, PRECDQ, MINELE, MAXELE, MEANELE, and SRELE) after standardization, and (2) geographical distances between regions calculated as distances (in km) between centroids of latitude and longitude. Correlations between matrices were performed using Mantel tests (to test the influence of either geographical position or environmental conditions on biogeographical distances) and partial Mantel tests (to evaluate the effect of geography, controlling for the effect of environmental conditions, and to evaluate the effect of environmental conditions, controlling for the effect of geography) [124].
To depict inter-regional biogeographical relationships expressed by Dice–Sørensen and Simpson coefficients, we used both cluster analyses and non-metric multidimensional scaling (NMDS). For cluster analyses, we used the UPGMA (unweighted pair group method with arithmetic average) as an amalgamation rule, as it is considered the clustering strategy that minimizes the distortion of the original data matrix [125], and it is therefore favored in biogeographical research (e.g., [125,126,127,128,129,130,131]). Since the resulting dendrograms and bootstrap supports are affected by the order of the regions in the original matrix (especially when pairwise distance values are equal) [132,133], we adopted a procedure which re-samples the order in which areas are introduced in the analyses and creates consensus trees in bootstrap analysis [133]. The impact of alternative topologies was evaluated by comparing the initial tree with consensus trees obtained from 1000 trees produced after the re-ordering of regions for six different consensus rules (from 0.5 to 1 with a step of 0.1), and evaluating the percentage of times that each node was repeated among different consensus rules (node strength; Figure S1). Then, a bootstrap analysis was applied to the 0.5 consensus tree, using a multiscale bootstrap procedure with selection of the scale at which strongly and weakly supported nodes are best recognized [57]. The NMDS is an ordination technique particularly suitable to disclose multiple biogeographical relationships [60,61,134,135]. Procrustes distances were used to compare solutions until a minimum stress value was obtained. For the two-dimensional representation, the axis with the highest variance was standardized between 0 and 1, and the other axis was rescaled according to the first one. Finally, the colors blue, green, yellow, and red were assigned to the four corners, and each region received an RGB (red, green, or blue) color based on its position in the two-dimensional space.
3. Results
The species–area relationships (SARs) modeled for the total dung beetle faunas and for the aphodiines and scarabaeines analyzed separately showed that Sardinia has a strongly impoverished fauna, whereas Sicily does not seem to have substantially fewer species than expected (Figure 2, Table 1); thus, hypothesis 2 is supported for Sardinia but not for Sicily. SARs ameliorated substantially if islands are removed from the analyses, thus showing that after the confounding effect of isolation is removed (Figure 2, Table 1), species richness increases with area, as expected according to hypothesis 1. Regressions for the mainland regions have similar slopes but different intercepts (ANCOVA: homogeneity of slopes: F = 2.774, p = 0.106; differences between intercepts: F = 554.300, p < 0.0001), with aphodiines having much more species per unit area than scarabaeines (55 species for a unit area of 103 km2 vs. 25 species for a unit area of 103 km2).
The residuals of the SARs (used as area-corrected estimates of richness) were not significantly correlated with latitude for the total dung beetle fauna and for the aphodiines, whereas a negative correlation emerged for the scarabaeines (Figure 3, Table 2). Therefore, neither hypothesis 3 nor hypothesis 4 were supported for aphodiine and total dung beetle richness, but hypothesis 3 was falsified and hypothesis 4 supported for the scarabaeines.
Latitude was correlated (Spearman correlation coefficient) negatively with annual mean temperature (rs = −0.880, p < 0.0001) and positively with temperature annual range (marginally, rs = −0.443, p = 0.067), annual precipitation (rs = −0.612, p = 0.008), and precipitation of the driest quarter (rs = 0.744, p < 0.001), but not with average elevation (rs = 0.362, p < 0.140).
Total precipitation influenced positively both aphodiine richness and the total richness of dung beetles, as expected according to hypothesis 5 (Table 3). By contrast, precipitation was not important for scarabaeine richness, as expected according to hypothesis 5 (Table 3).
Aridity influenced negatively aphodiine richness and total dung beetle richness, but not scarabaeine richness (thus supporting hypothesis 5) (Table 3). Temperature was not important for the total dung beetle richness and scarabaeine richness but exerted a negative effect on aphodiines (as postulated by hypothesis 5) (Table 3). Climatic instability had a negative effect on both aphodiine and total dung beetle richness (as expected by hypothesis 5) but also on scarabaeine richness (which contrasts with our assumptions) (Table 3). Elevation influenced positively aphodiine richness (which is in contrast with hypothesis 6) (Table 3).
Mantel tests (Table 4) indicated that biogeographical dissimilarities (expressed by either the Dice–Sørensen or the Simpson indices) were correlated with geographical position even after controlling for environmental distances, whereas correlation between biogeographical dissimilarities and environmental distances were weak and disappeared after controlling for geographical position. This highlights the influence of geographical distances independently from environmental characteristics (climate and topography) (thus supporting hypothesis 7 for the influence of random processes more than that of current ecological conditions).
In all cluster analyses (Figure 4 and Figure S1), the two islands (Sardinia and Sicily) were distinctly separated from mainland regions. Analyses conducted using all dung beetle species with the Dice–Sørensen index showed a distinct separation of mainland regions into four groups: Alpine, northern and central Apennine, central Apennine, and southern Apennine regions (Figure 4A), whereas use of the Simpson index showed three groups: Alpine, northern and central Apennine, and southern Apennine regions (Figure 4B). When the analyses were restricted to the aphodiines, the four groups of regions were recovered using both the Dice–Sørensen and Simpson indices (Figure 4C,D). For the scarabaeines, the Simpson index indicated a clear distinction between two groups of regions: those to the north of the Po River and those to the south (Figure 4E,F).
The results of NMDS (Figure 5) indicated in all cases a strong separation of islands (regions 19 and 20) from the mainland. For aphodiines, NMDS results showed the presence of three mainland groups: (1) Alpine regions (regions 1–6); (2) northern and central Apennine regions (regions 7–14); (3) southern Apennine regions (regions 15–18). The northern and central Apennine regions appeared strictly associated with the Alpine ones, while the southern regions were distinctly separated, especially when the Simpson index was used. Similar patterns were found using the total dung beetle fauna. NMDS results for scarabaeines indicated the presence of two distinct groups of mainland regions corresponding to the areas north (regions 1–8) and south (regions 9–18) of the Po River. Overall, these results support the influence of historical factors that created biogeographical discontinuities (hypothesis 7).
4. Discussion
The species–area relationship (SAR) is one of the most universal and best documented ecological patterns [62,140], and the Italian dung beetles are no exception. When considering peninsular regions alone, species richness in dung beetles increases with area (thus supporting hypothesis 1). As expected, Sardinia has a strongly impoverished fauna, whereas the Sicilian fauna is only slightly impoverished (hypothesis 2). This is perfectly in line with what was observed for odonates, for which the fauna of Sardinia is highly impoverished, but that of Sicily is not [60,63]. These results can be explained by the different degree of isolation of the two islands: while Sardinia is very isolated from the Italian mainland (with a minimum distance of about 190 km), Sicily is separated from the mainland by about only 3 km. This impoverishment is also in agreement with the low number of dung beetle species recorded in the Iberian islands when compared with mainland areas [141]. If mainland SARs are used to predict the expected number of species, Sardinia should have 60 species of aphodiines, 35 species of scarabaeines, and 104 species of dung beetles in total. These values are much lower than the observed ones (39 species of aphodiines, 19 species of scarabaeines, and 65 species of dung beetles in total). It should be noted that there are many uncertain records from Sardinia [10] that were excluded from the analyses. If these records were included, the Sardinian fauna would include about 53 species of aphodiines, 30 species of scarabaeines, and 94 species of dung beetles in total. Thus, the fauna of Sardinia would appear still impoverished, although to a lesser degree. Further research in Sardinia is therefore needed to ascertain the occurrence of species doubtfully recorded from this region. Slopes (z-values) of the mainland SARs for the Italian dung beetles were very low (ranging between 0.029 and 0.098), if compared with those commonly observed in other systems (usually between 0.2 and 0.4) [142], but relatively similar to those observed for dung beetles in the Iberian peninsula (0.089–0.142) [141], possibly a reflection of the good dispersal capability and low ecological specialization of these insects, which are usually able to use dung resources almost everywhere [1,141].
A comparison of c-values indicates that there are much more aphodiine species than scarabaeine species per unit area, which may reflect larger population sizes for aphodiines [116], in addition to the obvious reason that, in the study area, the aphodiine fauna is richer than the scarabaeine fauna. Similarly, SARs constructed for Iberian dung beetles support that the c-value is higher in aphodiines when compared with scarabaeines [141]. It would be useful in the future to extensively compare SARs for aphodiines and scarabaeines at smaller scales and in faunas where there is no predominance of aphodiines to better understand how differences in the ecology of these two groups influence their SAR.
We found a negative relationship between scarabaeine richness and latitude, which supports previous findings of a negative relationship between latitude and dung beetles in general on local communities [143]. These results indicate that scarabaeines conform to the latitudinal gradient (thus supporting hypothesis 4), instead of being influenced by the peninsula effect (being therefore in contrast with hypothesis 3). Thus, scarabaeines behave similarly to darkling beetles [56] but differently from other groups, such as birds, small mammals, odonates, ground beetles, hydradephagan beetles, and ants, which show a peninsula effect [60,65,143]. However, we found no clear latitudinal trend in species richness for both the total dung beetle fauna and the aphodiines, which contrasts with both the peninsula effect (hypothesis 3) and the latitudinal gradient (hypothesis 4). This lack of relationship for dung beetles as a whole is driven by aphodiines, which dominate the Italian dung beetle fauna. Interestingly, aphodiine richness seems to vary with latitude according to a U-shaped pattern, which suggests that this fauna might include two biogeographical distinct components: one represented by more northern species, which decline southward (following the peninsula effect), and one represented by more southern species, which decline northward (following the latitudinal gradient). This hypothesis might be explored in the future by modeling individual species ranges and considering possible differences in the use of food among species. Overall, these results suggest that aphodiines were possibly subject to large post-glacial movements which partially erased the historical signal retained by scarabaeines because of aphodiine wider ecological (especially thermal) needs.
Climate influences dung beetle richness patterns in various ways. As expected, precipitation had a positive influence on both aphodiine richness and total dung beetle richness, but not on scarabaeines (hypothesis 5). Although rain may have per se a negative effect on dung beetle ecology by removing nutrients from the dung, total precipitation reflects, at this scale, the amount of water available and hence humidity. Thus, this result is consistent with the fact that aphodiines (which are mostly dwellers and represent the vast majority of dung beetle diversity in the study area) are favored by humid climates, where excrement degradation proceeds slowly, whereas scarabaeines (which are rollers and tunnellers) can also cope with arid climates [1,83,85,86]. This interpretation is also confirmed by the influence of aridity, a fundamental aspect of the Mediterranean climate. Aridity influenced negatively aphodiine richness and total dung beetle richness, but not scarabaeine richness (thus supporting hypothesis 5). Temperature exerted a negative influence on aphodiines but not on scarabaeine richness, leading to a lack of response for the total dung beetle richness (hypothesis 5). The contrasting responses of aphodiines and scarabaeines is consistent with their preferences for cold (temperate) and hot (tropical and Mediterranean) climates, respectively [85,86].
Climatic variability influences negatively both the total dung beetle richness, and the two main groups (aphodiines and scarabaeines). While this negative influence on total and aphodiine richness supported our hypothesis 5, the effect on scarabaeines was unexpected and indicated that their ability to protect the offspring through subterranean pedotrophic nests do not make them immune to the negative effects of widely oscillating temperatures.
We found that elevation acted positively on aphodiines, thus contrasting with hypothesis 6. Previous research showed that the relationship between dung beetle diversity and elevation may show a decreasing pattern (e.g., [85,91,93,94,96,144,145]), a mid-elevation peak [98], or a lack of relationship [99]. Also, previous research showed that elevational range was not an important predictor of dung beetle richness compared to climatic factors [141,146,147]. This may be the consequence of both the heterogeneity in the environmental adaptations of dung beetles and the overwhelming importance of climatic factors that vary with elevation [148,149,150], making elevational range only a less efficient surrogate of climate. Our results suggest that the average elevation of a given region has a positive influence on aphodiine diversity, likely reflecting their ability to cope with very cold climates (some species are found at very high elevations, even on the snow [10]), and hence to exploit a higher habitat diversity.
Faunal relationships between regions were distinctly related with inter-regional distances, whereas differences in environmental setting (climate and topography) had negligeable effects, thus supporting the importance of geographical proximity instead of ecological similarity (random processes in hypothesis 7). In fact, it is possible that the dominance of geographical proximity on current patterns might at least partially reflect human activities, since agricultural practices and the presence of livestock through millennia may have profoundly influenced dung beetle assemblages by favoring species movements and faunal homogenization [151]. Inter-regional similarities indicate that Sardinia has a unique dung beetle fauna, well distinct from those of mainland areas. This agrees with previous findings in other groups, such as ground beetles [152], leaf beetles [152], darkling beetles [56], odonates [60], and burnet moths [153]. Earwigs are an exception, as their insular faunas appear to be very similar to those of mainland areas facing the Tyrrhenian Sea [61], suggesting extremely high dispersal capabilities with possibly recent immigrations. Sicily appears also very distinct from the mainland for dung beetles, with strong affinities with Sardinia. This similarity in the faunal composition between Sicily and Sardinia may be explained by the similarity in climatic conditions (these two islands are characterized by high temperatures and low precipitation) and is consistent with results obtained for ground beetles [152], leaf beetles [152], and burnet moths [153], where Sicily clustered with Sardinia. At the same time, the dung beetle fauna of Sicily shows some affinities with those of southern Italian mainland regions, as already observed in darkling beetles [56], earwigs [61], and odonates [60], thus indicating a low level of isolation for this island. Among the mainland regions, biogeographical relationships indicate some major discontinuities for the dung beetle faunas, with important differences between aphodiines and scarabaeines. Aphodiine biogeographical patterns reflect the major orographic features of the study area, showing three main faunal groups, corresponding to the Alps, the northern Apennines, and the southern Apennines. By contrast, scarabaeine biogeographical patterns are characterized by a major discontinuity roughly corresponding to the Po River, which suggests a major role for climatic factors, with northern regions characterized by humid and cold climates, and central–southern regions by warmer and drier climates [154]. These results suggest that orography is important for aphodiine distribution, whereas climate is more important for scarabaeines, which are typically more thermophilic. The presence of these strong discontinuities may explain why biogeographical similarities appear not affected by changes in environmental characteristics after the influence of geographical proximity is removed and (as postulated with hypothesis 7) suggests a role for historical factors represented by the influence of Pleistocene glaciations, which made southern Italian regions an important refugial area [56,60,61].
5. Conclusions
The Italian dung beetle fauna shows complex macroecological patterns that reflect the interaction of the current climate, topographic setting, and historical factors. In general, species richness increases with area, as hypothesized according to the species–area relationship (SAR), one of the most universal ecological patterns. However, islands had fewer species than expected according to the SAR, which conforms to the hypothesized impoverishment of island faunas due to their isolation, a phenomenon that appears however much more marked for Sardinia (very isolated) than from Sicily (close to the mainland). We found no support for the hypothesis that dung beetles are affected by the peninsula effect, which contrasts with the decline in species richness from the base (north) to the tip (south) of the Italian peninsula observed in other groups. On the contrary, scarabaeine richness increases southward, thus supporting the latitudinal gradient hypothesis for this group. This gradient reflects the preference of these insects for hot and dry climates and may also represent a consequence of the role of southern regions as Pleistocene refugia. In general, dung beetles respond to climatic and topographical characteristics as hypothesized according to their ecology and behavior, with aphodiine richness being positively influenced by humid and cold climates (being therefore positively influenced by the relief). In general, spatial turnover in species composition appeared to be influenced by geographical proximity among regions more than by their environmental similarities, which supports the importance of random dispersal processes. However, distinct biogeographical discontinuities between the Alpine regions and different sectors of the Apennines also indicate a role for historical factors (viz. the influence of Pleistocene glaciations).
Supplementary Materials
The following supporting information can be downloaded at: https://www.mdpi.com/article/10.3390/insects15010039/s1, Table S1: Dung beetle species distribution in Italy; Table S2: Environmental variables; Tabel S3: Distances between regions (in km, calculated as distances between centroids of latitude and longitude); Figure S1: Values of node strength in cluster analyses for total dung beetle species composition (A,B), aphodiines (C,D), and scarabaeines (E,F) of Italian regions, using Dice–Sørensen (A,C,E) and Simpson (B,D,F) indices of similarity.
Author Contributions
Conceptualization, S.F.; methodology, S.F., A.V. and D.B.; software, S.F., A.V. and D.B.; validation, S.F. and L.D.B.; formal analysis, S.F., A.V. and D.B.; investigation, S.F., L.D.B. and D.B.; resources, S.F.; data curation, S.F., L.D.B. and D.B.; writing—original draft preparation, S.F.; writing—review and editing, S.F., A.V., L.D.B. and D.B.; visualization, S.F. and A.V.; supervision, S.F.; project administration, S.F.; funding acquisition, S.F. All authors have read and agreed to the published version of the manuscript.
Funding
This research received no external funding.
Data Availability Statement
All data are reported in the Supplementary Materials.
Acknowledgments
We dedicate this article to our pets for all of their affection; we consider it a privilege to remove their dung. We are grateful to two anonymous reviewers for their helpful comments on the first version of this paper.
Conflicts of Interest
The authors declare no conflicts of interest.
References
- Hanski, I.; Cambefort, Y. (Eds.) Dung Beetle Ecology; Princeton University Press: Princeton, NJ, USA, 1991; pp. 1–520. [Google Scholar]
- Scholtz, C.H.; Davis, A.L.V.; Kryger, U. Evolutionary Biology and Conservation of Dung Beetles; Pensoft: Sofia, Bulgaria, 2009; pp. 1–567. [Google Scholar]
- Dellacasa, G.; Bordat, P.; Dellacasa, M. A revisional essay of world genus-group taxa of Aphodiinae. Mem. Soc. Entomol. Ital. 2001, 79, 1–482. [Google Scholar]
- Dellacasa, G.; Dellacasa, M. Coleoptera Aphodiidae, Aphodiinae; Fauna d’Italia; Calderini—Il Sole 24 Ore: Milano, Italy, 2006; pp. 1–484. [Google Scholar]
- Halffter, G.; Halffter, V. Why and where coprophagous beetles (Coleoptera: Scarabaeinae) eat seeds, fruits or vegetable detritus. Boletín Soc. Entomológica Aragonesa 2009, 45, 1–22. [Google Scholar]
- Larsen, T.H.; Lopera, A.; Forsyth, A.; Génier, F. From coprophagy to predation: A dung beetle that kills millipedes. Biol. Lett. 2009, 5, 152–155. [Google Scholar] [CrossRef] [PubMed]
- Simmons, L.W.; Ridsdill-Smith, J. Ecology and Evolution of Dung Beetles; John Wiley and Sons: Chichester, UK, 2011; pp. 1–347. [Google Scholar]
- Tonelli, M.; Giménez Gómez, V.C.; Verdú, J.R.; Casanoves, F.; Zunino, M. Dung beetle assemblages attracted to cow and horse dung: The importance of mouthpart traits, body size, and nesting behavior in the community assembly process. Life 2021, 11, 873. [Google Scholar] [CrossRef] [PubMed]
- Weithmann, S.; von Hoermann, C.; Schmitt, T.; Steiger, S.; Ayasse, M. The attraction of the dung beetle Anoplotrupes stercorosus (Coleoptera: Geotrupidae) to volatiles from vertebrate cadavers. Insects 2020, 11, 476. [Google Scholar] [CrossRef]
- Ballerio, A.; Rey, A.; Uliana, M.; Rastelli, M.; Rastelli, S.; Romano, M.; Colacurcio, L. Coleotteri Scarabeoidei d’Italia. Available online: https://www.societaentomologicaitaliana.it/Coleotteri%20Scarabeoidea%20d'Italia%202014/ (accessed on 30 May 2023).
- Grandi, G. Introduzione allo Studio dell’Entomologia, Vol. II. Pterigoti; Edizioni Agricole: Bologna, Italy, 1951; Volume XLI, pp. 1–1332. [Google Scholar]
- Goidanich, A. Secoli di umanità nella entomologia italiana (per il centenario della S.E.I., Firenze 31 Ottobre 1869-Genova 31 Ottobre 1969). Mem. Soc. Entomol. Ital. 1969, 48, XXV–LXXXIV. [Google Scholar]
- Ratcliffe, B.C. Scarab beetles in human culture. In Scarabaeoidea in the 21st Century: A Festschrift Honoring Henry F. Howden; Jameson, M.L., Ratcliffe, B.C., Eds.; The Coleopterists Society Monographs: Washington, DC, USA, 2006; Volume 5, pp. 85–101. [Google Scholar]
- Govorushko, S. Human-Insect Interactions; CRC Press: Boca Raton, FI, USA, 2018; pp. 1–442. [Google Scholar]
- Fabre, J.H. Souvenirs Entomologiques: Études sur l’Instinct et les Moeurs des Insectes. Série 1; Ch. Delagrave: Paris, France, 1879; pp. 1–324. [Google Scholar]
- Fabre, J.H. Souvenirs Entomologiques: Études sur l’Instinct et les Moeurs des Insectes. Série 5; Ch. Delagrave: Paris, France, 1897; pp. 1–383. [Google Scholar]
- Ben-Tor, D. The Scarab: A Reflection of Ancient Egypt, 1st ed.; The Israel Museum: Jerusalem, Israel, 1993; pp. 1–84. [Google Scholar]
- Poole, F. Scarabs from the necropolis of Pontecagnano. In Atti Sesto Congresso Internazionale di Egittologia; Tipografia Torinese: Torino, Italy, 1993; Volume 2, pp. 407–414. [Google Scholar]
- Halffter, G.; Edmonds, W.D. The Nesting Behaviour of Dung Beetles (Scarabaeinae): An Ecological and Evolutive Approach; Instituto de Ecologìa: México City, Mexico, 1982; pp. 1–176. [Google Scholar]
- Doube, B.M. A functional classification for the analysis of dung beetle assemblages. Ecol. Entomol. 1990, 15, 371–383. [Google Scholar] [CrossRef]
- Tonelli, M. Some considerations on the terminology applied to dung beetle functional groups. Ecol. Entomol. 2021, 46, 772–776. [Google Scholar] [CrossRef]
- Yokoyama, K.; Kai, H.; Koga, T.; Kawaguchi, S. Effect of dung beetle, Onthophagus lenzii H. on nitrogen transformation in cow dung and dung balls. Soil Sci. Plant Nutr. 1991, 37, 341–345. [Google Scholar] [CrossRef]
- Fowler, F.; Denning, S.; Hu, S.; Watson, W. Carbon neutral: The failure of dung beetles (Coleoptera: Scarabaeidae) to affect dung-generated greenhouse gases in the pasture. Environ. Entomol. 2000, 49, 1105–1116. [Google Scholar] [CrossRef]
- Andresen, E.; Feer, F. The role of dung beetles as secondary seed dispersers and their effect on plant regeneration in tropical rainforests. In Seed Fate: Predation, Dispersal and Seedling Establishment; Forget, P.-M., Lambert, J.E., Hulme, P.E., Vander Wall, S.B., Eds.; CAB International: Wallingford, UK, 2005; pp. 331–349. [Google Scholar]
- Bang, H.S.; Lee, J.-H.; Kwon, O.S.; Na, Y.E.; Jang, Y.S.; Kim, W.H. Effects of paracoprid dung beetles (Coleoptera: Scarabaeidae) on the growth of pasture herbage and on the underlying soil. Appl. Soil Ecol. 2005, 29, 165–171. [Google Scholar] [CrossRef]
- Bishop, A.L.; McKenzie, H.J.; Spohr, L.J.; Barchia, I.M. Interactions between dung beetles (Coleoptera: Scarabaeidae) and the arbovirus vector Culicoides brevitarsis Kieffer (Diptera: Ceratopogonidae). Aust. J. Entomol. 2005, 44, 89–96. [Google Scholar] [CrossRef]
- Yamada, D.; Imura, O.; Shi, K.; Shibuya, T. Effect of tunneler dung beetles on cattle dung decomposition, soil nutrients and herbage growth. Graesslia 2007, 53, 121–129. [Google Scholar] [CrossRef]
- Nichols, E.; Spector, S.; Louzada, J.; Larsen, T.; Amezquita, S.; Favila, M.E. Ecological functions and ecosystem services provided by Scarabaeinae dung beetles. Biol. Conserv. 2008, 141, 1461–1474. [Google Scholar] [CrossRef]
- Penttilä, A.; Slade, E.M.; Simojoki, A.; Riutta, T.; Minkkinen, K.; Roslin, T. Quantifying beetle-mediated effects on gas fluxes from dung pats. PLoS ONE 2013, 8, e71454. [Google Scholar] [CrossRef]
- Nichols, E.; Gómez, A. Dung beetles and fecal helminth transmission: Patterns, mechanisms, and questions. Parasitology 2014, 141, 614–623. [Google Scholar] [CrossRef]
- Verdú, J.R.; Sánchez-Piñero, F.; Lobo, J.M.; Cortez, V. Evaluating long-term ivermectin use and the role of dung beetles in reducing short-term CH4 and CO2 emissions from livestock faeces: A mesocosm design under Mediterranean conditions. Ecol. Entomol. 2019, 45, 109–120. [Google Scholar] [CrossRef]
- Stanbrook, R.; King, J.R. Dung beetle community composition affects dung turnover in subtropical US grasslands. Ecol. Evol. 2022, 12, e8660. [Google Scholar] [CrossRef]
- Jargalsaikhan, P.; Altangerel, G.; Enkhchimeg, T.; Aibek, U.; Bayartogtokh, B. Variation in dung removal rates by dung beetles (Coleoptera: Scarabaeoidea) in a temperate, dry steppe ecosystem. Diversity 2023, 15, 91. [Google Scholar] [CrossRef]
- Ma, L.; Weeraratne, N.; Gurusinghe, S.; Aktar, J.; Haque, K.M.S.; Eberbach, P.; Gurr, G.G.; Weston, L.A. Dung beetle activity is soil-type-dependent and modulates pasture growth and associated soil microbiome. Agronomy 2023, 13, 325. [Google Scholar] [CrossRef]
- de Andrade, R.B.D.; Barlow, J.; Louzada, J.; Vaz-de-Mello, F.Z.; Souza, M.; Silveira, J.M.; Cochrane, M.A. Quantifying responses of dung beetles to fire disturbance in tropical forests: The importance of trapping method and seasonality. PLoS ONE 2011, 6, e26208. [Google Scholar] [CrossRef]
- Verdú, J.R.; Lobo, J.M.; Sánchez-Piñero, F.; Gallego, B.; Numa, C.; Lumaret, J.-P.; Cortez, V.; Ortiz, A.J.; Tonelli, M.; García-Teba, J.P.; et al. Ivermectin residues disrupt dung beetle diversity, soil properties and ecosystem functioning: An interdisciplinary field study. Sci. Total Environ. 2018, 618, 219–228. [Google Scholar] [CrossRef]
- Numa, C.; Tonelli, M.; Lobo, J.M.; Verdú, J.R.; Lumaret, J.-P.; Sánchez-Piñero, F.; Ruiz, J.L.; Dellacasa, M.; Ziani, S.; Arriaga, A.; et al. The Conservation Status and Distribution of Mediterranean Dung Beetles; IUCN: Gland, Switzerland; Málaga, Spain, 2020. [Google Scholar]
- Palusci, E.; Mantoni, C.; Strona, G.; Fattorini, S. Wildfire does not affect the dung beetle diversity of high-altitude Mediterranean habitats. Int. J. Wildland Fire 2021, 30, 636–642. [Google Scholar] [CrossRef]
- Noriega, J.A.; March-Salas, M.; Castillo, S.; García-Q, H.; Hortal, J.; Santos, A.M.C. Human perturbations reduce dung beetle diversity and dung removal ecosystem function. Biotropica 2021, 53, 753–766. [Google Scholar] [CrossRef]
- Lumaret, J.-P.; Kadiri, N.; Martínez, M.I. The global decline of dung beetles. In Imperiled: The Encyclopedia of Conservation; DellaSala, D.A., Goldstein, M.I., Eds.; Elsevier: Amsterdam, The Netherlands, 2022; Volume 3, pp. 553–562. [Google Scholar]
- Stoch, F. How many endemic species? Species richness assessment and conservation priorities in Italy. Belg. J. Entomol. 2000, 2, 125–133. [Google Scholar]
- Ruffo, S.; Stoch, F. (Eds.) Checklist and Distribution of the Italian Fauna. 10,000 Terrestrial and Freshwater Species, 2 Serie, Sez. Scienze della Vita, 2nd revised ed.; Memorie del Museo Civico di Storia Naturale di Verona: Verona, Italy, 2007; Volume 17. [Google Scholar]
- Blasi, C.; Biondi, E. La flora in Italia; Ministero dell’Ambiente e della Tutela del Territorio e del Mare, Sapienza Università Editrice: Rome, Italy, 2017; pp. 1–704. [Google Scholar]
- Stinca, A.; Musarella, C.M.; Rosati, L.; Laface, V.L.A.; Licht, W.; Fanfarillo, E.; Wagensommer, R.P.; Galasso, G.; Fascetti, S.; Esposito, A.; et al. Italian vascular flora: New findings, updates and exploration of floristic similarities between regions. Diversity 2021, 13, 600. [Google Scholar] [CrossRef]
- Myers, N.; Mittermeier, R.A.; Mittermeier, C.G.; da Fonseca, G.A.B.; Kent, J. Biodiversity hotspots for conservation priorities. Nature 2000, 403, 853–858. [Google Scholar] [CrossRef]
- Médail, F.; Myers, N. Mediterranean Basin. In Hotspots Revisited: Earth’s Biologically Richest and Most Endangered Terrestrial Ecoregions; Mittermeier, R.A., Gil, P.R., Hoffman, M., Pilgrim, J., Brooks, T., Mittermeier, C.G., Lamoreux, J., Da Fonseca, G.A.B., Eds.; CEMEX: Agrupación Sierra Madre, Mexico, 2004; pp. 144–147. [Google Scholar]
- Mittermeier, R.A.; Turner, W.R.; Larsen, F.W.; Brooks, T.M.; Gascon, C. Global biodiversity conservation: The critical role of hotspots. In Biodiversity Hotspots: Distribution and Protection of Conservation Priority Areas; Zachos, F.E., Habel, J.C., Eds.; Springer: Heidelberg, Germany, 2011; pp. 2–22. [Google Scholar]
- Hewitt, G.M. Mediterranean peninsulas: The evolution of hotspots. In Biodiversity Hotspots: Distribution and Protection of Conservation Priority Areas; Zachos, F.E., Habel, J.C., Eds.; Springer: Heidelberg, Germany, 2011; pp. 123–147. [Google Scholar]
- Birdlife International. Ecosystem Profile. Basin Biodiversity Hotspot. Available online: https://www.cepf.net/sites/default/files/mediterranean-basin-2017-ecosystem-profile-english_0.pdf (accessed on 25 November 2023).
- Dennis, R.L.H.; Williams, W.R.; Shreeve, T.G. Faunal structures among European butterflies: Evolutionary implications of bias for geography, endemism and taxonomic affiliation. Ecography 1998, 21, 181–203. [Google Scholar] [CrossRef]
- Blondel, J.; Aronson, J. Biology and Wildlife of the Mediterranean Region; Oxford University Press: Oxford, UK, 1999; pp. 1–328. [Google Scholar]
- Dapporto, L.; Habel, J.C.; Dennis, R.L.H.; Schmitt, T. The biogeography of the western Mediterranean: Elucidating contradictory distribution patterns of differentiation in Maniola jurtina (Lepidoptera: Nymphalidae). Biol. J. Linn. Soc. 2011, 103, 571–577. [Google Scholar] [CrossRef]
- Fattorini, S.; Baselga, A. Species richness and turnover patterns in European tenebrionid beetles. Insect Conserv. Diver. 2012, 5, 331–345. [Google Scholar] [CrossRef]
- Fattorini, S.; Ulrich, W. Spatial distributions of European Tenebrionidae point to multiple postglacial colonization trajectories. Biol. J. Linn. Soc. 2012, 105, 318–329. [Google Scholar] [CrossRef]
- Fattorini, S.; Ulrich, W. Drivers of species richness in European Tenebrionidae (Coleoptera). Acta Oecol. 2012, 43, 22–28. [Google Scholar] [CrossRef]
- Fattorini, S. Tenebrionid beetle distributional patterns in Italy: Multiple colonisation trajectories in a biogeographical crossroad. Insect Conserv. Divers. 2014, 7, 144–160. [Google Scholar] [CrossRef]
- Dapporto, L.; Fattorini, S.; Vodă, R.; Dincă, V.; Vila, R. Biogeography of western Mediterranean butterflies: Combining turnover and nestedness components of faunal dissimilarity. J. Biogeogr. 2014, 41, 1639–1650. [Google Scholar] [CrossRef]
- Fattorini, S. Conservation biogeography of tenebrionid beetles: Insights from Italian reserves. Diversity 2020, 12, 348. [Google Scholar] [CrossRef]
- Schmitt, T.; Fritz, U.; Delfino, M.; Ulrich, W.; Habel, J.C. Biogeography of Italy revisited: Genetic lineages confirm major phylogeographic patterns and a pre-Pleistocene origin of its biota. Front. Zool. 2021, 18, 34. [Google Scholar] [CrossRef] [PubMed]
- Fattorini, S. Odonate diversity patterns in Italy disclose intricate colonization pathways. Biology 2022, 11, 886. [Google Scholar] [CrossRef]
- Fattorini, S. Biogeographical patterns of earwigs in Italy. Insects 2023, 14, 235. [Google Scholar] [CrossRef]
- Matthews, T.; Triantis, K.; Whittaker, R. (Eds.) The Species-Area Relationship: Theory and Application; Cambridge University Press: Cambridge, UK, 2020; pp. 1–481. [Google Scholar]
- Heiser, M.; Dapporto, L.; Schmitt, T. Coupling impoverishment analysis and partitioning of beta diversity allows a comprehensive description of Odonata biogeography in the Western Mediterranean. Org. Divers. Evol. 2014, 14, 203–214. [Google Scholar] [CrossRef]
- Whittaker, R.J.; Fernández-Palacios, J.M.; Matthews, T.J. Island Biogeography: Geo-Environmental Dynamics, Ecology, Evolution, Human Impact, and Conservation; Oxford University Press: Oxford, UK, 2023; pp. 1–476. [Google Scholar]
- Battisti, C. ‘Peninsula effect’ and Italian peninsula: Matherials for a review and implications in applied biogeography. Biogeographia 2006, 27, 153–188. [Google Scholar] [CrossRef]
- Battisti, C. Peninsular patterns in biological diversity: Historical arrangement, methodological approaches and causal processes. J. Nat. Hist. 2014, 48, 43–44. [Google Scholar] [CrossRef]
- Pianka, E.R. Latitudinal gradients in species diversity: A review of concepts. Am. Nat. 1966, 100, 33–46. [Google Scholar] [CrossRef]
- Fattorini, S. Global patterns of earwig species richness. Diversity 2022, 14, 890. [Google Scholar] [CrossRef]
- Rohde, K. Latitudinal gradients in species diversity: The search for the primary cause. Oikos 1992, 65, 514–527. [Google Scholar] [CrossRef]
- Willig, M.R.; Kaufman, D.M.; Stevens, R.D. Latitudinal gradients of biodiversity: Pattern, process, scale, and synthesis. Annu. Rev. Ecol. Evol. Syst. 2003, 34, 273–309. [Google Scholar] [CrossRef]
- Ashton, K.G. Are ecological and evolutionary rules being dismissed prematurely? Divers. Distrib. 2001, 7, 289–295. [Google Scholar] [CrossRef]
- Hillebrand, H. On the generality of the latitudinal diversity gradient. Am. Nat. 2004, 163, 192–211. [Google Scholar] [CrossRef]
- Cancello, E.M.; Silva, R.R.; Vasconcellos, A.; Reis, Y.T.; Oliveira, L.M. Latitudinal variation in termite species richness and abundance along the Brazilian Atlantic forest hotspot. Biotropica 2014, 46, 441–450. [Google Scholar] [CrossRef]
- Lomolino, M.V.; Riddle, B.R.; Whittaker, R.J.; Brown, J.H. Biogeography, 4th ed.; Sinauer Associates: Sunderland, MA, USA, 2010. [Google Scholar]
- Schemske, D.W.; Mittelbach, G.G. “Latitudinal gradients in species diversity”: Reflections on Pianka’s 1966 article and a look forward. Am. Nat. 2017, 189, 599–603. [Google Scholar] [CrossRef]
- Kinlock, N.L.; Prowant, L.; Herstoff, E.M.; Foley, C.M.; Akin-Fajiye, M.; Bender, N.; Umarani, M.; Ryu, H.Y.; Sen, H.Y.; Gurevitch, J.; et al. Explaining global variation in the latitudinal diversity gradient: Meta-analysis confirms known patterns and uncovers new ones. Glob. Ecol. Biogeogr. 2018, 27, 125–141. [Google Scholar] [CrossRef]
- Beaugrand, G.; Kirby, R.; Goberville, E. The mathematical influence on global patterns of biodiversity. Ecol. Evol. 2020, 10, 6494–6511. [Google Scholar] [CrossRef] [PubMed]
- Cushman, J.; Lawton, J.; Manly, B. Latitudinal patterns in European ant assemblages: Variation in species richness and body size. Oecologia 1993, 95, 30–37. [Google Scholar] [CrossRef]
- Baselga, A. Determinants of species richness, endemism and turnover in European longhorn beetles. Ecography 2008, 31, 263–271. [Google Scholar] [CrossRef]
- Schuldt, A.; Assmann, T. Environmental and historical effects on richness and endemism patterns of carabid beetles in the western Palaearctic. Ecography 2009, 32, 705–714. [Google Scholar] [CrossRef]
- Ulrich, W.; Fiera, C. Environmental correlates of species richness of European springtails (Hexapoda: Collembola). Acta Oecol. 2009, 35, 45–52. [Google Scholar] [CrossRef]
- Bąkowski, M.; Ulrich, W.; Laštůvka, Z. Environmental correlates of species richness of Sesiidae (Lepidoptera) in Europe. Eur. J. Entomol. 2010, 107, 563–570. [Google Scholar] [CrossRef]
- Finn, J.A.; Gittings, T. A review of competition in north temperate dung beetle communities. Ecol. Entomol. 2003, 28, 1–13. [Google Scholar] [CrossRef]
- Carpaneto, G.M.; Piattella, E. Competizione interspecifica e andamento stagionale di una comunità coprofaga in un’area verde urbana di Roma (Coleoptera, Scarabaeoidea). Boll. Ass. Romana Entomol. 1990, 44, 67–79. [Google Scholar]
- Mantoni, C.; Tsafack, N.; Palusci, E.; Di Pietro, S.; Fattorini, S. Diversity patterns of dung beetles along a Mediterranean elevational gradient. Insects 2021, 12, 781. [Google Scholar] [CrossRef]
- Martín-Piera, F.; Veiga, C.M.; Lobo, J.M. Ecology and biogeography of dung-beetle communities (Coleoptera, Scarabaeoidea) in an Iberian mountain range. J. Biogeogr. 1992, 19, 677–691. [Google Scholar] [CrossRef]
- Lumaret, J.P.; Stiernet, N. Montane dung beetles. In Dung Beetle Ecology; Hanski, I., Cambefort, Y., Eds.; Princeton University Press: Princeton, NJ, USA, 1991; pp. 242–254. [Google Scholar]
- Lumaret, J.P.; Stiernet, N. Biogeography of dung beetle communities in the western and central Alps (Coleoptera, Scarabaeoidea). Biogeographia 1992, 16, 425–436. [Google Scholar]
- Jay-Robert, P.; Lobo, J.M.; Lumaret, J.P. Altitudinal turnover and species richness variation in European montane dung beetle assemblages. Arct. Antarct. Alp. Res. 1997, 29, 196–205. [Google Scholar] [CrossRef]
- Avila, J.M.; Pascual, F. Contribución al conocimiento de los escarabeidos coprófagos (Coleoptera, Scarabaeoidea) de Sierra Nevada: III. Distribución altitudinal y temporal. Boll. Mus. Reg. Sci. Nat. Torino 1988, 6, 217–240. [Google Scholar]
- Lobo, J.M.; Halffter, G. Biogeographical and ecological factors affecting the altitudinal variation of mountainous communities of coprophagous beetles (Coleoptera: Scarabaeoidea): A comparative study. Ann. Entomol. Soc. Am. 2000, 93, 115–126. [Google Scholar] [CrossRef]
- Errouissi, F.; Jay-Robert, P.; Lumaret, J.P.; Piau, O. Composition and structure of dung beetle (Coleoptera: Aphodiidae, Geotrupidae, Scarabaeidae) assemblages in mountain grasslands of the Southern Alps. Ann. Entomol. Soc. Am. 2004, 97, 701–709. [Google Scholar] [CrossRef]
- Escobar, F.; Halffter, G.; Arellano, L. From forest to pasture: An evaluation of the influence of environment and biogeography on the structure of beetle (Scarabaeinae) assemblages along three altitudinal gradients in the Neotropical region. Ecography 2007, 30, 193–208. [Google Scholar] [CrossRef]
- Herzog, S.K.; Hamel-Leigue, A.C.; Larsen, T.H.; Mann, D.J.; Soria-Auza, R.W.; Gill, B.D.; Edmonds, W.D.; Spector, S. Elevational distribution and conservation biogeography of Phanaeine dung beetles (Coleoptera: Scarabaeinae) in Bolivia. PLoS ONE 2013, 8, e64963. [Google Scholar] [CrossRef]
- Nunes, C.A.; Braga, R.F.; Figueira, J.E.C.; Neves, F.D.S.; Fernandes, G.W. Dung beetles along a tropical altitudinal gradient: Environmental filtering on taxonomic and functional diversity. PLoS ONE 2016, 11, e0157442. [Google Scholar] [CrossRef]
- Şenyüz, Y.; Lobo, J.M.; Dindar, K. Altitudinal gradient in species richness and composition of dung beetles (Coleoptera: Scarabaeidae) in an eastern Euro-Mediterranean locality: Functional, seasonal and habitat influences. Eur. J. Entomol. 2019, 116, 309–319. [Google Scholar] [CrossRef]
- Stanbrook, R.; Wheater, C.P.; Harris, W.E.; Jones, M. Habitat type and altitude work in tandem to drive the community structure of dung beetles in Afromontane forest. J. Insect Conserv. 2021, 25, 159–173. [Google Scholar] [CrossRef]
- Lobo, J.M.; Guéorguiev, B.; Chehlarov, E. Convergences and divergences between two European mountain dung beetle assemblages (Coleoptera, Scarabaeoidea). Anim. Biodivers. Conserv. 2007, 30.1, 83–96. [Google Scholar] [CrossRef]
- Romero-Alcaraz, E.; Ávila, J.M. Effect of elevation and type of habitat on the abundance and diversity of Scarabaeoid dung beetle (Scarabaeoidea) assemblages in a Mediterranean area from Southern Iberian Peninsula. Zool. Stud. 2000, 39, 351–359. [Google Scholar]
- Keddy, P.; Laughlin, D. A Framework for Community Ecology: Species Pools, Filters and Traits; Cambridge University Press: Cambridge, UK, 2021. [Google Scholar]
- Hubbell, S.P. The Unified Theory of Biogeography and Biodiversity; Princeton University Press: Princeton, NJ, USA, 2001. [Google Scholar]
- Forum Entomologi Italiani. Available online: http://www.entomologiitaliani.net/public/forum/phpBB3/index.php (accessed on 30 November 2023).
- Pinkert, S.; Barve, V.; Guralnick, R.; Jetz, W. Global geographical and latitudinal variation in butterfly species richness captured through a comprehensive country-level occurrence database. Glob. Ecol. Biogeogr. 2022, 31, 830–839. [Google Scholar] [CrossRef]
- Hortal, J. Uncertainty and the measurement of terrestrial biodiversity gradients. J. Biogeogr. 2008, 35, 1202–1214. [Google Scholar] [CrossRef]
- Heino, J.; Alahuhta, J.; Fattorini, S.; Schmera, D. Predicting beta diversity of terrestrial and aquatic beetles using ecogeographical variables: Insights from the replacement and richness difference components. J. Biogeogr. 2019, 46, 304–315. [Google Scholar] [CrossRef]
- Konvicka, M.; Fric, Z.; Benes, J. Butterfly extinctions in European states: Do socioeconomic conditions matter more than physical geography? Glob. Ecol. Biogeogr. 2006, 15, 82–92. [Google Scholar] [CrossRef]
- Dapporto, L.; Dennis, R.L.H. Conservation biogeography of large Mediterranean islands. Butterfly impoverishment, conservation priorities and inferences for an ecological island paradigm. Ecography 2009, 32, 169–179. [Google Scholar] [CrossRef]
- Dennis, R.L.H.; Williams, W.R.; Shreeve, T.G. A multivariate approach to the determination of faunal units among European butterfly species (Lepidoptera: Rhopalocera). Zool. J. Linn. Soc. 1991, 101, 1–49. [Google Scholar] [CrossRef]
- Keil, P.; Hawkins, B.A. Grids versus regional species lists: Are broad-scale patterns of species richness robust to the violation of constant grain size? Biodiv. Conserv. 2009, 18, 3127–3137. [Google Scholar] [CrossRef]
- ISTAT—Istituto Nazionale di Statistica. Available online: https://www.istat.it/it/archivio/222527 (accessed on 3 October 2023).
- Worldclim—Maps, Graphs, Tables, and Data of the Global Climate. Available online: https://www.worldclim.org/data/worldclim21.html (accessed on 3 October 2023).
- ESRI. ArcGis Desktop: Version 10.4; Environmental Systems Research Institute (ESRI): Redlands, CA, USA, 2016. [Google Scholar]
- Tarquini, S.; Isola, I.; Favalli, M.; Battistini, A.; Dotta, G. TINITALY, a Digital Elevation Model of Italy with a 10 Meters Cell Size, Version 1.1. Istituto Nazionale di Geofisica e Vulcanologia (INGV). 2023. Available online: https://tinitaly.pi.ingv.it/ (accessed on 3 October 2023).
- Triantis, K.A.; Guilhaumon, F.; Whittaker, R.J. The island species–area relationship: Biology and statistics. J. Biogeogr. 2012, 39, 215–231. [Google Scholar] [CrossRef]
- Matthews, T.J.; Guilhaumon, F.; Triantis, K.A.; Borregaard, M.K.; Whittaker, R.J. On the form of species–area relationships in habitat islands and true islands. Glob. Ecol. Biogeogr. 2016, 25, 847–858. [Google Scholar] [CrossRef]
- Fattorini, S.; Borges, P.V.A.; Dapporto, L.; Strona, G. What can the parameters of the species–area relationship (SAR) tell us? Insights from Mediterranean islands. J. Biogeogr. 2017, 44, 1018–1028. [Google Scholar] [CrossRef]
- Sturba, L.; Fattorini, N.; Liberatori, G.; Vannuccini, M.L.; Nannoni, F.; Protano, G.; Tursi, A.; Corsi, I. Multi-model inference analysis of toxicological responses and levels of heavy metals in soft tissue of land snail Cornu aspersum caged in proximity to an industrial setting. Ecol. Indic. 2020, 117, 106688. [Google Scholar] [CrossRef]
- Koleff, P.; Gaston, K.J.; Lennon, J.J. Measuring beta diversity for presence–absence data. J. Anim. Ecol. 2003, 72, 367–382. [Google Scholar] [CrossRef]
- Baselga, A. Partitioning the turnover and nestedness components of beta diversity. Glob. Ecol. Biogeogr. 2010, 19, 134–143. [Google Scholar] [CrossRef]
- Kreft, H.; Jetz, W. A framework for delineating biogeographical regions based on species distributions. J. Biogeogr. 2010, 37, 2029–2053. [Google Scholar] [CrossRef]
- Baselga, A. The relationship between species replacement, dissimilarity derived from nestedness, and nestedness. Glob. Ecol. Biogeogr. 2012, 21, 1223–1232. [Google Scholar] [CrossRef]
- Baselga, A.; Leprieur, F. Comparing methods to separate components of beta diversity. Methods Ecol. Evol. 2015, 6, 1069–1079. [Google Scholar] [CrossRef]
- Castro-Insua, A.; Gómez-Rodríguez, C.; Baselga, A. Dissimilarity measures affected by richness differences yield biased delimitations of biogeographic realms. Nat. Commun. 2018, 9, 5084. [Google Scholar] [CrossRef]
- Sánchez-González, L.A.; Morrone, J.J.; Navarro-Sigüenza, A.G. Distributional patterns of the Neotropical humid montane forest avifaunas. Biol. J. Linn. Soc. 2008, 94, 175–194. [Google Scholar] [CrossRef]
- Fattorini, S. Biogeography of the tenebrionid beetles (Coleoptera, Tenebrionidae) on the Aegean Islands (Greece). J. Biogeogr. 2002, 29, 49–67. [Google Scholar] [CrossRef]
- Graham, C.H.; Smith, T.B.; Languy, M. Current and historical factors influencing patterns of species richness and turnover of birds in the Gulf of Guinea highlands. J. Biogeogr. 2005, 32, 1371–1384. [Google Scholar] [CrossRef]
- Guerrero, J.C.; Vargas, J.; Real, R. A hypothetico-deductive analysis of the environmental factors involved in the current reptile distribution pattern in the Canary Islands. J. Biogeogr. 2005, 32, 1343–1351. [Google Scholar] [CrossRef]
- Smith, S.A.; Bermingham, E. The biogeography of lower Mesoamerican freshwater fishes. J. Biogeogr. 2005, 32, 1835–1854. [Google Scholar] [CrossRef]
- Holt, B.; Lessard, J.P.; Borregaard, M.K.; Fritz, S.A.; Araujo, M.B.; Dimitrov, D.; Fabre, P.H.; Graham, C.H.; Graves, G.R.; Jonsson, K.A.; et al. An update of Wallace’s zoogeographic regions of the world. Science 2013, 339, 74–78. [Google Scholar] [CrossRef] [PubMed]
- Costello, M.J.; Tsai, P.; Wong, P.S.; Cheung, A.K.L.; Basher, Z.; Chaudhary, C. Marine biogeographic realms and species endemicity. Nat. Commun. 2017, 8, 1057. [Google Scholar] [CrossRef] [PubMed]
- Fattorini, S. Historical biogeography of earwigs. Biology 2022, 11, 1794. [Google Scholar] [CrossRef] [PubMed]
- Podani, J. On the sensitivity of ordination and classification methods to variation in the input order of data. J. Veg. Sci. 1997, 8, 153–156. [Google Scholar] [CrossRef]
- Dapporto, L.; Ramazzotti, M.; Fattorini, S.; Talavera, G.; Vila, R.; Dennis, R.L.H. Recluster: An unbiased clustering procedure for beta-diversity turnover. Ecography 2013, 36, 1070–1075. [Google Scholar] [CrossRef]
- Fattorini, S. Influence of recent geography and paleogeography on the structure of reptile communities in a land-bridge archipelago. J. Herpetol. 2010, 44, 242–252. [Google Scholar] [CrossRef]
- Moulpied, M.; Smith, C.H.; Robertson, C.R.; Johnson, N.A.; Lopez, R.; Randklev, C.R. Biogeography of freshwater mussels (Bivalvia: Unionida) in Texas and implications on conservation biology. Divers. Distrib. 2022, 28, 1458–1474. [Google Scholar] [CrossRef]
- R Core Team. R: A Language and Environment for Statistical Computing; R Foundation for Statistical Computing: Vienna, Austria, 2022; Available online: http://www.r-project.org/ (accessed on 15 March 2022).
- Bartoń, K. MuMIn: Multi-Model Inference. Available online: https://CRAN.R-project.org/package=MuMIn (accessed on 15 March 2022).
- Oksanen, J.; Simpson, G.L.; Blanchet, F.G.; Kindt, R.; Legendre, P.; Minchin, P.R.; O’Hara, R.B.; Solymos, P.; Stevens, M.H.H.; Szoecs, E. Vegan: Community Ecology Package. Available online: https://CRAN.R-project.org/package=vegan (accessed on 20 April 2022).
- Dapporto, L.; Ramazzotti, M.; Fattorini, S.; Vila, R.; Talavera, G.; Dennis, R.L.H. recluster: Ordination Methods for the Analysis of Beta-Diversity Indices. Available online: https://CRAN.R-project.org/package=recluster (accessed on 15 March 2022).
- Lomolino, M.V. Ecology’s most general, yet protean 1 pattern: The species-area relationship. J. Biogeogr. 2000, 27, 17–26. [Google Scholar] [CrossRef]
- Lobo, J.M.; Fermín, M.-P. Between-group differences in the Iberian dung beetle species–area relationship (Coleoptera: Scarabaeidae). Acta Oecologica 1999, 20, 587–597. [Google Scholar] [CrossRef]
- Connor, E.F.; Mccoy, E.D. The statistics and biology of the species-area relationship. Am. Nat. 1979, 113, 791–833. [Google Scholar] [CrossRef]
- Fattorini, S. Beetle species–area relationships and extinction rates in protected areas. Insects 2020, 11, 646. [Google Scholar] [CrossRef] [PubMed]
- Noriega, J.A.; Realpe, E. Altitudinal turnover of species in a Neotropical peripheral mountain system: A case study with dung beetles (Coleoptera: Aphodiinae and Scarabaeinae). Environ. Entomol. 2018, 47, 1376–1387. [Google Scholar] [CrossRef] [PubMed]
- Espinoza, V.R.; Noriega, J.A. Diversity of the dung beetles (Coleoptera: Scarabaeinae) in an altitudinal gradient in the east slope of los Andes, Napo province, Ecuador. Neotrop. Biodivers. 2018, 4, 145–151. [Google Scholar] [CrossRef]
- Lobo, J.M.; Lumaret, J.-P.; Jay-Robert, P. Modelling the species richness distribution of French dung beetles (Coleoptera, Scarabaeidae) and delimiting the predictive capacity of different groups of explanatory variables. Glob. Ecol. Biogeogr. 2002, 11, 265–277. [Google Scholar] [CrossRef]
- Lobo, J.M.; Lumaret, J.R.P. Modelling the species richness distribution for French Aphodiidae (Coleoptera, Scarabaeoidea). Ecography 2010, 27, 145–156. [Google Scholar] [CrossRef]
- Fattorini, S.; Di Biase, L.; Chiarucci, A. Recognizing and interpreting vegetational belts: New wine in the old bottles of a von Humboldt’s legacy. J. Biogeogr. 2019, 46, 1643–1651. [Google Scholar] [CrossRef]
- Di Biase, L.; Fattorini, S.; Cutini, M.; Bricca, A. The role of inter- and intraspecific variations in grassland plant functional traits along an elevational gradient in a Mediterranean mountain area. Plants 2021, 10, 359. [Google Scholar] [CrossRef] [PubMed]
- Di Biase, L.; Pace, L.; Mantoni, C.; Fattorini, S. Variations in plant richness, biogeographical composition, and life forms along an elevational gradient in a Mediterranean mountain. Plants 2021, 10, 2090. [Google Scholar] [CrossRef] [PubMed]
- Tonelli, M.; Dellacasa, M.; Lobo, J.M. Ancient human colonization explains dung beetle species richness in the Mediterranean and Macaronesian islands. J. Biogeogr. 2023, 50, 2095–2108. [Google Scholar] [CrossRef]
- Baroni Urbani, C.; Ruffo, S.; Vigna Taglianti, A. Materiali per una biogeogeografia italiana fondata su alcuni generi di Coleotteri Cicindelidi, Carabidi e Crisomelidi. Mem. Soc. Entomol. Ital. 1978, 56, 35–92. [Google Scholar]
- Balletto, E.; Cassulo, L.A.; Toso, G.G. Contributo alla biogeografia degli Zigenidi delle Alpi Liguri (Lepidoptera: Zygaenidae). Biogeographia 1984, 9, 489–565. [Google Scholar] [CrossRef]
- Fratianni, S.; Acquaotta, F. The climate of Italy. In Landscapes and Landforms of Italy; Soldati, M., Marchetti, M., Eds.; Springer: Cham, Switzerland, 2017; pp. 29–38. [Google Scholar]
Figure 1.
Study area (with regions identified by numbers as follows: 1: Piedmont, 2: Aosta Valley, 3: Lombardy, 4: Trentino-Alto Adige, 5: Veneto, 6: Friuli-Venezia Giulia, 7: Liguria, 8: Emilia-Romagna, 9: Tuscany, 10: Umbria, 11: Marche, 12: Latium, 13: Abruzzo, 14: Molise, 15: Campania, 16: Apulia, 17: Basilicata, 18: Calabria, 19: Sicily, 20: Sardinia) (A) and total number of species of dung beetles (B), number of species of aphodiines (C), and number of species of scarabaeines (D) in each region. The inset in panel (A) shows the location of Italy within the Mediterranean basin.
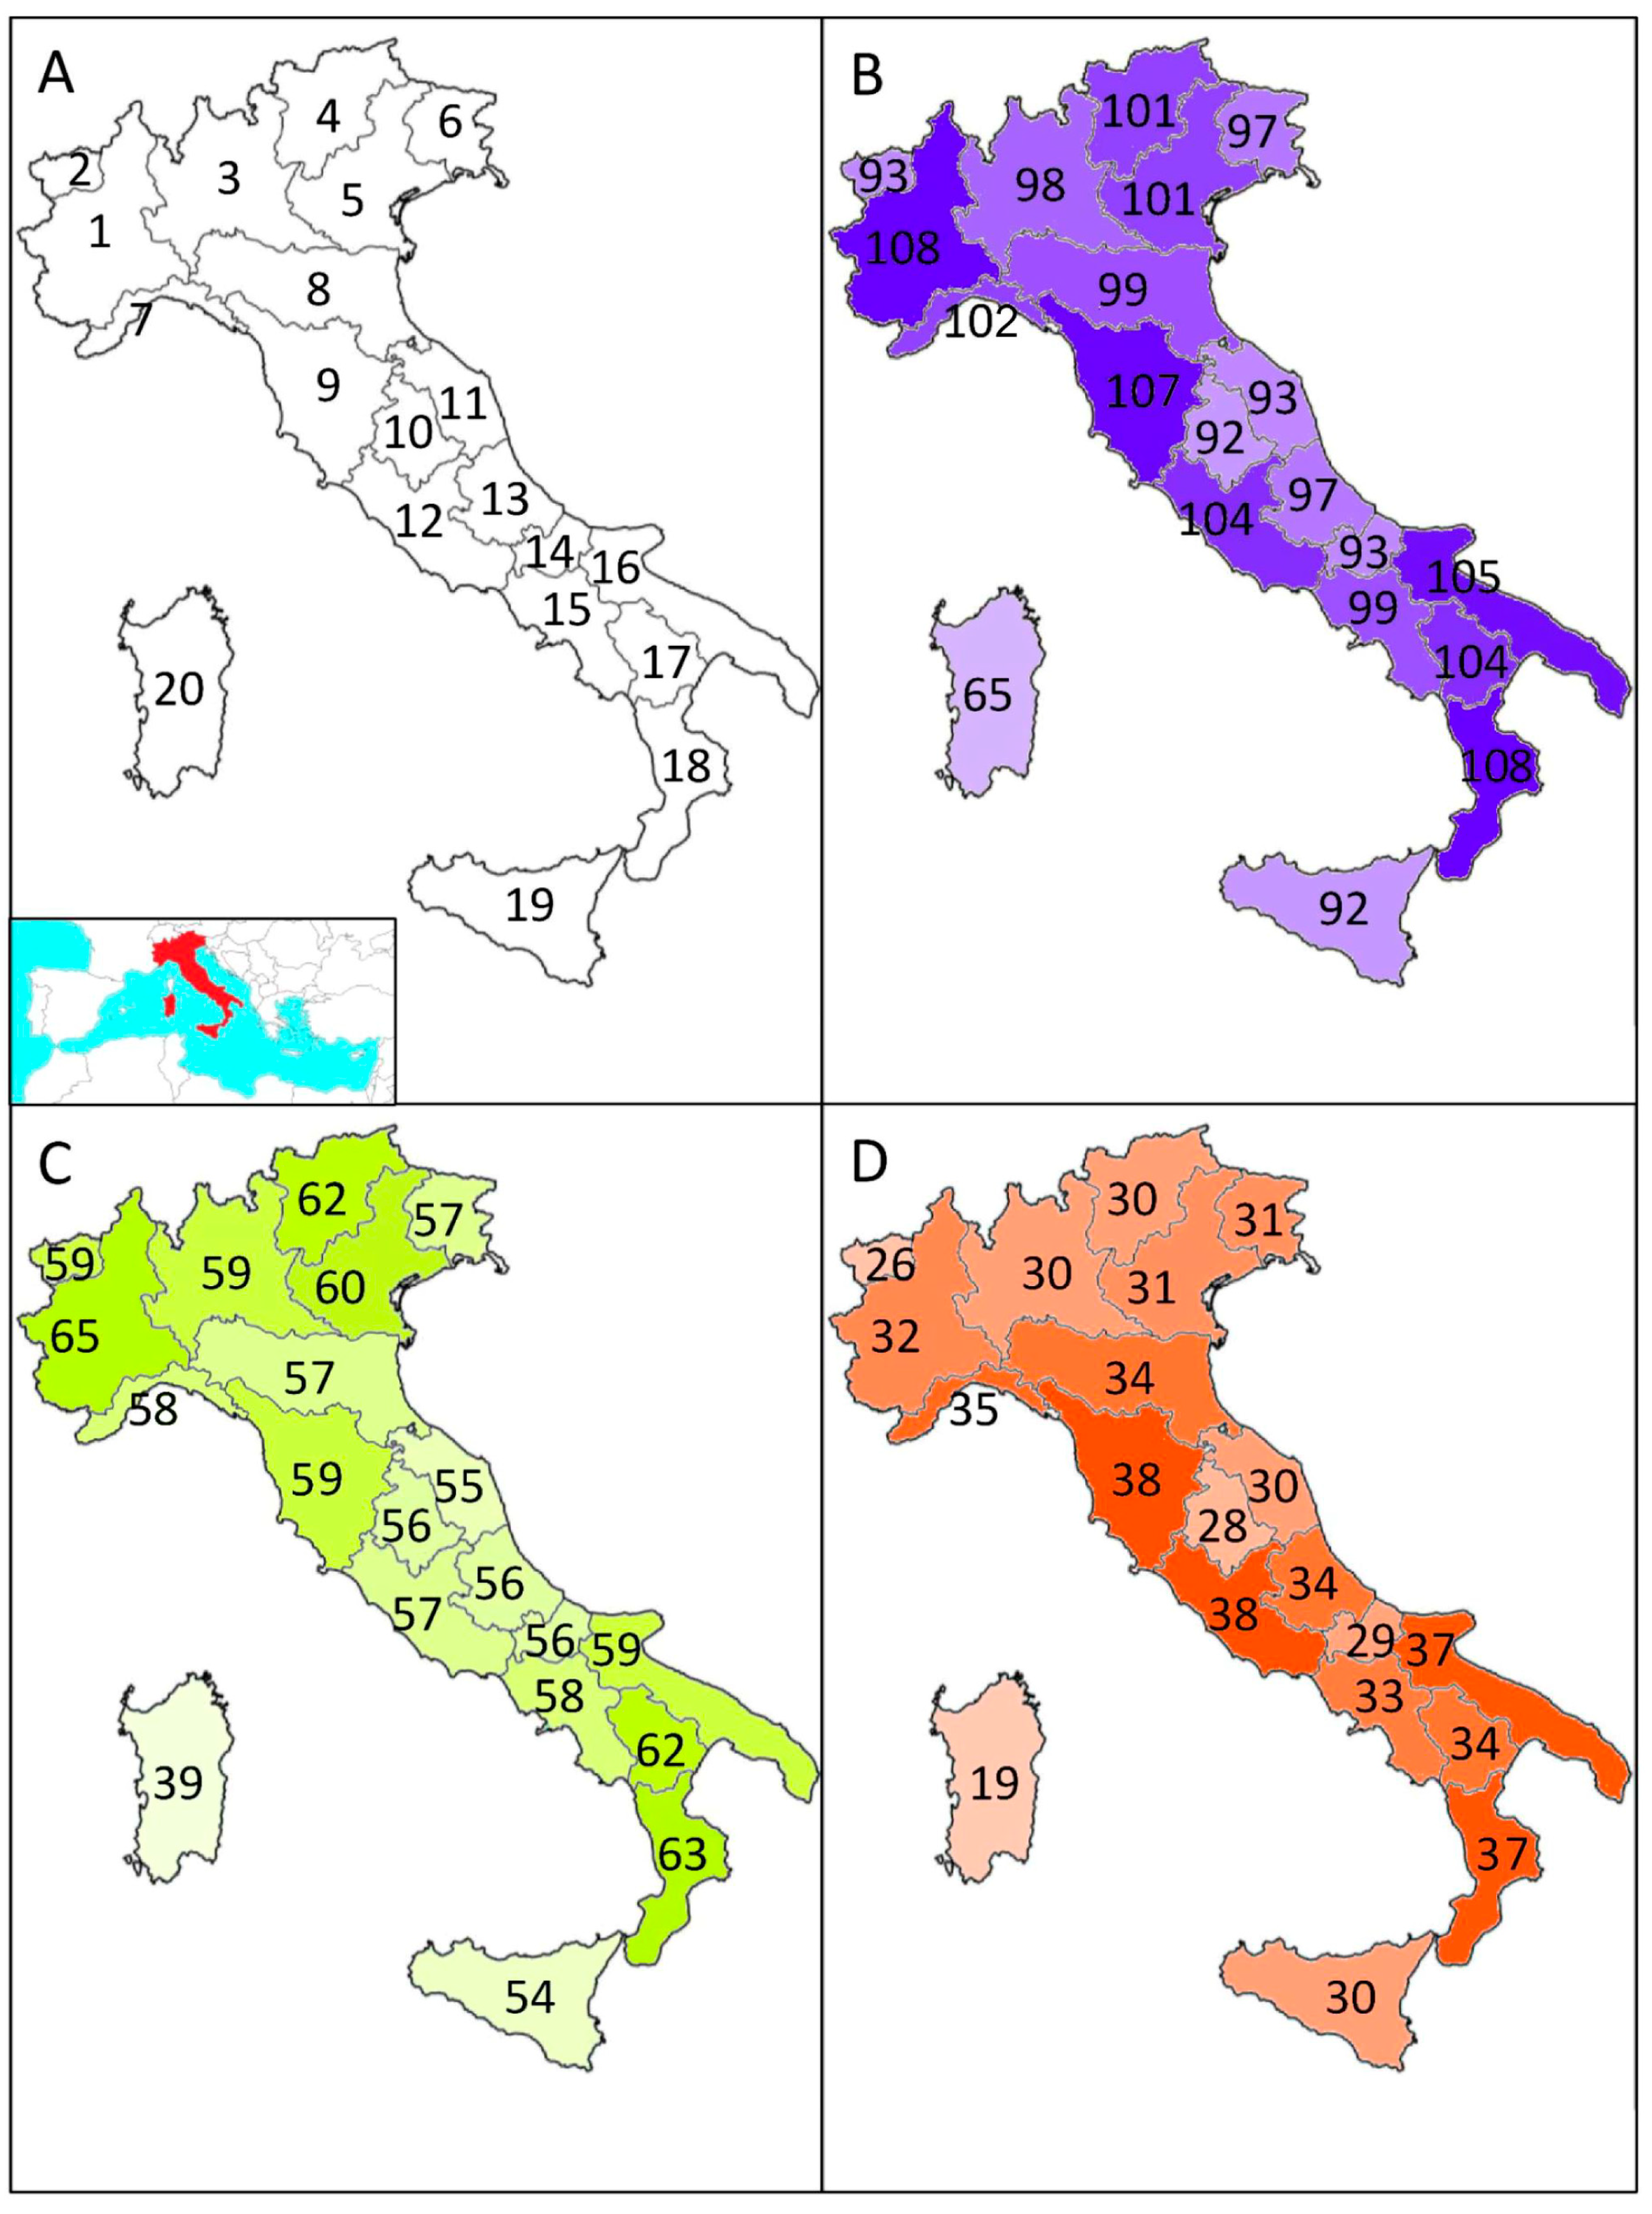
Figure 2.
Relationships (OLS regressions) between dung beetle species richness (S) and area of Italian regions for the total fauna (A,D), and for the aphodiines (B,E) and the scarabaeines (C,F), separately. Panels (A–C) show results obtained including the islands of Sicily (Si) and Sardinia (Sa); panels (D–F) show results obtained excluding islands. Areas are measured as 103 km. Both species richness and area were ln-transformed.

Figure 3.
Relationships (OLS regressions) between dung beetle richness and latitude (centroid) of Italian regions: (A) total dung beetle richness; (B) aphodiine richness; (C) scarabaeine richness. Richness values are, in all cases, the residuals from the respective species–area relationships.
Figure 3.
Relationships (OLS regressions) between dung beetle richness and latitude (centroid) of Italian regions: (A) total dung beetle richness; (B) aphodiine richness; (C) scarabaeine richness. Richness values are, in all cases, the residuals from the respective species–area relationships.

Figure 4.
Results of cluster analyses (consensus trees) for total dung beetle species composition (A,B), aphodiines (C,D), and scarabaeines (E,F), using Dice–Sørensen (A,C,E) and Simpson (B,D,F) indices of similarity, for the Italian regions. Highly (black) and weakly (red) supported nodes are identified using multiscale bootstrap method (most nodes have a strength of 100, thus indicating unambiguous relationships; see Figure S1). AL: Alpine regions, NA: north Apennine regions, CA: central Apennine regions, SA: southern Apennine regions, NP: regions north of the Po River, SP: regions south of the Po River.
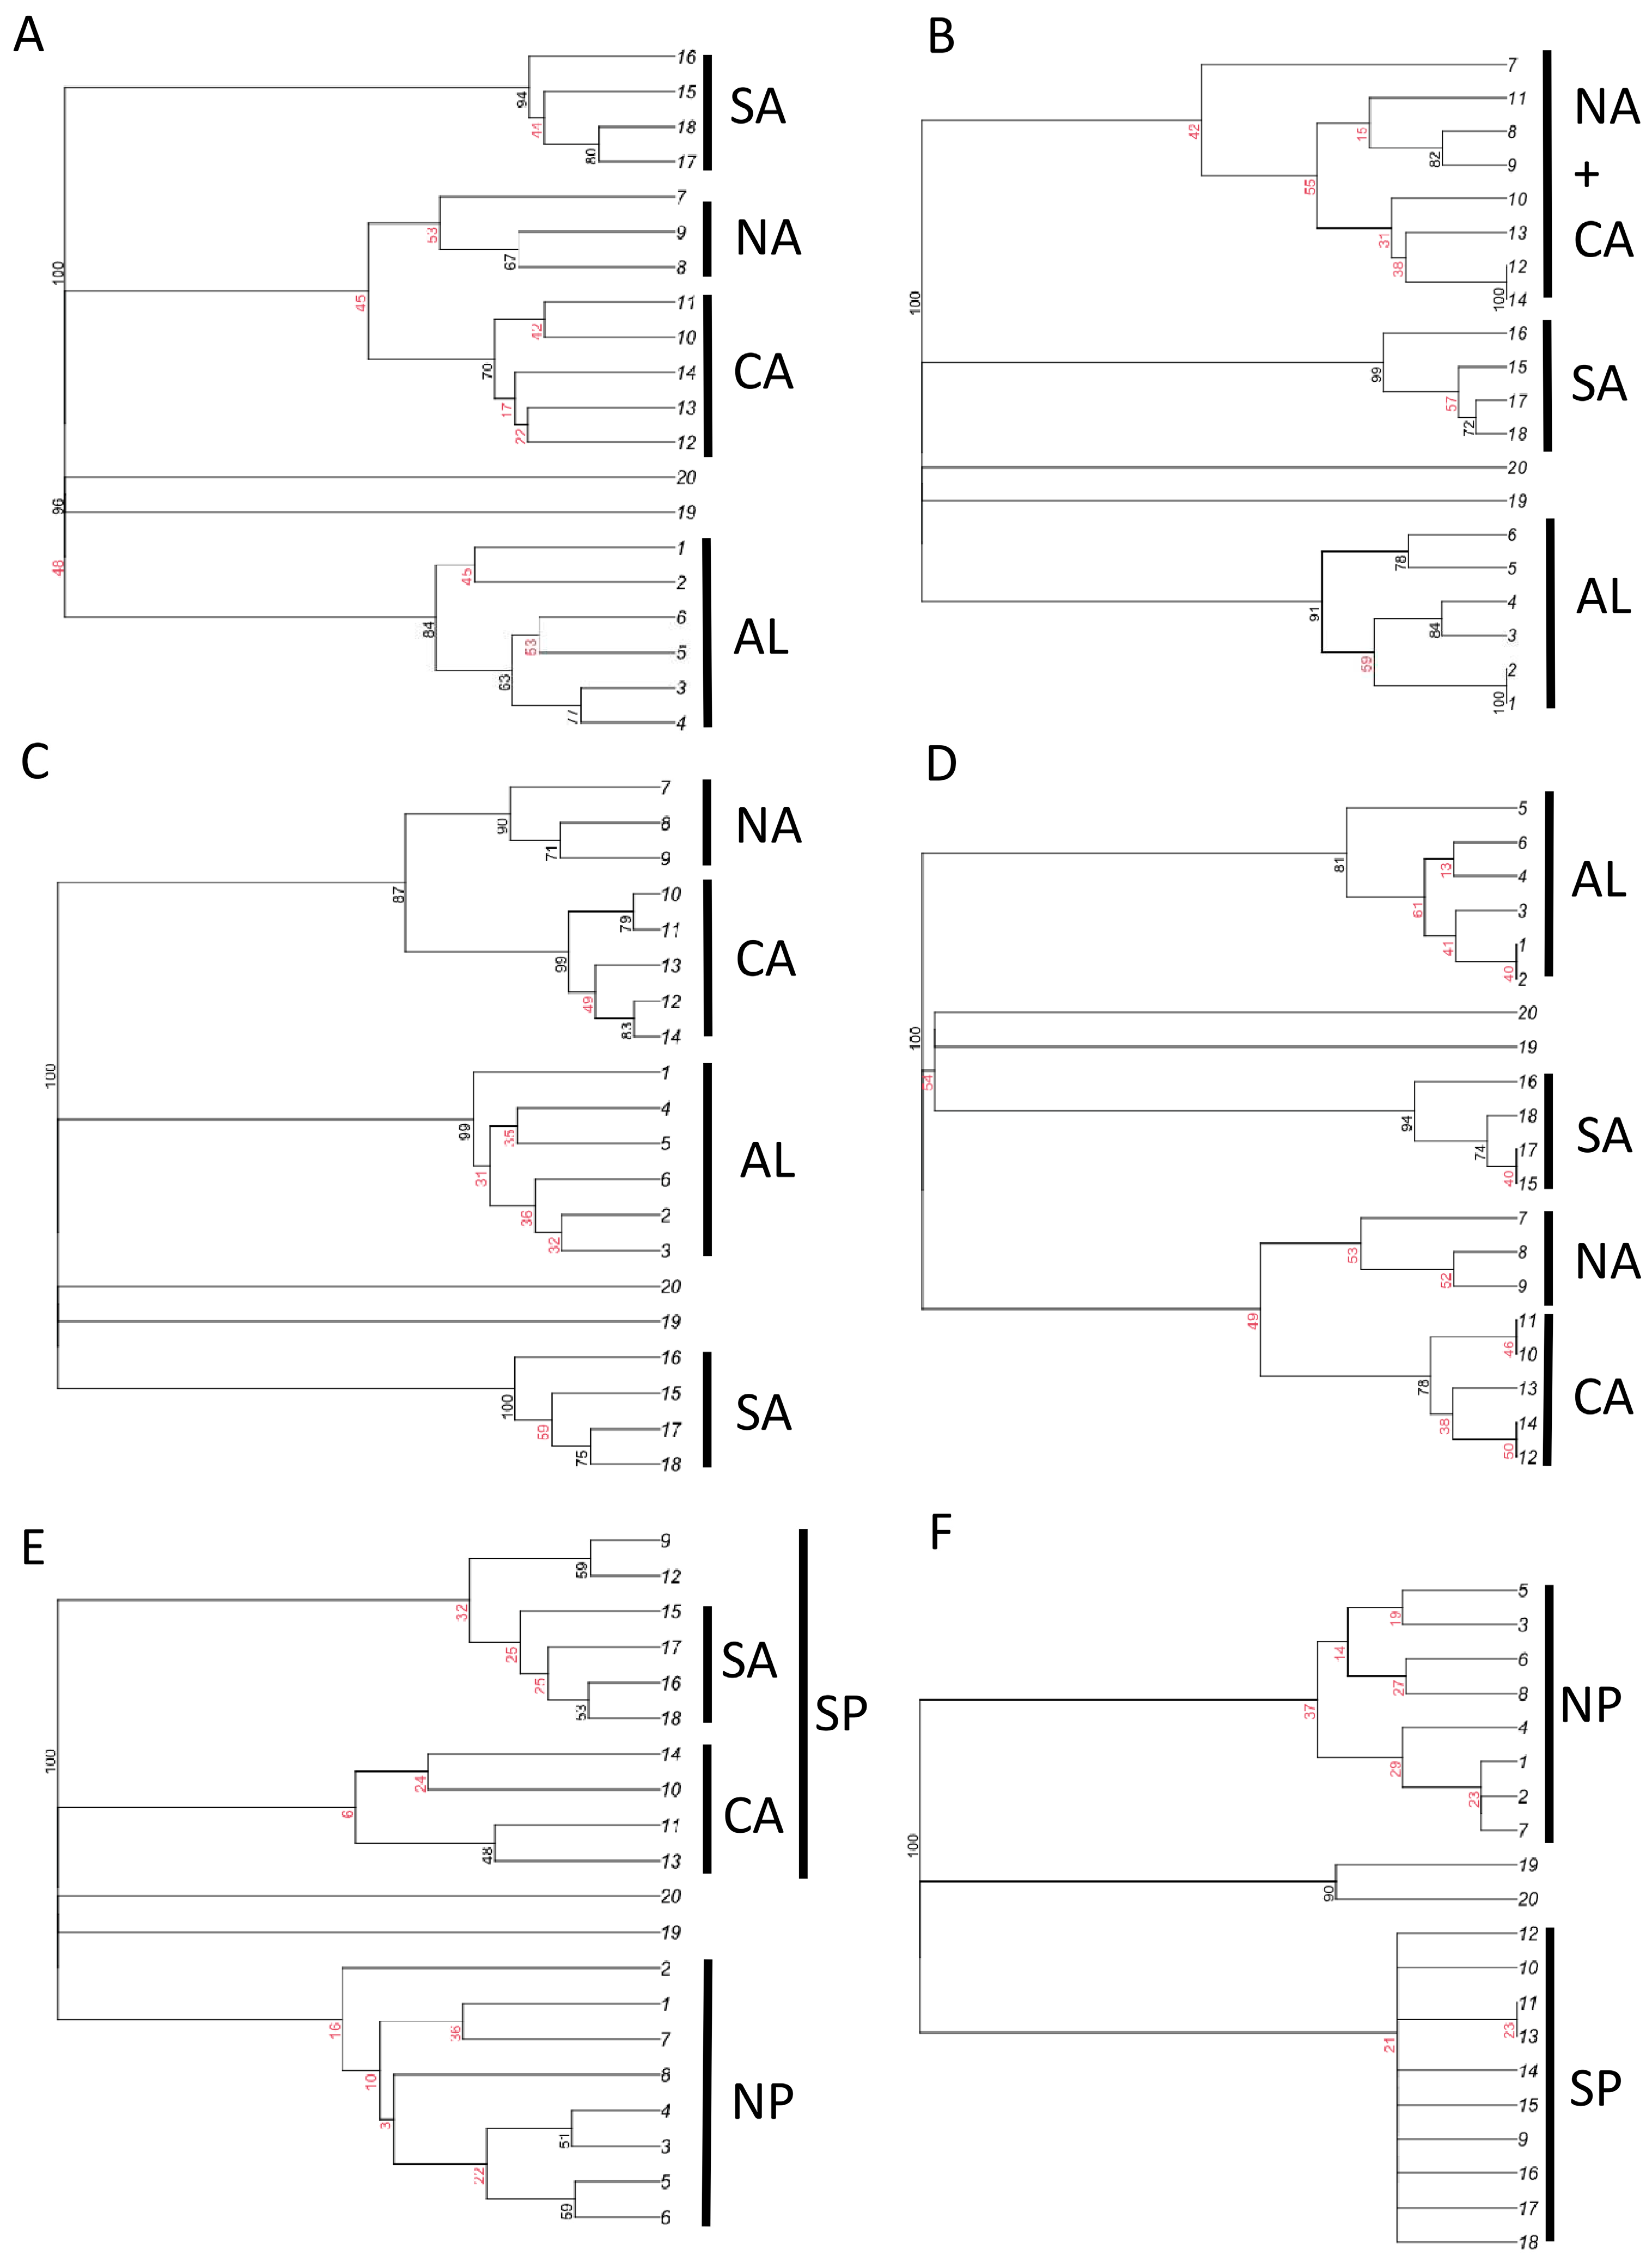
Figure 5.
Results of non-metric multidimensional scaling for total dung beetle species composition (A,B), aphodiines (C,D), and scarabaeines (E,F), using Dice–Sørensen (A,C,E) and Simpson (B,D,F) indices of similarity, for the Italian regions. Stress values are as follows: (A) 0.043, (B) 0.078, (C) 0.028, (D) 0.049, (E) 0.083, and (F) 0.138. Regions are numbered as in Figure 1A.
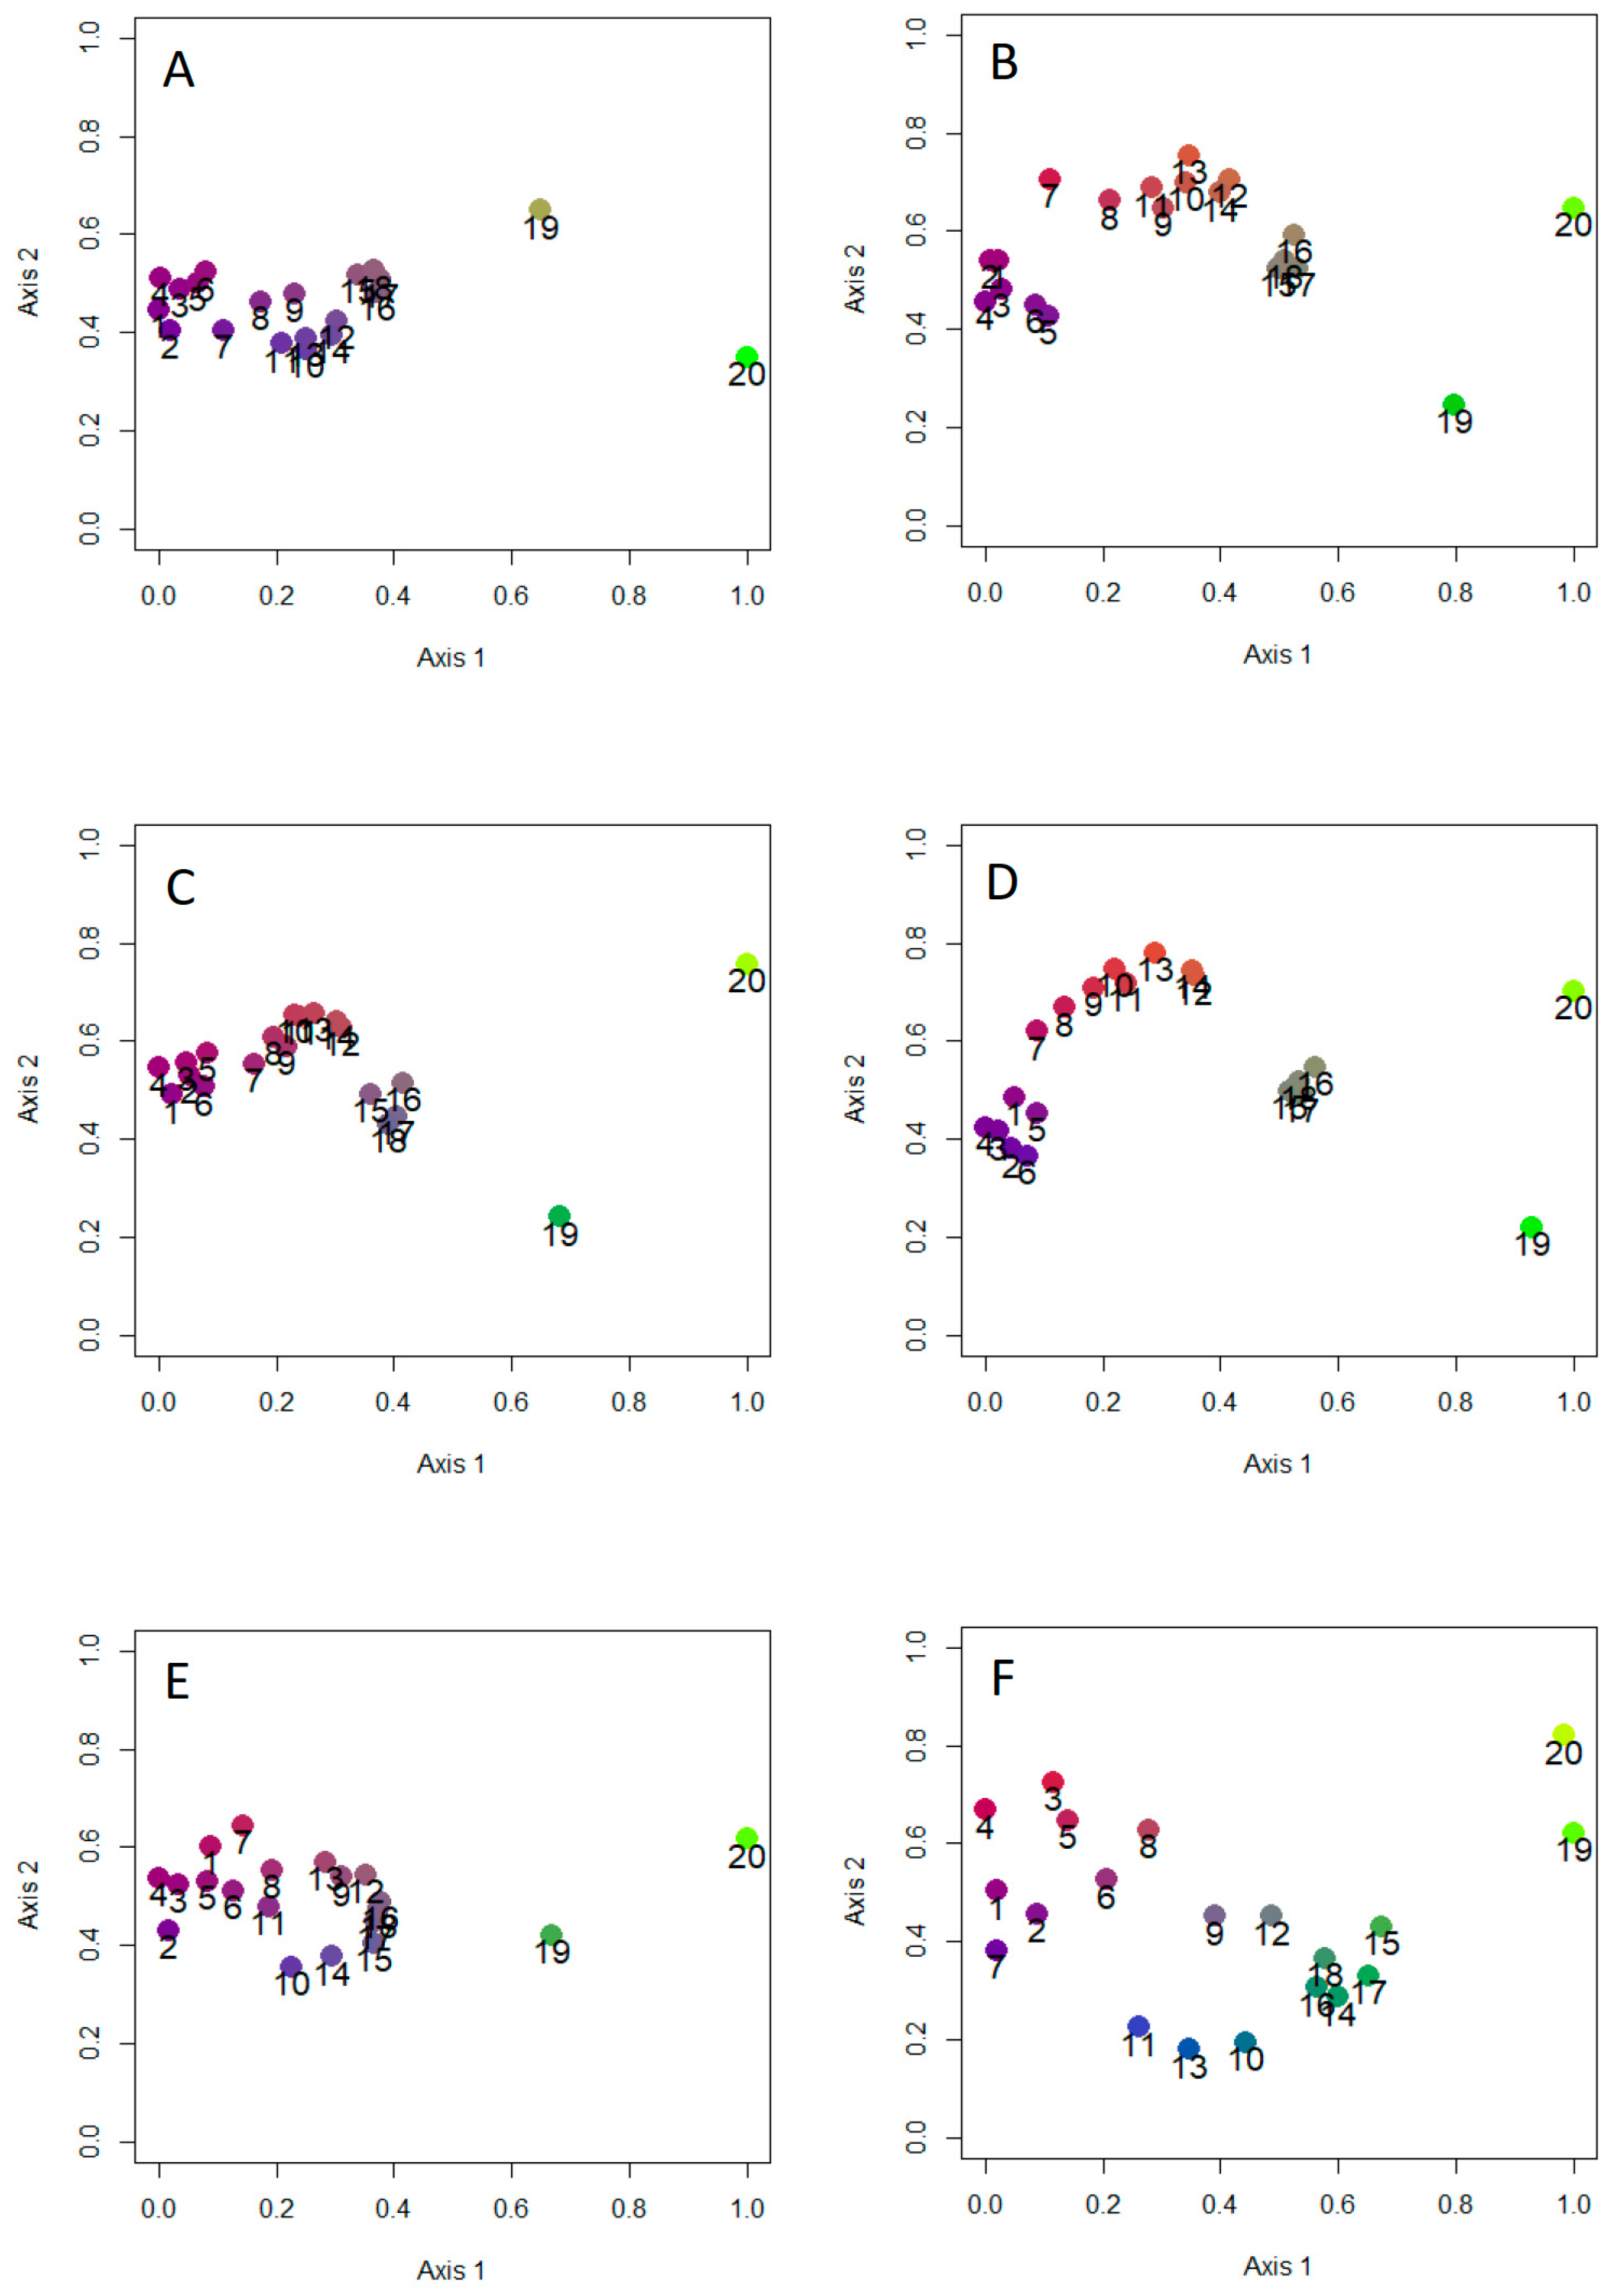

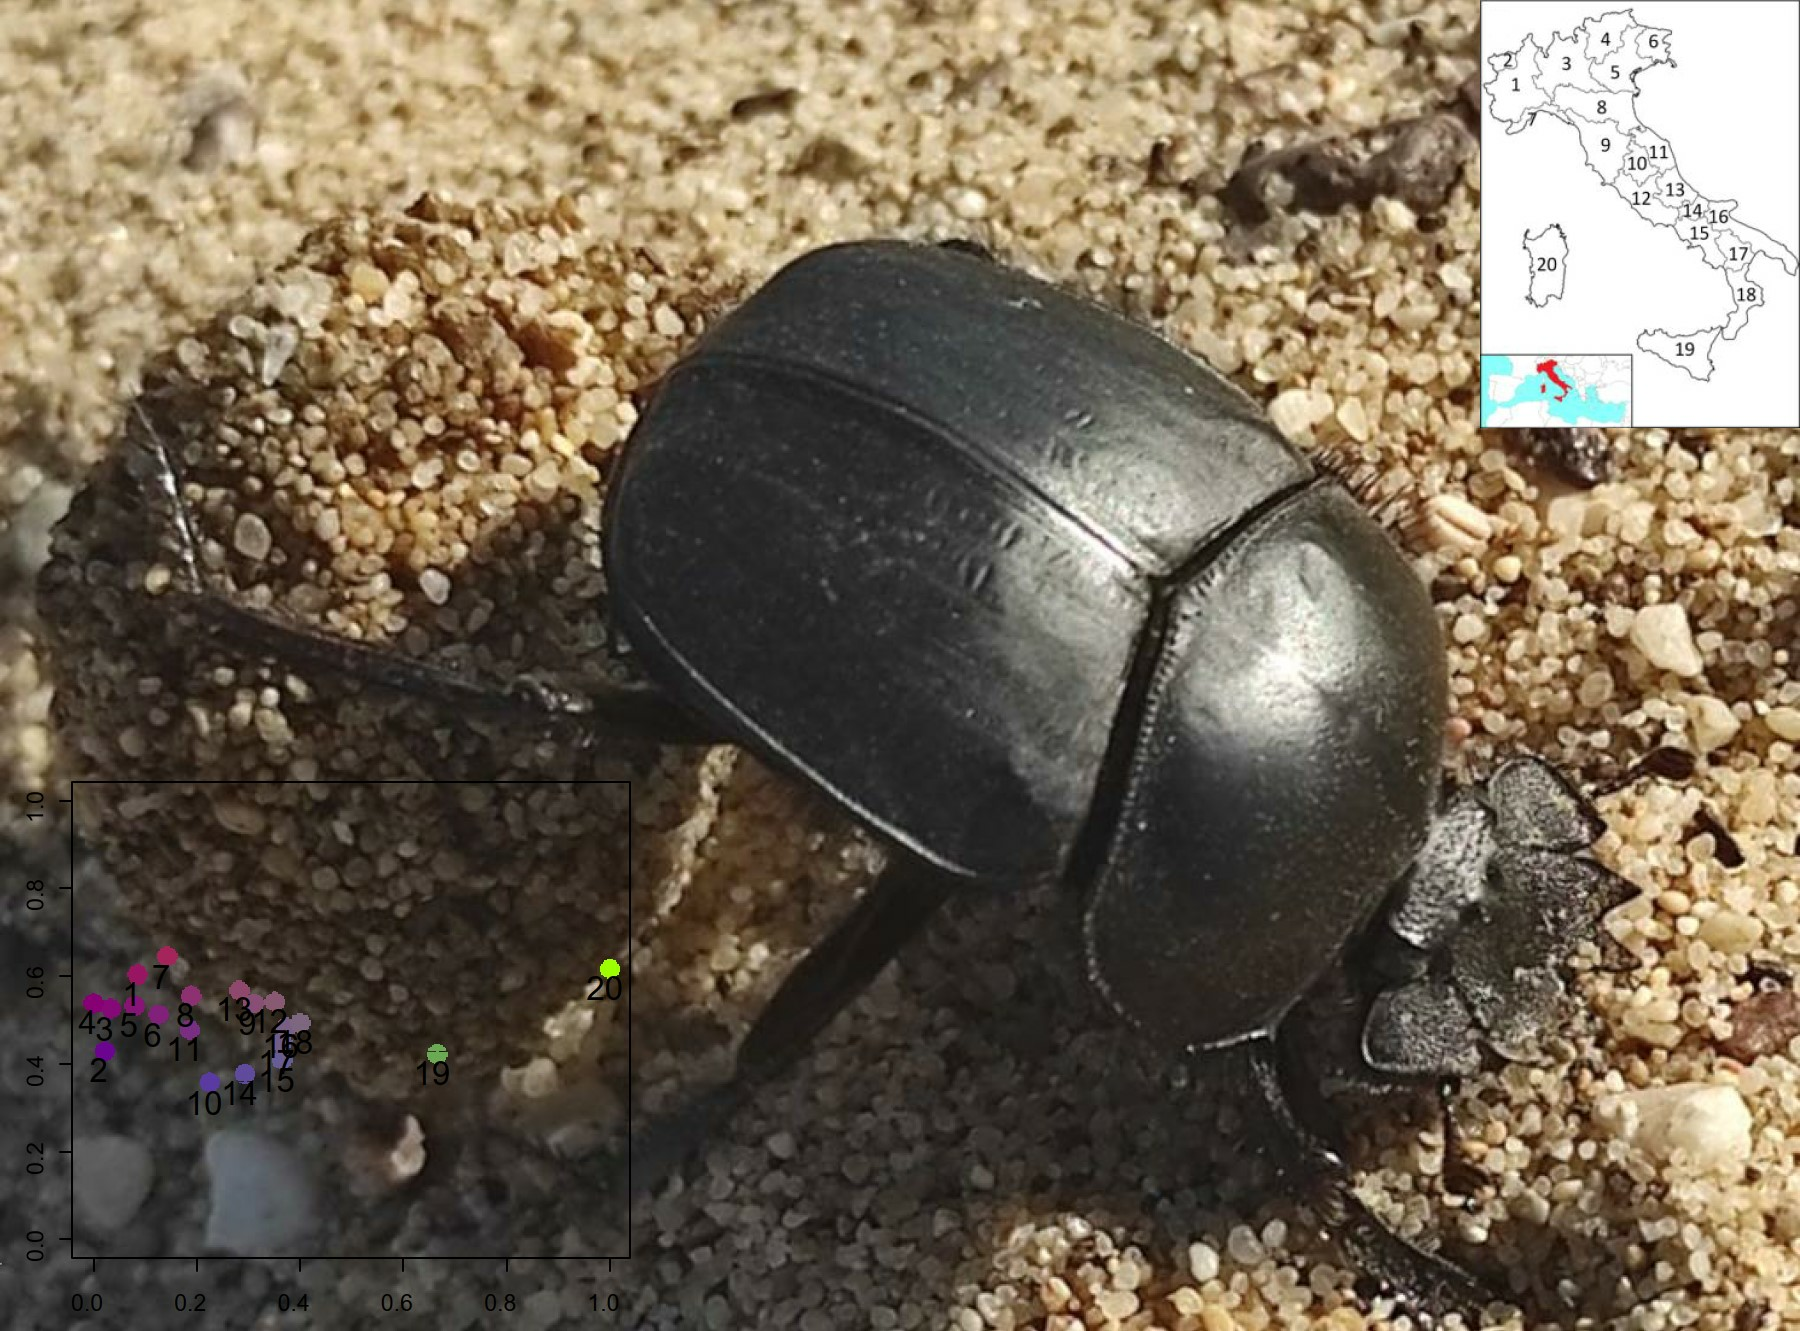
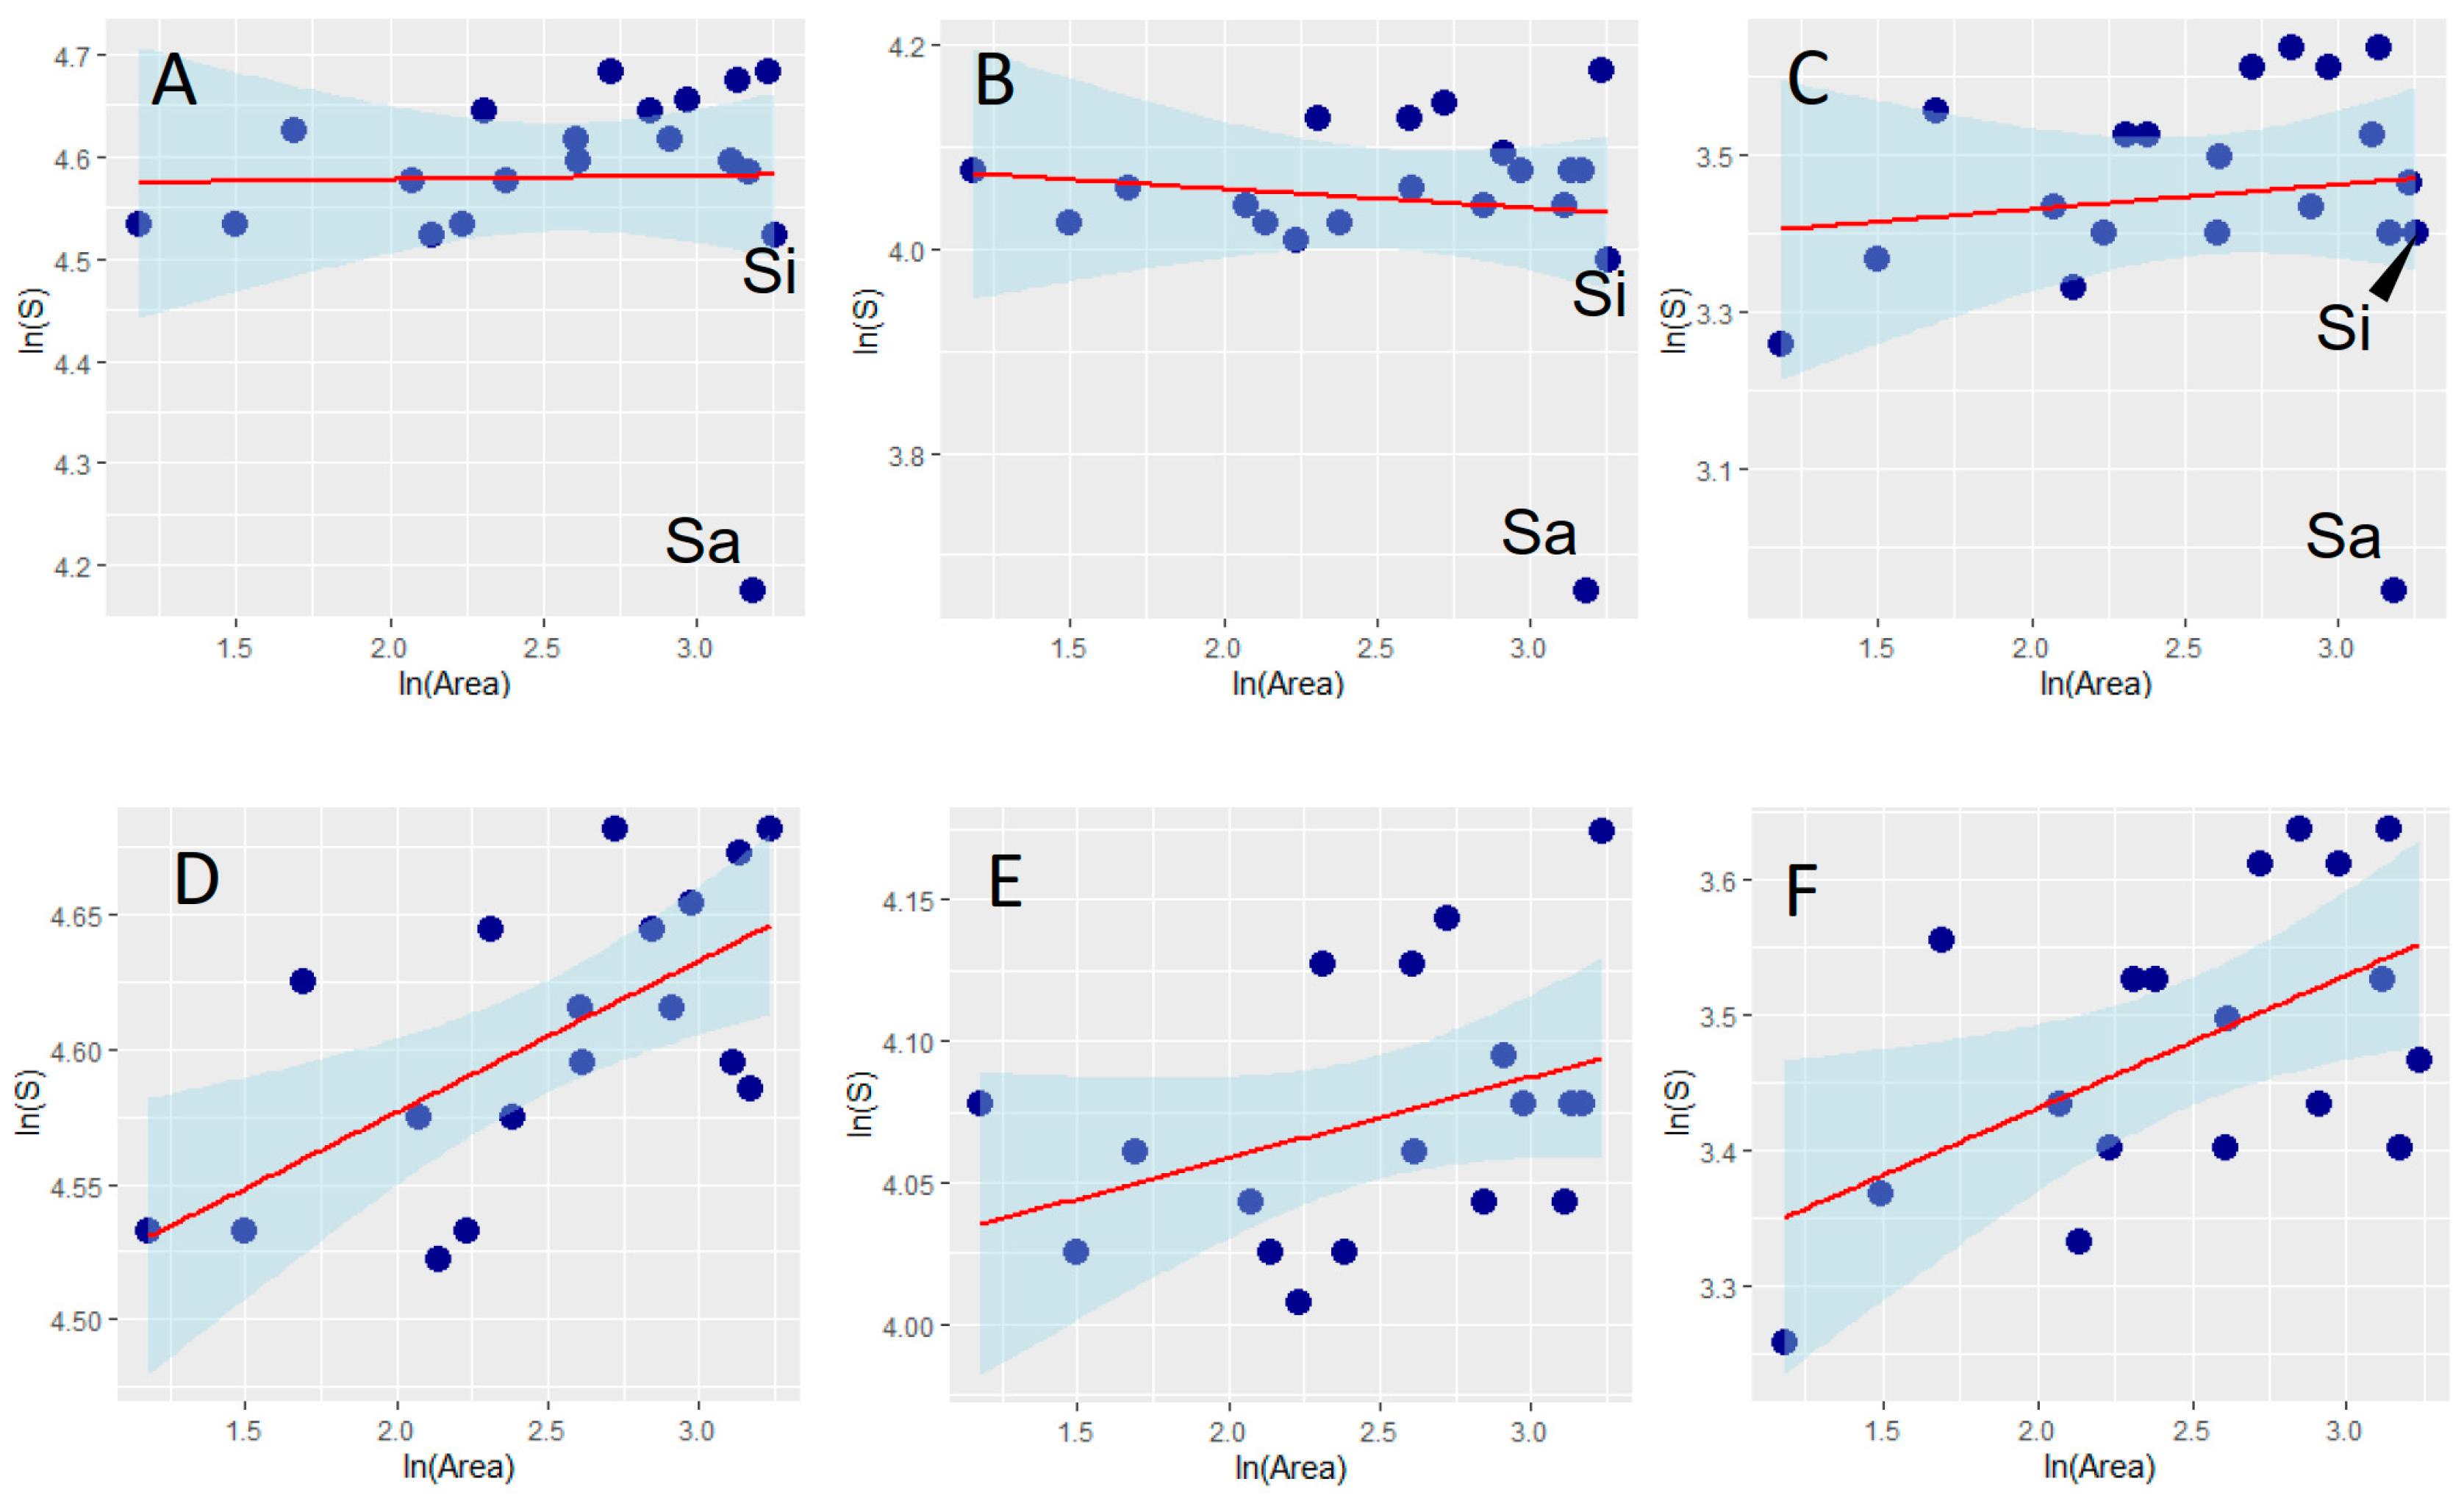
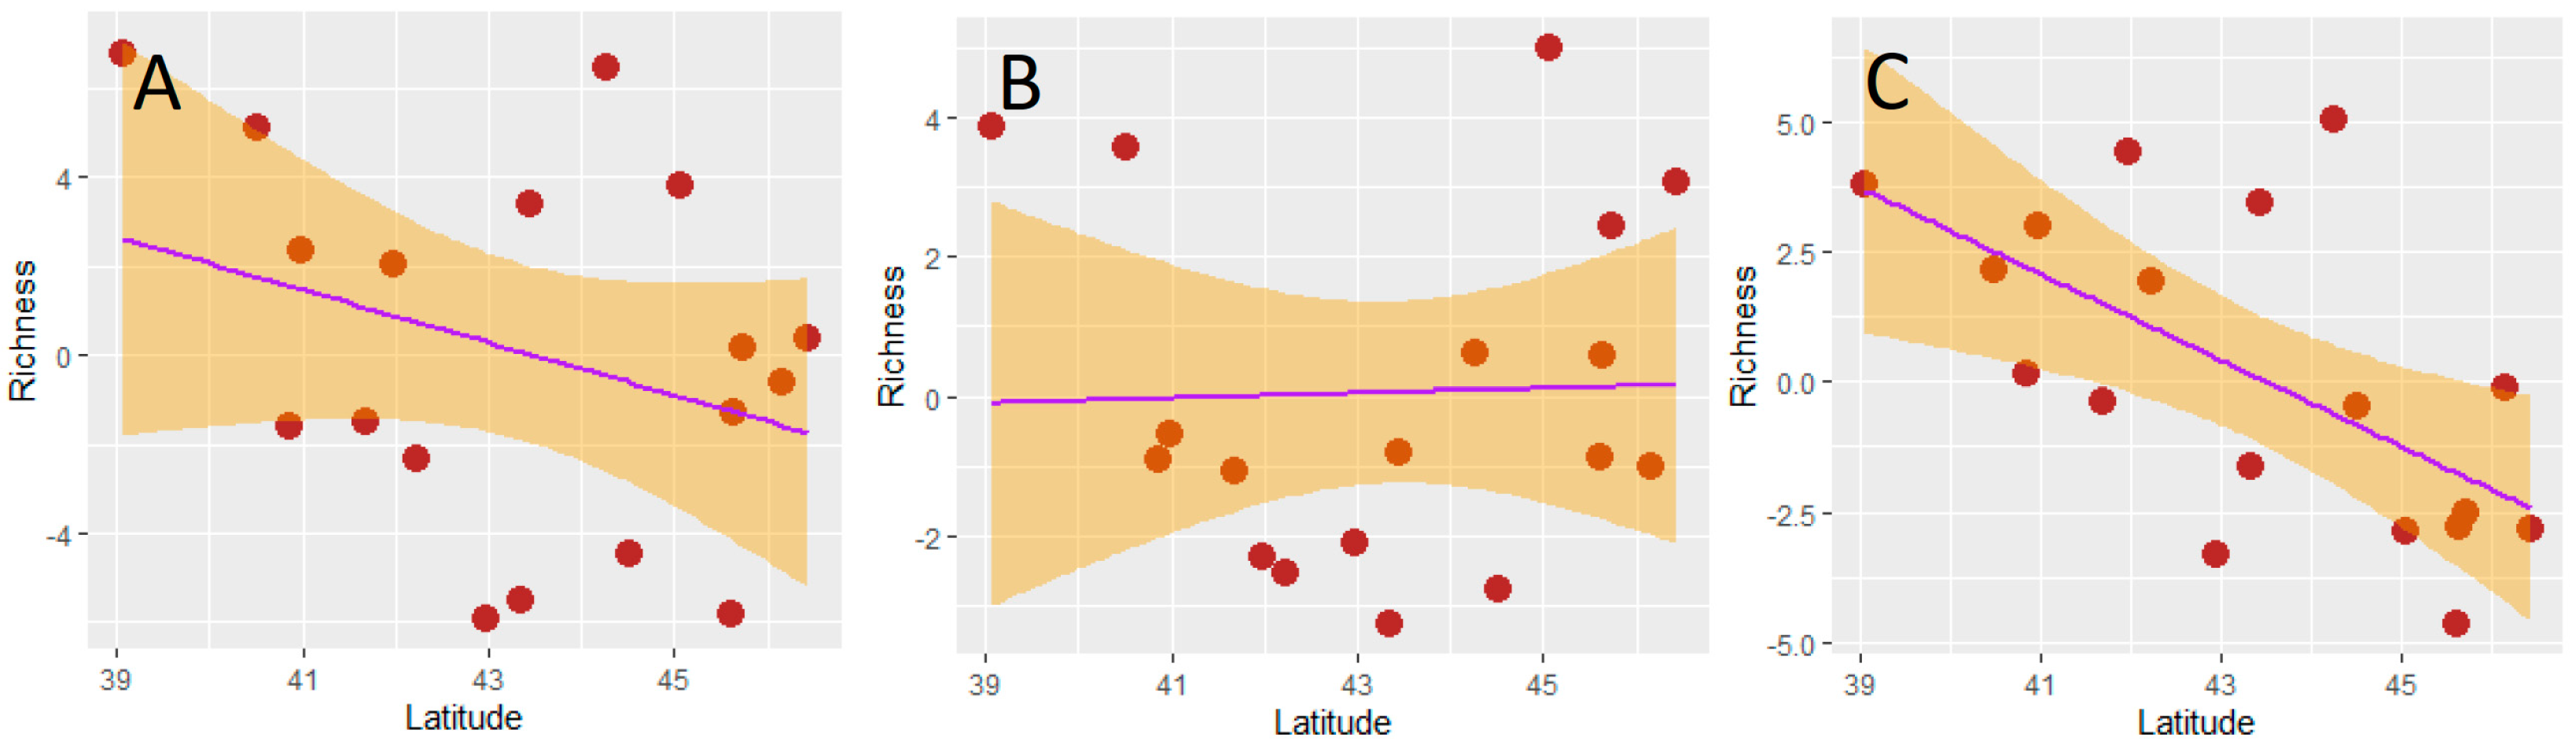
Table 1.
Species–area relationships for the Italian dung beetles. S = number of species; A = area (103 km2).
Table 1.
Species–area relationships for the Italian dung beetles. S = number of species; A = area (103 km2).
| Group | Equation | R2 | p-Value |
|---|---|---|---|
| Islands included | |||
| All dung beetle species | ln(S) = 0.004 × ln(A) + 4.570 | <0.001 | 0.933 |
| Aphodiinae | ln(S) = −0.019 × ln(A) + 4.096 | 0.013 | 0.638 |
| Scarabaeinae | ln(S) = 0.032 × ln(A) +3.368 | 0.299 | 0.608 |
| Islands excluded | |||
| All dung beetle species | ln(S) = 0.056 × ln(A) + 4.464 | 0.412 | 0.004 |
| Aphodiinae | ln(S) = 0.029 × ln(A) + 4.001 | 0.143 | 0.123 |
| Scarabaeinae | ln(S) = 0.098 × ln(A) + 3.234 | 0.295 | 0.020 |
Table 2.
Regressions between richness (residuals from species–area relationships) and latitude for the Italian dung beetle fauna.
Table 2.
Regressions between richness (residuals from species–area relationships) and latitude for the Italian dung beetle fauna.
| Group | Equation | R2 | p-Value |
|---|---|---|---|
| All dung beetle species | Richness = −0.592 × Latitude + 25.748 | 0.103 | 0.193 |
| Aphodiinae | Richness = −0.035 × Latitude − 1.471 | <0.001 | 0.904 |
| Scarabaeinae | Richness = −0.830 × Latitude + 36.095 | 0.370 | 0.007 |
Table 3.
Results of multimodel selection for the influence of topographical and climatic variables on dung beetle richness in Italy. SE: standard error.
Table 3.
Results of multimodel selection for the influence of topographical and climatic variables on dung beetle richness in Italy. SE: standard error.
| Group | Parameter | Estimate | SE | p-Value |
|---|---|---|---|---|
| Total | ||||
| Intercept | 20.535 | 19.111 | 0.294 | |
| Full average | ||||
| Temperature Annual Range | −0.859 | 0.668 | 0.211 | |
| Annual Precipitation | 0.010 | 0.010 | 0.355 | |
| Precipitation of Driest Quarter | −0.045 | 0.048 | 0.356 | |
| Mean Elevation | −0.0002 | 0.001 | 0.783 | |
| Conditional average | ||||
| Temperature Annual Range | −1.158 | 0.506 | 0.031 | |
| Annual Precipitation | 0.018 | 0.007 | 0.012 | |
| Precipitation of Driest Quarter | −0.085 | 0.319 | 0.013 | |
| Mean Elevation | −0.002 | 0.002 | 0.289 | |
| Aphodiinae | ||||
| Intercept | 6.576 | 9.413 | 0.495 | |
| Full average | ||||
| Annual Mean Temperature | −0.139 | 0.237 | 0.562 | |
| Annual Precipitation | 0.004 | 0.005 | 0.468 | |
| Precipitation of Driest Quarter | −0.026 | 0.030 | 0.392 | |
| Mean Elevation | 0.001 | 0.002 | 0.397 | |
| Temperature Annual Range | −0.216 | 0.336 | 0.530 | |
| Conditional average | ||||
| Annual Mean Temperature | −0.433 | 0.217 | 0.059 | |
| Annual Precipitation | 0.009 | 0.004 | 0.036 | |
| Precipitation of Driest Quarter | −0.049 | 0.023 | 0.042 | |
| Mean Elevation | 0.003 | 0.001 | 0.042 | |
| Temperature Annual Range | −0.598 | 0.292 | 0.058 | |
| Scarabaeinae | ||||
| Intercept | 15.639 | 22.463 | 0.491 | |
| Full average | ||||
| Temperature Annual Range | −0.854 | 0.445 | 0.063 | |
| Mean Elevation | −0.001 | 0.005 | 0.868 | |
| Annual Mean Temperature | 0.488 | 0.678 | 0.476 | |
| Annual Precipitation | 0.002 | 0.003 | 0.517 | |
| Conditional average | ||||
| Temperature Annual Range | −0.977 | 0.326 | 0.005 | |
| Mean Elevation | −0.001 | 0.006 | 0.829 | |
| Annual Mean Temperature | 0.936 | 0.680 | 0.175 | |
| Annual Precipitation | 0.004 | 0.003 | 0.140 |
Table 4.
Results of Mantel tests and partial Mantel tests of biogeographical distances against environmental and geographical distances for Italian dung beetles.
Table 4.
Results of Mantel tests and partial Mantel tests of biogeographical distances against environmental and geographical distances for Italian dung beetles.
| Matrix Correlation | Biogeographical Distances | ||||
|---|---|---|---|---|---|
| Matrix A × Matrix B | Matrix C (Controlling) | Sørensen | Simpson | ||
| r | p-Value | r | p-Value | ||
| Total dung beetle fauna | |||||
| Environmental distances | - | 0.308 | 0.059 | 0.411 | 0.026 |
| Centroids | - | 0.572 | <0.001 | 0.712 | <0.001 |
| Environmental distances | Centroids | −0.021 | 0.443 | 0.017 | 0.332 |
| Centroids | Environmental distances | 0.507 | <0.001 | 0.638 | <0.001 |
| Aphodiinae | |||||
| Environmental distances | - | 0.235 | 0.099 | 0.395 | 0.027 |
| Centroids | - | 0.613 | <0.001 | 0.724 | <0.001 |
| Environmental distances | Centroids | −0.169 | 0.914 | −0.024 | 0.447 |
| Centroids | Environmental distances | 0.598 | <0.001 | 0.666 | <0.001 |
| Scarabaeinae | |||||
| Environmental distances | - | 0.474 | 0.003 | 0.168 | 0.097 |
| Centroids | - | 0.621 | <0.001 | 0.484 | <0.001 |
| Environmental distances | Centroids | 0.192 | 0.0804 | −01.45 | 0.862 |
| Centroids | Environmental distances | 0.486 | <0.001 | 0.478 | <0.001 |
Disclaimer/Publisher’s Note: The statements, opinions and data contained in all publications are solely those of the individual author(s) and contributor(s) and not of MDPI and/or the editor(s). MDPI and/or the editor(s) disclaim responsibility for any injury to people or property resulting from any ideas, methods, instructions or products referred to in the content. |
© 2024 by the authors. Licensee MDPI, Basel, Switzerland. This article is an open access article distributed under the terms and conditions of the Creative Commons Attribution (CC BY) license (https://creativecommons.org/licenses/by/4.0/).
Share and Cite
MDPI and ACS Style
Fattorini, S.; Vitozzi, A.; Di Biase, L.; Bergamaschi, D. Macroecology of Dung Beetles in Italy. Insects 2024, 15, 39. https://doi.org/10.3390/insects15010039
AMA Style
Fattorini S, Vitozzi A, Di Biase L, Bergamaschi D. Macroecology of Dung Beetles in Italy. Insects. 2024; 15(1):39. https://doi.org/10.3390/insects15010039
Chicago/Turabian StyleFattorini, Simone, Alessia Vitozzi, Letizia Di Biase, and Davide Bergamaschi. 2024. "Macroecology of Dung Beetles in Italy" Insects 15, no. 1: 39. https://doi.org/10.3390/insects15010039
Note that from the first issue of 2016, this journal uses article numbers instead of page numbers. See further details here.