
Complex Messages in Long-Term Monitoring of Regal Fritillary (Speyeria idalia) (Lepidoptera: Nymphalidae) in the State of Wisconsin, USA, 1988–2015

Abstract
:1. Introduction
2. Methods
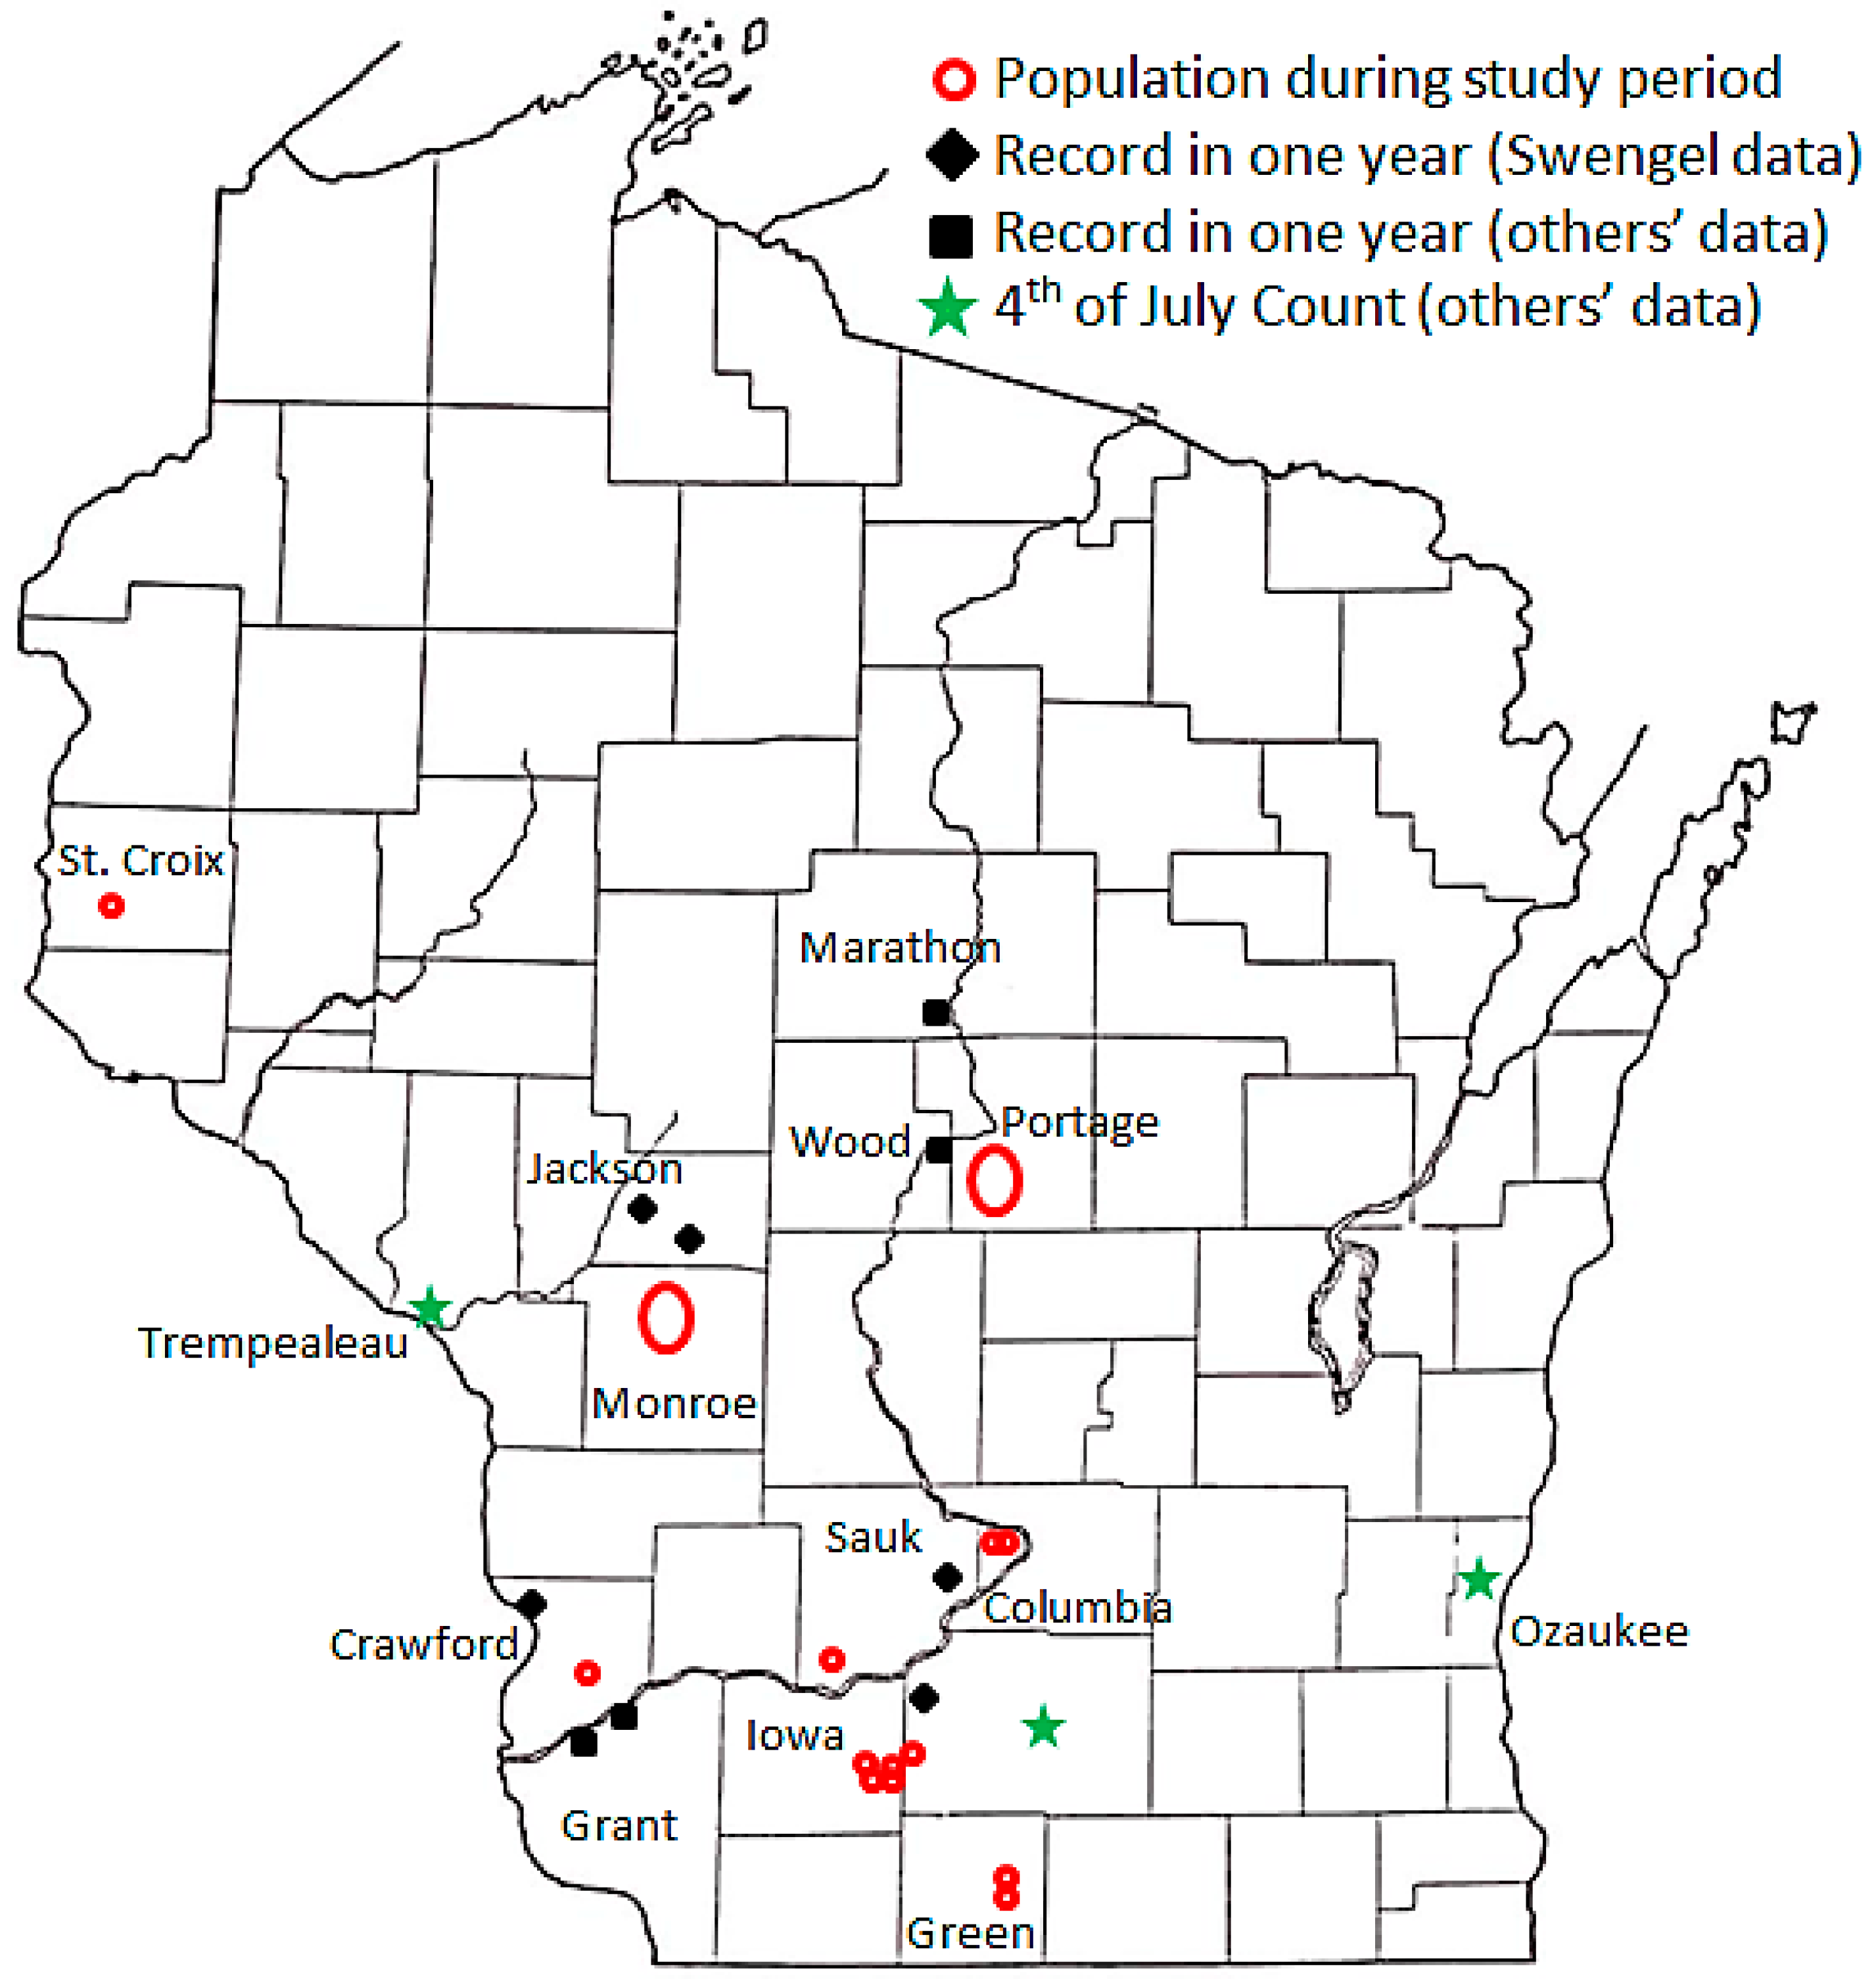
2.1. Study Sites
2.2. Butterfly Surveys
2.3. Data Analysis
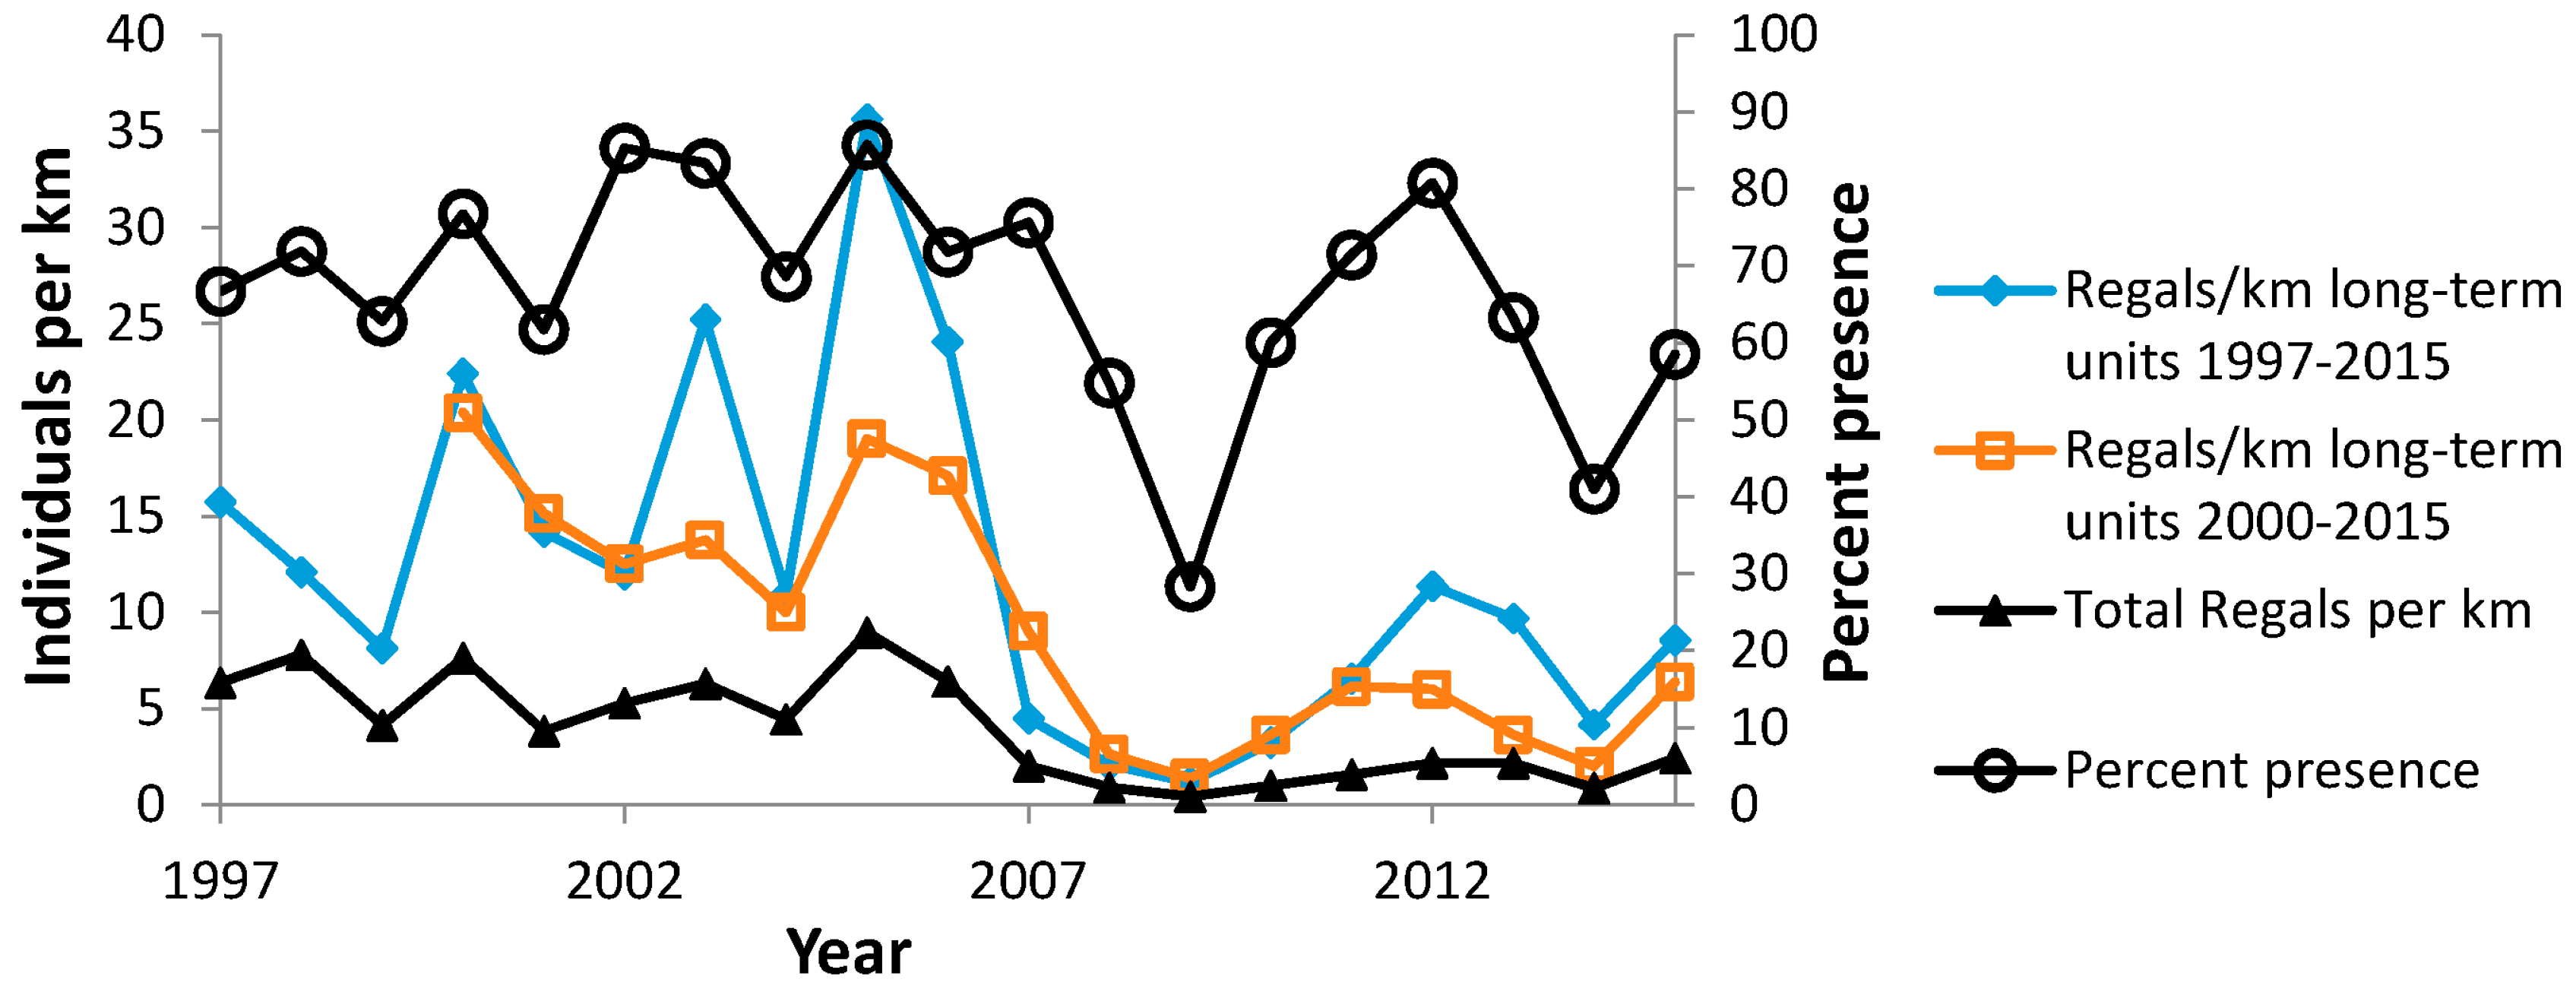
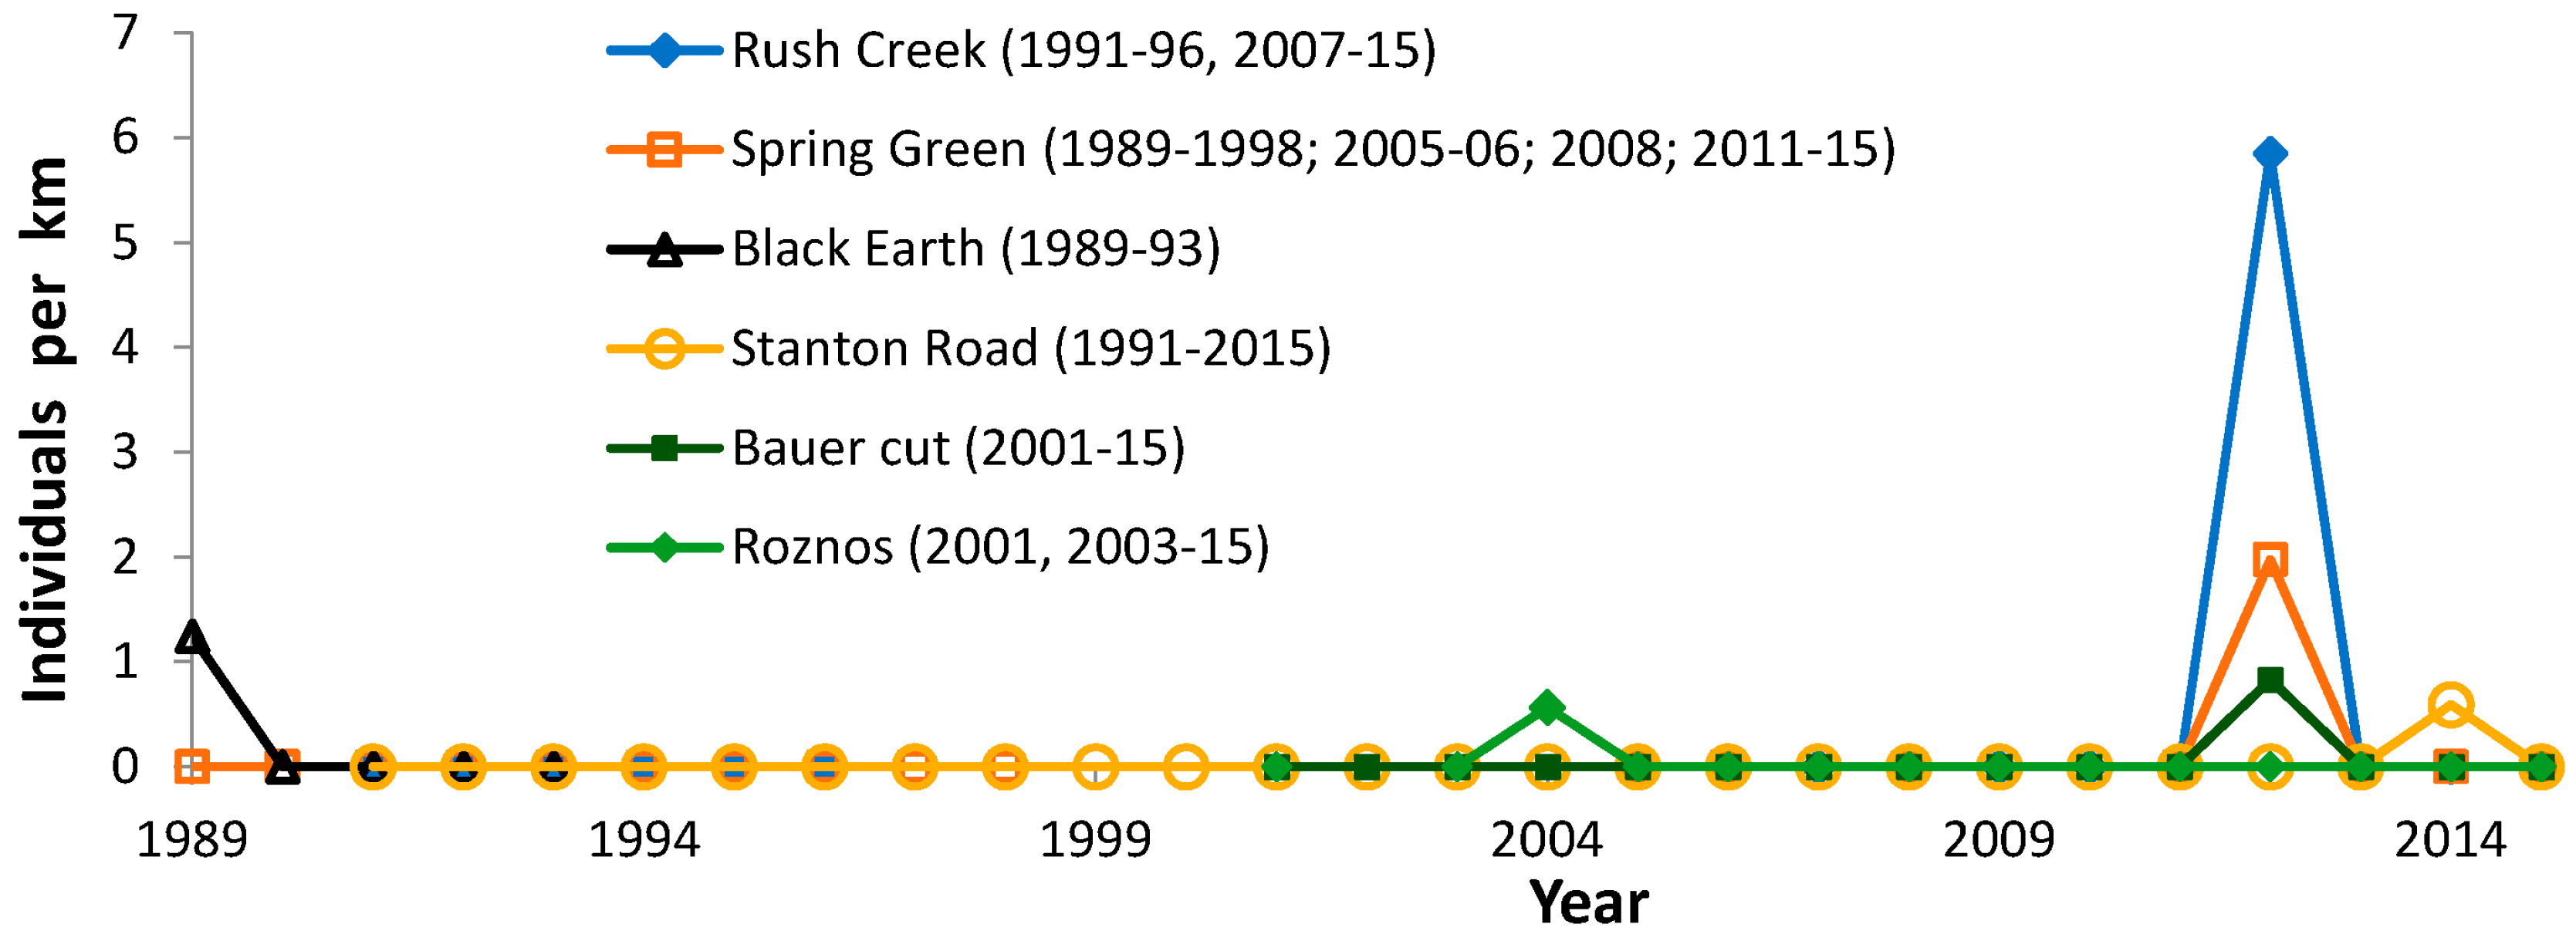
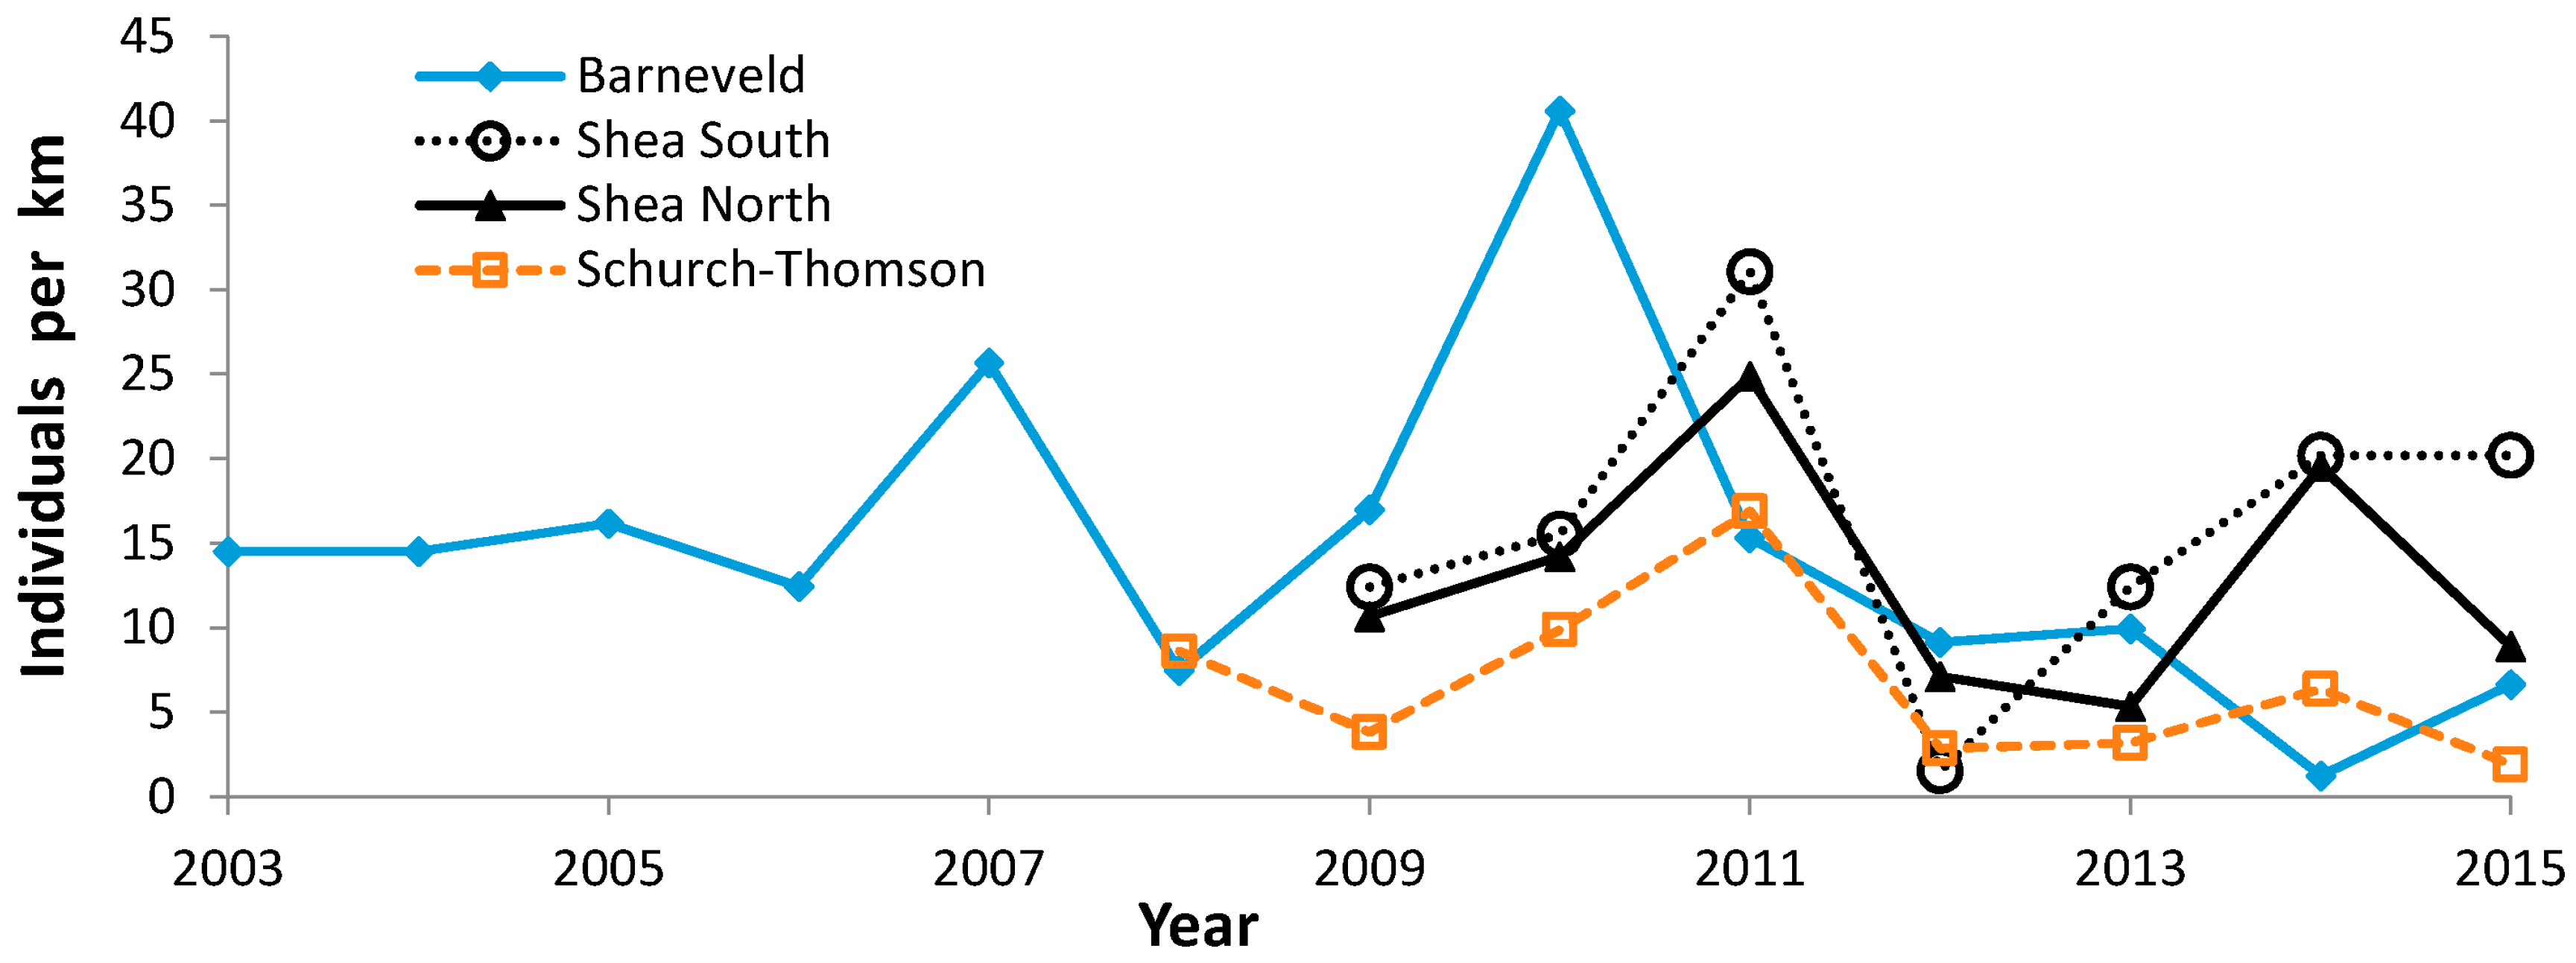
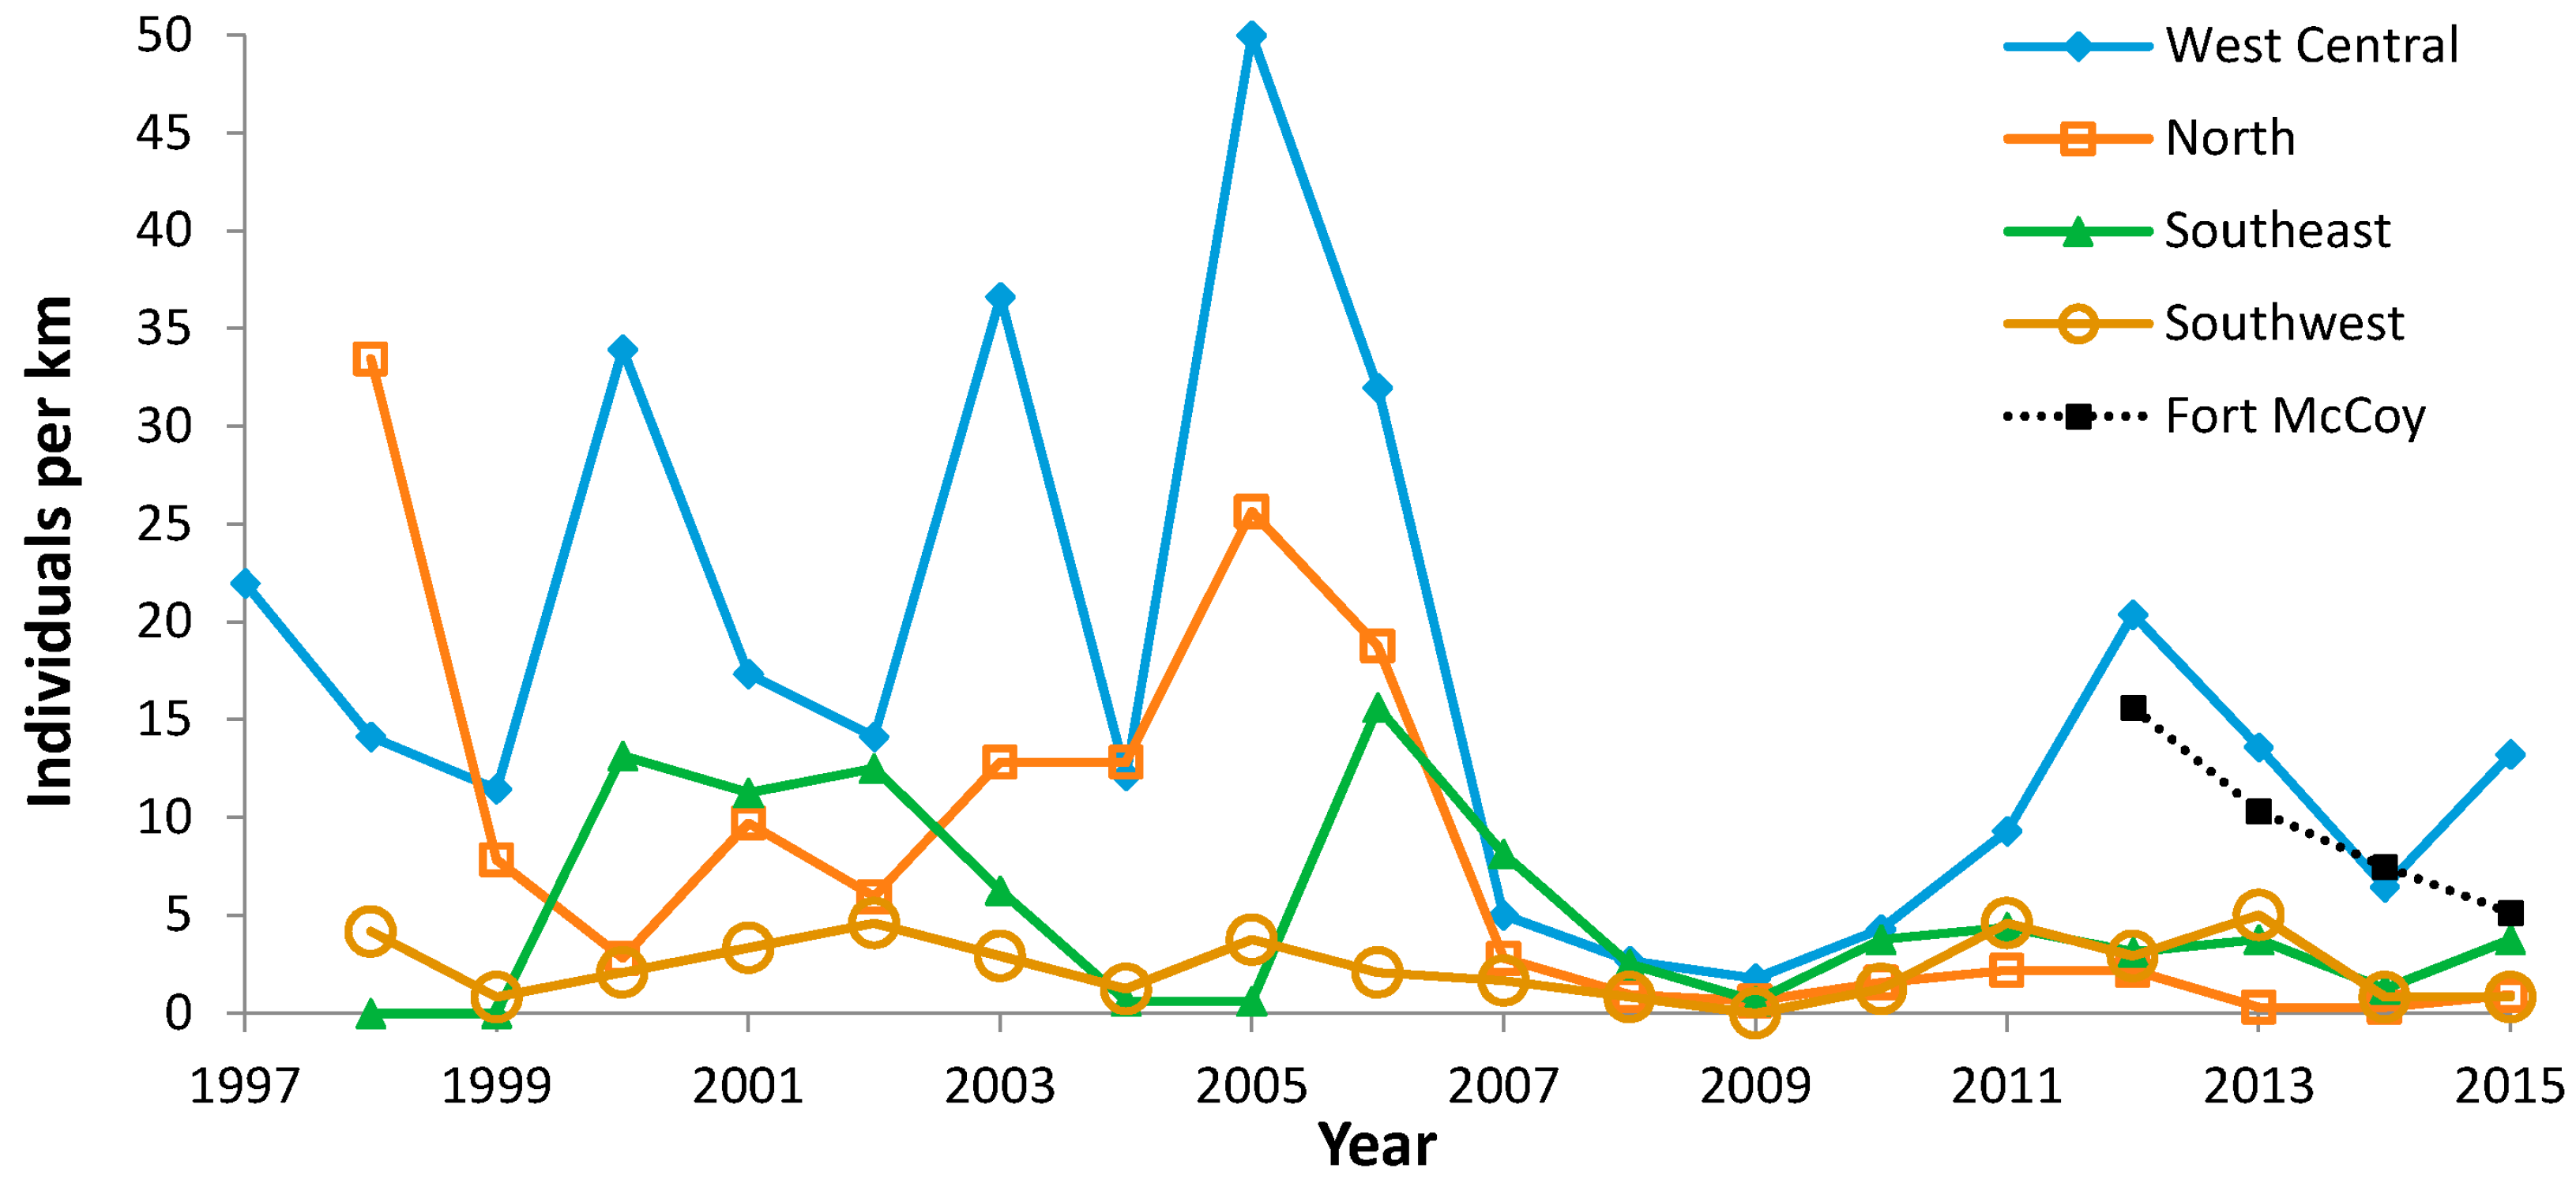
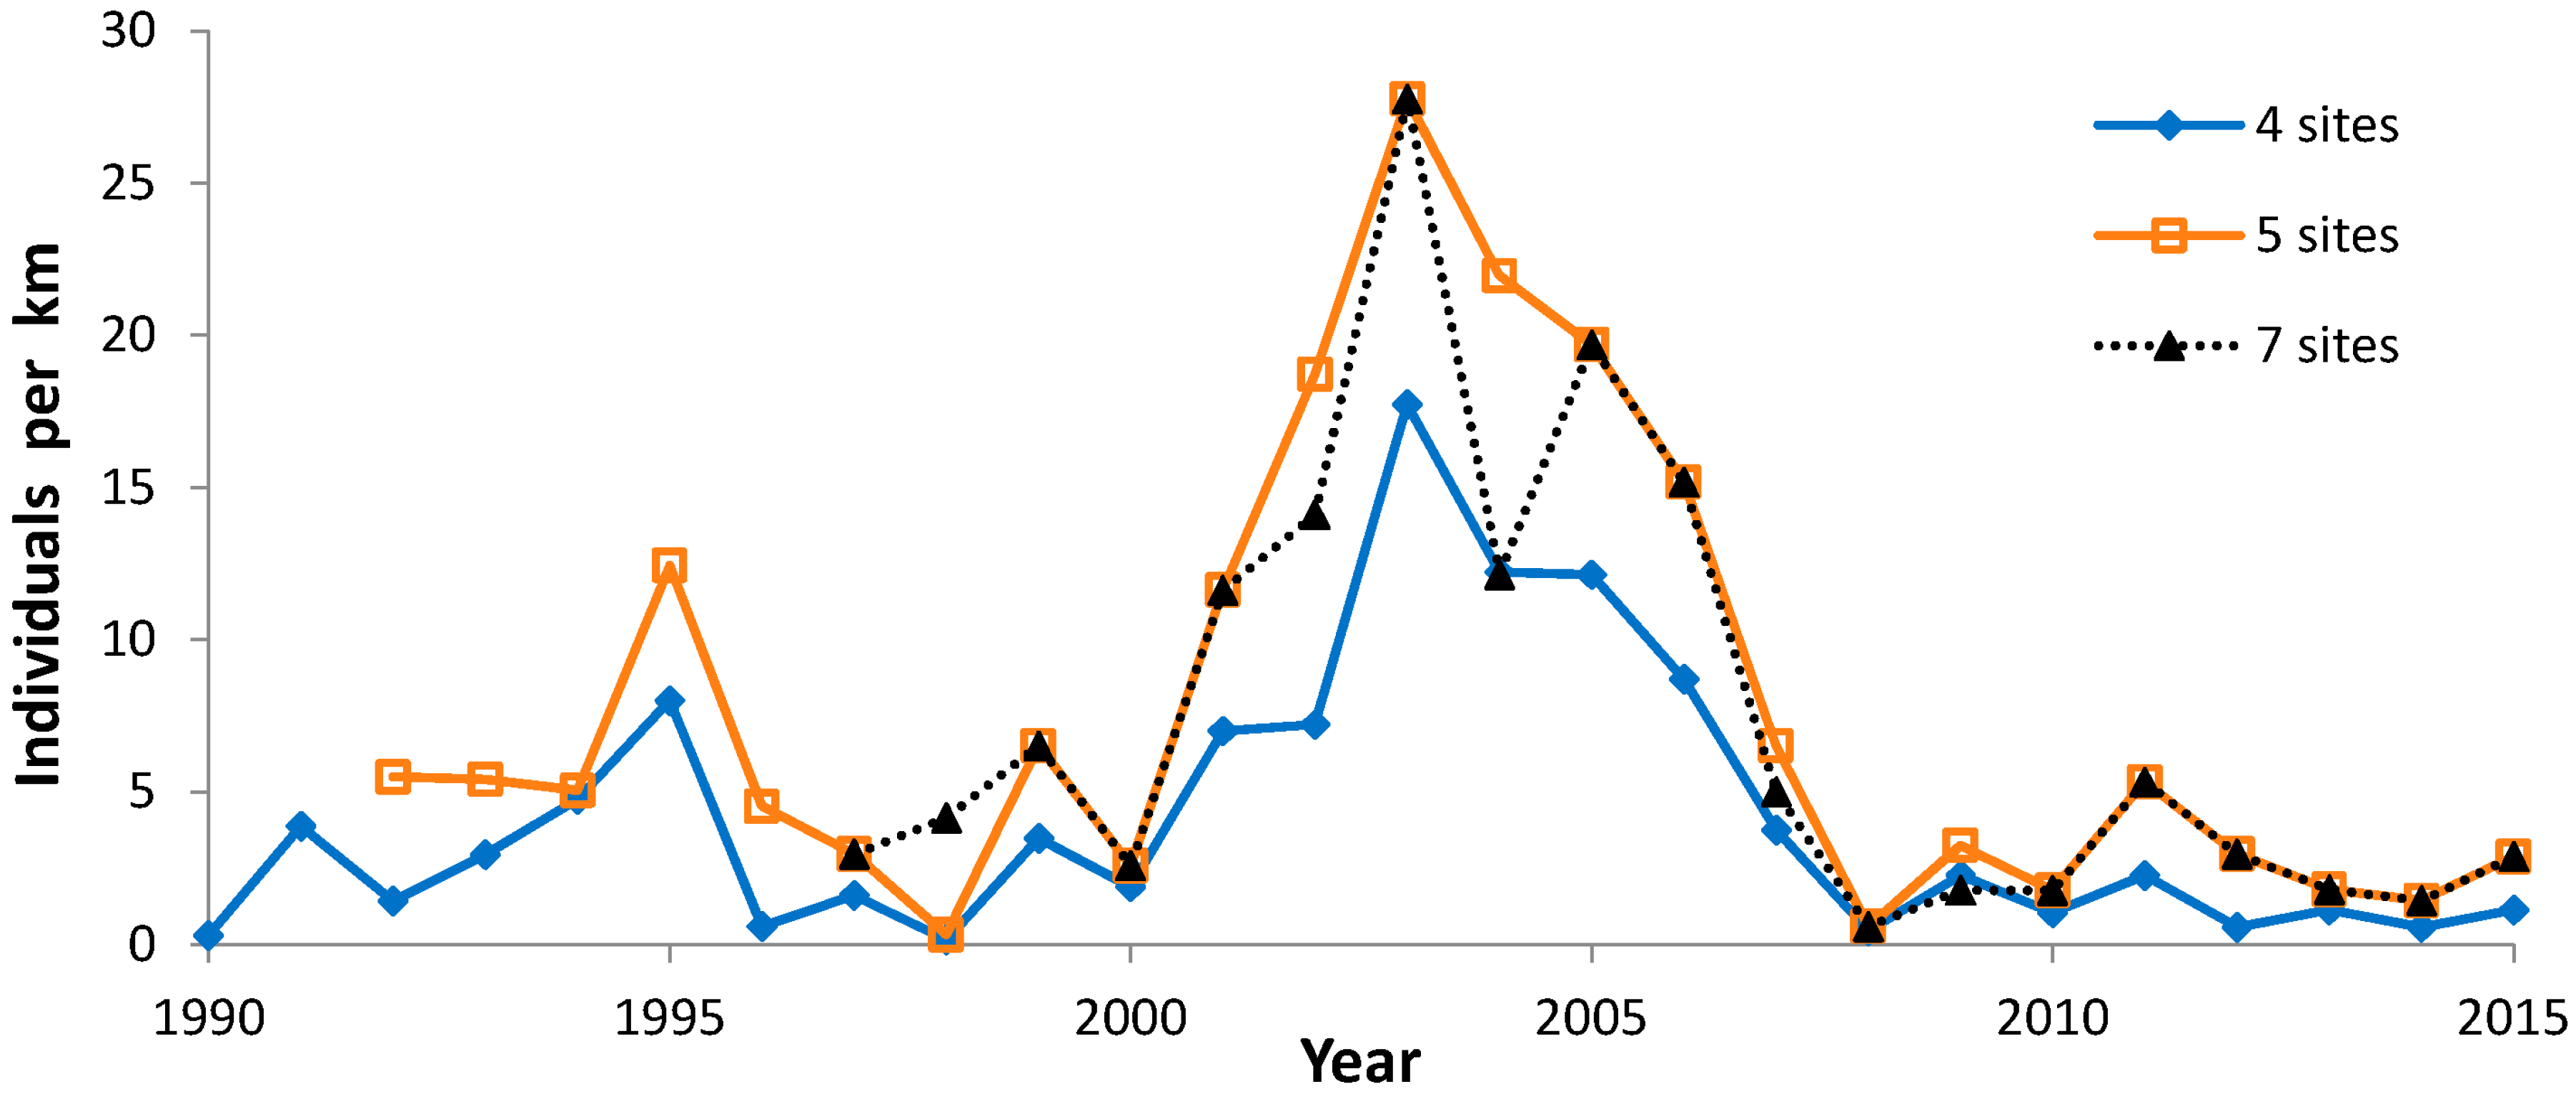
3. Results
3.1. Patterns of Occurrence
3.2. Flight Period Characteristics
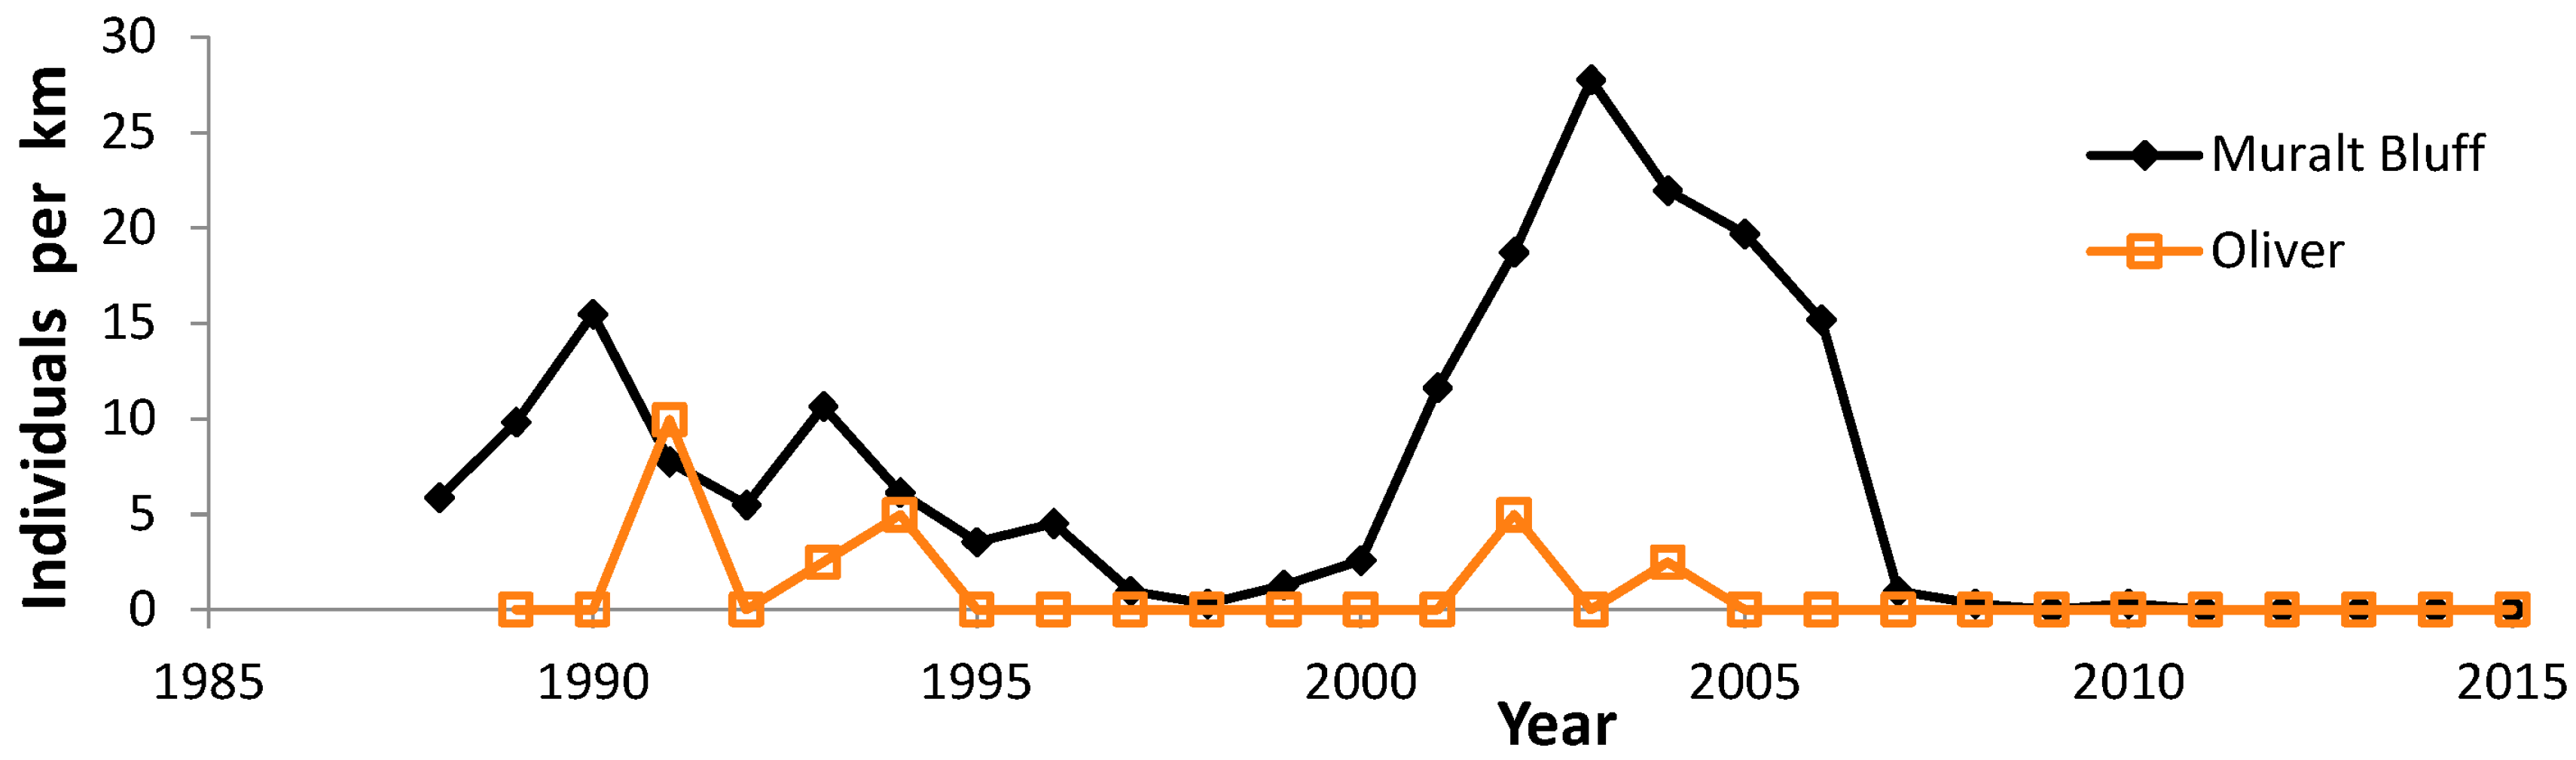
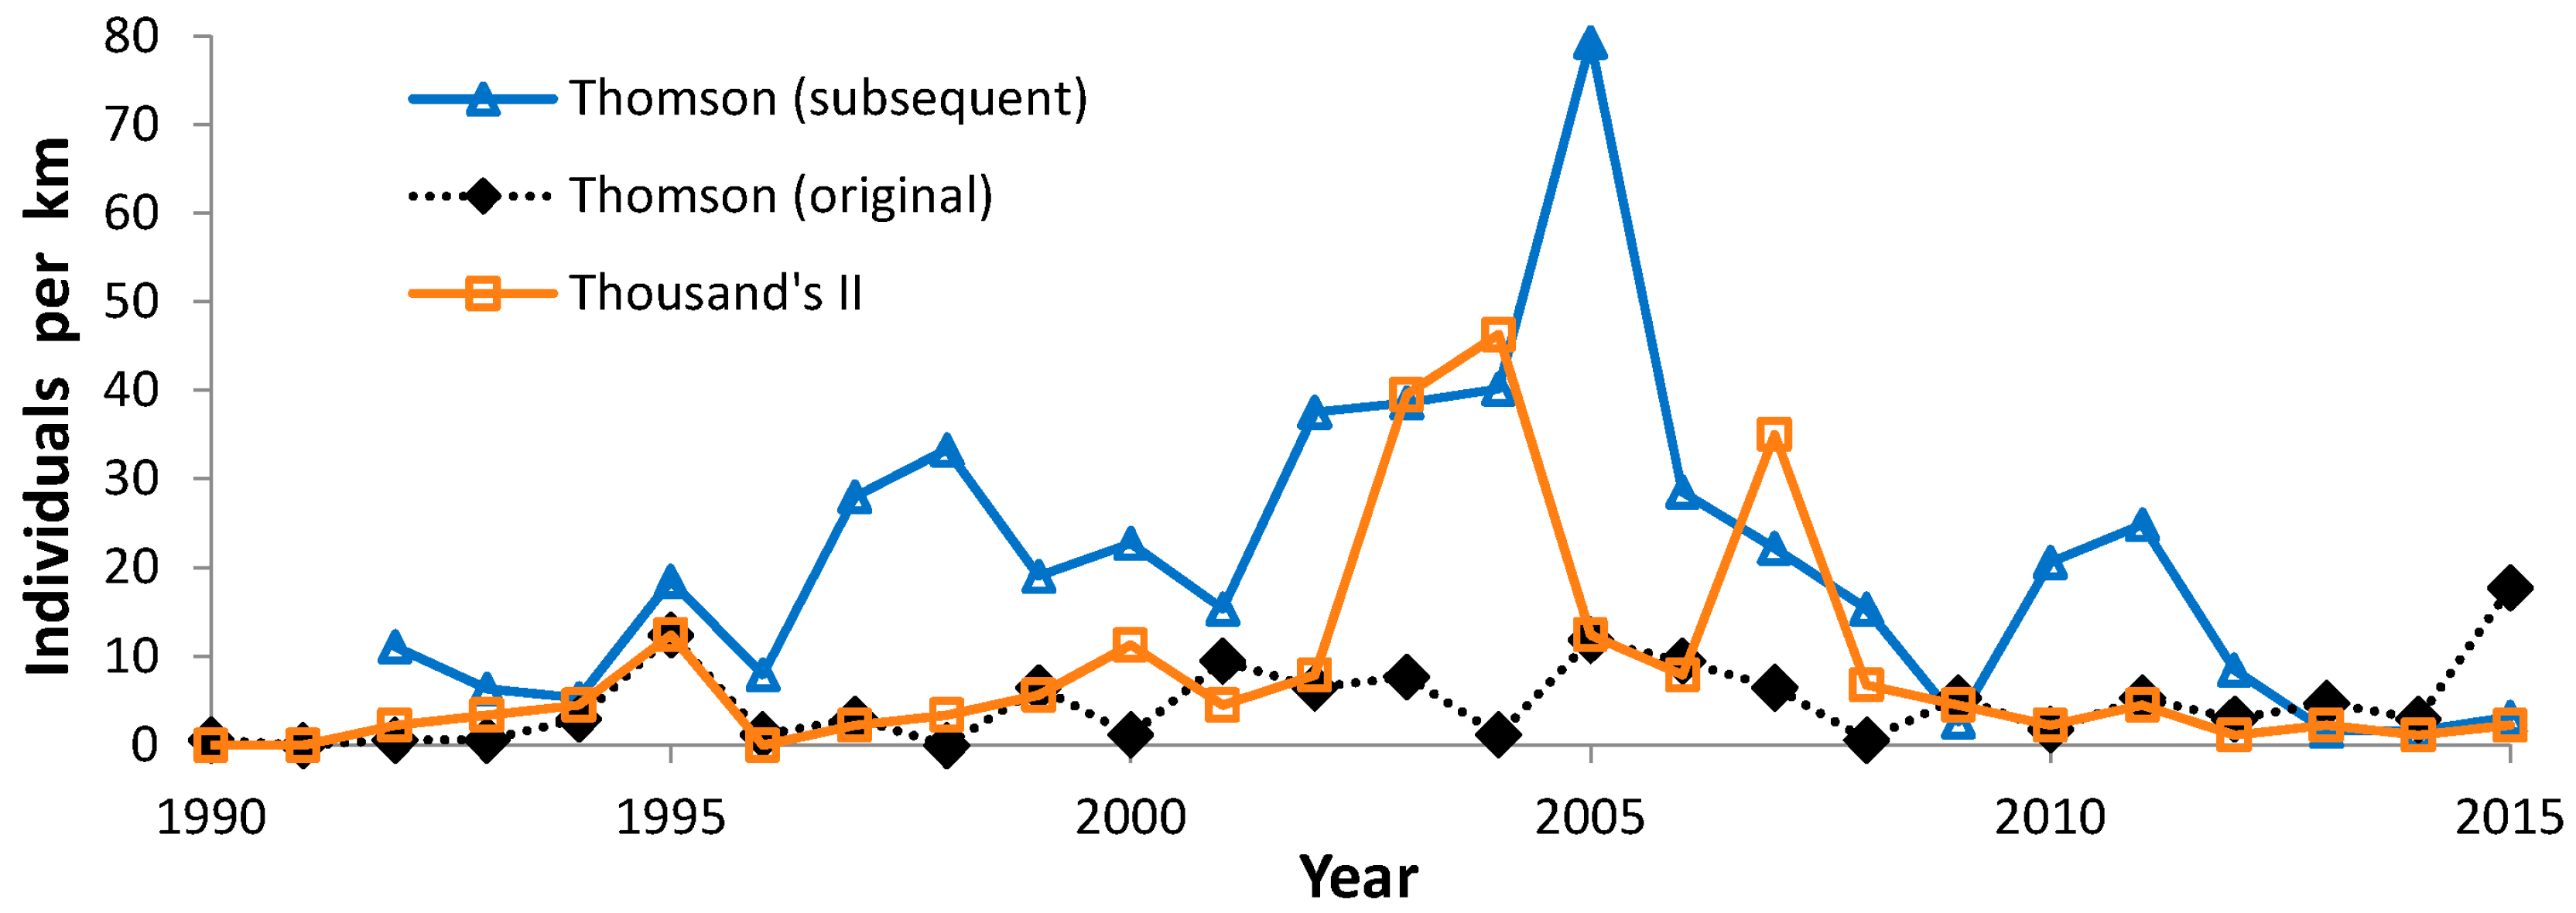
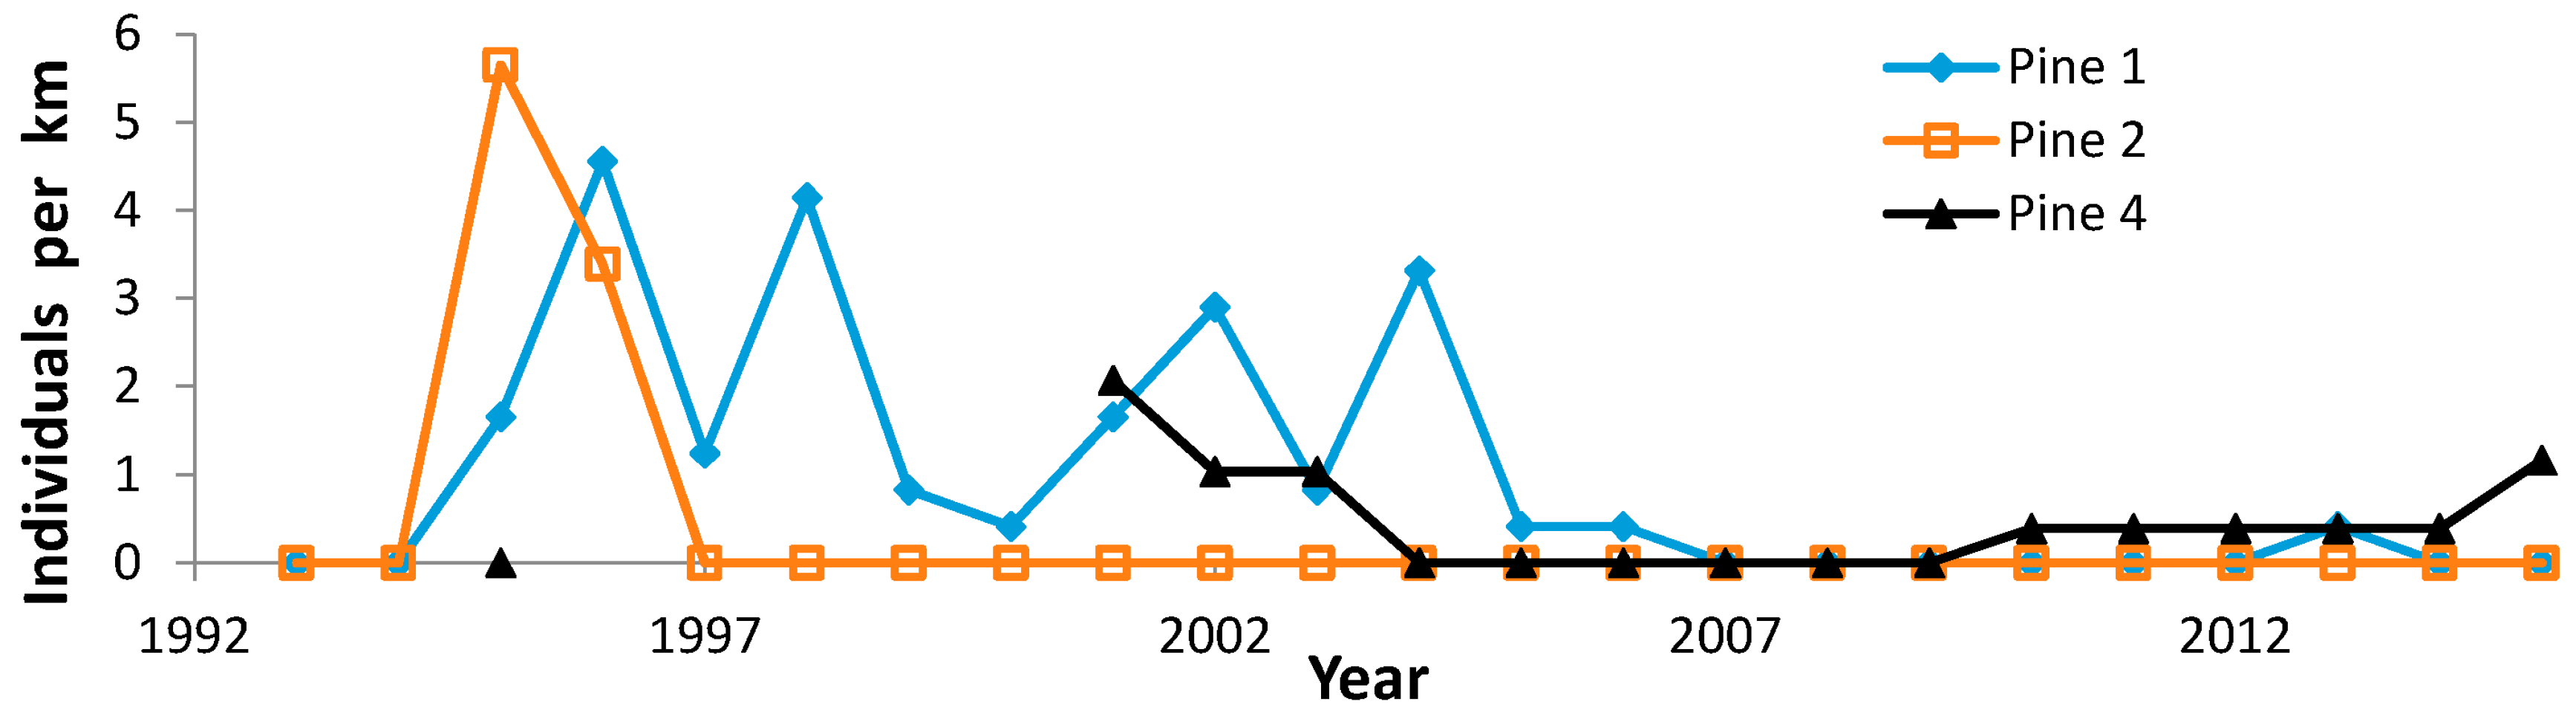
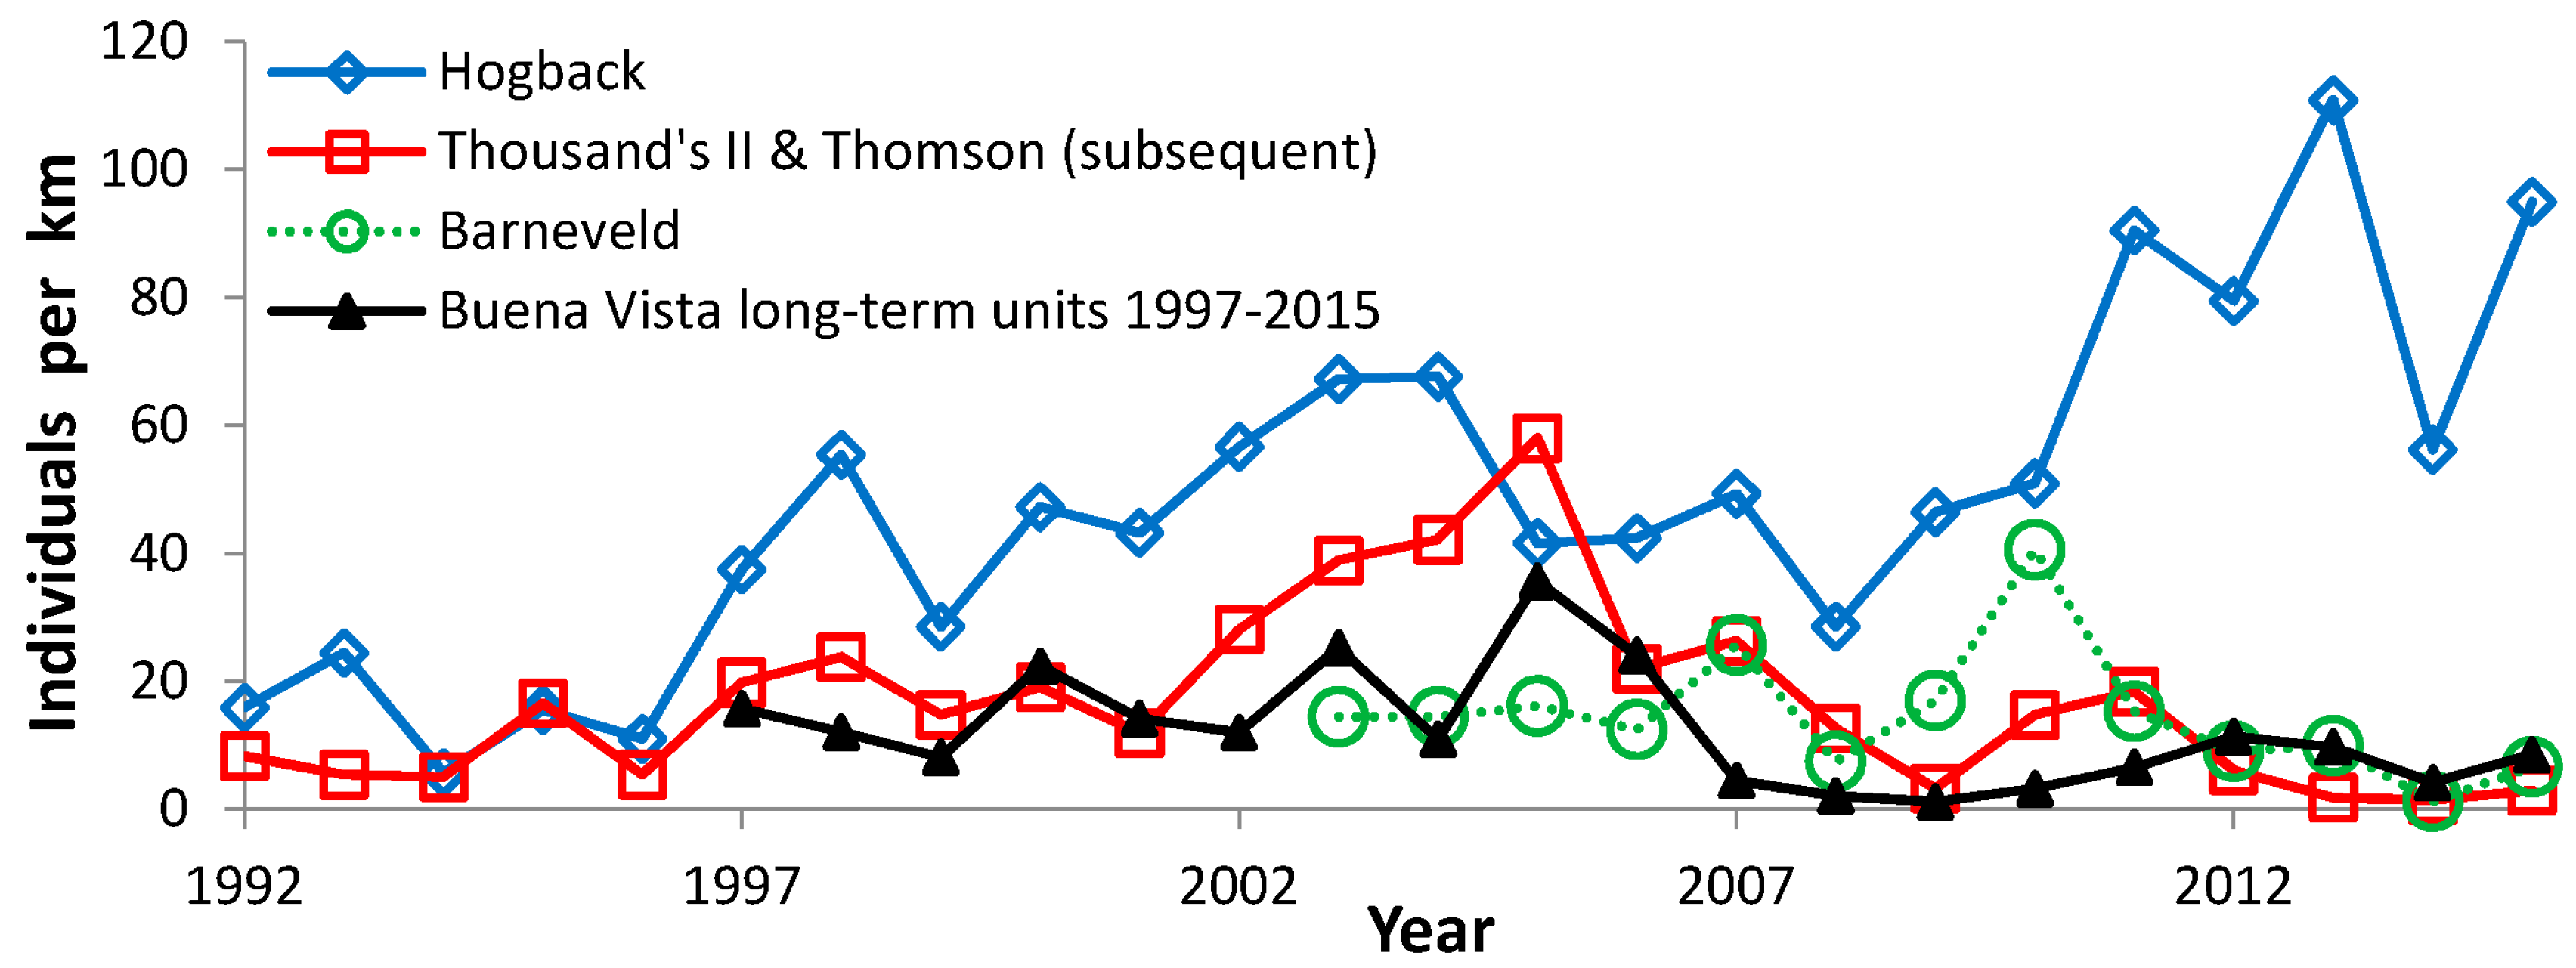
3.3. Population Trends
3.4. Comparisons of Site Characteristics
4. Discussion
4.1. Patterns of Occurrence
4.2. Flight Period Characteristics
4.3. Population Trends
4.4. Comparisons of Site Characteristics
5. Conclusions
Acknowledgments
Author Contributions
Conflicts of Interest
Appendix A

| Habitat | Site | County | Years Surveyed |
|---|---|---|---|
| Barrens | Crex Meadows | Burnett | 1991–2015 |
| Dike 17 | Jackson | 1988–2015 | |
| Sandhill Wildlife Area | Wood | 1992–1993, 1995–2015 | |
| Fish Lake Wildlife Area | Burnett | 1998–2015 | |
| Grasslands | Battle Bluff Prairie | Vernon | 2007–2008, 2010, 2013–2014 |
| Chaffee Creek | Marquette | 2000–2002, 2004–2007, 2010, 2012–2015 | |
| Dewey Heights Prairie | Grant | 2001–2015 | |
| Governor Dodge State Park | Iowa | 2000–2001 | |
| Grand River Wildlife Area | Marquette/Green Lake | 2014 | |
| Hardscrabble Prairie | Lafayette | 2006–2008 | |
| Leola Wildlife Area | Adams | 2000, 2008, 2010, 2012–2015 | |
| Marbleseed Prairie | Green | 2001–2008, 2010, 2012–2013 | |
| Puchyan Prairie | Green Lake | 2001–2002, 2005–2007, 2009–2015 | |
| Semrad Slough | Grant | 2012–2014 | |
| St. Croix County site 1 * | St. Croix | 2000 | |
| St. Croix County sites 2–3, 6–8, 11 | St. Croix | 2000 | |
| White River Wildlife Area | Green Lake | 2001–2015 | |
| Heaths | Douglas County Wildlife Area | Douglas | 2003, 2005, 2011–2015 |
| Dunbar Barrens | Marinette | 2002–2011 | |
| Marinette County Forest | Marinette | 2002–2014 | |
| Moquah | Bayfield | 2001–2002, 2004–2015 | |
| Spread Eagle | Florence | 2002–2003, 2005–2011 |
Appendix B. Literature Citations of 1977–2015 4th of July (NABA) Butterfly Count Program
- Hathaway, M. (Ed.) 1977 Butterfly Count Report, Wings; The Xerces Society: Portland: OR, USA, 1977; Volume 4, pp. 1–11.
- Hathaway, M. (Ed.) 1977 Butterfly Count Report!!! Wings; The Xerces Society: Portland: OR, USA 1978; Volume 4 and 5, pp. 4–10.
- Hathaway, M. (Ed.) 1978 Fourth of July Butterfly Count Report, Wings; The Xerces Society: Portland: OR, USA; 1978, Volume 5, pp. 7–11.
- Heller, I. 1980 Butterfly Count Results; Atala Supplement Volume 8; The Xerces Society: Portland: OR, USA, 1980 [1982].
- Heller, I. 1981 Butterfly Count Results; Atala Supplement Volume 8; The Xerces Society: Portland: OR, USA, 1980 [1982].
- Opler, P.A.; Brown, J.W. (Eds.) Butterfly Counts 1987; Supplement to Atala Volume 16; The Xerces Society: Portland, OR, USA, 1988.
- Opler, P.A.; Brown, J.W. (Eds.) Fourth of July Butterfly Counts 1988 Report; The Xerces Society: Portland, OR, USA, 1989.
- Opler, P.A.; Brown, J.W. (Eds.) Fourth of July Butterfly Counts 1989 Report; The Xerces Society: Portland, OR, USA, 1990.
- Opler, P.A.; Brown, J.W. (Eds.) Fourth of July Butterfly Counts 1990 Report; The Xerces Society: Portland, OR, USA, 1991.
- Opler, P.A.; Powell, J.A. (Eds.) Butterfly Counts 1982 & 1983; The Xerces Society: Portland, OR, USA, 1984.
- Opler, P.A.; Powell, J.A. (Eds.) Butterfly Counts 1984; The Xerces Society: Portland, OR, USA, 1985.
- Opler, P.A.; Powell, J.A. (Eds.) Butterfly Counts 1985; Supplement to Atala Volume 14; The Xerces Society: Portland, OR, USA, 1986.
- Opler, P.A.; Powell, J.A. (Eds.) Butterfly Counts 1986; Supplement to Atala Volume 15; The Xerces Society: Portland, OR, USA, 1987.
- Opler, P.A.; Swengel, A.B. (Eds.) Fourth of July Butterfly Counts 1991 Report; The Xerces Society: Portland, OR, USA, 1992.
- Opler, P.A.; Swengel, A.B. (Eds.) NABA-Xerces Fourth of July Butterfly Counts 1993 Report; North American Butterfly Association: Morristown, NJ, USA, 1994.
- Powell, J.A.; Sorenson, J.T. (Eds.) 1979 Butterfly Count Results; Supplement to Atala Volume 7 (August 1980); The Xerces Society: Berkeley, CA, USA, 1980.
- Pyle, S. Report of the Xerces Society 1st Annual Fourth of July Butterfly Count; Atala Supplement Volume 3; The Xerces Society: Berkeley, CA, USA, 1975; pp. 38–41.
- Swengel, A.B. (Ed.) 2001 Report NABA Butterfly Counts; North American Butterfly Association: Morristown, NJ, USA, 2002.
- Swengel, A.B.; Opler, P.A. (Eds.) Fourth of July Butterfly Counts 1992 Report; The Xerces Society: Portland, OR, USA, 1993.
- Swengel, A.B.; Opler, P.A. (Eds.) NABA-Xerces Fourth of July Butterfly Counts 1994 Report; North American Butterfly Association: Morristown, NJ, USA, 1995.
- Swengel, A.B.; Opler, P.A. (Eds.) NABA-Xerces Fourth of July Butterfly Counts 1995 Report; North American Butterfly Association: Morristown, NJ, USA, 1996.
- Swengel, A.B.; Opler, P.A. (Eds.) NABA Fourth of July Butterfly Counts 1996 Report; North American Butterfly Association: Morristown, NJ, USA, 1997.
- Swengel, A.B.; Opler, P.A. (Eds.) NABA Fourth of July Butterfly Counts 1997 Report; North American Butterfly Association: Morristown, NJ, USA, 1998.
- Swengel, A.B.; Opler, P.A. (Eds.) NABA Fourth of July Butterfly Counts 1998 Report; North American Butterfly Association: Morristown, NJ, USA, 1999.
- Swengel, A.B.; Opler, P.A. (Eds.) NABA Fourth of July Butterfly Counts 1999 Report; North American Butterfly Association: Morristown, NJ, USA, 2000.
- Swengel, A.B.; Opler, P.A. (Eds.) 2000 Report NABA Fourth of July Butterfly Counts; North American Butterfly Association: Morristown, NJ, USA, 2001.
- Swengel, A.B.; Swengel, S.R. (Eds.) 2002 Report NABA Butterfly Counts; North American Butterfly Association: Morristown, NJ, USA, 2003.
- Swengel, A.B.; Swengel, S.R. (Eds.) 2003 Report NABA Butterfly Counts; North American Butterfly Association: Morristown, NJ, USA, 2004.
- Swengel, A.B.; Swengel, S.R. (Eds.) 2004 Report NABA Butterfly Counts; North American Butterfly Association: Morristown, NJ, USA, 2005.
- Wander, S. (Ed.) 2005 Report NABA Butterfly Counts; North American Butterfly Association: Morristown, NJ, USA, 2006.
- Wander, S. (Ed.) 2006 Report NABA Butterfly Counts; North American Butterfly Association: Morristown, NJ, USA, 2007.
- Wander, S. (Ed.) 2007 Report NABA Butterfly Counts; North American Butterfly Association: Morristown, NJ, USA, 2008.
- Wander, S. (Ed.) 2008 Report NABA Butterfly Counts; North American Butterfly Association: Morristown, NJ, USA, 2009.
- Wander, S. (Ed.) 2009 Report NABA Butterfly Counts; North American Butterfly Association: Morristown, NJ, USA, 2010.
- Wander, S. (Ed.) 2010 Report NABA Butterfly Counts; North American Butterfly Association: Morristown, NJ, USA, 2011.
- Wander, S. (Ed.) 2011 Report NABA Butterfly Counts; North American Butterfly Association: Morristown, NJ, USA, 2012.
- Wander, S. (Ed.) 2012 Report NABA Butterfly Counts; North American Butterfly Association: Morristown, NJ, USA, 2013.
- Wander, S. (Ed.) 2013 Report NABA Butterfly Counts; North American Butterfly Association: Morristown, NJ, USA, 2014.
- Wander, S. (Ed.) 2014 Report NABA Butterfly Counts; North American Butterfly Association: Morristown, NJ, USA, 2015.
- Wander, S. (Ed.) 2015 Report NABA Butterfly Counts; North American Butterfly Association: Morristown, NJ, USA, 2016.
References
- Dennis, R.L.H. (Ed.) The Ecology of Butterflies in Britain; Oxford University Press: London, UK, 1992.
- Pollard, E.; Yates, T.J. Monitoring Butterflies for Ecology and Conservation; Chapman & Hall: London, UK, 1993. [Google Scholar]
- Roy, D.B.; Rothery, P.; Moss, D.; Pollard, E.; Thomas, J.A. Butterfly numbers and weather: Predicting historical trends in abundance and the future effects of climate change. J. Anim. Ecol. 2001, 70, 201–217. [Google Scholar] [CrossRef]
- Thomas, C.D.; Wilson, R.J.; Lewis, O.T. Short-term studies underestimate 30-generation changes in a butterfly metapopulation. Proc. R. Soc. Lond. B 2002, 269, 563–569. [Google Scholar] [CrossRef] [PubMed] [Green Version]
- Ferster, B.; Vulinec, K. Population size and conservation of the last eastern remnants of the regal fritillary, Speyeria idalia (Drury) [Lepidoptera, Nymphalidae]; implications for temperate grassland restoration. J. Insect Conserv. 2010, 14, 31–42. [Google Scholar] [CrossRef]
- Cormont, A.; Malinowska, A.H.; Kostenko, O.; Radchuk, V.; Hemerik, L.; WallisDeVries, M.F.; Verboom, J. Effect of local weather on butterfly flight behaviour, movement, and colonization: Significance for dispersal under climate change. Biodivers. Conserv. 2011, 20, 483–503. [Google Scholar] [CrossRef]
- Thomas, J.A.; Simcox, D.J.; Hovestadt, T. Evidence based conservation of butterflies. J. Insect Conserv. 2011, 15, 241–258. [Google Scholar] [CrossRef]
- Bureau of Endangered Resources. The Endangered and Threatened Invertebrates of Wisconsin; Wisconsin Department of Natural Resources: Madison, WI, USA, 1999.
- U.S. Fish and Wildlife Service. Endangered and Threatened Wildlife and Plants; 90-Day Findings on 25 Petitions. Fed. Regist. 2015, 80, 56424–56425. [Google Scholar]
- Hammond, P.C.; McCorkle, D. The decline and extinction of Speyeria populations resulting from human environmental disturbances (Nymphalidae: Argynninae). J. Res. Lepidoptera 1984, 22, 217–224. [Google Scholar]
- Opler, P.A.; Krizek, G.O. Butterflies East of the Great Plains; Johns Hopkins University Press: Baltimore, MD, USA, 1984. [Google Scholar]
- Scott, J.A. The Butterflies of North America; Stanford University Press: Stanford, CA, USA, 1986. [Google Scholar]
- Swengel, A.B. Habitat associations of sympatric violet-feeding fritillaries (Euptoieta, Speyeria, Boloria) (Lepidoptera: Nymphalidae) in tallgrass prairie. Great Lakes Entomol. 1997, 30, 1–8. [Google Scholar]
- Wagner, D.L.; Wallace, M.S.; Boettner, G.H.; Elkinton, J.S. Status update and life history studies on the regal fritillary (Lepidoptera: Nymphalidae). In Grasslands of Northeastern North America: Ecology and Conservation of Native and Agricultural Landscapes; Vickery, P.D., Dunwiddie, P.W., Eds.; Massachusetts Audubon Society: Lincoln, MA, USA, 1997; pp. 261–275. [Google Scholar]
- Swengel, A.B.; Swengel, S.R. Spatiotemporal variation of violet-feeding large fritillaries (Euptoieta, Speyeria) (Lepidoptera: Nymphalidae) in central and northern Wisconsin. Great Lakes Entomol. 2009, 42, 121–138. [Google Scholar]
- Swartz, M.T.; Ferster, F.; Vulinec, K.; Paulson, G. Measuring regal fritillary butterfly (Speyeria idalia) habitat requirements in south-central Pennsylvania: Implications for the conservation of an imperiled butterfly. Northeast. Nat. 2015, 22, 812–829. [Google Scholar] [CrossRef]
- Sedman, Y.; Hess, D.F. The Butterflies of West Central Illinois; Series in the Biological Sciences No. 11; Western Illinois University: Macomb, IL, USA, 1985. [Google Scholar]
- Johnson, K. Prairie and plains disclimax and disappearing butterflies in the central United States. Atala 1986, 10–12, 20–30. [Google Scholar]
- Heitzman, J.R.; Heitzman, J.E. Butterflies and Moths of Missouri; Missouri Department of Conservation: Jefferson City, MO, USA, 1987.
- Royer, R.A. Butterflies of North. Dakota: An Atlas and Guide, 2nd ed.; Minot State University Press: Minot, ND, USA, 2003. [Google Scholar]
- Nagel, H.; Nightengale, T.; Dankert, N. Regal fritillary butterfly population estimation and natural history on Rowe Sanctuary, Nebraska. Prairie Nat. 1991, 23, 145–152. [Google Scholar]
- Iftner, D.C.; Shuey, J.A.; Calhoun, J.V. Butterflies and Skippers of Ohio; Bulletin of the Ohio Biological Survey New Series; College of Biological Sciences: Athens, OH, USA, 1992; Volume 9. [Google Scholar]
- Schweitzer, D. Regal Fritillaries in the East. Am. Butterflies 1993, 1, 9. [Google Scholar]
- Swengel, A.B. Regal fritillary: Prairie royalty. Am. Butterflies 1993, 1, 4–9. [Google Scholar]
- Allen, T.J. The Butterflies of West Virginia and Their Caterpillars; University of Pittsburgh Press: Pittsburgh, PA, USA, 1997. [Google Scholar]
- Debinski, D.M.; Kelly, L. Decline of Iowa populations of the regal fritillary (Speyeria idalia) Drury. J. Iowa Acad. Sci. 1998, 105, 16–22. [Google Scholar]
- Layberry, R.A.; Hall, P.A.; Lafontaine, J.D. The Butterflies of Canada; University of Toronto Press: Toronto, ON, USA, 1998. [Google Scholar]
- Schlicht, D.W.; Orwig, T.T. The status of Iowa’s Lepidoptera. J. Iowa Acad. Sci. 1998, 105, 82–88. [Google Scholar]
- Williams, B. Regal fritillaries in a tailspin. Am. Butterflies 1999, 7, 16–25. [Google Scholar]
- Schlicht, D.W.; Downey, J.C.; Nekola, J.C. The Butterflies of Iowa; University of Iowa Press: Iowa City, IA, USA, 2007. [Google Scholar]
- Kelly, L.; Debinski, D.M. Relationship of host plant density to size and abundance of the regal fritillary Speyeria idalia Drury (Nymphalidae). J. Lepidopterists Soc. 1998, 52, 262–276. [Google Scholar]
- Swengel, A.B.; Swengel, S.R. A ten-year study of the status and trend of the regal fritillary Speyeria idalia (Lepidoptera: Nymphalidae) in Wisconsin, USA. Great Lakes Entomol. 2001, 34, 111–128. [Google Scholar]
- Swengel, A.B.; Swengel, S.R. A ten-year study to monitor populations of the regal fritillary, Speyeria idalia, (Lepidoptera: Nymphalidae) in Wisconsin, USA. Great Lakes Entomol. 2001, 34, 97–115. [Google Scholar]
- Powell, A.F.L.A.; Busby, W.H.; Kindscher, K. Status of the regal fritillary (Speyeria idalia) and effects of fire management on its abundance in northeastern Kansas, USA. J. Insect Conserv. 2007, 11, 281–285. [Google Scholar] [CrossRef]
- Schlicht, D.W.; Swengel, A.B.; Swengel, S.R. Meta-analysis of survey data to assess trends of prairie butterflies in Minnesota, USA during 1979–2005. J. Insect Conserv. 2009, 13, 429–447. [Google Scholar] [CrossRef]
- Swengel, S.R.; Schlicht, D.; Olsen, F.; Swengel, A. Declines of prairie butterflies in the midwestern USA. J. Insect Conserv. 2011, 15, 327–339. [Google Scholar] [CrossRef]
- Swengel, S.R.; Swengel, A.B. Status and Trend of Regal Fritillary (Speyeria idalia) (Lepidoptera: Nymphalidae) in the 4th of July Butterfly Count Program in 1977–2014. Scientifica 2016. [Google Scholar] [CrossRef] [PubMed]
- Kopper, B.J.; Charlton, R.E.; Margolies, D.C. Oviposition site selection by the regal fritillary, Speyeria idalia, as affected by proximity of violet host plants. J. Insect Behav. 2000, 13, 651–665. [Google Scholar] [CrossRef]
- Swengel, A.B. Effects of fire and hay management on abundance of prairie butterflies. Biol. Conserv. 1996, 76, 73–85. [Google Scholar] [CrossRef]
- Swengel, A.B. Effects of management on butterfly abundance in tallgrass prairie and pine barrens. Biol. Conserv. 1998, 83, 77–89. [Google Scholar] [CrossRef]
- Swengel, A.B.; Swengel, S.R. Co-occurrence of prairie and barrens butterflies: Applications to ecosystem conservation. J. Insect Conserv. 1977, 1, 131–144. [Google Scholar] [CrossRef]
- Opler, P.A. Lepidoptera of North America. 2. Distribution of the Butterflies (Papilionoidea and Hesperioidea) of the Eastern United States; C.P. Gillette Museum of Insect Biodiversity: Fort Collins, CO, USA, 1995. [Google Scholar]
- Swengel, S.R.; Swengel, A.B. Influences of seasonal and daily timing on detection of grassland birds. Passenger Pigeon 2000, 62, 25–237. [Google Scholar]
- Swengel, S.R.; Swengel, A.B. Short-eared Owl abundance and conservation recommendations in relation to site and vegetative characteristics, with notes on Northern Harriers. Passenger Pigeon 2014, 76, 51–68. [Google Scholar]
- U.S. Fish and Wildlife Service. U.S. Fish and Wildlife Service Final Recovery Plan for the Karner Blue Butterfly (Lycaeides melissa samuelis); Department of Interior, U.S. Fish and Wildlife Service: Fort Snelling, MN, USA, 2003.
- Swengel, A.B.; Swengel, S.R. Effects of prairie and barrens management on butterfly faunal composition. Biodivers. Conserv. 2001, 10, 1757–1785. [Google Scholar] [CrossRef]
- Swengel, A.B.; Swengel, S.R. Long-term population monitoring of the Karner Blue (Lepidoptera: Lycaenidae) in Wisconsin, 1990–2004. Great Lakes Entomol. 2005, 38, 107–134. [Google Scholar]
- Swengel, A.B.; Swengel, S.R. The butterfly fauna of Wisconsin bogs: Lessons for conservation. Biodivers. Conserv. 2010, 19, 3565–3581. [Google Scholar] [CrossRef]
- Swengel, A.B.; Swengel, S.R. High and dry or sunk and dunked: Lessons for tallgrass prairies from quaking bogs. J. Insect Conserv. 2011, 15, 165–178. [Google Scholar] [CrossRef]
- Swengel, S.R.; Swengel, A.B. Assessing abundance patterns of specialized bog butterflies over 12 years in northern Wisconsin USA. J. Insect Conserv. 2015, 19, 293–304. [Google Scholar] [CrossRef]
- Toepfer, J.E. Prairie Chickens & Grasslands: 2000 and Beyond; Septon, G., Ed.; Soc. of Tympanuchus Cupido Pinnatus, Ltd.: Elm Grove, WI, USA, 2003. [Google Scholar]
- Ferge, L. 1990 Wisconsin Lepidoptera season summary. Newsl. Wis. Entomol. Soc. 1991, 18, 3–7. [Google Scholar]
- Borth, B. Regal fritillary butterflies. Newsl. Wis. Entomol. Soc. 1992, 19, 10–11. [Google Scholar]
- Pollard, E. A method for assessing changes in abundance of butterflies. Biol. Conserv. 1977, 12, 115–133. [Google Scholar] [CrossRef]
- Swengel, A.B.; Swengel, S.R. Benefit of permanent non-fire refugia for Lepidoptera conservation in fire-managed sites. J. Insect Conserv. 2007, 11, 263–279. [Google Scholar] [CrossRef]
- Ebner, J.A. The Butterflies of Wisconsin; Milwaukee Public Museum: Milwaukee, WI, USA, 1970. [Google Scholar]
- Anderson-Bell. ABstat User Manual, version 7.20; Anderson-Bell: Arvada, CO, USA, 1994.
- Thomas, J.A. A quick method for estimating butterfly numbers during surveys. Biol. Conserv. 1983, 27, 195–211. [Google Scholar] [CrossRef]
- Swengel, A.B. Monitoring butterfly populations using the Fourth of July Butterfly Count. Am. Midl. Nat. 1990, 124, 395–406. [Google Scholar] [CrossRef]
- Wood, E.M.; Pidgeon, A.M.; Gratton, C.; Wilder, T.T. Effects of oak barrens habitat management for Karner blue (Lycaeides samuelis) on the avian community. Biol. Conserv. 2011, 144, 3117–3126. [Google Scholar] [CrossRef]
- Parmesan, C.; Ryrholm, N.; Stefanescu, C.; Hill, J.K.; Thomas, C.D.; Descimon, H.; Huntley, B.; Kaila, L.; Kullberg, J.; Tammaru, T.; et al. Poleward shifts in geographic ranges of butterfly species associated with regional warming. Nature 1999, 399, 579–583. [Google Scholar] [CrossRef]
- Warren, M.S.; Hill, J.K.; Thomas, J.A.; Asher, J.; Fox, R.; Huntley, B.; Roy, D.B.; Telfer, M.G.; Jeffcoate, S.; Harding, P.; et al. Rapid responses of British butterflies to opposing forces of climate and habitat change. Nature 2001, 414, 65–69. [Google Scholar] [CrossRef] [PubMed]
- Franzén, M.; Öckinger, E. Climate-driven changes in pollinator assemblages during the last 60 years in an Arctic mountain region in northern Scandinavia. J. Insect Conserv. 2012, 16, 227–238. [Google Scholar] [CrossRef]
- Breed, G.A.; Stichter, S.; Crone, E. Climate-driven changes in northeastern US butterfly communities. Nat. Clim. Chang. 2013, 3, 142–145. [Google Scholar] [CrossRef]
- Mair, L.; Hill, J.K.; Fox, R.; Botham, M.; Brereton, T.; Thomas, C.D. Abundance changes and habitat availability drive species’ responses to climate change. Nat. Clim. Chang. 2014, 4, 127–131. [Google Scholar] [CrossRef]
- Mason, S.C.; Palmer, G.; Fox, R.; Gillings, S.; Hill, J.K.; Thomas, C.D.; Oliver, T.H. Geographical range margins of many taxonomic groups continue to shift polewards. Biol. J. Linn. Soc. 2015, 115, 586–597. [Google Scholar] [CrossRef]
- Maxwell, J.A.; Ferge, L.A. Report on a Survey of Lepidoptera at Fort McCoy 1992–1993. Unpublished report. 1994. [Google Scholar]
- Bidwell, A.D. Karner Blue Butterfly (Lycaeides melissa samuelis) Dispersal and Habitat Disturbance at Fort McCoy Military Reservation, Wisconsin. Master’s Thesis, University of Wisconsin, Stevens Point, WI, USA, 1995. [Google Scholar]
- Smith, M.A.; Turner, M.G.; Rusch, D.H. The Effect of Military Training Activity on Eastern Lupine and the Karner Blue Butterfly at Fort McCoy, Wisconsin, USA. Environ. Manag. 2002, 29, 102–115. [Google Scholar] [CrossRef]
- Guiney, M.S.; Andow, D.A.; Wilder, T.T. Metapopulation structure and dynamics of an endangered butterfly. Basic Appl. Ecol. 2010, 11, 354–362. [Google Scholar] [CrossRef]
- Willis, S.G.; Hill, J.K.; Thomas, C.D.; Roy, D.B.; Fox, R.; Blakeley, D.S.; Huntley, B. Assisted colonisation in a changing climate: A test-study using two UK butterflies. Conserv. Lett. 2009, 2, 45–51. [Google Scholar] [CrossRef]
- Thomas, C.D.; Gillingham, P.K.; Bradbury, R.B.; Roy, D.B.; Anderson, B.J.; Baxter, J.M.; Bourn, N.A.D.; Crick, H.Q.P.; Findon, R.A.; Fox, R.; et al. Protected areas facilitate species’ range expansions. Proc. Natl. Acad. Sci. USA 2012, 109, 14063–14068. [Google Scholar] [CrossRef] [PubMed]
- Filz, K.J.; Wiemers, M.; Herrig, A.; Weitzel, M.; Schmitt, T. A question of adaptability: Climate and habitat change lower trait diversity in butterfly communities in south-western Germany. Eur. J. Entomol. 2013, 110, 633–642. [Google Scholar] [CrossRef]
- Gillingham, P.K.; Allison, J.; Roy, D.B.; Fox, R.; Thomas, C.D. High abundance of species in protected areas in parts of their geographic distributions colonized during a recent period of climate change. Conserv. Lett. 2014, 8, 97–106. [Google Scholar] [CrossRef]
- Oliver, T.H.; Marshall, H.H.; Morecroft, M.D.; Brereton, T.; Prudhomme, C.; Huntingford, C. Interacting effects of climate change and habitat fragmentation on drought-sensitive butterflies. Nat. Clim. Chang. 2015, 5, 941–945. [Google Scholar] [CrossRef] [Green Version]
- Ries, L.; Debinski, D.M. Butterfly responses to habitat edges in the highly fragmented prairies of central Iowa. J. Anim. Ecol. 2001, 70, 840–852. [Google Scholar] [CrossRef]
- Shuey, J.; Jacquart, E.; Orr, S.; Becker, F.; Nyberg, A.; Littiken, R.; Anchor, T.; Luchik, D. Landscape-scale response to local habitat restoration in the regal fritillary butterfly (Speyeria idalia) (Lepidoptera: Nymphalidae). J. Insect Conserv. 2016, 20, 773–780. [Google Scholar] [CrossRef]
- Williams, A.H. In praise of grazing. Restor. Manag. Notes 1997, 15, 116–118. [Google Scholar] [CrossRef]
- Vogel, J.A.; Debinski, D.M.; Koford, R.R.; Miller, J.M. Butterfly responses to prairie restoration through fire and grazing. J. Insect Conserv. 2007, 11, 78–90. [Google Scholar] [CrossRef]
- Oliver, T.; Hill, J.K.; Thomas, C.D.; Brereton, T.; Roy, D.B. Changes in habitat specificity of species at their climatic range boundaries. Ecol. Lett. 2009, 12, 1091–1102. [Google Scholar] [CrossRef] [PubMed]
- Oliver, T.H.; Roy, D.B.; Brereton, T.; Thomas, J.A. Reduced variability in range-edge butterfly populations over three decades of climate warming. Glob. Chang. Biol. 2012, 18, 1531–1539. [Google Scholar] [CrossRef] [Green Version]
- Davis, J.D.; Debinski, D.M.; Danielson, B.J. Local and landscape effects on the butterfly community in fragmented Midwest USA habitats. Landsc. Ecol. 2007, 22, 1341–1354. [Google Scholar] [CrossRef]
- Moranz, R.A.; Debinski, D.M.; McGranahan, D.A.; Engle, D.M.; Miller, J.R. Untangling the effects of fire, grazing, and land-use legacies on grassland butterfly communities. Biodivers. Conserv. 2012, 21, 2719–2746. [Google Scholar] [CrossRef]
- Moranz, R.A.; Fuhlendorf, S.S.; Engle, D.M. Making sense of a prairie butterfly paradox: The effects of grazing, time since fire, and sampling period on regal fritillary abundance. Biol. Conserv. 2014, 173, 32–41. [Google Scholar] [CrossRef]


| Site (County) | N Surveyors | Years of Peak Counts by N Surveyors | ||
|---|---|---|---|---|
| One | Two | One Surveyor | Two Surveyors | |
| Long-Term Monitoring Sites | ||||
| Hogback (Crawford) | 1 | 23 | 1995 | |
| Muralt Bluff (Green) | 6 | 22 | 1996, 2006, 2012–2015 | |
| Oliver (Green) | 5 | 21 | 1996, 2012–2015 | |
| Pine Island (Columbia) | ||||
| site 1: dog training area | 17 | 6 | 1996, 1998–2002 | |
| site 2: west | 17 | 6 | 1996, 1998–2002 | |
| site 4: adjacent to, and east, of 1 | 15 | 1 | 2001 | |
| Thomson complex (Dane, Iowa) | ||||
| Thomson subsequent | 5 | 19 | 1994, 2012–2015 | |
| Thomson original | 6 | 20 | 1994, 1996, 2012–2015 | |
| Thousand’s II | 5 | 21 | 1996, 2012–2015 | |
| Buena Vista: | ||||
| West Central | 0 | 19 | ||
| North | 1 | 18 | 1 unit in 2012 | |
| Southeast | 1 | 18 | 2 units in 2012 | |
| Southwest | 0 | 18 | ||
| Other populations surveyed | ||||
| Barneveld (Iowa) | 4 | 9 | 2012–2015 | |
| Schurch-Thompson (Iowa) | 7 | 1 | 2009 | |
| Shea North (Iowa) | 5 | 2 | 2009, 2011 | |
| Shea South (Iowa) | 5 | 2 | 2009, 2011 | |
| Species found in only one year | ||||
| Bauer cut (Jackson) | 0 | 15 | ||
| Stanton Road (Jackson) | 2 | 23 | 1994, 2013 | |
| Roznos Meadows (Sauk) | 14 | 0 | ||
| Rush Creek (Crawford) | 0 | 15 | ||
| Spring Green (Sauk) | 6 | 18 | 2005–2006, 2011, 2013–2015 | |
| Year | Last | MDD First | MDD Last | First | Flight Span | Peak Survey in Long-Term Monitoring Units | ||||
|---|---|---|---|---|---|---|---|---|---|---|
| MDD | MDD | MDD | MDD | MDD | MDD | Days | ||||
| Before | After | Mean | Median | Min | Max | Range | ||||
| 1997 | 514 | 702 | 828 | 57 | 721 | 716 | 716 | 730 | 14 | |
| 1998 | 603 | 625 | 826 | 62 | 706 | 701 | 624 | 826 | 62 | |
| 1999 | 609 | 623 | 817 | 55 | 717 | 714 | 706 | 804 | 29 | |
| 2000 | 622 | 628 | 822 | 1004 | 55 | 713 | 711 | 704 | 802 | 29 |
| 2001 | 529 | 625 | 915 | 1014 | 82 | 715 | 711 | 710 | 807 | 28 |
| 2002 | 622 | 629 | 901 | 64 | 713 | 711 | 705 | 803 | 29 | |
| 2003 | 628 | 629 | 906 | 1004 | 69 | 722 | 718 | 705 | 906 | 63 |
| 2004 | 521 | 702 | 911 | 71 | 725 | 718 | 718 | 829 | 42 | |
| 2005 | 615 | 702 | 910 | 1015 | 70 | 709 | 709 | 702 | 715 | 13 |
| 2006 | 615 | 630 | 826 | 909 | 57 | 710 | 708 | 630 | 722 | 22 |
| 2007 | 617 | 630 | 903 | 908 | 65 | 705 | 704 | 630 | 715 | 15 |
| 2008 | 706 | 712 | 816 | 822 | 35 | 722 | 719 | 712 | 802 | 21 |
| 2009 | 626 | 705 | 823 | 827 | 49 | 716 | 712 | 705 | 823 | 49 |
| 2010 | 612 | 616 | 822 | 827 | 67 | 709 | 709 | 625 | 723 | 28 |
| 2011 | 613 | 701 | 826 | 909 | 56 | 716 | 715 | 704 | 807 | 34 |
| 2012 | 608 | 615 | 825 | 922 | 71 | 622 | 617 | 615 | 720 | 35 |
| 2013 | 619 | 704 | 906 | 913 | 64 | 719 | 714 | 714 | 816 | 33 |
| 2014 | 614 | 628 | 824 | 906 | 57 | 713 | 710 | 704 | 730 | 26 |
| 2015 | 616 | 622 | 830 | 912 | 69 | 707 | 703 | 627 | 815 | 49 |
| Date | Site | County | Source |
|---|---|---|---|
| 4 July 2007 | Woodman-Millville unit | Grant | Todd Sime (pers. comm. Karl Legler) |
| 16 August 2011 | Semrad Slough | Grant | Karl Legler (pers. comm. KL) |
| 8 June 2012 | Spring Green Preserve | Sauk | Ann Thering: www.wisconsinbutterflies.org |
| 6 July 2012 | Williams Street garden, Village of Biron | Wood | Connie Stout: www.wisconsinbutterflies.org |
| 1 September 2013 | Big Eau Pleine County Park | Marathon | Dan Belter: www.wisconsinbutterflies.org |
| Count | Latitude | Longitude | N Years Held | N Years Regals Found | FirstYear Held | Last Year Held | Total Regal Individuals | Year Regal Found | Nth Year Regal Found |
|---|---|---|---|---|---|---|---|---|---|
| Baraboo | 43.48 | −89.72 | 30 | 1 | 1986 | 2015 | 1 | 2004 | 19 |
| Madison | 43.1 | −89.38 | 25 | 1 | 1991 | 2015 | 1 | 2004 | 14 |
| Riveredge | 43.4 | −87.98 | 20 | 1 | 1987 | 2013 | 1 | 2003 | 12 |
| Trempealeau | 44.07 | −91.40 | 19 | 1 | 1997 | 2015 | 2 | 1997 | 1 |
| Wazee | 44.28 | −90.67 | 22 | 1 | 1994 | 2015 | 1 | 2014 | 21 |
| Site (County) | All Years Available | 1997–2015 (N = 19 Years) | |||
|---|---|---|---|---|---|
| N | r | p | R | p | |
| Hogback (Crawford) | 24 | 0.76321 | <0.01 | 0.55024 | <0.05 |
| Muralt Bluff (Green) | 28 | −0.55477 | <0.01 | −0.6662 | <0.01 |
| Oliver (Green) | 26 | −0.38383 | <0.10 | −0.1909 | NS |
| Pine Island (Columbia) | |||||
| site 1 (dog training area) | 23 | −0.526 | 0.01 | −0.7971 | <0.01 |
| site 2 (west) | 23 | −0.39606 | <0.10 | incalculable (all zeroes) | |
| Thomson complex (Dane, Iowa) | |||||
| Thousand’s II | 26 | 0.10565 | NS | −0.4355 | <0.10 |
| Thomson-original | 26 | 0.42929 | <0.05 | 0.11547 | NS |
| Thomson-subsequent | 24 | −0.17834 | NS | −0.6058 | <0.01 |
| Thousand’s II & Thomson sub. | 24 | −0.19313 | NS | −0.5994 | <0.01 |
| Buena Vista complex (Portage) | |||||
| units done 1997 to 2015 | 19 | −0.54035 | <0.05 | −0.5404 | <0.01 |
| units done 1998–2000 to 2015 | 16 | −0.74614 | <0.01 | -- | |
| Percent presence | 19 | −0.37544 | NS | −0.3754 | NS |
| Total individuals/total km | 19 | −0.69298 | <0.01 | −0.693 | <0.01 |
| West Central area | 19 | −0.43879 | <0.10 | −0.4388 | <0.10 |
| Barneveld | 13 | −0.48143 | <0.10 | -- | |
| Unit or Site Indices Being Correlated | N Years | r | p |
|---|---|---|---|
| RA on units surveyed each year 1997–2015 with: | |||
| Percent presence in all units surveyed each year | 19 | 0.71930 | <0.001 |
| RA on units only surveyed from 1998–2000 to 2015 | 16 | 0.89036 | <0.001 |
| RA of total individuals/total km | 19 | 0.74561 | <0.001 |
| RA on units only surveyed each year 1998–2000 to 2015 with: | |||
| Percent presence in all units surveyed each year | 16 | 0.72701 | <0.01 |
| RA of total individuals/total km | 16 | 0.90213 | <0.001 |
| Percent presence in all units surveyed each year with | |||
| RA of total regals/total km (all data) | 19 | 0.70000 | <0.001 |
| Subregion | North | Southeast | Southwest | |||
|---|---|---|---|---|---|---|
| r | p | r | p | r | p | |
| West Central | +0.62837 | <0.01 | +0.32625 | NS | +0.56944 | <0.05 |
| North | +0.02287 | NS | +0.35644 | NS | ||
| Southeast | +0.32951 | NS | ||||
| Subregion | N Years | r | p |
|---|---|---|---|
| West Central | 18 | −0.39339 | NS |
| North | 18 | −0.76979 | <0.01 |
| Southeast | 18 | −0.00829 | NS |
| Southwest | 18 | −0.20479 | NS |
| Subregion | North | Southeast | Southwest |
|---|---|---|---|
| West Central | 0.0045 | 0.0004 | <0.0001 |
| North | 0.3462 | 0.0946 | |
| Southeast | 0.1446 |
| Pool of Sites | N Years | r | p |
|---|---|---|---|
| Four sites 1990–2015 | 26 | −0.14195 | NS |
| Five sites 1992–2015 | 24 | −0.30492 | NS |
| Seven sites 1997–2015 | 19 | −0.45722 | <0.05 |
| Site | N Zeroes at End of Time Series | Prairie ha | Grassland ha | Prairie Planting | Never Burned Refugium | Fire Return Interval in Burned Units | Maximum Fire Extent in a Year | Other Broadcast Management |
|---|---|---|---|---|---|---|---|---|
| + p < 0.05 | ||||||||
| Hogback | 0 | 16 * | 16 * | yes | Yes | Zero then Mod | 30% | only CG until 1997; then Idle until 2004; then F and BC; also GG began in 2014. |
| + p > 0.10 | ||||||||
| Thomson original | 0 | 5 | 121 ** | no | No | Freq then Infreq | 100% | Freq mow |
| − p > 0.10 | ||||||||
| Oliver | 2 | 2 | no | no | Freq | 100% | Negligible | |
| − p < 0.10 | ||||||||
| Buena Vista West Central | 0 | 0 | 1350 *** | yes but tiny | yes | Infreq | <5% | Infreq but every year in parts: CG; CHG; Hay; Mow; Herb |
| − p < 0.05 | ||||||||
| Median of 7 sites | 0 | |||||||
| − p < 0.01 | ||||||||
| Thousand’s II | 0 | 2 | 121 ** | yes | no | Freq then Mod | 100% | Infreq mow |
| Thomson subsequent | 0 | 32 | 121 ** | yes | yes but decreasing to <0.5 ha | Mod | 50% | Infreq mow and BC; CG 2012–2014 entire patch |
| Muralt Bluff | 5 | 15 | 15 | no | No **** | Freq | 90% | Mod then freq BC + mow |
| Pine Island 1 (dog training) | 2 but 0 in 2007–2012 also | 20 | 121 | no | no | Mod | 50% | Infreq then mod BC and mow; recent herb |
| No trend | ||||||||
| Pine Island 2 (west) | 19 | 12 | 12 | no | no | Freq | 100% | Infreq BC and mow; recent herb |
© 2017 by the authors. Licensee MDPI, Basel, Switzerland. This article is an open access article distributed under the terms and conditions of the Creative Commons Attribution (CC BY) license ( http://creativecommons.org/licenses/by/4.0/).
Share and Cite
Swengel, A.B.; Swengel, S.R. Complex Messages in Long-Term Monitoring of Regal Fritillary (Speyeria idalia) (Lepidoptera: Nymphalidae) in the State of Wisconsin, USA, 1988–2015. Insects 2017, 8, 6. https://doi.org/10.3390/insects8010006
Swengel AB, Swengel SR. Complex Messages in Long-Term Monitoring of Regal Fritillary (Speyeria idalia) (Lepidoptera: Nymphalidae) in the State of Wisconsin, USA, 1988–2015. Insects. 2017; 8(1):6. https://doi.org/10.3390/insects8010006
Chicago/Turabian StyleSwengel, Ann B., and Scott R. Swengel. 2017. "Complex Messages in Long-Term Monitoring of Regal Fritillary (Speyeria idalia) (Lepidoptera: Nymphalidae) in the State of Wisconsin, USA, 1988–2015" Insects 8, no. 1: 6. https://doi.org/10.3390/insects8010006