
Injuries in Collegiate Women’s Volleyball: A Four-Year Retrospective Analysis


Abstract
:1. Introduction
2. Materials and Methods
2.1. Participants
2.2. Data Analysis
3. Results
4. Discussion
5. Conclusions
Acknowledgments
Author Contributions
Conflicts of Interest
References
- McCarroll, J.R.; Miller, J.M.; Ritter, M.A. Lumbar spondylolysis and spondylolisthesis in college football players: A prospective study. Am. J. Sports Med. 1986, 14, 404–406. [Google Scholar] [CrossRef] [PubMed]
- Gatt, C.J.; Hosea, T.M.; Palumbo, R.C.; Zawadsky, J.P. Impact loading of the lumbar spine during football blocking. Am. J. Sports Med. 1997, 25, 317–321. [Google Scholar] [CrossRef] [PubMed]
- Ranson, C.A.; Kerslake, R.W.; Burnett, A.F.; Batt, M.E.; Abdi, S. Magnetic resonance imaging of the lumbar spine in asymptomatic professional fast bowlers in cricket. J. Bone Jt. Surg. Br. 2005, 87, 1111–1116. [Google Scholar] [CrossRef] [PubMed]
- Eerkes, K. Volleyball injuries. Curr. Sports Med. Rep. 2012, 11, 251–256. [Google Scholar] [CrossRef] [PubMed]
- Bahr, R.; Karlsen, R.; Lian, O.; Ovrebo, R.V. Incidence and mechanisms of acute ankle inversion injuries in volleyball: A retrospective cohort study. Am. J. Sports Med. 1994, 22, 595–600. [Google Scholar] [CrossRef] [PubMed]
- Aagaard, H.; Scavenius, M.; Jorgensen, U. An epidemiological analysis of the injury pattern in indoor and in beach volleyball. Int. J. Sports Med. 1997, 18, 217–221. [Google Scholar] [CrossRef] [PubMed]
- Agel, J.; Palmieri-Smith, R.M.; Dick, R.; Wojtys, E.M.; Marshall, S.W. Descriptive epidemiology of collegiate women’s volleyball injuries: National Collegiate Athletic Association Injury Surveillance System, 1988–1989 through 2003–2004. J. Athl. Train. 2007, 42, 295–302. [Google Scholar] [PubMed]
- Nesic, G.; Ilic, V.; Sikimic, M.; Dopsaj, M. Incidence of volleyball injuries in elite junior female players: A retrospective cohort study. Br. J. Sports Med. 2011, 45, 546. [Google Scholar] [CrossRef]
- Yasher, K.; Liller, K.; Wong, S.; Jang, S.; Morris, B.; Konin, J. An analysis of volleyball injuries in female athletes in grades nine through twelve. Br. J. Sports Med. 2011, 45, 546. [Google Scholar] [CrossRef]
- Bahr, R.; Bahr, I.A. Incidence of acute volleyball injuries: A prospective cohort study of injury mechanisms and risk factors. Scand. J. Med. Sci. Sports 1997, 7, 166–171. [Google Scholar] [CrossRef] [PubMed]
- Bahr, R.; Lian, O.; Bahr, I.A. A twofold reduction in the incidence of acute ankle sprains in volleyball after the introduction of an injury prevention program: A prospective cohort study. Scand. J. Med. Sci. Sports 1997, 7, 172–177. [Google Scholar] [CrossRef] [PubMed]
- Verhagen, E.A.; Van der Beek, A.J.; Bouter, L.M.; Bahr, R.; Van Mechelen, W. A one season prospective cohort study of volleyball injuries. Br. J. Sports Med. 2004, 38, 477–481. [Google Scholar] [CrossRef] [PubMed]
- Reeser, J.C.; Verhagen, E.; Briner, W.W.; Askeland, T.; Bahr, R. Strategies for the prevention of volleyball related injuries. Br. J. Sports Med. 2006, 40, 594–600. [Google Scholar] [CrossRef] [PubMed]
- Zwerver, J.; Bredeweg, S.W.; van den Akker-Scheek, I. Prevalence of jumper’s knee among non-elite athletes from different sports: A cross-sectional survey. Am. J. Sports Med. 2011, 39, 1984–1988. [Google Scholar] [CrossRef] [PubMed]
- Visnes, H.; Bahr, R. Training volume and body composition as risk factors for developing jumper’s knee among young elite volleyball players. Scand. J. Med. Sci. Sports 2012, 23, 607–613. [Google Scholar] [CrossRef] [PubMed]
- Mjaanes, J.M.; Briner, W.W. Trends in shoulder injuries among elite volleyball players in the USA. Br. J. Sports Med. 2005, 39, 373–408. [Google Scholar]
- Reeser, J.C.; Gregory, A.; Berg, R.L.; Comstock, R.D. A comparison of women’s collegiate and girls’ high school volleyball injury data collected prospectively over a 4-year period. Sports Health 2015, 7, 504–510. [Google Scholar] [CrossRef] [PubMed]
- Sole, C.J.; Kavanaugh, A.A.; Reed, J.P.; Israetel, M.A.; Devine, L.E.; Ramsey, M.W.; Sands, W.A.; Stone, M.H. The sport performance enhancement group: A five-year analysis of interdisciplinary athlete development. In Proceedings of the 8th Annual Center of Excellence for Sport Science and Coach Education Coaches and Sport Science College, Johnson City, TN, USA, 13–14 December 2013. [Google Scholar]
- Sands, W.A.; Newman, A.P.; Harner, C.; Paulos, L.E.; Shultz, B.B. A two year study of injury in collegiate women’s gymnastics. Technique 1987, 7, 4–10. [Google Scholar]
- Sands, W.A.; Shultz, B.B.; Newman, A.P. Women’s gymnastics injuries: A 5-year study. Am. J. Sports Med. 1993, 21, 271–276. [Google Scholar] [CrossRef] [PubMed]
- Fuller, C.W.; Ekstrand, J.; Junge, A.; Andersen, T.E.; Bahr, R.; Dvorak, J.; Meeuwisse, W.H. Consensus statement on injury definitions and data collection procedures in studies of football (soccer) injuries. Scand. J. Med. Sci. Sports 2006, 16, 83–92. [Google Scholar] [CrossRef] [PubMed]
- Bahr, R. No injuries, but plenty of pain? On the methodology for recording overuse symptoms in sports. Br. J. Sports Med. 2009, 43, 966–972. [Google Scholar] [CrossRef] [PubMed]
- Datalys. NCAA Women’s Volleyball Injuries: Data from the 2004/2005–2008/2009 Seasons. Available online: http://www.datalyscenter.org/fact-sheets/ (accessed on 30 January 2017).
- Kerr, Z.Y.; Dompier, T.P.; Snook, E.M.; Marshall, S.W.; Klossner, D.; Hainline, B.; Corlette, J. National Collegiate Athletic Association Injury Surveillance System: Review of Methods for 2004–2005 Through 2013–2014 Data Collection. J. Athl. Train. 2014, 49, 552–560. [Google Scholar] [CrossRef] [PubMed]
- Pluim, B.M.; Fuller, C.W.; Batt, M.E.; Chase, L.; Hainline, B.; Miller, S.; Weber, K. Consensus statement on epidemiological studies of medical conditions in tennis. Br. J. Sports Med. 2009, 43, 893–897. [Google Scholar] [CrossRef] [PubMed]
- Fuller, C.W.; Molloy, M.G.; Bagate, C.; Bahr, R.; Brooks, J.H.M.; Donson, H.; Kemp, S.P.T.; McCrory, P.; McIntosh, A.S.; Meeuwisse, W.H.; et al. Consensus statement on injury definitions and data collection procedures for studies of injuries in rugby union. Br. J. Sports Med. 2007, 41, 328–331. [Google Scholar] [CrossRef] [PubMed]
- Ferretti, A.; Papandrea, P.; Conteduca, F.; Mariani, P.P. Knee ligament injuries in volleyball players. Am. J. Sports Med. 1992, 20, 203–207. [Google Scholar] [CrossRef] [PubMed]
- Briner, W.W.; Kacmar, L. Common injuries in volleyball. Mechanisms of injury, prevention and rehabilitation. Sports Med. 1997, 24, 65–71. [Google Scholar] [CrossRef] [PubMed]
- Sheppard, J.M.; Gabbett, T.; Taylor, K.L.; Dorman, J.; Lebedew, A.J.; Borgeaud, R. Development of a repeated-effort test for elite men’s volleyball. Int. J. Sports Physiol. Perform. 2007, 2, 292–304. [Google Scholar] [CrossRef] [PubMed]
- Ziv, G.; Lidor, R. Vertical jump in female and male volleyball players: A review of observational and experimental studies. Scand. J. Med. Sci. Sports 2010, 20, 556–567. [Google Scholar] [CrossRef] [PubMed]
- Bhairo, N.H.; Nijsten, M.W.; van Dalen, K.C.; ten Duis, H.J. Hand injuries in volleyball. Int. J. Sports Med. 1992, 13, 351–354. [Google Scholar] [CrossRef] [PubMed]
- Rettig, A.C. Epidemiology of hand and wrist injuries in sports. Clin. Sport Med. 2005, 17, 401–406. [Google Scholar] [CrossRef]
- Seminati, E.; Minetti, A.E. Overuse in volleyball training/practice: A review on shoulder and spine-related injuries. Eur. J. Sport Sci. 2013, 13, 732–743. [Google Scholar] [CrossRef] [PubMed]
- Clarsen, B.; Myklebust, G.; Bahr, R. Development and validation of a new method for the registration of overuse injuries in sports injury epidemiology: The Oslo Sports Trauma Research Centre (OSTRC) overuse injury questionnaire. Br. J. Sports Med. 2013, 47, 495–502. [Google Scholar] [CrossRef] [PubMed]
- James, L.P.; Kelly, V.G.; Beckman, E.M. Injury risk management plan for volleyball athletes. Sports Med. 2014, 44, 1185–1195. [Google Scholar] [CrossRef] [PubMed]
- Knapik, J.J.; Bauman, C.L.; Jones, B.H.; Harris, J.M.; Vaughan, L. Preseason strength and flexibility imbalances associated with athletic injuries in female collegiate athletes. Am. J. Sports Med. 1991, 19, 76–81. [Google Scholar] [CrossRef] [PubMed]
- Kennedy, M.D.; Fischer, R.; Fairbanks, K.; Lefaivre, L.; Vickery, L.; Molzan, J.; Parent, E. Can pre-season fitness measures predict time to injury in varsity athletes? A retrospective case control study. Sports Med. Arthrosc. Rehabil. Ther. Technol. 2012, 4, 26. [Google Scholar] [CrossRef] [PubMed]
- Sands, W.A. Conditioning for gymnastics: A dilemma. Technique 1985, 5, 4–7. [Google Scholar]
- Hulin, B.T.; Gabbett, T.J.; Blanch, P.; Chapman, P.; Bailey, D.; Orchard, J.W. Spikes in acute workload are associated with increased injury risk in elite cricket fast bowlers. Br. J. Sports Med. 2014, 48, 708–712. [Google Scholar] [CrossRef] [PubMed]
- Passer, M.W.; Seese, M.D. Life stress and athletic injury: Examination of positive versus negative events and three moderator variables. J. Hum. Stress 1983, 9, 11–16. [Google Scholar] [CrossRef] [PubMed]
- Williams, J.M.; Tonymon, P.; Wadsworth, W.A. Relationship of life stress to injury in collegiate volleyball. J. Hum. Stress 1986, 12, 38–43. [Google Scholar] [CrossRef] [PubMed]
- Kerr, G.; Minden, H. Psychological factors related to the occurrence of athletic injuries. J. Sport Exerc. Psychol. 1988, 10, 167–173. [Google Scholar] [CrossRef]
- Ivarsson, A.; Johnson, U.; Podlog, L. Psychological predictors of injury occurrence: A prospective investigation of professional Swedish soccer players. J. Sport Rehabil. 2013, 22, 19–26. [Google Scholar] [CrossRef] [PubMed]
- Mann, J.B.; Bryant, K.; Johnstone, B.; Ivey, P.; Sayers, S. The effect of physical and academic stress on illness and injury in division 1 college football players. J. Strength Cond. Res. 2016, 30, 20–25. [Google Scholar] [CrossRef] [PubMed]


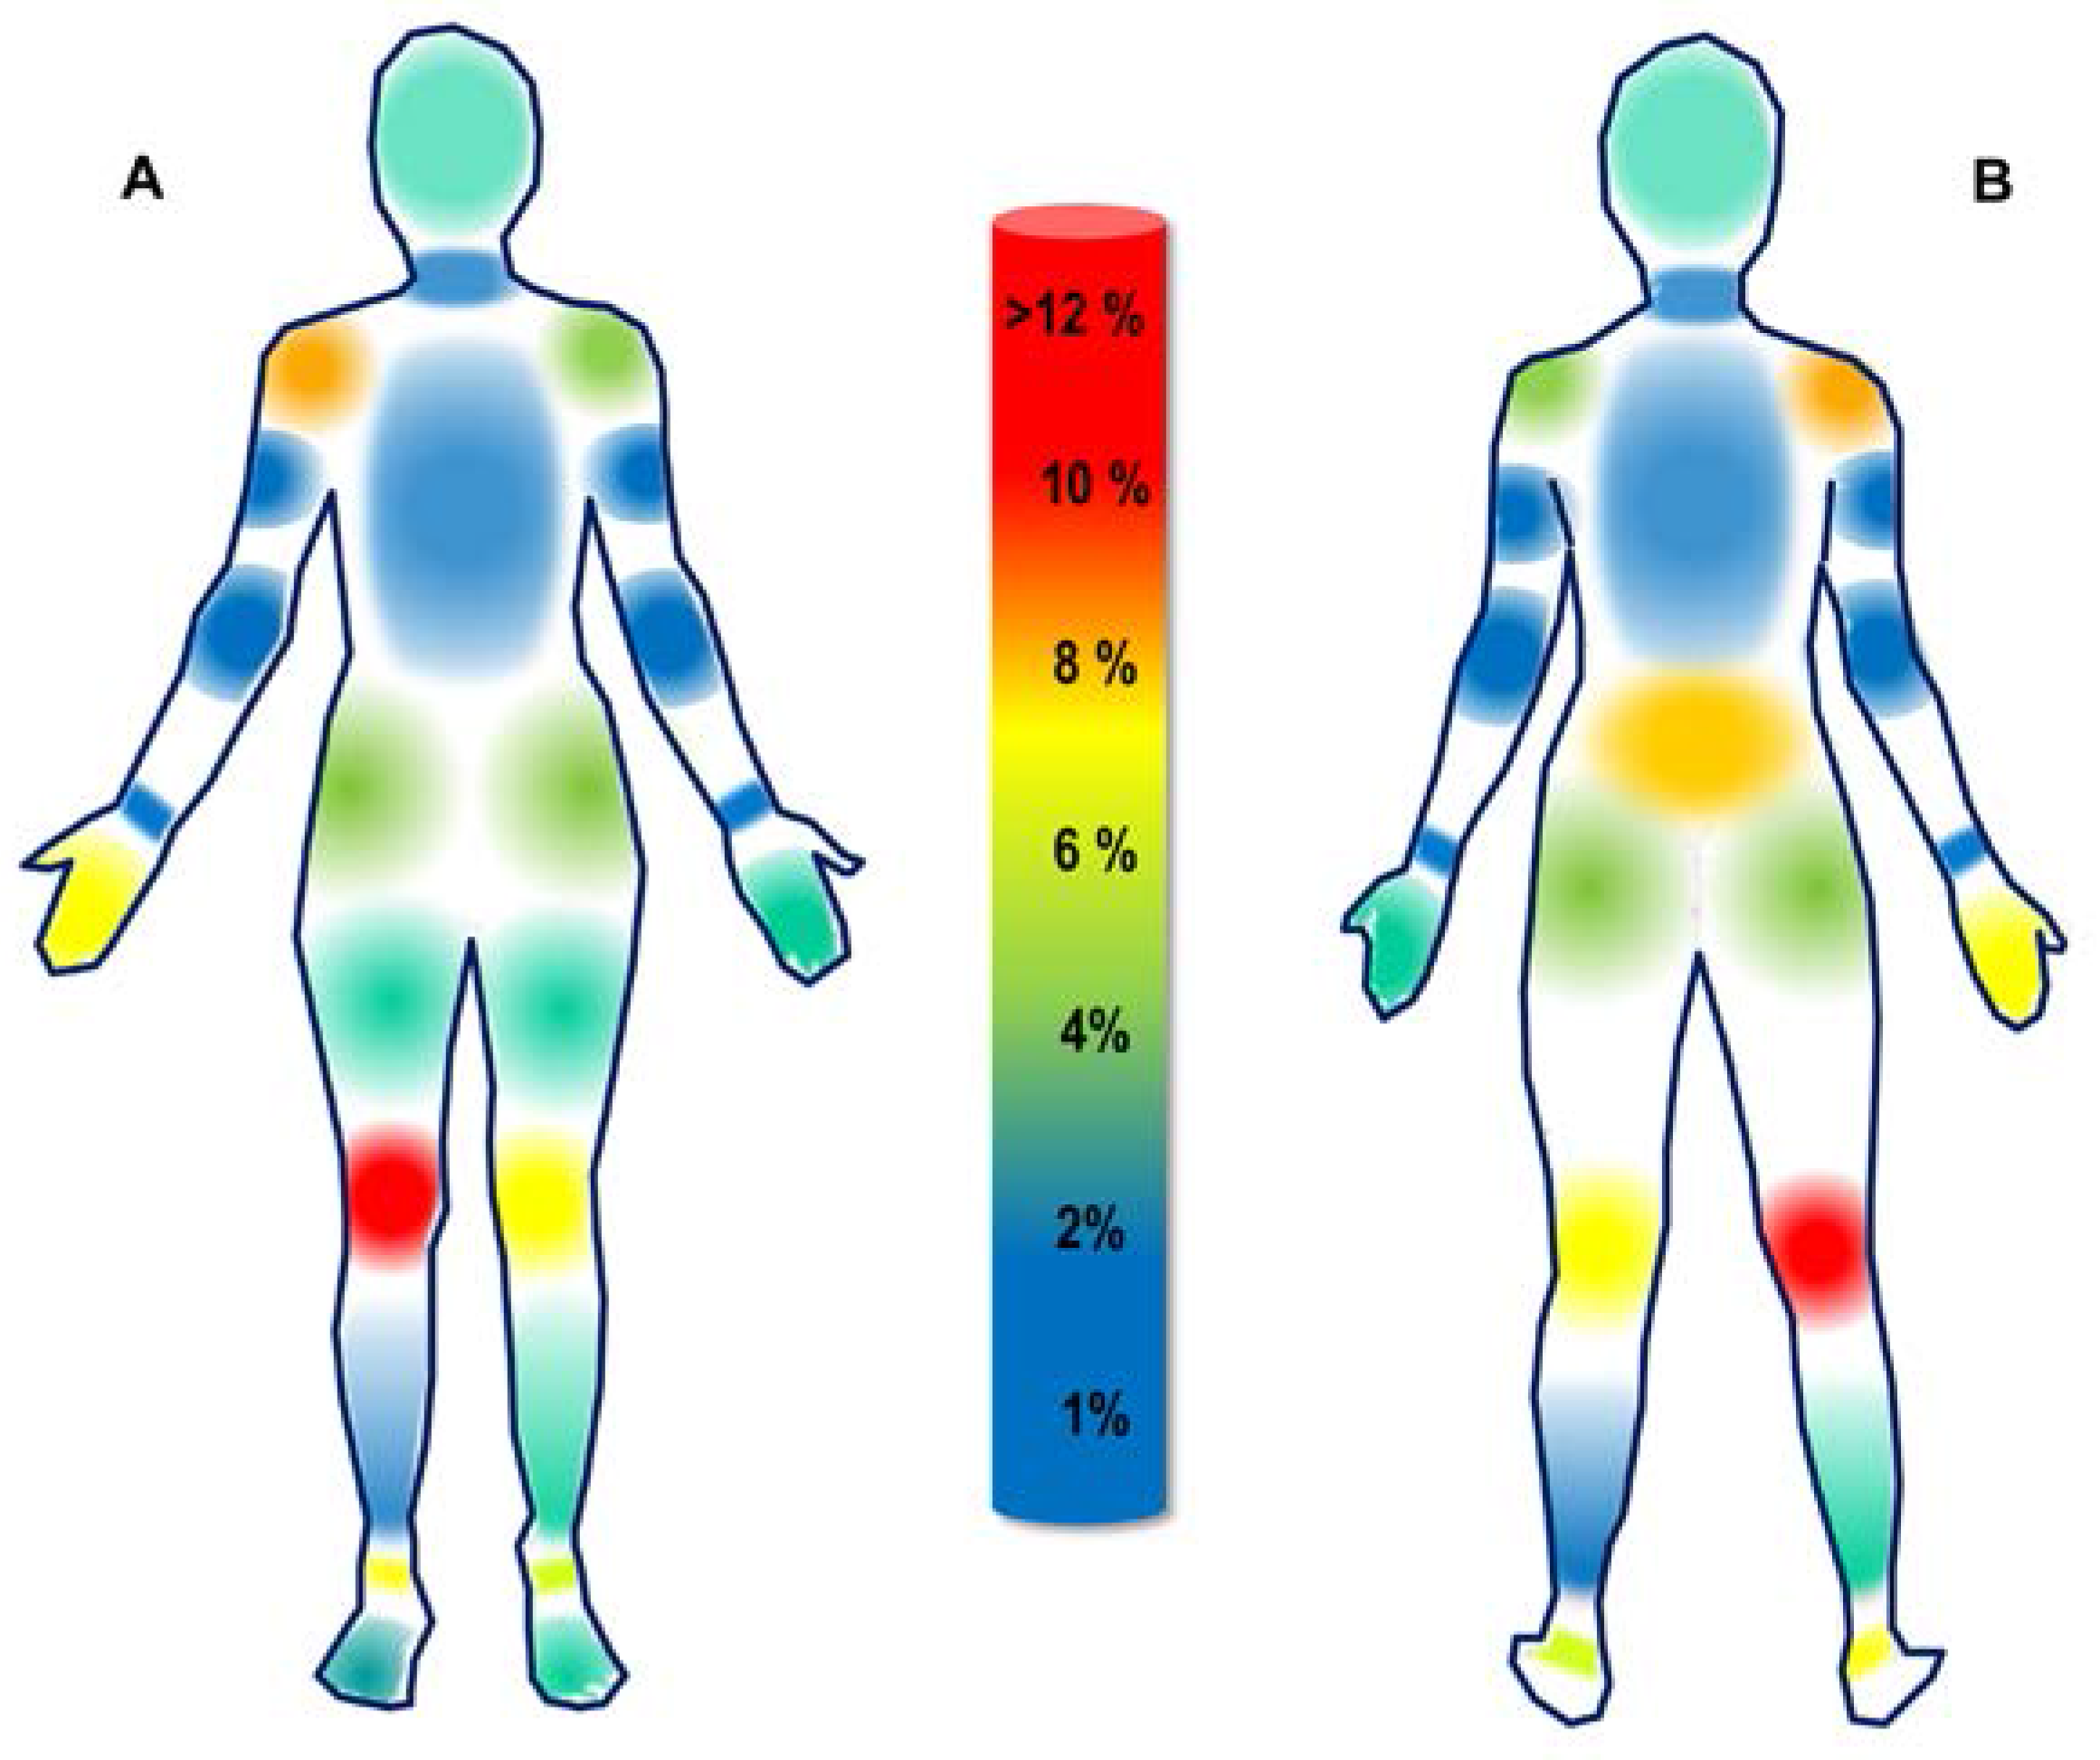
| Frequency | % of Total | |||
| Head | 3.0 | 2.3 | ||
| Neck | 2.0 | 1.5 | ||
| Torso | 3.0 | 2.3 | ||
| Lower Back | 10.0 | 7.5 | ||
| Area Total | 18.0 | 13.6 | ||
| Left Side | Right Side | |||
| Frequency | % of Total | Frequency | % of Total | |
| Shoulder | 5.0 | 3.8 | 11.0 | 8.3 |
| Upper Arm | 1.0 | 0.8 | 0.0 | 0.0 |
| Elbow | 1.0 | 0.8 | 1.0 | 0.8 |
| Wrist | 2.0 | 1.5 | 2.0 | 1.5 |
| Hand/Finger | 4.0 | 3.0 | 9.0 | 6.8 |
| Hip | 5.0 | 3.5 | 6.0 | 4.3 |
| Thigh | 3.0 | 2.3 | 4.0 | 3.0 |
| Knee | 10.0 | 7.5 | 16.0 | 12.0 |
| Shin | 4.0 | 3.0 | 1.0 | 0.8 |
| Calf | 1.0 | 0.8 | 3.0 | 2.3 |
| Ankle | 7.0 | 5.3 | 10.0 | 7.5 |
| Foot | 4.0 | 3.0 | 5.0 | 3.8 |
| Area Total | 47.0 | 35.3 | 68.0 | 51.1 |
| Grand Total | 133.0 | 100.0 | ||
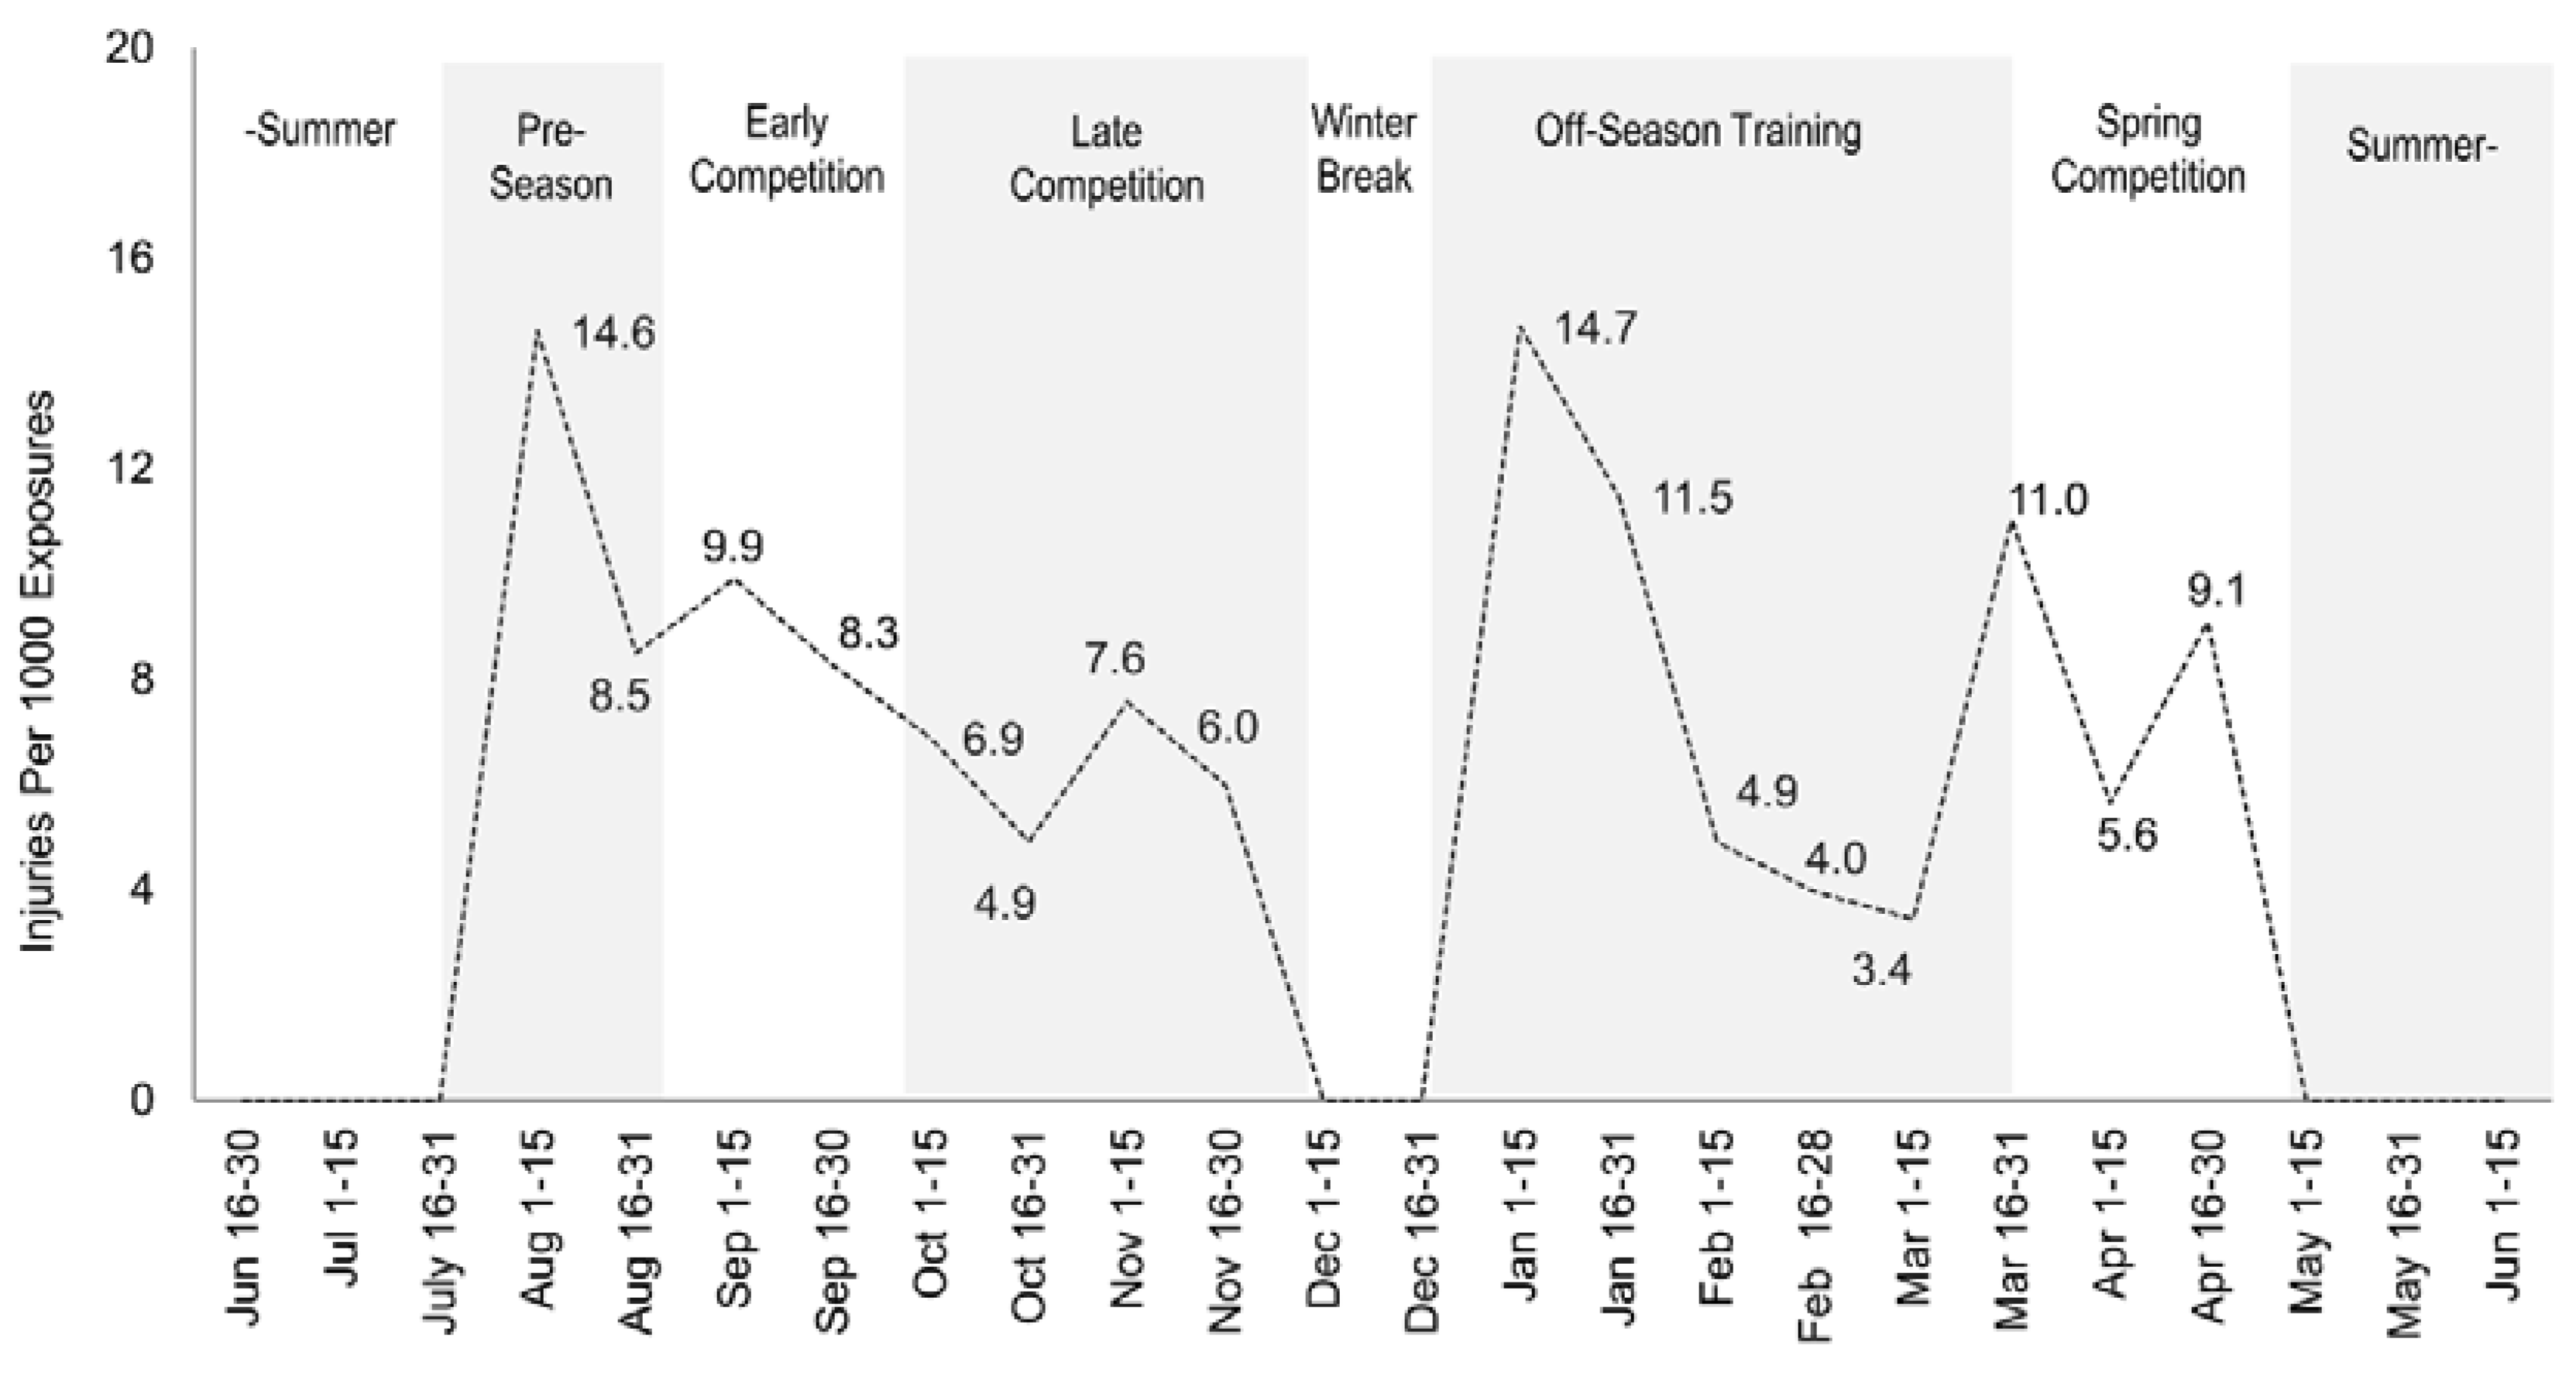
| Activity | Frequency | % of Total | Injuries per 1000 Exposures |
|---|---|---|---|
| Practice | 100.0 | 75.2 | 11.6 |
| Competition | 27.0 | 20.3 | 6.6 |
| Strength and Conditioning | 6.0 | 4.5 | 1.7 |
| Total | 133.0 | 100.0 |
| Type | Frequency | % of Total |
|---|---|---|
| Non-Contact Upper-Body | 35.0 | 26.3 |
| Non-Contact Lower-Body | 71.0 | 53.4 |
| Contact Upper-Body | 18.0 | 13.5 |
| Contact Lower-Body | 9.0 | 6.8 |
| Acute | 93.0 | 69.9 |
| Overuse | 40.0 | 30.1 |
© 2017 by the authors. Licensee MDPI, Basel, Switzerland. This article is an open access article distributed under the terms and conditions of the Creative Commons Attribution (CC BY) license (http://creativecommons.org/licenses/by/4.0/).
Share and Cite
Sole, C.J.; Kavanaugh, A.A.; Stone, M.H. Injuries in Collegiate Women’s Volleyball: A Four-Year Retrospective Analysis. Sports 2017, 5, 26. https://doi.org/10.3390/sports5020026
Sole CJ, Kavanaugh AA, Stone MH. Injuries in Collegiate Women’s Volleyball: A Four-Year Retrospective Analysis. Sports. 2017; 5(2):26. https://doi.org/10.3390/sports5020026
Chicago/Turabian StyleSole, Christopher J., Ashley A. Kavanaugh, and Michael H. Stone. 2017. "Injuries in Collegiate Women’s Volleyball: A Four-Year Retrospective Analysis" Sports 5, no. 2: 26. https://doi.org/10.3390/sports5020026
APA StyleSole, C. J., Kavanaugh, A. A., & Stone, M. H. (2017). Injuries in Collegiate Women’s Volleyball: A Four-Year Retrospective Analysis. Sports, 5(2), 26. https://doi.org/10.3390/sports5020026