Reproducibility of Blood Lactate Concentration Rate under Isokinetic Force Loads


1
Technische Universität Chemnitz, Center of Sport and Health Promotion, 09126 Chemnitz, Germany
2
Technische Universität Chemnitz, Institute of Human Movement Science and Health, 09126 Chemnitz, Germany
*
Author to whom correspondence should be addressed.
Sports 2018, 6(4), 150; https://doi.org/10.3390/sports6040150
Submission received: 10 October 2018
/
Revised: 5 November 2018
/
Accepted: 15 November 2018
/
Published: 20 November 2018
Abstract
:(1) Background: Maximum isokinetic force loads show strongly increased post-load lactate concentrations and an increase in the maximum blood lactate concentration rate (Lamax), depending on load duration. The reproducibility of Lamax must be known to be able to better assess training-related adjustments of anaerobic performance using isokinetic force tests. (2) Methods: 32 subjects were assigned to two groups and completed two unilateral isokinetic force tests (210° s−1, Range of Motion 90°) within seven days. Group 1 (n = 16; age 24.0 ± 2.8 years, BMI 23.5 ± 2.6 kg m−2, training duration: 4.5 ± 2.4 h week−1) completed eight repetitions and group 2 (n = 16; age 23.7 ± 1.9 years, BMI 24.6 ± 2.4 kg m−2, training duration: 5.5 ± 2.1 h week−1) completed 16 repetitions. To determine Lamax, capillary blood (20 µL) was taken before and immediately after loading, and up to the 9th minute post-load. Reproducibility and variability was determined using Pearson and Spearman correlation analyses, and variability were determined using within-subject standard deviation (Sw) and Limits of Agreement (LoA) using Bland Altman plots. (3) Results: The correlation of Lamax in group 1 was r = 0.721, and in group 2 r = 0.677. The Sw of Lamax was 0.04 mmol L−1 s−1 in both groups. In group 1, Lamax showed a systematic bias due to measurement repetition of 0.02 mmol L−1 s−1 in an interval (LoA) of ±0.11 mmol L−1 s−1. In group 2, a systematic bias of −0.008 mmol L−1 s−1 at an interval (LoA) of ±0.11 mmol L−1 s−1 was observed for repeated measurements of Lamax. (4) Conclusions: Based on the existing variability, a reliable calculation of Lamax seems to be possible with both short and longer isokinetic force loads. Changes in Lamax above 0.11 mmol L−1 s−1 due to training can be described as a non-random increase or decrease in Lamax.
1. Introduction
Maximum anaerobic loads result in increased lactate accumulation and, depending on the load duration (10 s vs. 30 s), in higher concentrations of post-load lactate [1]. Anaerobic performance can be determined using the blood lactate concentration. The anaerobic performance expressed by lactate concentration rate represents the stress of glycolysis [2]. The change in lactate concentration is determined over load duration. To avoid underestimating the rate of lactic acid formation, it is necessary to consider the alactacid time interval of the load duration. Up to now, the efficiency of anaerobic energy supply has been primarily investigated using running and bicycle ergometer loads [1,3,4,5,6]. This has already shown good to very good reproducibility of maximum power (Pmax) [4,5]. Adam et al. [5] found very good reproducibility of Lamax in anaerobic bicycle sprints over 15 s. When the load duration increases, Heck and Schulz [3] assume a reduction of Lamax. Empirical evidence of this was provided by Hauser [7].
Isokinetic force tests to determine muscle performance are important in sports practice and research [8]. Performing isokinetic force tests at maximum performance may show the performance of anaerobic metabolism. The strong metabolic stress of the anaerobic energy metabolism at maximum isokinetic loads is characterized by strongly increased post-load lactate concentrations and a resulting maximum lactate concentration rate (Lamax) [9]. Lamax increases with accelerations in movement velocity under isokinetic force loads [10]. Studies on anaerobic performance under isokinetic force loads have shown good to excellent reproducibility of performance and torque [11,12,13,14,15]. Furthermore, Bosquet et al. [16] showed a high correlation of the “total work” between bicycle sprints (Wingate-Test) and isokinetic leg extension movements. Similar results were obtained when comparing a Wingate-Test and a sprint test in running [6,17].
Compared to an isokinetic bicycle sprint, it is possible to make statements about the local performance of muscles using an isokinetic strength test. This can be important for sports with high strength components and dominant anaerobic demands on energy metabolism, such as martial arts, gymnastics, and strength sports, such as CrossFit or weight lifting.
However, due to the lower active muscle content in the isokinetic force test compared to the bicycle sprint and therefore changed lactate invasion and elimination, the absolute glycolysis rates are not directly comparable [9]. A unilateral isokinetic strength test with one leg primarily stresses the leg muscles. A bicycle test also involves parts of the trunk, in addition to both legs. It is therefore questionable whether the results of high reproducibility for Lamax in the bicycle sprint can be transferred to isokinetic force tests. So far, no investigations on the reproducibility of Lamax under isokinetic force loads have been carried out. Knowledge of the reproducibility and thus the variability of Lamax in isokinetic force tests is important to explain the changes in local anaerobic performance. This makes it easier to interpret the effects of training intervention (especially local resistance training) on anaerobic performance. Since Lamax appears to depend on the duration of an anaerobic test, it should be clarified how variability presents itself at different load durations. The aim of the present study was to investigate the reproducibility of Lamax under isokinetic force loads as a function of load duration (tload).
2. Materials and Methods
Thirty two trained male subjects (age 23.9 ± 2.4 years, body height 177.0 ± 8.3 cm, body mass 76.3 ± 11.5 kg, BMI 24.1 ± 0.1 kg m−2, practiced sports: soccer, endurance, martial arts, strength training) agreed to voluntary participation in the study after receiving oral and written information. The study was approved by the local ethical committee (V-297-17-HS-Lactate-18102018) and conducted in accordance with the Declaration of Helsinki. The subjects were then assigned to two groups and completed two single-legged isokinetic force tests (CON-TREX® MJ, PHYSIOMED®, Schnaittach, Germany) with unilateral knee flexion and extension movements (Range of Motion 90°) within seven days of each other. The upper body was immobilized with belts and the non-active leg was also immobilized. The subjects were instructed to perform each movement (flexion and extension) at maximum power. The movement velocity was chosen as 210° s−1, since this was the highest Lamax was found in pretests.
Group 1 (age 24.0 ± 2.8 years, body height 174.8 ± 10.2 cm, body mass 72.3 ± 12.1 kg, BMI 23.5 ± 2.6 kg m−2, training scope per week 4.5 ± 2.4 h) completed eight repetitions, and group 2 (age 23.7 ± 1.9 years, body height 178.8 ± 5.2 cm, body mass 78.9 ± 8.5 kg, BMI 24.6 ± 2.4 kg m−2, training scope per week 5.5 ± 2.1 h) completed 16 repetitions.
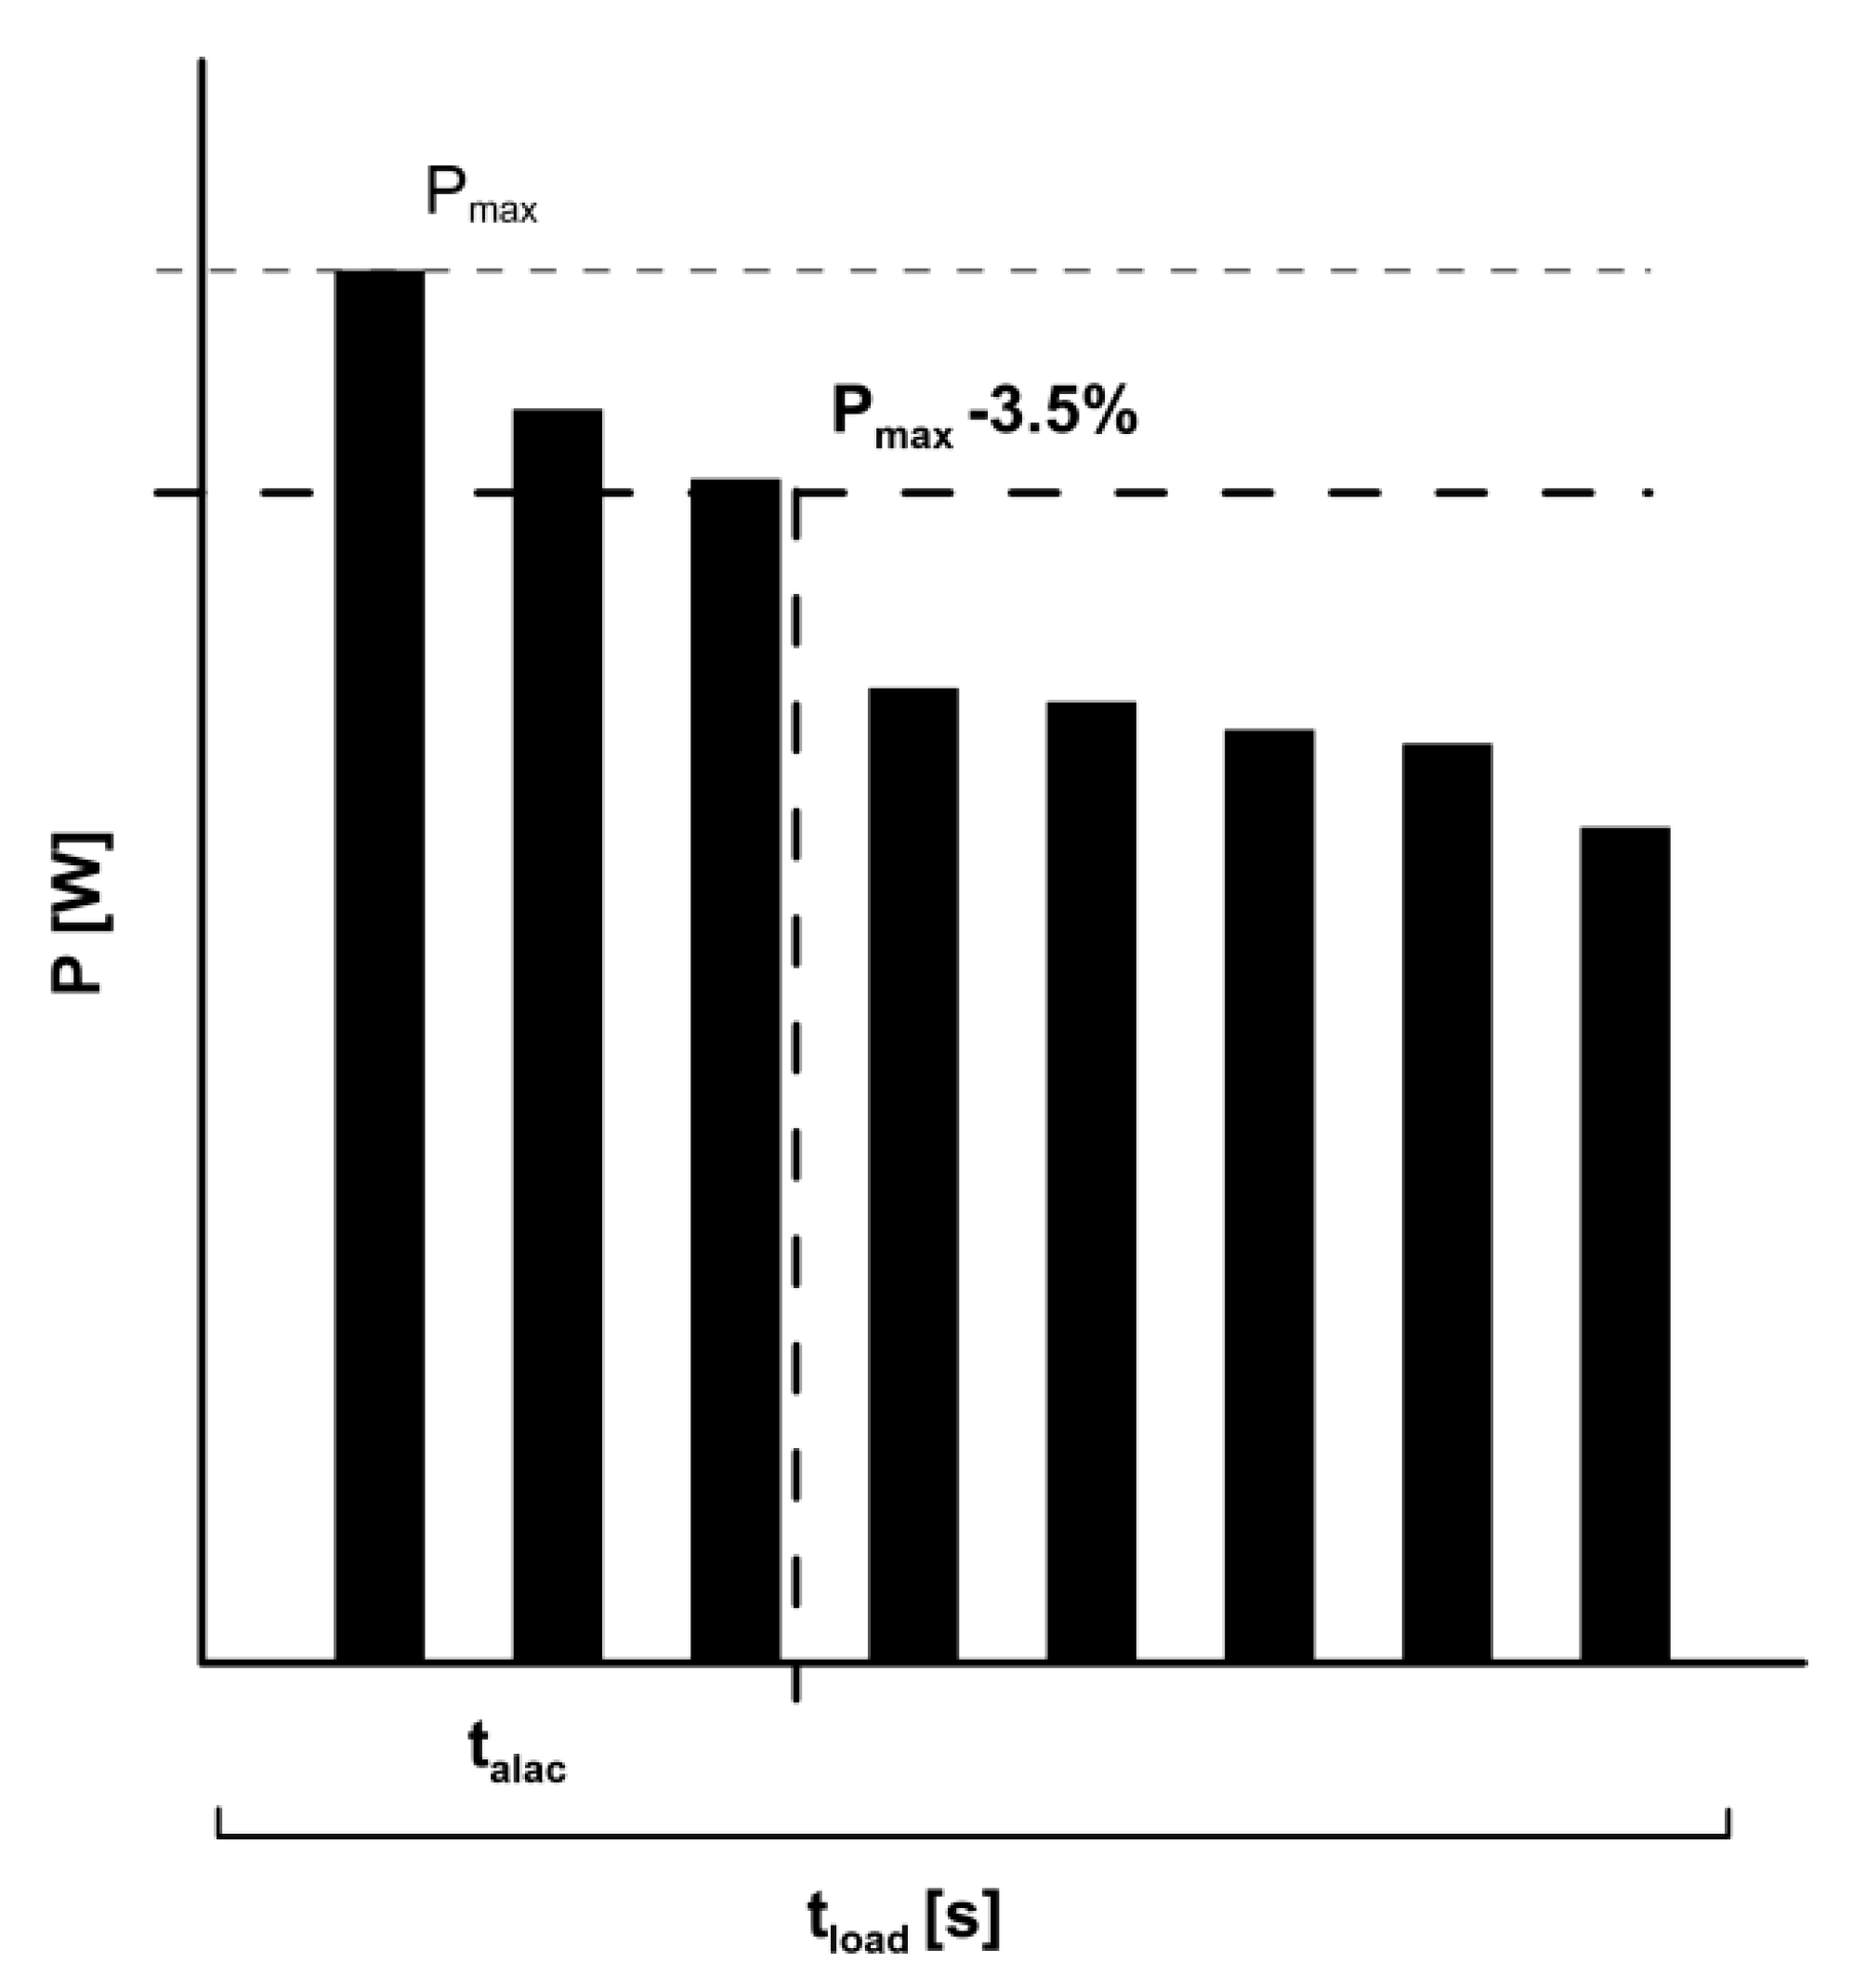
Before each measurement, two capillary blood samples were taken from the earlobe to determine resting lactate (RL). Immediately after loading, capillary blood (20 µL) was drawn every 30 s until the third minute post-loading. Subsequently, capillary blood was taken every minute until the 9th minute post-loading. The calculation (1) of Lamax was done according to the model by Mader [2] and Heck and Schulz [3]. The maximum blood lactate in the post-loading period (Lamax), resting lactate (RL), test duration (tload), and the alactic time interval (talac) were used to determine Lamax [3]. The alactic time interval (Figure 1) is the range from the start of the test to the time at which the maximum power (Pmax) has dropped by 3.5% [5,18].
The Shapiro-Wilk test was used to check the normal distribution of the variables Lamax, Lamax, tload, RL, Pmax and talac. A paired t-test was performed to test for significant differences in RL and tload between Test 1 and Test 2. For normally distributed data, linear correlations were tested using Pearson’s correlation. The Spearman’s rho was used for data that showed no normal distribution. Cohen and Manion [19] was used to assess the linear relationship between Test 1 and Test 2. Bland and Altman plots (BA plots) were used to test the dependence of the measurement differences between Test 1 and Test 2 for homoscedasticity [20]. The Limits of Agreement (LoA) were calculated from the mean difference (MWDiff) ± standard deviation * 1.96. Non-normally distributed differences for talac and Pmax were calculated using the non-parametric LoA method (medianDiff) based on the 2.5 (Q0.025) and 97.5 percentiles (Q0.975) [21]. The measurement error as within-subject standard deviation (Sw) was calculated to determine the variability of the variables Lamax, Lamax, Pmax, and talac [22]. The Sw (Sw-norm in %) was normalized by dividing the Sw by the group mean * 100. The significance level was 5%.
3. Results
3.1. T-Tests and Correlations
In group 1, an RL of 0.86 ± 0.22 mmol L−1 was present before Test 1 and 0.91 ± 0.35 mmol L−1 in Test 2 (p > 0.05). Group 2 showed an RL of 0.83 ± 0.41 mmol L−1 before Test 1 and an RL of 0.76 ± 0.18 mmol L−1 (p > 0.05) before Test 2. In both groups, tload did not differ significantly between the two tests (p > 0.05).
In both groups, high correlations between the tests were determined for mean maximum torque, mean maximum power, and maximum power (Table 1). The physiological quantities Lamax and Lamax of group 1 showed a correlation between both tests of r = 0.688 and r = 0.721. In group 2, there was a correlation of r = 0.821 (Lamax) and r = 0.677 (Lamax). These can be considered high linear correlations. With regard to talac, a high correlation of r > 0.665 was observed in group 1 between test 1 and test 2. Group 2 showed a mean linear correlation of r = 0.482 between test 1 and test 2.
3.2. Variability of Measurement
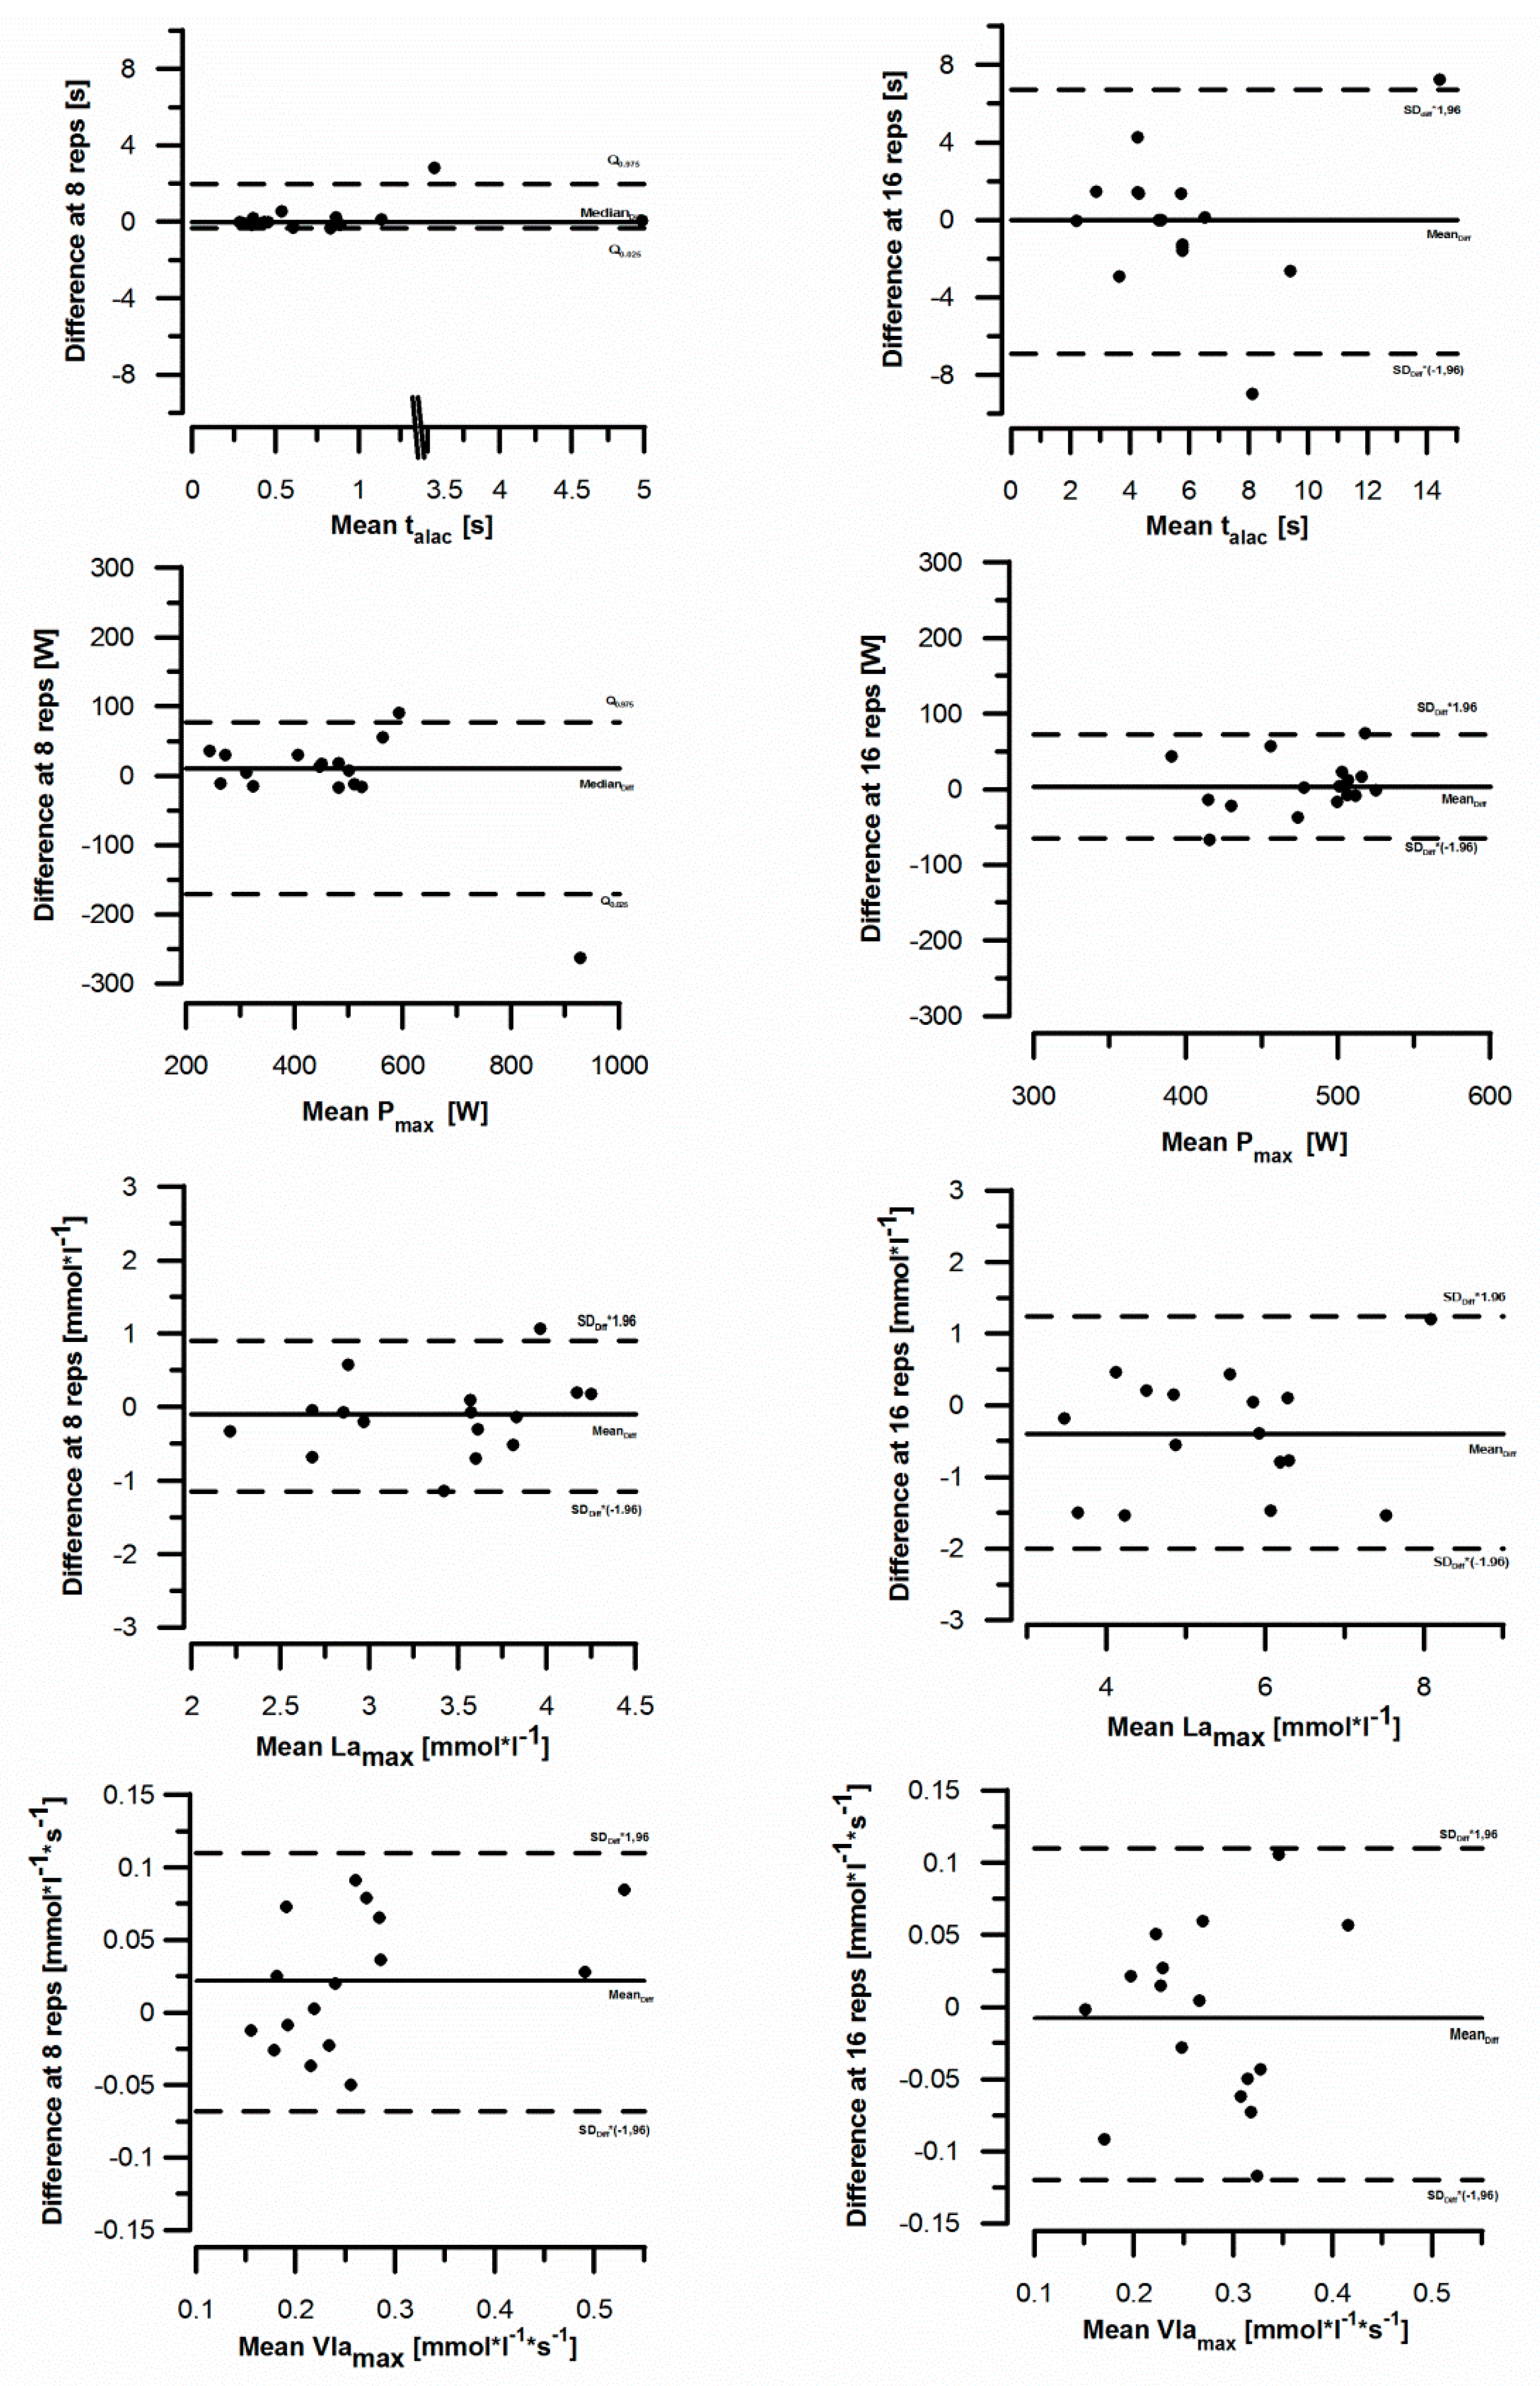
The Sw variability for Lamax, Pmax, and Lamax ranged between 5% and 16% (Table 2). talac showed Sw between 40% and 50%. The variability of Lamax in both groups was 0.04 mmol L−1 s−1 (Sw-norm: 13.47% to 15.78%). Figure 2 shows the systematic bias Lamax quantities using BA plots for both groups.
For group 1, the BA plots for Lamax showed a systematic bias on the repeatability (MWDiff) of −0.12 mmol L−1 at an interval (LoA) of ±0.89 mmol L−1. At Pmax the medianDiff was 10.7 watts at a lower LoA (Q0.025) of - 170.98 watts and an upper LoA (Q0.975) of 77.35 watts. talac showed a medianDiff of −0.02 s with a lower LoA (Q0.025) of −0.33 s and an upper LoA (Q0.975) of 1.96 s. At Lamax, a systematic bias of 0.02 mmol L−1 s−1 could be determined by repeating the measurement at an interval (LoA) of ±0.11 mmol L−1 s−1.
For group 2, a systematic bias on the measurement repetition (MWDiff) was −0.38 mmol L−1 with an interval (LoA) of ± 1.24 mmol L−1 was found based on the BA plots for Lamax. The MWDiff of Pmax was determined as 3.68 watts at an LoA of ± 72.1 watts. The talac showed an MWDiff of 0.11 s with an LoA of ± 6.70 s. The systematic bias on measurement repetition for Lamax was −0.008 mmol L−1 s−1 at an interval (LoA) of ±0.11 mmol L−1 s−1.
The Bland and Altman plots did not show a tendency in the measurement differences with respect to the mean value of the variables for either group. Thus homoscedasticity of the measurement differences was assumed.
4. Discussion
The aim of the study was to investigate the reproducibility of Lamax under isokinetic force loads. For this purpose, single-legged maximum leg flexion and extension movements with different load durations were performed on two groups of test subjects using a test and retest design. With respect to the target variable Lamax, the results of the linear correlation showed a high correlation in the test with eight repetitions and a moderate correlation in the test with 16 repetitions. The variability of the Sw can be considered as low for the investigated physiological values. Adam et al. [5] found similar results for maximum bicycle sprints.
Lamax is estimated on the basis of values, which are, in part strongly dependent on coordinative, motivational, and metabolic factors. This physiological size can potentially be affected by numerous determinants. Maximum lactate and duration of the talac is crucial with comparable load time and preload lactate concentration. In this context, talac showed the highest variability compared to the other values determining Lamax. The data suggest that the variability between subjects is similar to that between repeated measurements.
In terms of talac, it would be difficult to distinguish between intraindividual changes and interindividual characteristics. talac is the time interval at which the maximum power has been reduced by 3.5%. If the power maximum occurs too late or the power drop can be delayed, talac increases and consequently Lamax increases. For approx. 10 s of running load, Heck and Schulz [3] assume a talac of approx. four seconds, which increases with increasing running distance, and thus depends on the running strategy. At maximum isokinetic force loads, Nitzsche et al. [9] calculated a talac of approx. three seconds. From a physiological point of view, talac represents the time interval which is secured by “high-energy substrates” creatine phosphate (PCr) and adenosine triphosphate (ATP) to generate or maintain a maximum performance. At loads that provide maximum performance over a short time, PCr and ATP (5 to 3.5 mmol L−1) drop rapidly, which leads to a drop in performance due to the lower flow rate of phosphates via anaerobic glycolysis [3,23]. Therefore, Pmax cannot physiologically occur if talac is delayed. The present study showed lower talac at eight repetitions and higher talac at 16 repetitions. Between Test 1 and Test 2, group 1 (8 reps) had a higher linear correlation than group 2 (16 reps). This suggests that the subjects in group 2 (16 reps) may not have achieved maximum performance at the beginning of the test, but may have delayed it. Therefore, Lamax tends to be overestimated.
Since all test subjects were familiar with the test through preliminary examinations, coordinative reasons as well as learning and training effects can be excluded. Wittekind et al. [24] were able to determine “pacing” strategies for “all out” loads. They observed reduced performance at the beginning of longer loading periods (45 s) compared to shorter loading periods (10 s). It is possible that a strategy has been used here, consciously or unconsciously, with the aim of achieving high performance with low performance loss over the entire test period. This influencing factor for determining Lamax should be investigated in the future using a blinded design. Adam et al. [5] found differences in talac of up to one second on average during three repetitions of an isokinetic bicycle sprint. In the present study, the differences averaged less than 0.5 s. Introducing a time constant to minimize the variability of Lamax would be conceivable for talac. Determining Lamax would thus be less strongly influenced by a distorted talac.
Methodologically, it should be noted that direct comparisons of the variability of Lamax between the two loading periods are difficult to assess, as they were two independent groups of test persons. The allocation was randomized, but was not yet balanced due to the small sample size. A dependent design would make the comparison and its conclusions more reliable. In particular, the two groups of test persons showed different performances despite comparable training frequencies. With regard to performance, there was a significantly greater variability between the subjects in group 1, possibly having an influence on the higher correlations of Lamax compared to group 2. The variability of Lamax may be dependent on carbohydrate intake and the level of the glycogen stores [25,26]. Since no dietary protocol was kept in the present study, there is uncertainty about possible influences of the test persons’ diet.
5. Conclusions
A reliable reproducibility of Lamax at isokinetic force loads is given both during short (8 reps.) and longer loads (16 reps.). To minimize any distortions of talac by possible strategies of power output, using shorter load durations is preferable with regard to practical application. Furthermore, a constant for talac may control the influence of the power output. Changes in the Lamax of over 0.11 mmol L−1 s−1 due to training can be described as a non-random increase or decrease in the Lamax.
Author Contributions
Conceptualization, N.N. and H.S.; Data curation, N.N. and L.B.; Formal analysis, L.B. and C.M.; Methodology, N.N. and C.M.; Project administration, N.N.; Supervision, H.S.; Visualization, N.N. and L.B.; Writing—original draft, N.N. and L.B.; Writing—review & editing, H.S.
Funding
This research received no external funding.
Acknowledgments
The authors thank Daniel Zschäbitz for support in the data recording.
Conflicts of Interest
The authors declare no conflict of interest.
References
- Beneke, R.; Wittekind, A.; Muhling, M.; Bleif, I.; Leithauser, R.M. Lactate response to short term exercise with elevated starting levels. Eur. J. Appl. Physiol. 2010, 110, 215–218. [Google Scholar] [CrossRef] [PubMed]
- Mader, A. Aussagekraft der Laktatleistungskurve in Kombination mit anaeroben Tests zur Bestimmung der Stoffwechselkapazität. In Stellenwert der Laktatbestimmung in der Leistungsdiagnostik: 32 Tabellen; Clasing, D., Ed.; G. Fischer: Stuttgart, Germany, 1994; pp. 133–152. [Google Scholar]
- Heck, H.; Schulz, H. Diagnostics of anaerobic power and capacity. Dtsch. Z. Sportmed. 2002, 53, 202–212. [Google Scholar] [CrossRef]
- Vandewalle, H.; Peres, G.; Monod, H. Standard anaerobic exercise tests. Sports Med. 1987, 4, 268–289. [Google Scholar] [CrossRef] [PubMed]
- Adam, J.; Ohmichen, M.; Ohmichen, E.; Rother, J.; Müller, U.M.; Hauser, T.; Schulz, H. Reliability of the calculated maximal lactate steady state in amateur cyclists. Biol. Sport 2015, 32, 97–102. [Google Scholar] [CrossRef] [PubMed]
- Burgess, K.; Holt, T.; Munro, S.; Swinton, P. Reliability and validity of the running anaerobic sprint test (RAST) in soccer players. J. Trainology 2016, 5, 24–29. [Google Scholar] [CrossRef] [Green Version]
- Hauser, T. Einfluss der Belastungsdauer bei Sprintbelastungen auf die Laktatbildungsrate. Dtsch. Z. Sportmed. 2009, 60, 177. [Google Scholar]
- Hislop, H.J.; Perrine, J.J. The isokinetic concept of exercise. Phys. Ther. 1967, 47, 114–117. [Google Scholar] [CrossRef] [PubMed]
- Nitzsche, N.; Baumgärtel, L.; Schulz, H. Comparison of maximum lactate formation rates in ergometer sprint and maximum strength loads. Dtsch. Z. Sportmed. 2018, 2018, 13–18. [Google Scholar] [CrossRef]
- Nitzsche, N.; Zschäbitz, D.; Baumgärtel, L.; Schulz, H. The effect of isokinetic resistance load on glycolysis rate. In Book of Abstracts, Proceedings of the 22nd Annual Congress of the European College of Sport Science, MetropolisRuhr, Germany, 5–8 July 2017; Ferrauti, A., Platen, P., Grimminger-Seidensticker, E., Jaitner, T., Bartmus, U., Becher, L., de Marées, M., Mühlbauer, T., Schauerte, A., Wiewelhove, T., et al., Eds.; Bochumer Universitätsverlag Westdeutscher Universitätsverlag: Bochum, Germany, 2017; Volume 558. [Google Scholar]
- Bosquet, L.; Maquet, D.; Forthomme, B.; Nowak, N.; Lehance, C.; Croisier, J.-L. Effect of the lengthening of the protocol on the reliability of muscle fatigue indicators. Int. J. Sports Med. 2010, 31, 82–88. [Google Scholar] [CrossRef] [PubMed]
- Guilhem, G.; Giroux, C.; Couturier, A.; Maffiuletti, N.A. Validity of trunk extensor and flexor torque measurements using isokinetic dynamometry. J. Electromyogr. Kinesiol. 2014, 24, 986–993. [Google Scholar] [CrossRef] [PubMed] [Green Version]
- Gleeson, N.P.; Mercer, T.H. Reproducibility of isokinetic leg strength and endurance characteristics of adult men and women. Eur. J. Appl. Physiol. 1992, 65, 221–228. [Google Scholar] [CrossRef]
- Impellizzeri, F.; Bizzini, M.; Rampinini, E.; Cereda, F.; Maffiuletti, N. Reliability of isokinetic strength imbalance ratios measured using the Cybex NORM dynamometer. Clin. Physiol. Funct. Imaging 2008, 28, 113–119. [Google Scholar] [CrossRef] [PubMed]
- Maffiuletti, N.A.; Bizzini, M.; Desbrosses, K.; Babault, N.; Munzinger, U. Reliability of knee extension and flexion measurements using the Con-Trex isokinetic dynamometer. Clin. Physiol. Funct. Imaging 2007, 27, 346–353. [Google Scholar] [CrossRef] [PubMed]
- Bosquet, L.; Gouadec, K.; Berryman, N.; Duclos, C.; Gremeaux, V.; Croisier, J.L. The Total Work Measured During a High Intensity Isokinetic Fatigue Test Is Associated with Anaerobic Work Capacity. J. Sport Sci. Med. 2016, 15, 126–130. [Google Scholar]
- Nummela, A.; Alberts, M.; Rijntjes, R.P.; Luhtanen, P.; Rusko, H. Reliability and validity of the maximal anaerobic running test. Int. J. Sports Med. 1996, 17 (Suppl. 2), S97–S102. [Google Scholar] [CrossRef] [PubMed]
- Hauser, T.; Adam, J.; Schulz, H. Comparison of calculated and experimental power in maximal lactate-steady state during cycling. Theor. Biol. Med. Model. 2014, 11, 25. [Google Scholar] [CrossRef] [PubMed] [Green Version]
- Cohen, L.; Manion, L.; Morrison, K.R.B. Research Methods in Education, 5th ed.; RoutledgeFalmer: London, UK, 2005. [Google Scholar]
- Bland, J.M.; Altman, D.G. Statistical methods for assessing agreement between two methods of clinical measurement. Lancet 1986, 1, 307–310. [Google Scholar] [CrossRef]
- Bland, J.M.; Altman, D.G. Measuring agreement in method comparison studies. Stat. Methods Med. Res. 1999, 8, 135–160. [Google Scholar] [CrossRef] [PubMed]
- Bland, J.M.; Altman, D.G. Measurement error. BMJ 1996, 312, 1654. [Google Scholar] [CrossRef] [PubMed]
- Di Prampero, P.E. Energetics of muscular exercise. Rev. Physiol. Biochem. Pharmacol. 1981, 89, 143–222. [Google Scholar] [PubMed]
- Wittekind, A.L.; Micklewright, D.; Beneke, R. Teleoanticipation in all-out short-duration cycling. Br. J. Sports Med. 2011, 45, 114–119. [Google Scholar] [CrossRef] [PubMed]
- Mikulski, T.; Ziemba, A.; Nazar, K. Influence of body carbohydrate store modification on catecholamine and lactate responses to graded exercise in sedentary and physically active subjects. J. Physiol. Pharmacol. 2008, 59, 603–616. [Google Scholar] [PubMed]
- Havemann, L.; West, S.J.; Goedecke, J.H.; Macdonald, I.A.; St Clair Gibson, A.; Noakes, T.D.; Lambert, E.V. Fat adaptation followed by carbohydrate loading compromises high-intensity sprint performance. J. Appl. Physiol. (1985) 2006, 100, 194–202. [Google Scholar] [CrossRef] [PubMed] [Green Version]
Figure 1.
Schematic representation of determining the alactacide time interval (talac) on the basis of power (P).
Figure 1.
Schematic representation of determining the alactacide time interval (talac) on the basis of power (P).

Figure 2.
Bland Altman plots for parameters talac, Pmax, Lamax, Lamax. The differences between the two measurements are plotted against the mean value.
Figure 2.
Bland Altman plots for parameters talac, Pmax, Lamax, Lamax. The differences between the two measurements are plotted against the mean value.


Table 1.
Test-Retest results (mean and standard deviation) of both groups and the correlation coefficient r (p-value).
Table 1.
Test-Retest results (mean and standard deviation) of both groups and the correlation coefficient r (p-value).
| Groups | Group 1 with 8 reps | Group 2 with 16 reps | ||||
|---|---|---|---|---|---|---|
| Parameter | Test 1 | Test 2 | r | Test 1 | Test 2 | r |
| RL (mmol L−1) | 0.86 ± 0.22 | 0.91 ± 0.35 | 0.83 ± 0.41 | 0.76 ± 0.18 | ||
| tload(s) | 12.1 ± 1.02 | 11.5 ± 1.03 | 23.1 ± 0.31 | 23.0 ± 0.28 | ||
| Mmax-mean (Nm) | 143.8 ± 43.3 | 145.5 ± 45.1 | 0.983 (0.000) | 143.8 ± 16.9 | 142.6 ± 18.9 | 0.840 (0.000) |
| Pmax-mean (Watt) | 424.6 ± 182.2 | 424.9 ± 142.6 | 0.946 (0.000) | 419.6 ± 40.2 | 419.9 ± 40.1 | 0.753 (0.001) |
| Pmax (Watt) | 457.9 ± 193.5 | 455.9 ± 146.9 | 0.938 (0.000) | 476.0 ± 42.8 | 479.7 ± 49.9 | 0.726 (0.001) |
| Lamax (mmol L−1) | 3.44 ± 0.59 | 3.31 ± 0.70 | 0.688 (0.002) | 5.66 ± 1.33 | 5.27 ± 1.44 | 0.821 (0.000) |
| Lamax (mmol L−1 s−1) | 0.25 ± 0.11 | 0.27 ± 0.11 | 0.721 (0.002) | 0.27 ± 0.07 | 0.26 ± 0.07 | 0.677 (0.004) |
| talac (s) | 0.97 ± 1.1 | 1.1 ± 1.5 | 0.665 (0.005) | 5.87 ± 3.1 | 5.76 ± 3.6 | 0.482 (0.059) |
Table 2.
Within-subject standard deviation Sw and (Sw-norm) of both groups.
| Parameter | Group 1 | Group 2 |
|---|---|---|
| Pmax (Watt) | 51.75 (11.33%) | 24.05 (5.03%) |
| Lamax (mmol L−1) | 0.37 (10.92%) | 0.63 (11.54%) |
| Lamax (mmol L−1 s−1) | 0.04 (13.47%) | 0.04 (15.78%) |
| talac (s) | 0.52 (49.28%) | 2.38 (40.9%) |
© 2018 by the authors. Licensee MDPI, Basel, Switzerland. This article is an open access article distributed under the terms and conditions of the Creative Commons Attribution (CC BY) license (http://creativecommons.org/licenses/by/4.0/).
Share and Cite
MDPI and ACS Style
Nitzsche, N.; Baumgärtel, L.; Maiwald, C.; Schulz, H. Reproducibility of Blood Lactate Concentration Rate under Isokinetic Force Loads. Sports 2018, 6, 150. https://doi.org/10.3390/sports6040150
AMA Style
Nitzsche N, Baumgärtel L, Maiwald C, Schulz H. Reproducibility of Blood Lactate Concentration Rate under Isokinetic Force Loads. Sports. 2018; 6(4):150. https://doi.org/10.3390/sports6040150
Chicago/Turabian StyleNitzsche, Nico, Lutz Baumgärtel, Christian Maiwald, and Henry Schulz. 2018. "Reproducibility of Blood Lactate Concentration Rate under Isokinetic Force Loads" Sports 6, no. 4: 150. https://doi.org/10.3390/sports6040150
Note that from the first issue of 2016, this journal uses article numbers instead of page numbers. See further details here.