1. Introduction
Sprint performance, especially acceleration performance, is decisive for attacking play toward the goal in a soccer game [
1,
2]. Thus, improving sprint acceleration ability is of great importance for soccer players to beat opposition competitors [
3]. For this reason, many studies have monitored sprint performance of soccer players during training and match games [
4,
5,
6]. For soccer players, however, available information concerning determinants of sprint acceleration performance is scarce.
From the findings of a prior study, which investigated the relationship between sprint performance and spatiotemporal variables for soccer players [
7], the running speed was correlated with step length (SL) during the initial and middle acceleration phases (until the 16th step). However, a previous study, which examined the difference between faster and slower field sport athlete groups including soccer players, reported that the faster group was accompanied by greater step frequency (SF) during the initial three steps [
8]. Moreover, for rugby players, it was verified that SF was higher in backs (faster) group than forwards (slower) group while SL showed moderate relationship with sprinting performance within forwards players during the initial three steps [
9]. These conflicting findings in the previous studies partially resulted from the difference in variables used, in addition to differences in performance level and characteristics of athletes. So as to correctly understand the determinants of sprint acceleration performance, it is likely better to adopt changes in running speed (
∆v) or acceleration as a performance indicator. However, no studies using field athlete groups have adopted
∆v or acceleration as a dependent variable. Evaluating the associations of increment of running speed or acceleration with either SL or SF would improve our understanding of the sprint acceleration performance in soccer players.
The
∆v mechanically depend on ground reaction forces (GRFs). Thus, investigating GRF in addition to spatiotemporal variables can provide a better understanding of the source of effective sprint acceleration through an increase in SL or SF. For soccer players, however, previous studies have not investigated GRFs during the acceleration phase of a single maximal sprint. Earlier studies employing sprinters have shown that, for better sprint acceleration, while greater propulsive force was a prominent factor during the entire acceleration phase [
10,
11], a smaller braking force was also a determinant when the running speed was greater than or equal to 70% of the maximum [
10]. Although these findings are possibly useful for soccer players, whether the previous findings are applicable for soccer players is unclear. The majority of sprint distances for soccer players during a match are shorter than 20 m [
3]. In addition, soccer players often initiate their sprints from a standing posture during a match. Thus, it may be assumed that the kinetic determinants of sprint acceleration performance for soccer players would differ from those for sprinters. Clarifying this aspect will be useful for understanding the determinants of better sprinting performance in soccer players and for designing training modalities aiming to improve them.
The purpose of this study was, therefore, to elucidate the determinants of sprint acceleration performance in soccer players on the basis of the associations of the ∆v with spatiotemporal and kinetic variables during the sprinting. We hypothesized that longer SL and greater propulsive force in the initial acceleration section would be associated with greater acceleration.
3. Results
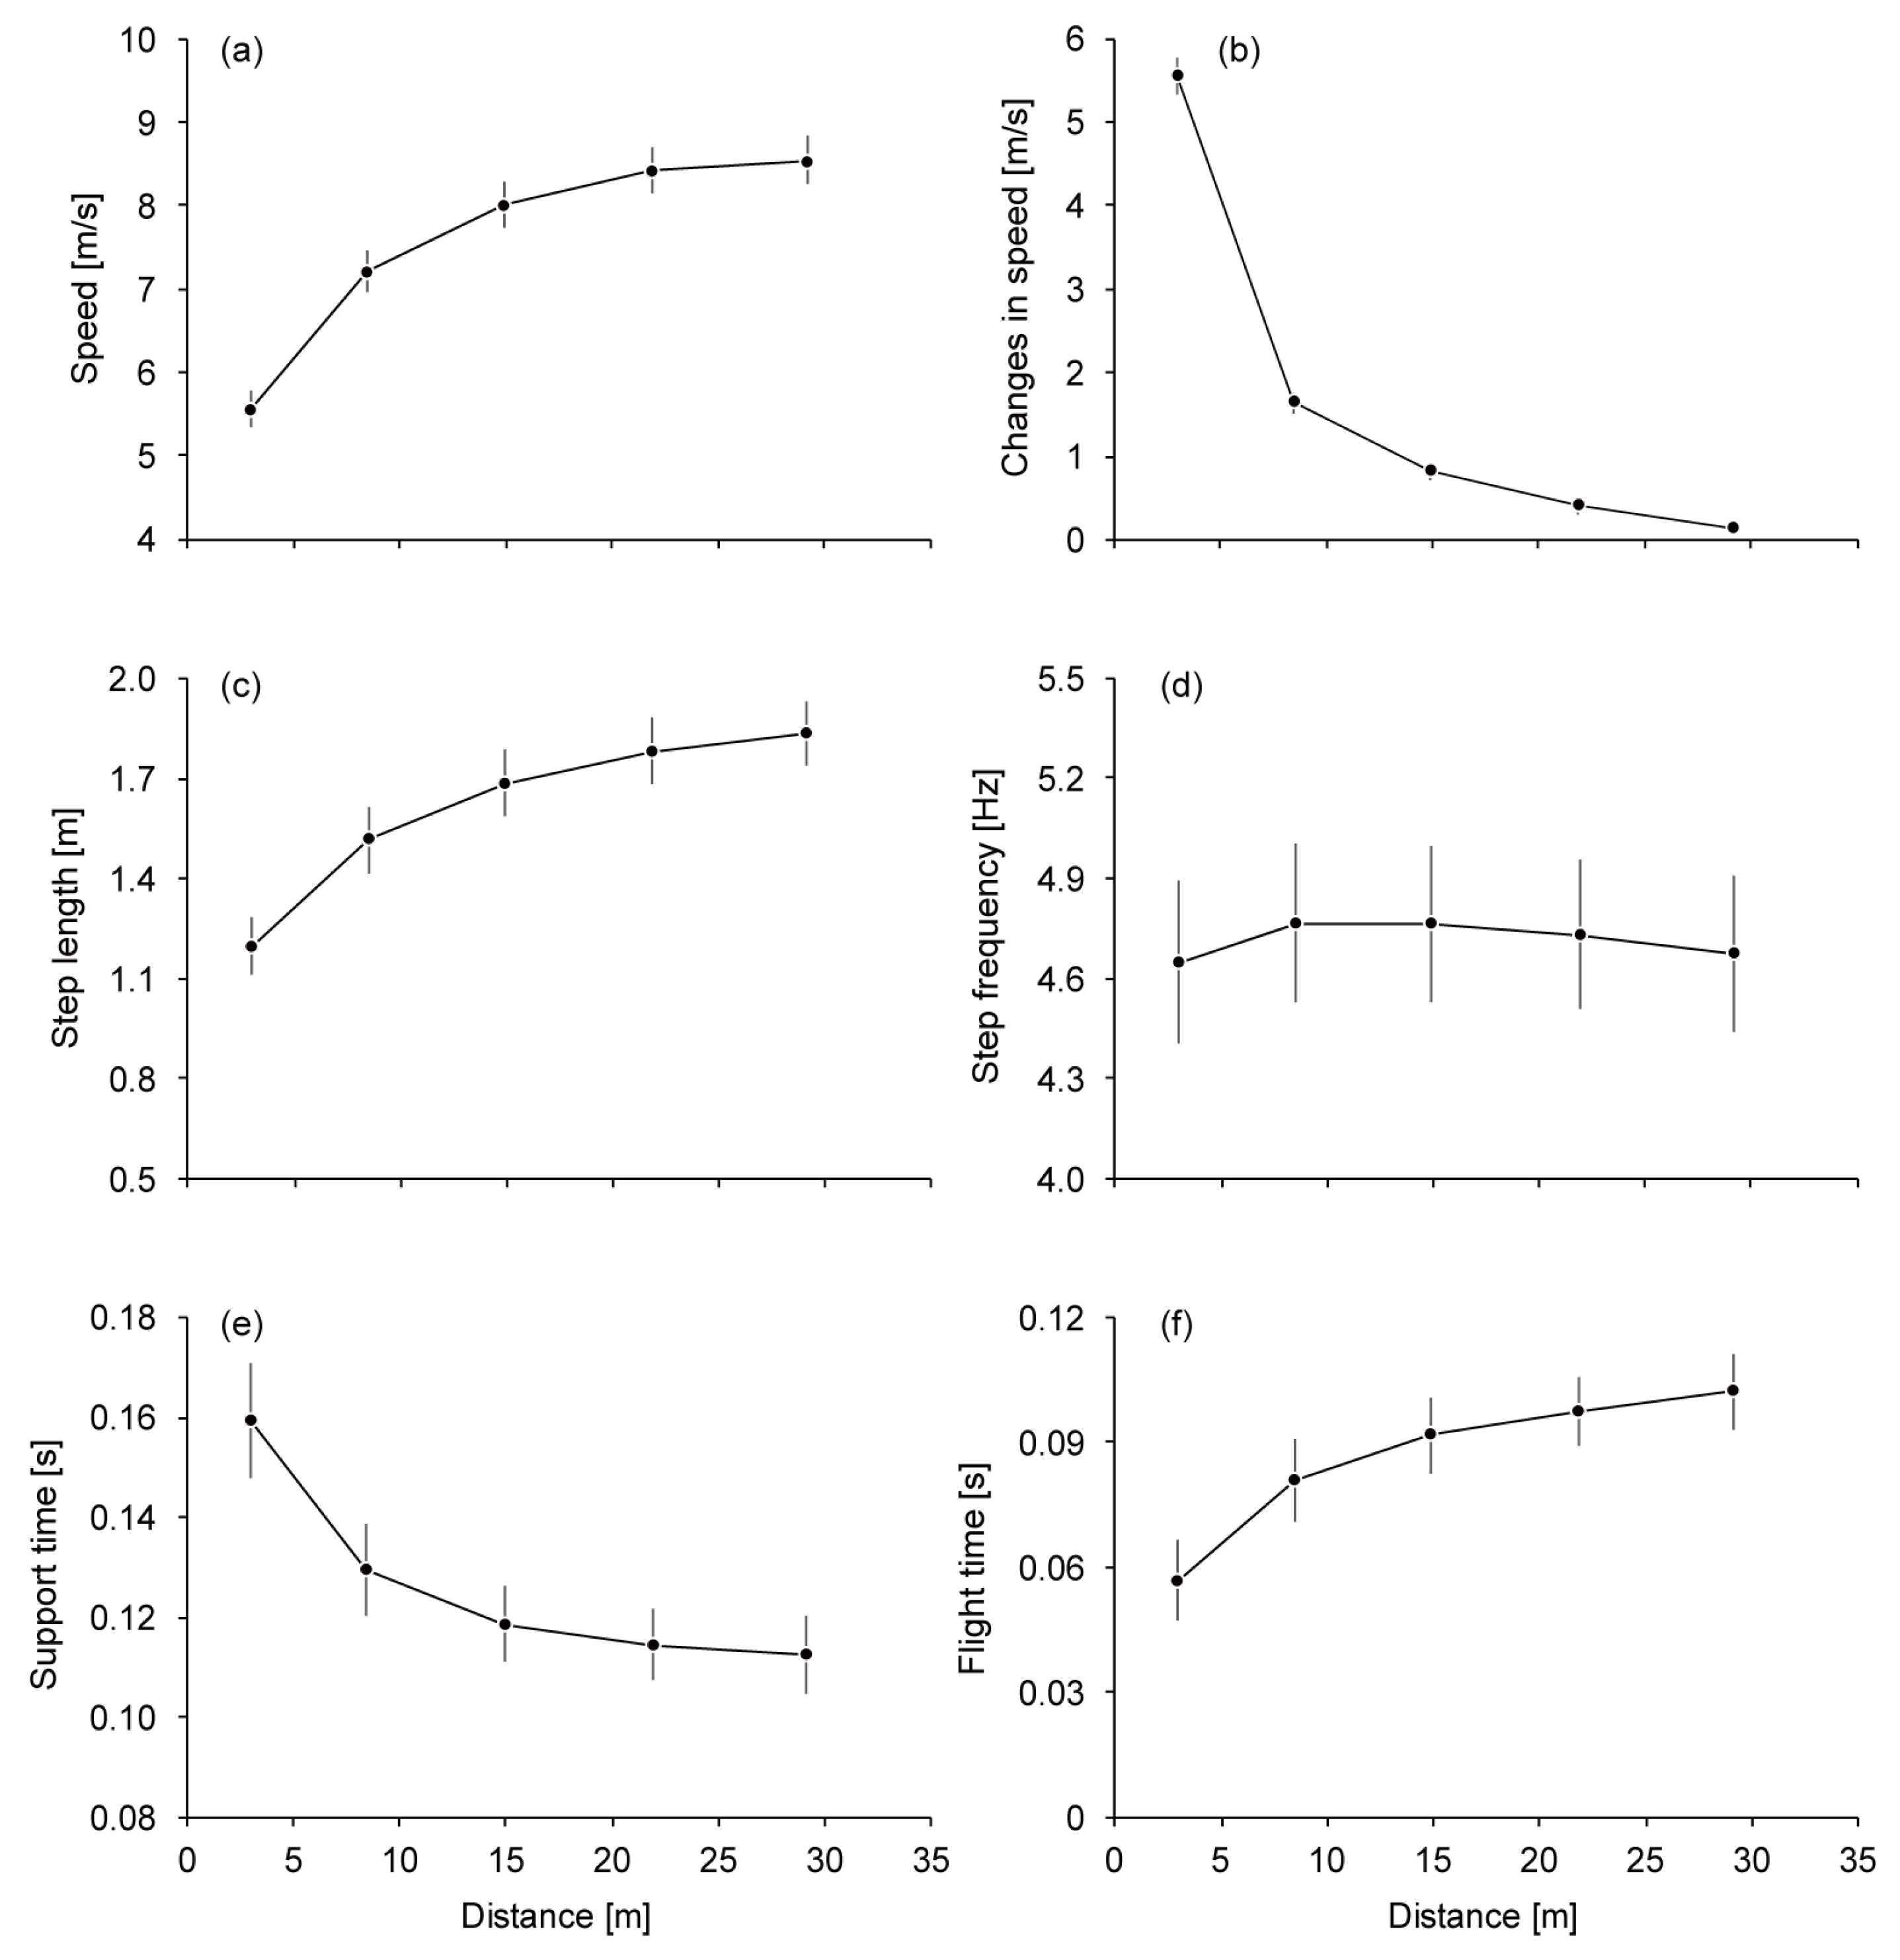
The mean running speed over the 50-m distance in the faster trial was 7.91 ± 0.24 m/s. Running speed and SL increased until the 17th–20th step section, reaching 8.54 ± 0.28 m/s and 1.83 ± 0.10 m, respectively (
Figure 1a,c). The
∆v decreased from 5.56 ± 0.22 m/s to 0.13 ± 0.08 m/s through the entire acceleration phase (
Figure 1b). SF increased to the 5th–8th step section (4.77 ± 0.23 Hz) and then slightly decreased to the 17th–20th step section (
Figure 1d). ST and AT decreased for 0.047 ± 0.009 s and increased for 0.045 ± 0.010 s, respectively, until the 17th–20th step section (
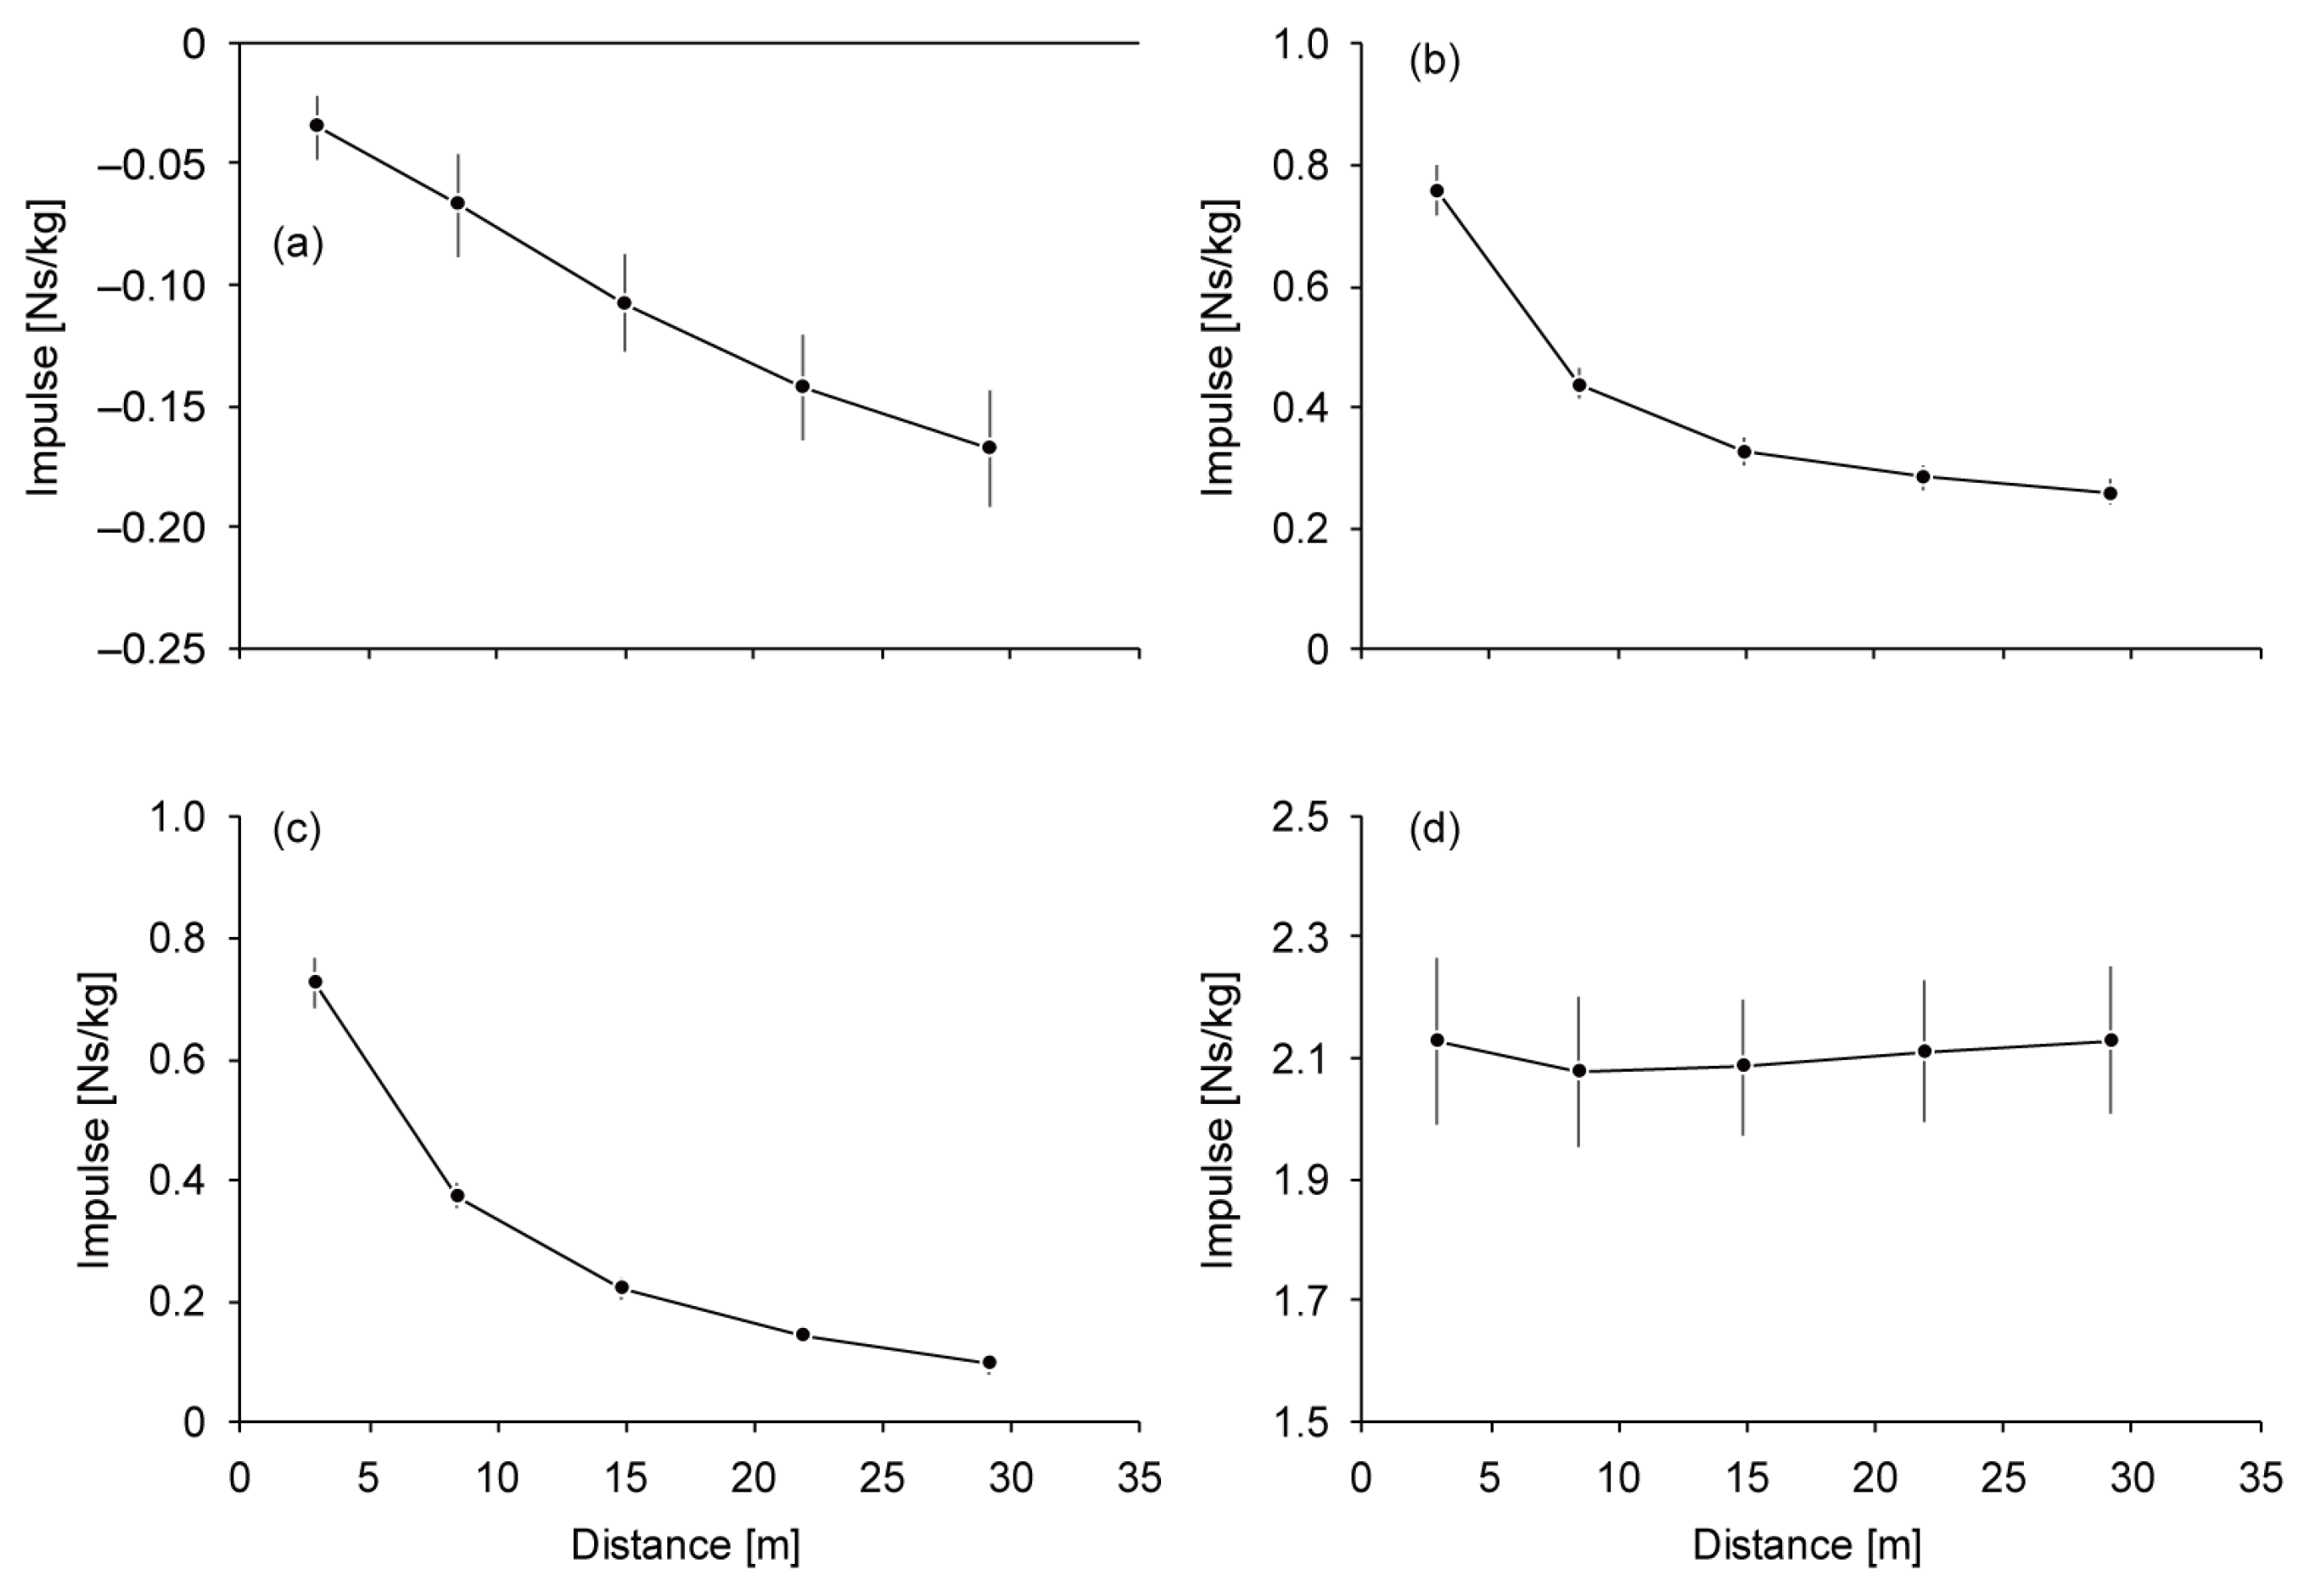
Figure 1e,f). While
Bimp increased until the 17th–20th step section (−0.17 ± 0.02 Ns/kg) (
Figure 2a),
Pimp (0.76 ± 0.04 Ns/kg at the 1st–4th step section) and
APimp (0.72 ± 0.04 Ns/kg at the 1st–4th step section) decreased through the entire acceleration phase (
Figure 2b,c).
Vimp decreased to the 5th–8th step section and increased slightly afterward (2.13 ± 0.12 Ns/kg) (
Figure 2d).
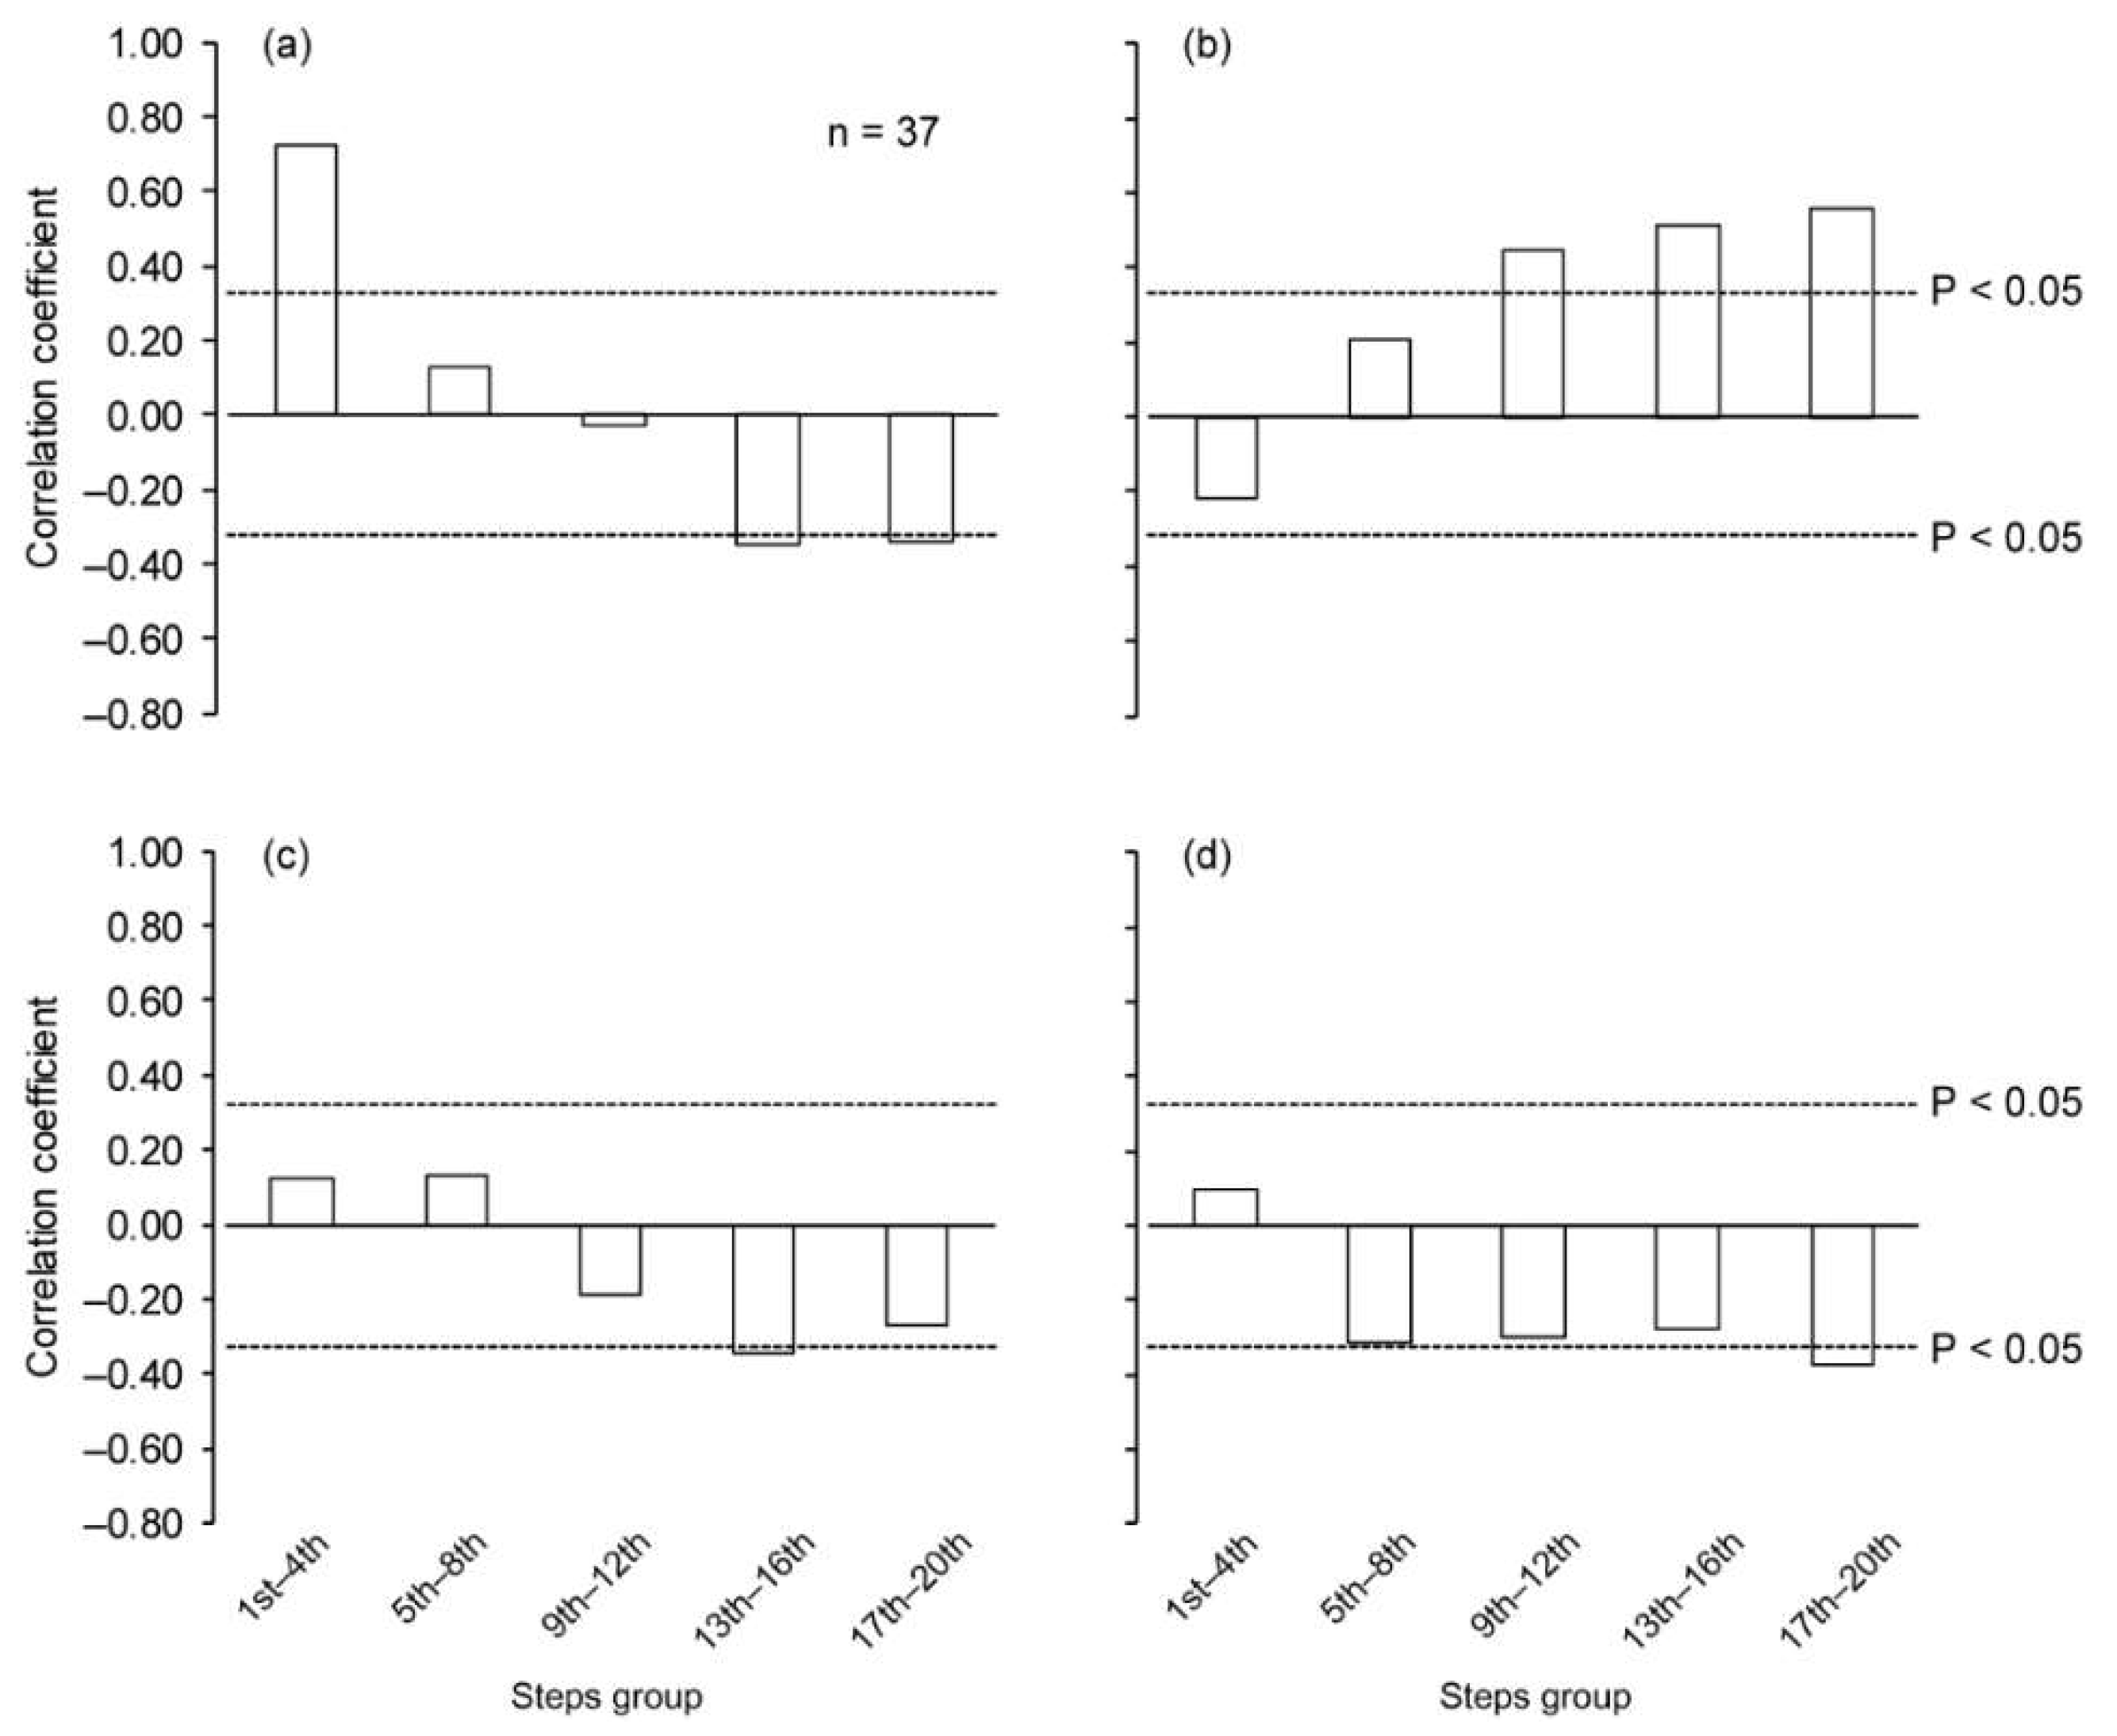
When controlling for the influence of stature and body mass, the
∆v was significantly correlated with the SL positively at the 1st–4th step section and negatively at the 13th–16th and 17th–20th step sections (
Figure 3a), and those in SF positively from the 9th–12th to the 17th–20th step section (
Figure 3b). Significant negative correlations for
∆v versus ST and AT were found at the 13th–16th and 17th–20th step sections, respectively (
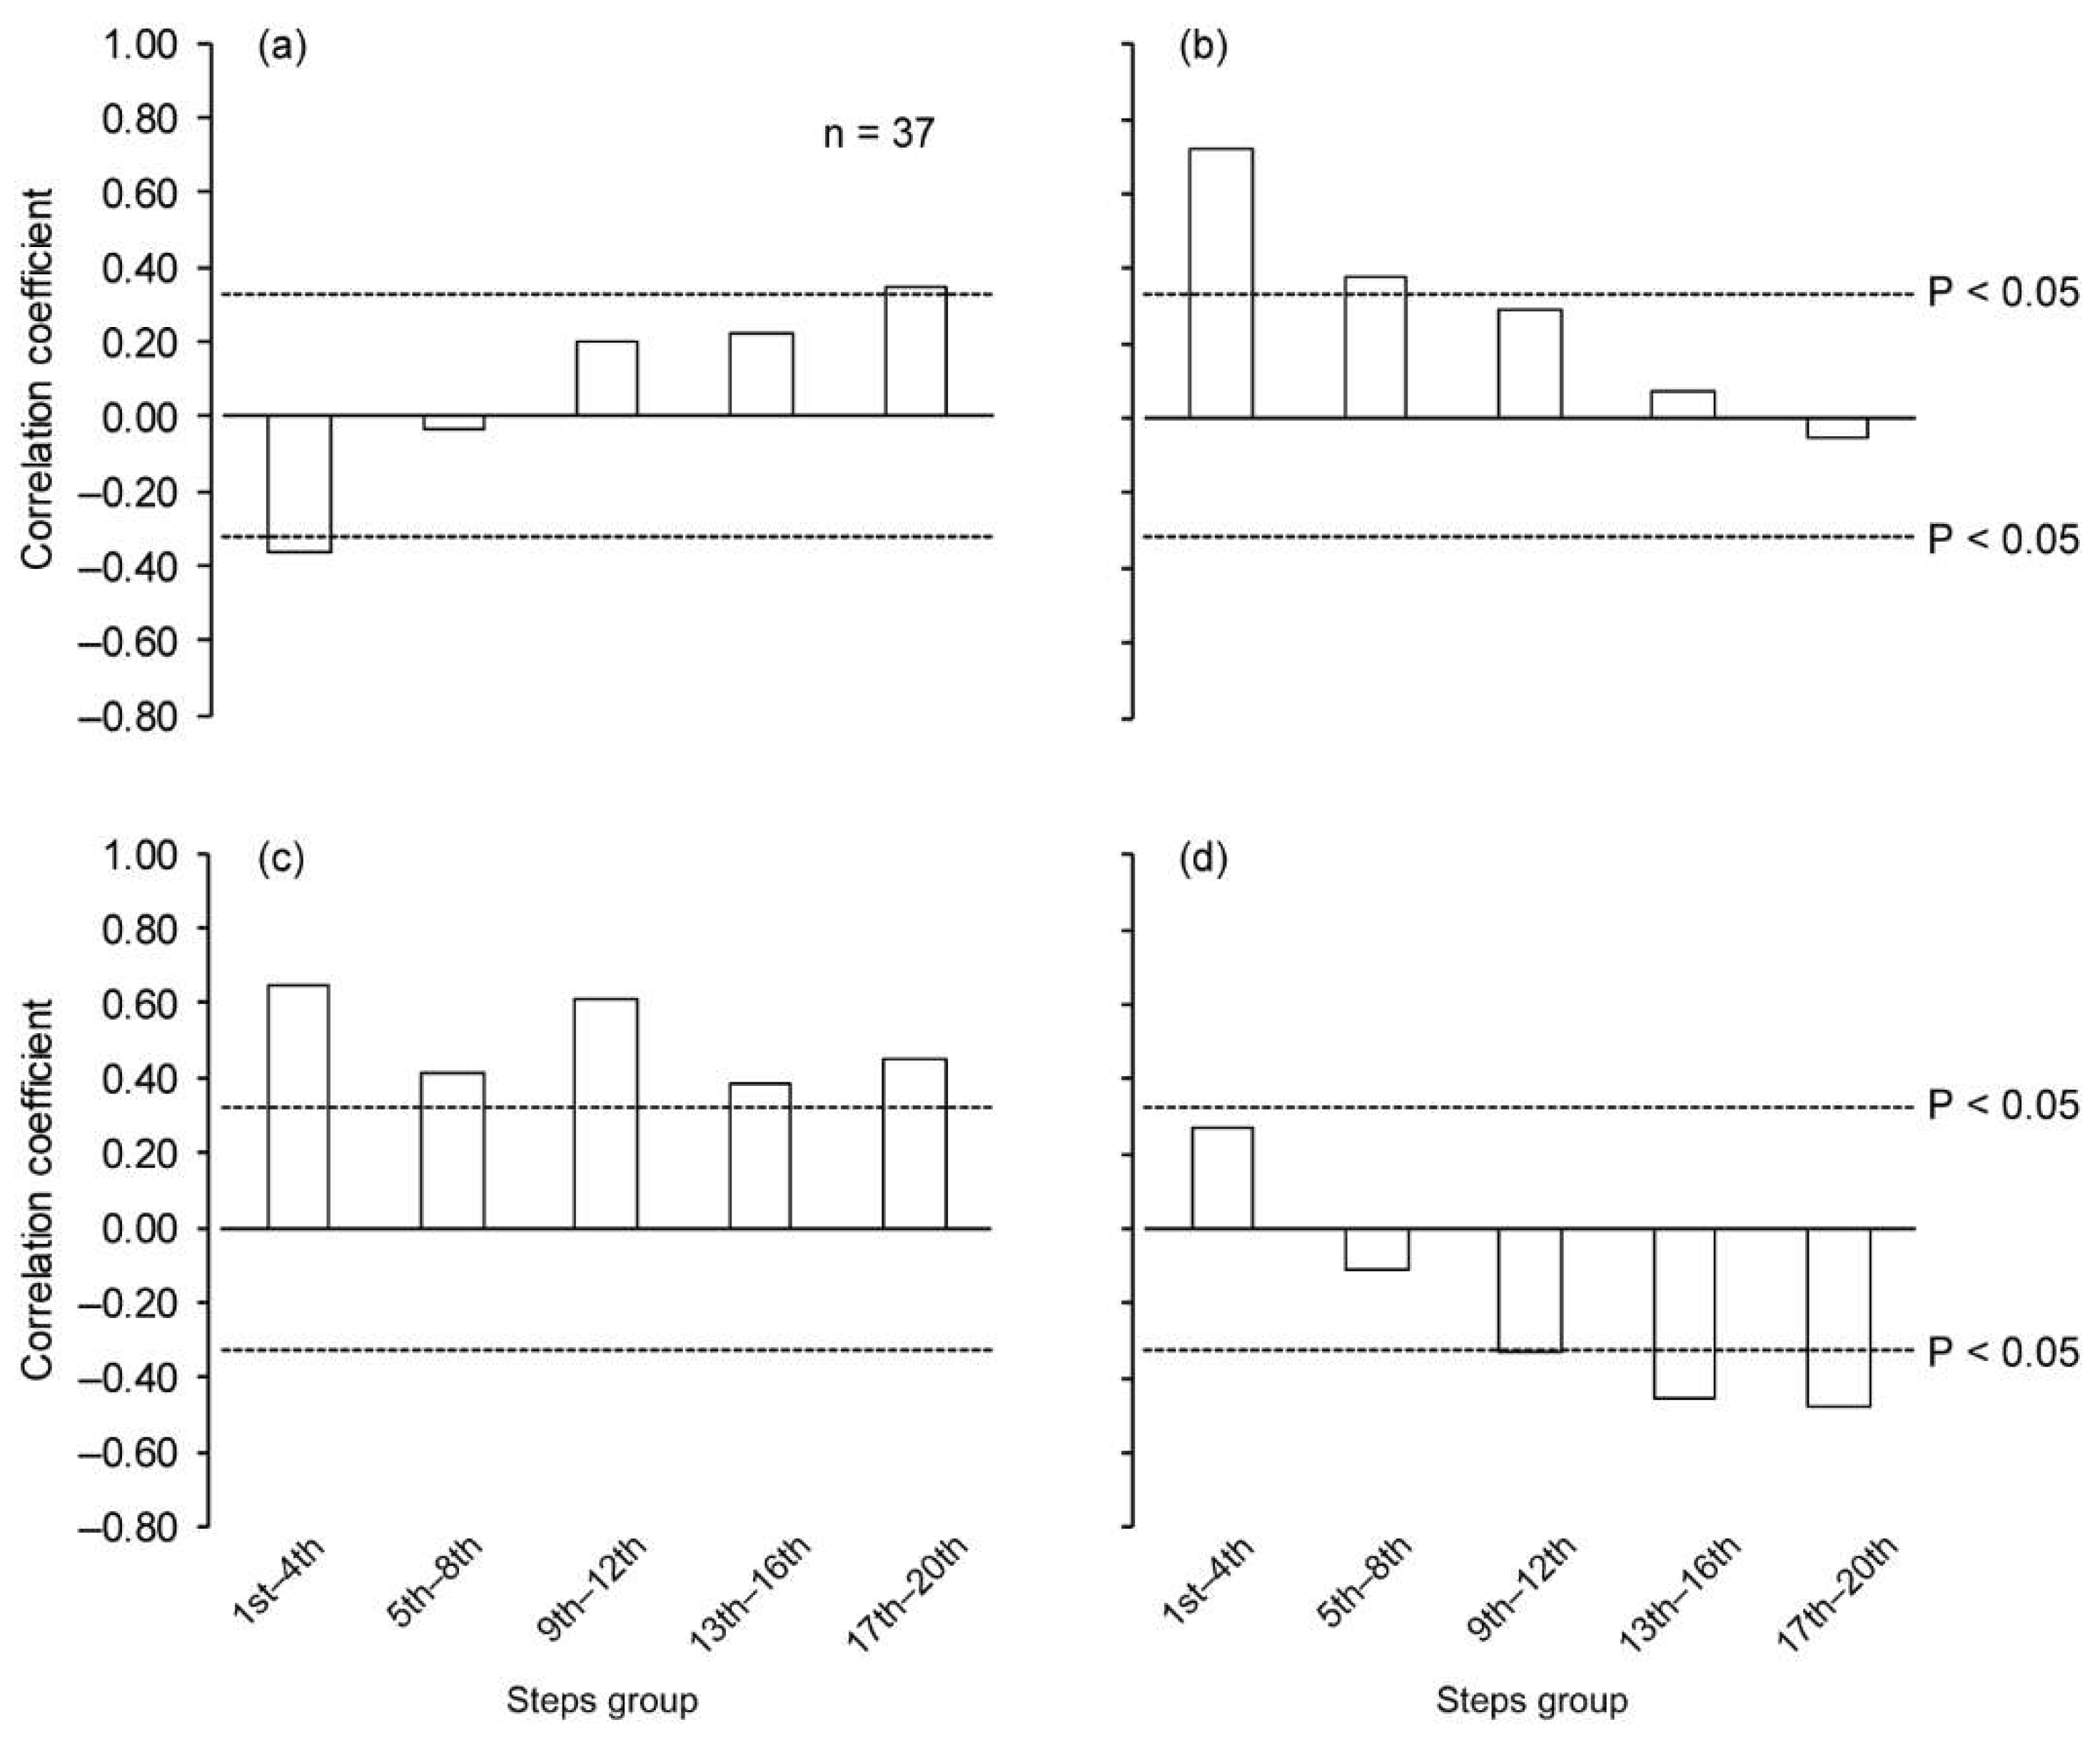
Figure 3c,d). The
∆v was significantly correlated with
Bimp during the first and last step sections (
Figure 4a). There were significant positive correlations between
∆v and Pimp for the initial two step sections (
Figure 4b). For the
APimp, there were significant correlations with
∆v for all step sections (
Figure 4c). Significant negative correlations were found for
∆v versus
Vimp from the 9th–12th step section and thereafter (
Figure 4d).
4. Discussion
This study aimed to elucidate spatiotemporal and kinetic determinants of sprint acceleration in soccer players. The current findings indicate that a greater SL during the initial acceleration phase (1st–4th step section), a higher SF during the middle and later acceleration phases (from the 9th to 20th step), and shorter ST and AT during the later acceleration phase (13th–16th and 17th–20th step sections) are essential for greater sprint acceleration. Moreover, for better sprint acceleration performance, smaller Bimp during the later acceleration phase (17th–20th step section), greater Pimp during initial two step sections (from the 1st to 8th step), a greater APimp during the entire acceleration phase, and smaller Vimp during the middle and later acceleration phases (from the 9th to 20th step) were found to be important. Overall, the findings in this study supported our hypotheses.
While previous studies showed contradiction about the determinants of the initial sprint acceleration performance of field sport athletes in terms of SL and SF [
7,
8,
9], the only study employed soccer players elucidated that the greater running speed was associated with greater SL [
7]. The results in this study support the previous finding [
7] and indicates the importance of SL for greater increment of running speed during the initial acceleration phase in soccer players. Although the running speed was associated with SF in previous studies using field sport athletes [
8,
9], magnitude of SF was relatively high in the current study compared to those in the previous studies (4.65 ± 0.24 Hz in the 1st–4th step section in this study versus 3.64 and 3.34 Hz in the initial three steps in the study by Murphy et al. [
8] and ranged from 4.0 to 4.6 Hz during the initial three steps in the study by Wild et al. [
9]). These indicate that baseline of SF was high during the initial acceleration phase in this study, and this high SF would limit the variation of SF possibly mitigating the association of SF with increment of running speed. From the 9th–12th to the 17th–20th step section, SF was correlated with
∆v, indicating that higher SF is essential for the greater increment of running speed during the middle and later acceleration phases. The fact that ST and AT were negatively correlated with
∆v at the 13th–16th and 17th–20th step sections demonstrates the importance of shorter ST and AT for better acceleration during the later acceleration phase. Although the current result cannot be compared to those of previous studies using soccer players or field sport athletes, a study employed sprinters also found the importance of greater decrease in ST and suppressing the increment of AT for greater acceleration through higher SF during the later acceleration phase in maximal sprinting [
13]. Thus, the finding in this study is in line with the previous study using sprinters.
The
APimp was associated with
∆v at all step sections. This indicates that the amount of forward oriented GRF is a predominant factor for better sprint acceleration in soccer players, consisting with previous findings obtained in sprinters [
10,
11,
14]. For sub-components, greater
Pimp and smaller
Bimp were associated with greater
∆v during the 1st–4th to 5th–8th step section and the 17th–20th step section, respectively. These results demonstrate that producing greater propulsive force during the initial acceleration phase and suppressing braking force during the later acceleration phase are essential for better acceleration performance. Although there is no study that investigated the relationship of
Pimp and
Bimp with sprinting performance using soccer players, the current findings are consistent to previous findings using sprinters [
10]. The
∆v was negatively correlated with the
Vimp. This conflicts to a previous finding which showed no association of running speed with
Vimp in soccer players during the entire acceleration phase [
7]. The contradiction may be due to the difference in the used variables (
∆v in this study versus running speed in the previous study). Moreover, the current finding is in line with a previous study which examined the relationship of running acceleration with mean vertical force in sprinters during accelerated sprinting [
10]. In addition, this smaller
Vimp probably resulted in higher SF through shorter AT during the middle and later acceleration phases. Taken together, it can be said that the smaller
Vimp is of importance for better sprint acceleration especially during the middle and later acceleration phases. The current results indicate that greater
Bimp possibly relate to greater
∆v during the 1st–4th step section. However, the braking force and impulse during the initial acceleration phase were very small [
10], and thus it may not be important to produce braking force during the initial acceleration phase for better acceleration.
Before summarizing the current results, the reader should be aware of several limitations in this study. The sprint distance was set to 60-m in order to cover the entire acceleration phase of sprinting for all participants [
10,
13]. However, the vast majority of sprints in a soccer game are shorter than 20-m [
3]. In addition, while this study adopted the crouched split standing start as used in previous studies using soccer players [
3,
6,
7,
15,
16], soccer players often initiate sprints from a jogging or nonstationary condition in their own competitive games. Thus, there is a possibility that the determinants of sprint acceleration performance in soccer players could be different from those suggested by the findings obtained here. Further study is needed to elucidate the influences of the running distance and conditions prior to the start of the accelerated sprint on the determinants of sprint acceleration performance in soccer players. The participants used in this study were collegiate soccer players. Thus, it is possible that the results might differ when professional soccer players are employed, and further study including professional players is needed to generalize the current findings.


