1. Introduction and Background
The construction industry is vital for a country’s economy as it creates jobs for skilled workers and supports economic stability. However, accurate cost estimation for construction projects in developing countries is challenging due to uncertainties associated with project durations, material supply, poor documentation, and the overall economy. The associated outdated methods of project cost and duration estimation in developing countries can lead to cost overruns, delays, and financial losses [
1]. To mitigate these challenges, sophisticated cost estimation methods that account for material costs and project timelines should be adopted. Accurate cost estimation is essential for justifying a project’s economic feasibility during the approval and financial planning stages [
2]. Cost overruns can negatively impact the financial viability of projects.
To address the challenge of accurate cost estimation in construction projects, many are calling for localized Construction Cost Indices (CCIs) to forecast the cost of local construction materials, especially in developing countries [
3,
4]. CCIs are weighted aggregate indices that detail the price changes of construction materials over time, enabling contractors to propose accurate bids during the tender phase and project owners to estimate project costs and allocate realistic budgets. Contractors rely on the CCI to determine the most competitive pricing strategy for winning the bid while ensuring profitability. Project owners use it to estimate the probable cost of the project.
Several factors should be considered to develop an accurate CCI, including the objective of the index, the choice of cost elements, the weight of each component, and the base year. Different countries have developed and used their own CCIs. An example is the Engineering News Record (ENR) in North America which provides a weighted aggregate index of consistent amounts of Portland cement, structural steel, lumber, and labor [
4]. Other examples include the construction labor cost index in Hong Kong, the CCI of Taiwan, and Malaysia [
5,
6,
7]. However, such indices are rare in developing countries.
Construction costs in developing countries can be volatile due to inflation, which can cause problems for construction projects, especially mega projects. To address this issue, CCIs can be leveraged to forecast future material prices and provide a more accurate estimate of project costs. However, predicting future prices is complex and involves many variables that can be challenging to address in developing countries. In recent years, various techniques have been developed to improve the accuracy of future price predictions, including machine learning algorithms such as Artificial Neural Network (ANN), multiple linear regression, time series analysis, the Delphi technique, simple linear regression, and managerial estimates [
8]. These techniques aim to reduce the risk of cost overruns in construction projects and can be classified into three categories: traditional, modern, and quantitative methods. Traditional and modern methods are econometric, while quantitative methods are non-econometric [
4].
The traditional method for forecasting construction costs is based on the relationship between dependent and independent variables [
9]. Linear regression is an example of this method, which examines the linear relationship between the variables. Although various researchers have used it, the drawback is that all the independent variables must be identified before the method can be applied [
10], which is not preferred in construction as it can significantly impact the project cost. Evaluating multiple variables can also make the assessment tricky and susceptible to errors. Lundberg and Lee [
11] suggested that linear regression is not accurate enough for forecasting future values.
The modern method for predicting future costs is based on time series analysis, which involves analyzing historical data and internal statistical relationships to forecast future values [
12]. This method arranges data points in time order and equal intervals, with time as the independent variable and other variables predicted based on it. Lee et al. [
13] proposed a multivariate time series analysis to forecast raw material prices, primarily focusing on the impact of iron core costs on steel items. The authors found their method was 2.3 times more accurate than previous studies in predicting project profitability. Time series analysis was used to predict the CCI of Taiwan, stock returns, probabilistic forecasting, and financial prediction [
14,
15]. Ashuri and Lu [
16] used various time series models to predict CCI and found that seasonal autoregressive integrated moving average (ARIMA) models are the most accurate. Multiple studies have reported that modern time series methods effectively predict construction costs [
4]. However, these methods require historical data and involve complicated operations compared to other techniques. Forecasting errors increase exponentially for projects with longer durations, leading to estimating mistakes. Multivariate time series models coupled with deep learning methods such as LSTM can resolve some of these issues for accurate CCI forecasting.
Quantitative methods use computational techniques such as ANN, which simulates human brain learning to yield reliable results with manageable inputs. Various researchers in construction have used ANN for cost estimation, such as predicting highway construction cost increments, tender prices, and cash flow forecasting [
17,
18]. ANN is suitable for long-term index prediction as it is not solely reliant on past data. Shiha et al. [
19] predicted construction material prices in a developing society (Egypt) using ANN. Other studies have also used ANN to achieve higher prediction accuracy [
4].
ANN models have been compared to other methods for developing CCIs. Williams [
20] predicted changes in CCI value using ANN, multiple regressions, and exponential smoothing, and found that ANNs provide better results than the other techniques. Similarly, Kim et al. [
21] developed construction cost models using ANN, case-based reasoning, and regression methods and found that ANN outperformed the other methods.
The case-based reasoning model outperformed ANN regarding long-term use and accuracy vs. time tradeoffs, while the combined model of Kim and Kwak [
22] showed improved results with higher accuracy and fewer errors in predicting cost overruns. Elfahham [
4] used ANN, regression, and time-series models to predict the CCI of Egypt. The results showed that the time-series model outperformed the other models. Cao, Cheng, and Wu [
5] predicted CCI for Taiwan using a self-adaptive structural radial basis neural network intelligence machine (SSRIM). Fan and Sharma [
23] used Support Vector Machine (SVM) and Least Squares SVM (LSSVM) for CCI prediction. Wang and Ashuri [
24] utilized the K-Nearest Neighbors algorithm (K-NN) and Program Evaluation and Review Technique (PERT), and Moon [
25] used the Vector Error Correction Model (VECM) with search query frequencies to forecast CCI.
Pakistan’s construction industry is crucial to its economy but faces various challenges, leading to project delays or failures [
26]. These challenges include inaccurate project scheduling, inadequate planning, inefficient management, inflation, poor documentation, and lack of proper project cash flows due to inaccurate cost estimates, features common in most developing countries [
26,
27]. Moreover, despite the cost being a key factor in awarding a construction project, accurate estimation is hindered by multiple variables due to the volatile local economy. These variables include fluctuating currency rates, unstable political situations, high and fluctuating fuel costs, improper project durations and unrealistic delivery milestones, poor documentation, and others [
28,
29,
30].
Construction material prices in Pakistan are subject to unsystematic revisions due to inflation, resulting in inaccurate cost estimates. Such poor estimates lead to project issues such as delays, poor quality work, customer dissatisfaction, and cost and time overruns [
31]. Improper planning and cost estimation have led to the failures of several local mega projects, including the new Islamabad airport, M-5 motorway, Islamabad-Rawalpindi metro bus project, Sher Shah bridge Karachi, Neelum-Jhelum hydropower plant, Kalabagh dam, and Lahore ring road [
32].
A localized CCI can help prevent future project failures or delays by accurately predicting project costs. However, the absence of a dedicated agency for CCI development in the country contributes to the deteriorating conditions of the local construction industry. The Pakistan Bureau of Statistics (PBS) currently reports on the costs of various materials but does not explicitly focus on the construction industry. PBS collects the primary data through various surveys, including the Labor Force Survey (LFS), Household Integrated Economic Survey (HIES), Pakistan Integrated Household Survey (PIHS), Pakistan Demographic Survey (PDS), and more. Meanwhile, secondary data, such as foreign trade statistics, industrial statistics, transport and communication statistics, social statistics, agriculture statistics, environment statistics, etc., were obtained from the official records of relevant Ministries/Departments by PBS. Further, it does not consider future fluctuations in construction material rates.
This study proposes a method to develop CCI for developing countries using cost data from 2000–2020 for prime construction elements in Pakistan. Three techniques—Artificial Neural Network (ANN), time series, and regression methods—were utilized to predict future CCI values. The swish activation function was used to enhance the accuracy of the time series model’s predictions. The study focuses on the costs of elements used in reinforced concrete buildings, as most local structures are based on reinforced concrete. Developing a local CCI using advanced prediction techniques will enable contractors and owners to manage their budgets better, reduce cost overruns, and assist in developing a more efficient and competitive construction industry, driving economic growth and development. The research can also serve as a basis for further research worldwide in similar developing countries.
The proposed mechanism for developing CCI is valuable to the literature and pertinent to developing countries. The associated novel approaches, such as utilizing the swish activation function, enhance the accuracy of the forecasting tool. The models can help make accurate project cost estimates, prevent financial losses, and contribute to stabilizing Pakistan’s and developing countries’ fragile economies.
2. Research Methodology
This study is conducted in three phases, as shown in
Figure 1. In the first phase, the literature on building material CCI and its calculation techniques are reviewed and analyzed using scientific literature repositories, including Web of Science, Scopus, and Google Scholar, following Ullah and Al-Turjman [
32]. In the second phase, a multi-step approach is taken to extract construction element prices from historical data. Accordingly, a formula is developed to calculate and predict CCI values for the next five years using three techniques: ANN, regression, and time series. In the final phase, the results are compared with each other and with previous studies, limitations are identified, and future research directions are suggested.
The formula for CCI in this study is derived using the prices of key elements of reinforced concrete buildings, such as Portland cement, sand, gravel, brick, and structural steel. A multi-stepped method is adopted to achieve this, as illustrated in
Figure 1. A crucial step in this process is to derive the CCI prediction formula and carefully select the base year from the study period, significantly impacting the formula’s accuracy. Once the CCI formula is derived, the subsequent step is to predict the CCI for the next five years using the three techniques employed in this study. The following sections provide detailed information about the data sources, CCI calculations, and the three techniques used to forecast the CCI.
2.1. Data Sources
ENR has a well-established method of predicting CCI using “spot prices” for all tracked materials from a single source where the same suppliers are surveyed each month to obtain updated prices [
30]. Accordingly, this research used their formula for predicting building material CCI as the base formula. In addition, modifications were made to the formula to incorporate the common construction materials of Pakistan and similar developing countries. ENR has been used by Kim et al. [
33] to develop time series models for the average pipe and labor costs of 20 cities from 1995 to 2016. Further, Kim et al. [
34] used ENR data to improve accuracy in predicting city-level CCIs through a combination of ANNs and ARIMA. Similarly, Shrestha [
35] used ENR to adjust the operational costs of highway rest area facilities.
The most commonly used construction materials in America are structural steel, lumber, and Portland cement [
4]; therefore, the ENR CCI is only related to these elements [
36]. However, in Pakistan, lumber is not used as a construction material, and the local construction is mainly based on reinforced concrete and bricks [
37]. Accordingly, for calculating CCI, the current study used the cost data of the commonly used construction materials in Pakistan, including Portland cement, sand, gravel, brick, and structural steel [
38].
The study collected data on construction material prices from reports published by PBS. These reports contained information on the total quantity of locally produced materials and their corresponding prices. The units used in the study were standard in Pakistan, with prices measured in Pakistani Rupees (PKR) and material quantity in kilograms (kg). To calculate the average unit prices of the materials, the total production quantity per year was divided by the respective cost per year, as shown in Equation (1).
Yearly costs were calculated to account for the fluctuating economy of Pakistan. The study collected data spanning 20 years (2000–2020). The data revealed that steel and cement prices had risen exponentially in recent years, while the costs of bricks, sand, and gravel had increased only slightly.
2.2. The Formula for Calculating CCI
Due to economic and political instability in Pakistan during the study period, and before a major earthquake that hit the country in late 2005 and jolted its economy, 2005 was chosen as the base year for this study. The weights of the construction materials were calculated by determining their quantities based on their unit prices and production values during the base year. Equations (2)–(5) provide the formulas used to calculate the weights of the construction elements for the base year.
Brick weight in 1000 bricks/PKR in the CCI (
BW):
Steel weight in tons/PKR in the CCI (
SW):
Cement weight in tons/PKR in the CCI (
CW):
Sand and gravel weight in m
3/PKR in the CCI (
GW):
where,
BPb: Production value of bricks at the base year in PKR.
SPb: Production value of steel at the base year in PKR.
CPb: Production value of cement at the base year in PKR.
GPb: Production value of gravel and sand at the base year in PKR.
BUb: Unit rate of bricks at the base year in PKR/1000 bricks.
SUb: Unit rate of steel at the base year in PKR/ton.
CUb: Unit rate of cement at the base year in PKR/ton.
GUb: Unit rate of gravel and sand at the base year in PKR/m3.
After calculating the weights of each construction material, they are expressed in percentage by multiplying each material’s weight by its unit cost within the base year. The index for the remaining years of the study period 2000–2020 is then calculated by multiplying the weight of each construction material by its unit price in the respective study year. The CCI obtained is a proportionate measure of the average cost change over time. The CCI for the study years, along with the corresponding actual price and predicted CCI of future years, can be used to estimate the cost of a product for any future year. This can be accomplished using Equation (6).
year A is the future year for which the product price is calculated. year B is the corresponding year for which the actual cost of the product is already known.
2.3. CCI Prediction Techniques
After calculating CCI for the study period using the derived formula, the future CCI was predicted using the three forecasting techniques. Modifications were made to the techniques to increase efficiency and accuracy. Further, a novel approach using the swish activation function was adopted to enhance the time series model. Machine learning studies commonly use three major activation functions: Tanh, Sigmoid, and Rectified Linear Unit (ReLU). ReLU is one of the most widely used techniques [
39].
Swish activation function (f(x) = x·sigmoid(x)) has been proposed recently [
40]. It is a non-monotonic function that is smooth and consistently performs as well as or better than ReLU on deep networks. It has been successfully applied in various challenging domains, such as image classification and machine translation. Its non-monotonic property makes it stand out from other activation functions. Swish is simple and shares similarities with ReLU, making it easy for practitioners to substitute Swish units for ReLU in any neural network. In this study, Swish was used to improve the accuracy of the predicted results.
2.3.1. ANN
ANN is a popular technique for predicting future values using historical data, using units that function like neurons, and modeling correlations between inputs and outputs [
41]. It comprises three layers: input, hidden, and output. Variables are assigned weights based on their impact on the output. This research uses the NeuroXL Clusterizer tool, a self-sorting neural network plugged into Microsoft Excel
® (Microsoft Corporation, Redmond, Washington, DC, USA). The calculation process involves two steps: studying and testing the algorithms. To achieve this, the data from 2000–2020 were divided into two parts, with 80% of the data being utilized for training and the remaining 20% being used to test the model.
The Pseudocode for ANN adopted for this research is as follows:
Create an input database
- 2
Input ← database with all possible variable combinations
Train ANNs
- 3
for input = 1 to end of input, do
- 4
for neurons = 1 to 10 do
- 5
for repeat = 1 to 10 do
- 6
Train ANN
- 7
ANN storage ← save the highest test R2
- 8
end for
- 9
end for
- 10
ANN storage ← save the best prediction ANN depending on the input
- 11
end for
- 12
return ANN-Storage → Library with best predicting ANN for every variable combination
- 13
end procedure
It is important to note that this approach can be applied to any dataset worldwide; the model will select the number of neurons and training parameters based on the specific dataset. Thus, it will determine the best model parameters to achieve the highest possible accuracy. However, the model optimizers and building parameters will vary and must be adjusted according to the specific dataset.
2.3.2. Linear Regression
Linear regression is a mathematical technique used to examine the linear relationship between independent and dependent variables [
15]. It is commonly used to model the relationship between scalar variables. It has been used to develop cost models since 1970. The current study used the least square linear regression method to forecast the CCI and calculate the associated R
2 value.
2.3.3. Time Series
The time series method predicts future values based on past data trends using time as the independent variable [
18]. It consists of methods that recognize the fundamental setting of the information and make precise estimates. The absence of historical data can be problematic when applying this technique [
42]. Univariate time series analysis is used in this study as it requires only one input variable to create the model. This research uses the autoregressive model, which was developed using Python, to predict CCI. The autoregressive model used in this study is shown in Equation (7).
Here,
The autoregressive model’s order (p) represents the amount of historical data from preceding years used by the model to predict future CCI for each year. In this study, an autoregressive model of order 3 (AR3) was used. This was selected as it provided the highest spatial autocorrelation. Following AR3, the highest accuracy was achieved at an order of 6.
3. Results, Analysis, and Discussions
As explained in the method section, the weights of each building construction material considered in this study were calculated using Equations (2)–(5). The results of this calculation are given below:
The weights are then converted into percentage weights, as mentioned in the methodology section. The study results indicate that steel and cement have relatively higher percentage weights than sand and gravel. Moreover, bricks have the lowest percentage weight value among all the selected construction materials. The resulting CCI formula derived from the calculated weights of each building construction material is given in Equation (8).
where,
BUi: Unit rate of brick for the year i.
SUi: Unit rate of steel for the year i.
CUi: Unit rate of cement for the year i.
GUi: Unit rate of gravel and sand for the year i.
The CCI for the remaining study years was calculated using Equation (8), and the results are presented in
Table 1. In total, 960 data points were used in the current study to compute the CCI. This was the sum of values for the four building construction materials, calculated monthly over the 20-year analysis period (20 × 4 × 12). The CCI values for each year presented in
Table 1 were utilized to develop and test the model using the three techniques, i.e., ANN, time series, and regression.
Table 1 shows CCI values for 2000–2020, in line with other studies [
4], with inflation rates consistently rising except for 2005, 2008, 2013, and 2019, as was the case for most developing countries. The CCI decrease during these years was due to lower steel and cement prices and government policy changes aimed at gaining public support for re-election, with outgoing governments reducing prices in 2008, 2013, and 2018.
New governments formed in 2008 and 2019 introduced price control measures that slightly reduced CCI values. In 2019, these measures were aimed at creating job opportunities and stabilizing the local economy, while in 2005, a catastrophic earthquake caused a price reduction, and price control measures were introduced to help disaster-affected communities rebuild their homes and businesses.
Table 1 highlights the fragile and constantly changing nature of Pakistan’s economy, with an overall increase in CCI values indicating a gradual rise in inflation over the years, leading to higher construction material prices.
3.1. Calculating and Forecasting CCI
After calculating CCI values for the study period, the future CCI has been forecasted using the three prediction models used in this study. The associated results are discussed below.
3.1.1. Calculating and Forecasting CCI Using ANN
The ANN model achieved a mean error (ME) of 0.04 during the testing stage, making it capable of predicting CCI with acceptable accuracy.
Figure 2 shows the CCI prediction profile generated by the ANN model, revealing a significant shift in trend in 2005 due to the earthquake disaster. This resulted in a dip in the CCI curve that year as inflation rates were artificially reduced to assist those affected. However, the curve gradually increased in the subsequent years as measures were taken to stabilize the economy after the artificial control measures were lifted. In 2008, another dip in the curve was observed due to the newly elected government’s implementation of price control measures.
There was also a spike in the CCI pattern in 2011 and 2012 due to the devastating floods of 2010–2011 [
43], reducing agricultural output and leading to higher inflation. The 2013 elections saw the government artificially decrease some costs to gain public support, resulting in hikes in CCI in 2015 when conditions normalized. Further, the preparatory cost of the elections and artificial price control negatively impacted the economy, causing price hikes and escalated inflation rates in subsequent years.
In 2020, the world was hit by the COVID-19 pandemic, and Pakistan was no exception. As a result, the country, as was the case for many other developing economies, faced a major economic crisis, leading to an unprecedented rise in inflation rates. This situation can also be seen in the CCI curve, where a sharp spike can be observed. The pandemic caused supply chain disruptions, reduced trade, and decreased demand, ultimately leading to increased inflation rates and adversely affecting the country. Additionally, the government’s printing of more currency to support their expenses further contributed to inflation. However, the curve shows a declining trend in recent years, indicating that the economy is gradually stabilizing.
In
Figure 2, the blue line shows the CCI values for 2000–2020, and the grey line displays the predicted future CCI values for 2021–2025. The CCI value for 2021 is 1405, which is predicted to increase steadily to 1533 by 2025. This upward trend is due to Pakistan’s fragile economic situation, which the COVID-19 pandemic has further exacerbated. The government has taken on more foreign loans to stabilize the economy, but this has also led to increased inflation rates due to stricter debt conditions imposed by organizations such as the International Monetary Fund (IMF). The predicted CCI curve’s upward slope reflects this trend. Immediate corrective actions are needed to prevent further deterioration of the economy and wider society.
3.1.2. Calculating and Forecasting CCI Using the Linear Regression Method
This study used linear regression to predict CCI with an R
2 value of 0.9269, indicating dependable outcomes.
Figure 3 shows the predicted CCI values for 2021–2025, which display a nearly linear trend. However, this trend is unexpected given the continuous fluctuations in the historical CCI record for the years 2000–2020, influenced by the ever-changing political and security situation in Pakistan. An entirely linear forecast of future economic conditions seems unrealistic, and thus, the linear regression technique only provides an approximate trend for the predicted future CCI, which may not be as reliable as the predictions made by the ANN model.
Other studies, such as those by Adeli and Wu [
44], have also concluded that linear regression is not the best approach for estimating CCI. They argue that this technique is unsuitable for developing cost models as it lacks a clear approach to help estimators choose the best model that fits the historical data. Additionally, the regression technique requires identifying all input variables upfront, which can be challenging and may lead to higher errors [
45].
3.1.3. Calculating and Forecasting CCI Using Time Series
In this research, the autoregressive model shown in Equation (7) was used to predict CCI through time series analysis. An order of 10 was selected for this model, which means that the current model uses data from the preceding ten years to predict future CCI. Python libraries, including NumPy, pandas, Seaborn, Matplotlib, sklearn.model_selection, sklearn.linear_model, sklearn.metrics, and sklearn.preprocessing, were used to develop all the models in the study. The libraries were used for data handling, visualization, importing, training, testing, splitting the datasets, and calculating the Mean Absolute Error (MAE) and Root Mean Square Error (RMSE). The linear regression model was imported using sklearn.linear_model library. Further, the conventional ARIMA model was used for time series analysis. The models were verified by calculating ME, MAE, and U-Stat.
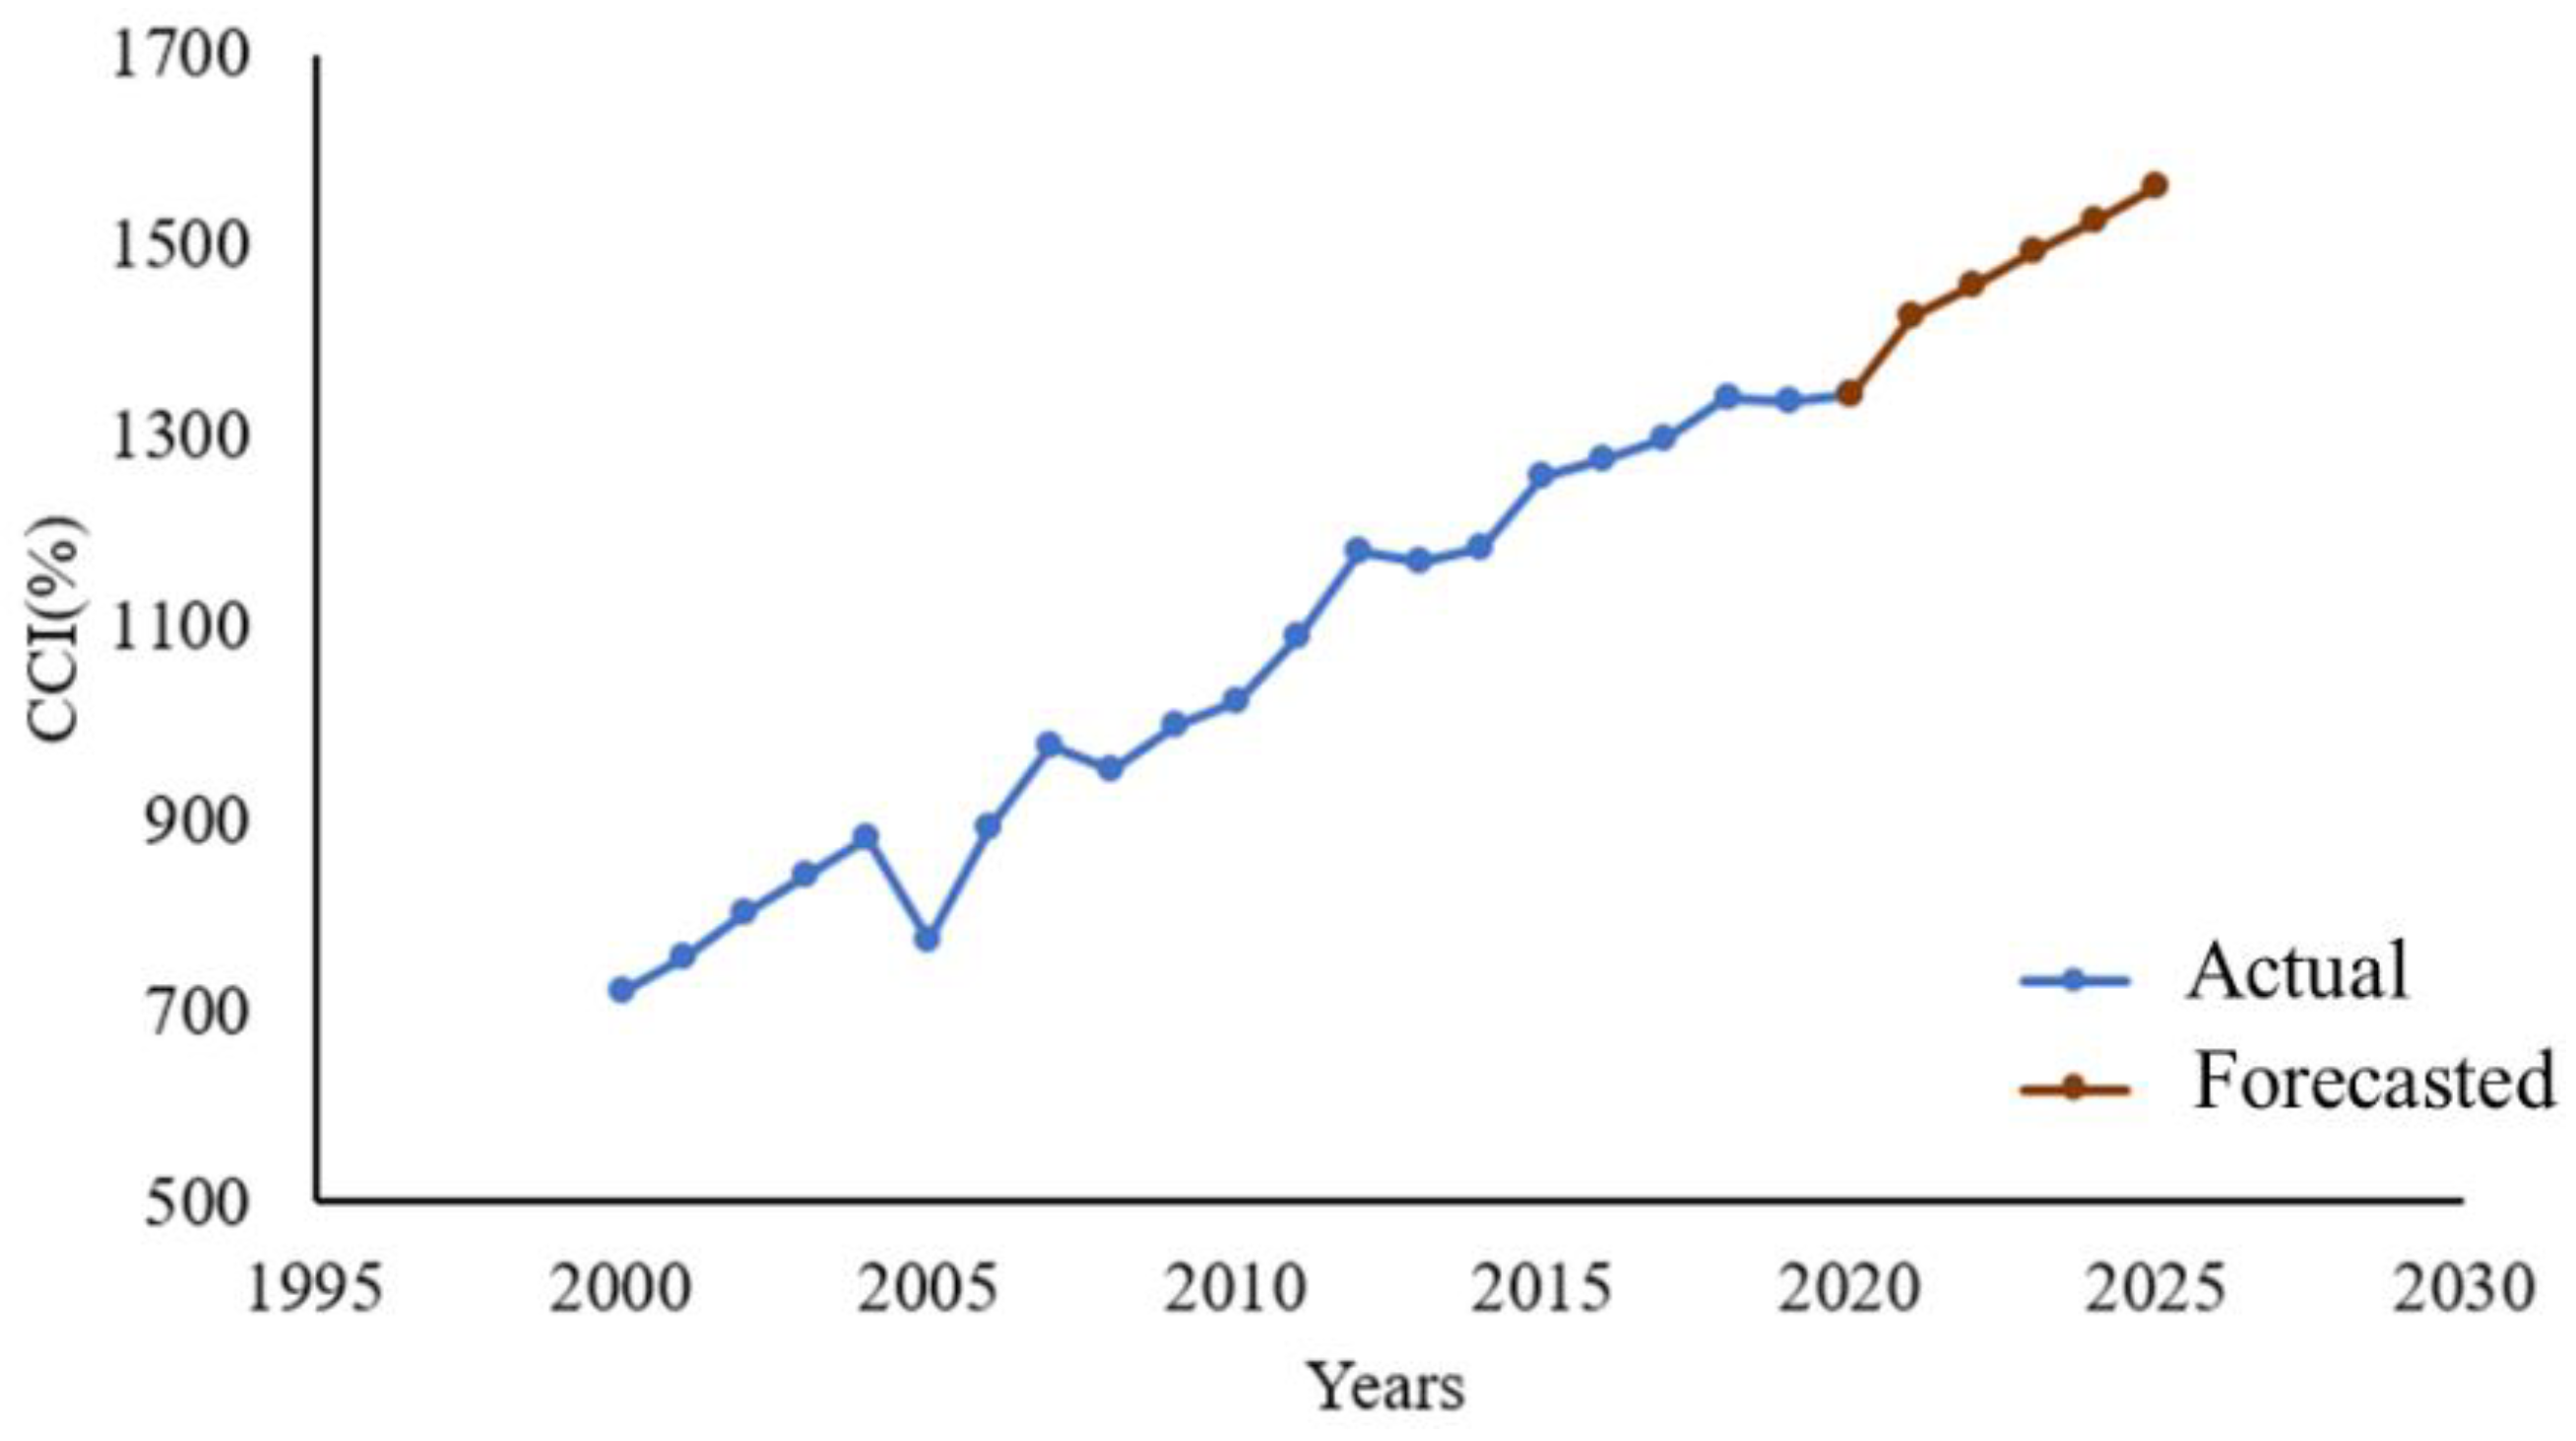
Figure 4 shows the predicted CCI trend for 2021–2025 using the autoregressive time series technique. The predicted CCI values start at 1376 for 2021 and increase steadily to 1545 by 2024 due to Pakistan’s unstable economy and high inflation rate. The instability can be attributed to factors such as corruption, repayments of foreign remittances, and aid in fighting the pandemic. The time series model’s prediction of a decline in the CCI value in 2025 is unrealistic, as it does not align with the current situation in Pakistan. There are no scheduled events to suggest a sudden reduction in inflation, and the country’s economy is currently struggling. However, the overall upward trend in the prediction curve seems more realistic, except for the unexpected dip in the last year of the forecast.
3.2. Assessment of Forecasting Precision
Results from all prediction models were compared in
Table 2 and
Figure 5. CCI values for all models showed an increasing trend after 2020. However, the ANN and time series models predict a decrease in 2025, with the time series model showing a significant drop that appears unrealistic. The regression model predicts a continuous increase in CCI values, with a rise from 1345 in 2020 to 1566 in 2025.
Figure 5 compares the predicted trends of the CCI for Pakistan from 2021 to 2025 using the regression, ANN, and time-series models. The brown line represents the regression model, the grey line represents the ANN model, and the orange line represents the time-series model. The regression model predicts a nearly linear trend post-2023, which is unlikely given the historical fluctuations in CCI due to the country’s uncertain political and security situations. In contrast, the ANN and time-series models’ predictions align with the past CCI trend from 2000–2020, where the CCI value does not show a consistently linear trend for a long time. The ANN model’s results are more accurate and reliable than the time series and regression models, predicting a more plausible dip in CCI values for 2025. The regression model predicts the highest CCI value of 1560 for 2025, while the time-series model predicts the lowest CCI value.
ME, MAE, and U-Stat values were calculated to evaluate the accuracy of the three prediction models used in this study. These measures are commonly used in cost prediction studies and can help determine the best model [
46]. ME is the average of all errors in a dataset, while MAE is the average of absolute forecast errors. The smaller the values of these measures, the better the model’s prediction ability. U-Stat is a relative accuracy measure that compares forecasted results with minimal historical data, with deviations squared to give more weight to and exaggerate large errors. A U-Stat value of less than 1 suggests that the forecasting technique is superior to guessing, equal to 1 suggests it is as good as guessing, and greater than 1 suggests it is worse than guessing.
Table 3 shows the ME, RMSE, MAE, and U-Stat values for the three prediction models. All models have low error values, indicating the effectiveness of the accuracy-enhancing techniques used in the study. The U-Stat values are less than 1 for all three models, indicating that they are better than guessing. The ANN model has the lowest error values, with a ME of 0.04, RMSE of 34.91, MAE of 28.3, and a U-Stat of 0.62, making it the most accurate model for predicting future CCI compared to the other two methods. Therefore, it can be concluded that the ANN model provides the most reliable results.
Table 3 confirms that the time series and regression models have higher error values than the ANN model, indicating that they provide less accurate results. However, the regression model is as reliable as ANN due to their similar MAE values. Overall, the ANN model offers the most dependable results in this study as it has MAE and U-Stat values similar to the regression model but outperforms both in other error measures.
The current study shows superior results compared to published articles. Wang and Ashuri [
30] used K-NN and PERT techniques and obtained higher MAE values than the current models indicating superior results of the current study. Similarly, Moon [
31] used the VECM technique and obtained an MAE value greater than the current research. The results of this study are aligned with Jafarzadeh et al. [
47], who found the ANN approach to be best fitted for predicting the seismic retrofit construction cost. Further, Wilmot and Mei [
48] and Wang et al. [
49] also identified ANN as the best-fitted model for predicting construction cost. Therefore, it can be inferred that the approach adopted in developing the models in the current study has successfully increased their accuracy.
The swish activation function and other modifications led to highly accurate models in this study, with the ANN model providing the most precise predictions of CCI values. This is useful for contractors and project owners in accurately estimating budgets and avoiding delays and cost overruns, especially in long-term projects undertaken in developing countries. In addition, the ANN model for CCI prediction can also contribute to stabilizing Pakistan and other developing countries’ volatile economic situation during and after the pandemic, promoting economic growth and development in the construction industry and megaprojects.


