1. Introduction
The teen pregnancy rate in the U.S. has declined dramatically over the last two decades [
1], declining by almost one-third (31%) between 2000 and 2010 (the most recent year for which data are available) from 83.4 pregnancies per 1000 teenaged women to 57.4 pregnancies per 1000 teenaged women. This decline is the result of two underlying trends: reductions in the percentage of teenagers who are sexually active and improvements in contraceptive use among teens who are sexually active. There has been some debate about whether recent declines in teen pregnancies are due primarily to increases in abstinence or to improvements in contraceptive use. A number of studies have attempted to parse out the relative importance of these trends. These studies generally find that both factors have contributed to the reduction in teen pregnancies. The estimated magnitudes of the abstinence and contraceptive effects, however, differ, based on the specific time period studied, the dataset used, and the way in which sexual activity and contraceptive use are measured. For example, two studies that focused primarily on trends in the 1990s found that declines in sexual activity had the greatest impact on reductions in teen pregnancy. Mohn
et al., [
2] found that the decline in teens engaging in sex accounted for 67% of the drop. Meanwhile, Santelli
et al., [
3] calculated that 53% of the decline in teen pregnancy rates among high school students could be attributed to a higher percentage delaying sexual initiation and the rest could be attributed to improved contraceptive use.
However, more recent studies, using data into the 2000s, found that trends in contraceptive use had a greater impact on reductions in teen pregnancies or births. Santelli
et al., [
4] found that improvements in contraceptive use accounted for 86% of the reduction in teen pregnancy between 1995 and 2002 for teens aged 15–19. The authors also found that improved contraceptive use accounted for 77% of the reduction in pregnancies among teens aged 15–17. Kearney and Levine [
5] studied the related drop in teen births between 1991 and 2007 among high school students and found that increased contraceptive use was responsible for 65% of the decline. Additionally, a review by the Guttmacher Institute found there was no decline in the share of teens who were sexually experienced between 2003 and 2010, but found evidence of improvements in contraceptive use (reductions in non-use combined with increases in the use of more effective methods). The report concluded that the decline in the teen pregnancy rate during that time period was due primarily to improvements in contraceptive use [
6].
Although estimates differ based on time period and measurement, all of these studies found that a substantial percentage of declines in teen pregnancies or births were due to changes in contraceptive use among teens. However, none of the papers described above examined which changes in contraceptive use contributed most to the overall contraceptive effect. This is an important gap in the literature because some changes in contraceptive use have greater impacts than others. For example, long-acting reversible contraceptive (LARC) methods, such as Intrauterine Devices (IUDs) and subdermal implants are notably more effective than other, more user-dependent methods such as condoms and oral contraception. Because they are less susceptible to user error, these methods’ perfect-use failure rates (the annual rates of pregnancy among women who use their methods consistently and correctly at each act of intercourse) and their typical-use failure rates (the average annual pregnancy rates accounting for the fact that many women do not always use their method correctly and consistently) are both less than 1% [
7]. On the other hand, among pill users, the perfect-use failure rate is about the same as for long-acting methods, but the typical-use failure rate is higher, at 9% [
7]. Among condom users, the perfect-use failure rate is only 2%, while the typical-use failure rate is 18% [
7]. Studies have found that teens are less likely than adults to be perfect users of their chosen birth control method and therefore experience even higher failure rates when relying on user-dependent methods [
8,
9,
10]. Therefore, increasing the percentage of teen women using highly effectively LARCs can further reduce pregnancies
versus increasing the percentage that use condoms.
While there is considerable variation in different methods’ failure rates, even the least effective methods can substantially reduce the risk of pregnancy, relative to the use of no method. Our analyses of the 2011–2013 wave of the National Survey of Family Growth (NSFG) suggest that 12% of teens who were sexually active in the past three months did not use contraception at last sex. The annual rate of pregnancy is estimated to be 85% among sexually active women who do not use contraception [
7]. It might be possible, then, to achieve meaningful further reductions in teen pregnancy without large increases in the use of the most effective (but the least prevalent) forms of contraception. For example, previous research has found that dramatic reductions in the pregnancy rate can be achieved by increasing the use of condoms among those who are using no method of contraception [
11]. We shed light on this issue by documenting the changes in teens’ use of long-acting methods and various other forms of contraception that accompanied the precipitous drop in teen pregnancies over the last decade. We then use a unique microsimulation model, Teen FamilyScape, to estimate the way in which changes in teens’ contraceptive behaviors contribute to population-wide changes in pregnancy rates. The results of these analyses allow us to assess which of these changes were the most important to the reduction in the teenage pregnancy rate between 2002 and 2010. We chose this time period in part because of recent changes in contraceptive method use among teens. Additionally, our focus on these years allows us to study the more recent decline in teen pregnancy, thereby expanding on previous work that focused on the 1990s and early 2000s.
2. Methods
Teen FamilyScape was developed by researchers at Child Trends, Georgetown University, and The Brookings Institution
1. The model is designed to reproduce real-world fertility-related behaviors and outcomes among teenagers in the United States. We use data from a range of sources
2 to ensure that we realistically simulate the rate at which teenage women have sex; the frequency with which sexually active teens use contraception; the types of male-controlled and female-controlled contraception that they use; the number of teens who switch onto and off of various contraceptive methods; the frequency with which teens using various types of contraception (or none at all) become pregnant; the share of teen pregnancies that result in live births, abortions, and fetal losses; and the gestation and postpartum infertility periods for each of these pregnancy outcomes.
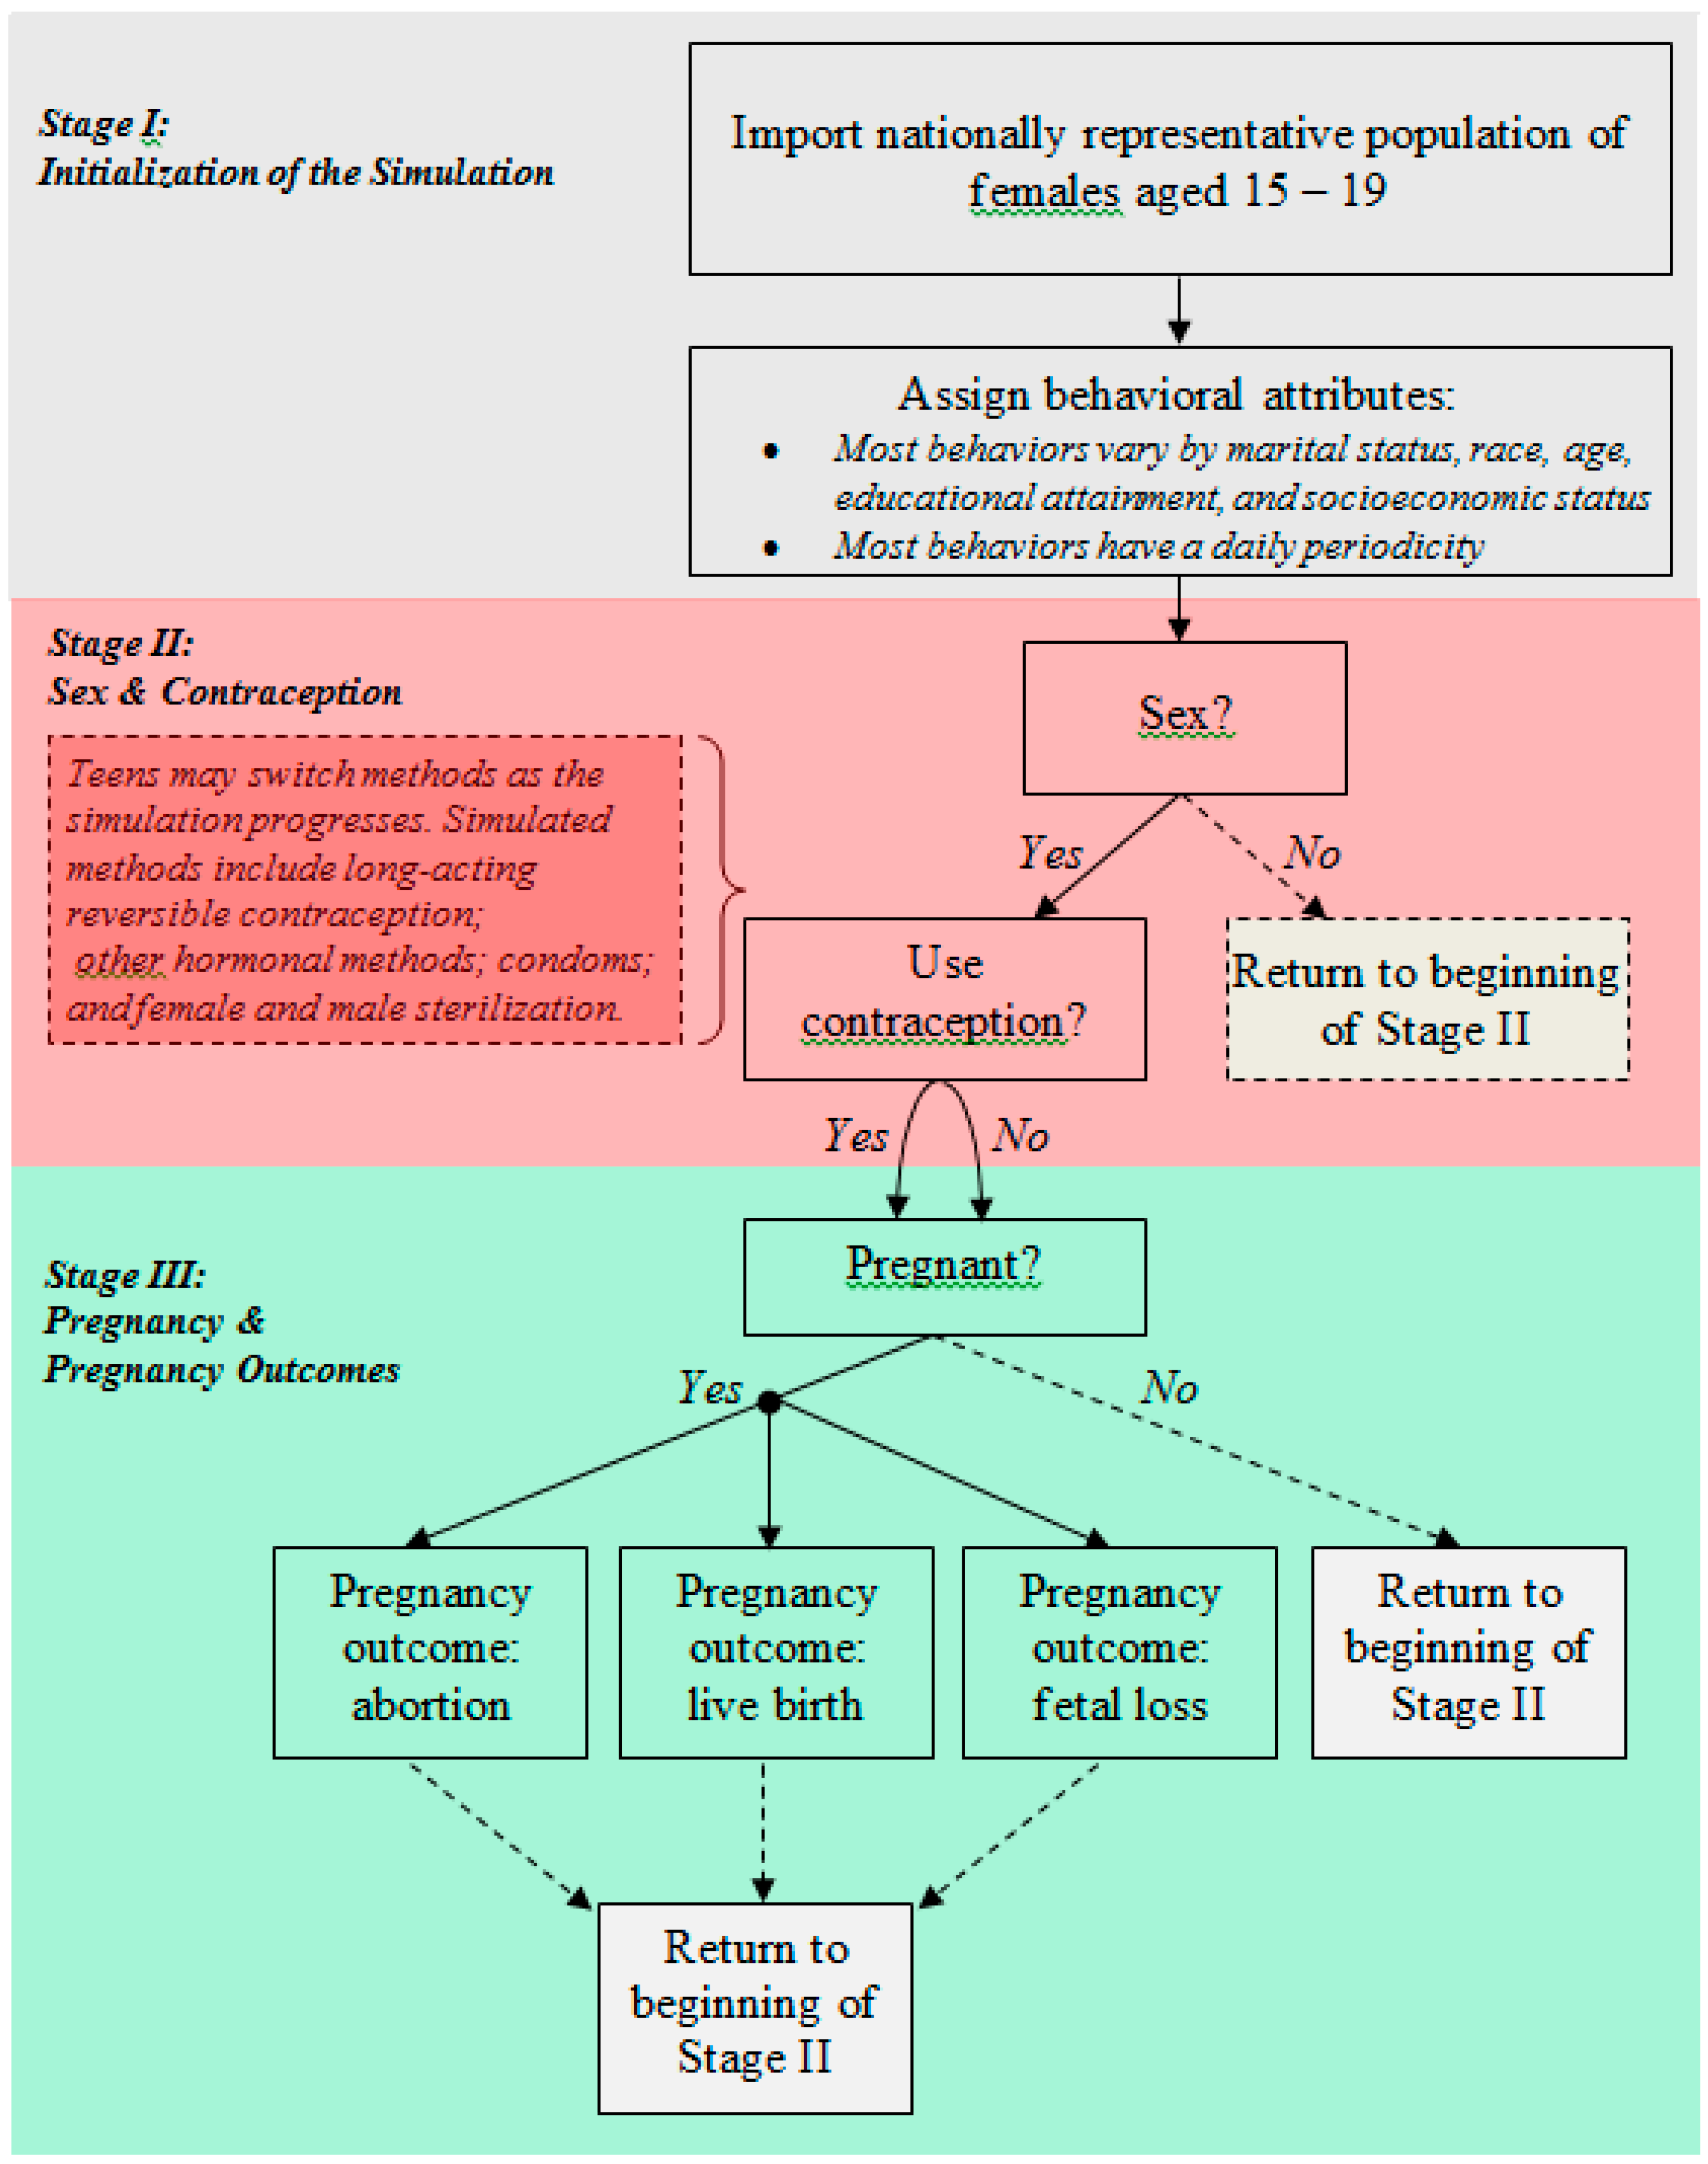
Figure 1 diagrams Teen FamilyScape’s three simulation stages. The model has a daily periodicity, which is to say that each increment in analysis time corresponds to a single day. In the first stage of the simulation, we use the female respondent file of the 2006–2010 National Survey of Family Growth (NSFG)
3—a nationally representative survey that contains extensive information on sexual activity, contraceptive use, and fertility outcomes—to populate the model with a group of teenage women whose demographic characteristics are nationally representative with respect to marital status, age, race, educational attainment, and socioeconomic status [
12]. Most simulated behaviors and outcomes vary according to these demographic attributes.
In the second simulation stage, we use data from the NSFG to model sexual and contraceptive behavior. Teen FamilyScape realistically models distributions of the number of months in which teen women are sexually active and the number of days in which they have intercourse during sexually active months. The model also produces realistic distributions of teenage contraceptive use. We simulate the use of three different categories of female-controlled contraception: LARC/injectable methods, including IUDs, implants, and injectables; female sterilization
4; and other female-controlled methods, such as the pill, contraceptive patch, or vaginal ring (PPR)
5. With respect to male-controlled methods, we simulate the use of condoms, withdrawal and male sterilization
6. We would have preferred to place injectables in their own category, as they have higher failure rates than IUDs and implants. However, sample size restrictions prevented us from doing so. We do, however, account for differential changes over time in the use of injectables
versus IUDs and implants (explained in the next section). The model allows teens to switch contraceptive methods over the course of the simulation. Thus, as analysis time passes, some non-contracepting teens will begin to use contraception, and some contracepting teens will discontinue contraceptive use or switch to a different method.
Figure 1.
Summary diagram of the Teen FamilyScape Microsimulation Model.
Figure 1.
Summary diagram of the Teen FamilyScape Microsimulation Model.
Teen FamilyScape’s third and final stage models the occurrence of pregnancy. A teen’s risk of pregnancy when she has sex is dependent on her underlying fecundity (
i.e., her probability of experiencing a pregnancy from a single act of unprotected intercourse) and the efficacy of any contraception that she is using. Fecundity varies according to a girl’s age and the day in her menstrual cycle. Thus, on each new day within the simulation, we update each girl’s menstrual calendar and modify her age-adjusted pregnancy probability accordingly. The model’s fecundity parameters were developed by synthesizing the results of several fertility studies (see Thomas and Karpilow (2015) for more information on these fertility studies) [
11].
We developed Teen FamilyScape’s contraceptive efficacy parameters by combining information on the age-dependent fecundities, coital frequencies, and typical-use pregnancy rates of girls in each contraceptive category. We estimated fecundities and coital frequencies using NSFG data, and we produced method-specific pregnancy rates by combining a number of different published estimates. More specifically, for each contraceptive method incorporated into our simulations, we: (a) used data reported in Trussell
et al., (1997) to compute a ratio of the pregnancy rate among teen users of the method in question to the pregnancy rate among all users of that method; and (b) multiplied this ratio by Trussell’s (2011) more recently estimated method-specific pregnancy rate for all women [
7,
13]. This allowed us to take advantage of Trussell
et al.’s teen-specific estimates (which are the most recent of which we are aware) and to update those estimates under the simplifying assumption that there has been no change over time in the proportional difference between the method-specific pregnancy rates experienced by teen contraceptors and all contraceptors. We then calculated weighted averages of these teen-specific, method-specific pregnancy rates for each of the model’s contraceptive categories, where the weights reflected the share of teens in a given category who use each of the methods falling into that category. Thus, for example, our final failure rate for the LARC/injectable method category is a weighted average of the pregnancy rates experienced by teenage women who use IUDs, implants, and injectables. Our weights were constructed using age-specific estimates of the distribution of methods used at last sex as reported by Jones
et al., [
14]. The only exceptions to this rule are male and female sterilization, both of which we always assume to be 100% effective.
We would also note that, because of sample-size limitations, we do not model separate contraceptive efficacy rates for dual-method and single-method users. Our efficacy parameters instead reflect the average risk of pregnancy across dual-method and single-method users. As such, we assign to each member of the simulation population an efficacy rate that corresponds to the most effective method (if any) that she is using. Thus, for example, we use PPR efficacy rates to model the risk of pregnancy among pill users (whether or not they are also using condoms), and we use condom efficacy rates to model the risk of pregnancy among teen women who rely on condoms and are not using a female-controlled method. We followed the approach outlined in Thomas and Karpilow (2015) to model pregnancy risk among non-contraceptors [
11].
Every simulated pregnancy eventually results in a birth, an abortion, or a fetal loss (
i.e., a miscarriage). We used data reported in Ventura
et al., (2012) to develop the model’s pregnancy-outcome parameters [
15]. For each pregnancy, we also simulate a gestation period and an interval of post-pregnancy infertility, both of which vary according to the pregnancy’s outcome (see Thomas and Karpilow (2015) for more information) [
11]. Although an individual may continue to have sex while she is pregnant, she is not at risk of pregnancy until after her interval of post-pregnancy infertility has ended.
Teen FamilyScape can be validated by comparing its outputs to their equivalent real-world benchmarks.
Table 1 compares simulated and real-world rates of teenage pregnancy, childbearing, and abortion. For all three outcomes, the model closely approximates the relevant real-world benchmark
7.
Table 1.
Pregnancy and pregnancy outcome rates, 2008.
Table 1.
Pregnancy and pregnancy outcome rates, 2008.
| | Teen FS | Ventura et al. |
|---|
| Pregnancies per 1000 teens | 70.0 | 69.8 |
| Births per 1000 teens | 40.8 | 40.2 |
| Abortions per 1000 teens | 17.2 | 17.8 |
2.1. Description of Simulation Specifications and Results
We used Teen FamilyScape to model the effects of historical changes in teen women’s contraceptive use on the teen pregnancy rate. The first and fourth columns of
Table 2 report the distribution of contraceptive use among teenage female respondents in the 2002 and 2011–2013 NSFG samples. As was done in previous research [
4], we focused in particular on the method used at last sex among respondents who were sexually active in the three months prior to the survey. Based on these distributions, the share of sexually active teens who failed to use contracgeption at last sex fell by 4.9 percentage points over the past decade (from 17.1% to 12.2%). This reduction in non-contraception was accompanied by an increase in condom, PPR, and LARC/injectable method use. The condom category experienced the largest percentage-point increase, followed by the PPR category and the LARC/injectable category. Additional analyses of the NSFG (not shown here) found that, between 2002 and 2011–2013, this 4.9 percentage-point increase in contraceptive use was accompanied by a similar reduction of 4.7 percentage points in the number of sexually active teens (those having sex in the past three months), suggesting that both factors were associated with declines in teen pregnancy over this time period.
Table 2.
Decomposition of changes in teenage contraceptive use between 2002 and 2011–2013 and simulated effects on the teen pregnancy rate.
Table 2.
Decomposition of changes in teenage contraceptive use between 2002 and 2011–2013 and simulated effects on the teen pregnancy rate.
| Most Effective Method Used at Last Sex | (1) 2002 Distribution | (2) 2002 Distribution + Increased Condom Use | (3) 2002 Distribution + Increased Condom and PPR Use | (4) 2011–2013 Distribution: 2002 Distribution + Increased Condom, PPR and LARC/Injectable Method Use | Total |
|---|
| Sterilization | 0.7% | 0.2% | 0.0% | 0.0% | - |
| LARC/injectable | 9.8% | 9.8% | 9.8% | 10.1% | - |
| IUD/Implant | 0.6% | 0.6% | 0.6% | 3.3% | - |
| Injectable | 9.2% | 9.2% | 9.2% | 6.8% | - |
| Pill, patch, ring (PPR) | 36.0% | 36.0% | 37.2% | 37.2% | - |
| Condom | 36.4% | 40.5% | 40.5% | 40.5% | - |
| No method | 17.1% | 13.5% | 12.5% | 12.2% | - |
| Simulated reduction in the number of pregnancies per 1000 teen women | - | −4.7 | −1.7 | −1.8 | −8.1 |
| % of the Total Contraceptive Effect | - | 57.6% | 20.6% | 21.8% | 100% |
Our objective was to develop separate estimates of the effects of the increases in teenage women’s use of condoms, PPR methods, and LARC/injectable methods between 2002 and 2011–2013 on declines in teen pregnancy rates. We therefore began by re-parameterizing Teen FamilyScape to replicate the 2002 distribution of method use at last sex as reported in column (1) of
Table 2. We then implemented a series of intermediate simulation specifications in which we successively aligned the proportion of teens who use each of these three method types with the corresponding benchmark from the 2011–2013 distribution. For all three simulations, we moved a subset of teens out of the “sterilized” and “no method” categories, which are the two categories that shrank in size during our period of interest. We specified these reductions in sterilization and non-contraception so as to ensure that we were ultimately able to replicate the 2011–2013 distribution of teenage contraceptive use.
Table 2 shows that, between 2002 and 2011–2013, the share of teens who were sterilized fell by 0.7 percentage points, while the share of teens who were noncontraceptors fell by 4.9 percentage points. Thus, we ultimately simulated changes in contraceptive use for 5.6% (0.7% + 4.9%) of teens
8. After implementing these three specifications, we arrived at the 2011–2013 distribution of teen method use. The change in the teen pregnancy rate from one specification to the next reflects the estimated effect of the corresponding change in contraceptive use between 2002 and 2011–2013.
For the first of our three simulations, we started with the 2002 distribution of contraceptive use and then moved a subset of sterilized and non-contracepting teens in the Teen FamilyScape model into the condom use category, which yielded the distribution shown in column (2). In this distribution, the share of teens who were condom users was the same as in the 2011–2013 distribution; the share of teens who were sterilized or non-contraceptors was smaller than in the original 2002 distribution; and the shares of teens who were PPR and LARC/injectable method users were held constant at their 2002 levels. The difference between the simulated teen pregnancy rates produced by the distributions shown in columns (1) and (2) was our estimate of the effect of the increase in condom use between 2002 and 2011–2013, a decrease of almost five pregnancies per 1000 teen women.
For the second simulation, we began with the distribution in column (2) and then moved a subset of the remaining sterilized and non-contracepting teens into the PPR category. This specification yielded the distribution shown in column (3), in which the shares of teens who were condom and PPR users were the same as in the 2011–2013 distribution, while the share of teens who were LARC/injectable method users was again unchanged relative to the 2002 distribution. The difference between the simulated teen pregnancy rates produced by the distributions shown in columns (2) and (3) was therefore our estimate of the effect of the increase in PPR use between 2002 and 2011–2013, a decrease of approximately two pregnancies per 1000 teen women.
Finally, for the third simulation, we began with the distribution in column (3) and then moved a subset of the remaining sterilized and non-contracepting teens into the LARC/injectable method category, which yielded the 2011–2013 distribution of contraceptive use shown in column (4). The difference between the simulated teen pregnancy rates produced by the distributions in columns (3) and (4) was our estimate of the effect of increased LARC/injectable method use, a decrease of approximately two pregnancies per 1000 teen women.
Note that Teen FamilyScape combines LARCs and injectables into a single category encompassing IUDs, implants, and injectables. The efficacy rates for IUDs and implants are higher—and their discontinuation rates are lower—than for injectables. Among teens who used one of these three methods, the share who relied specifically on IUDs or implants rose from less than 10% in 2002 to nearly one third in 2011–2013. For the simulation described above, we adjusted the LARC/injectable category’s efficacy and discontinuation rates in order to account for changes over time in mix of LARC/injectable methods used by teens
9. We did not make similar adjustments when we simulated increased PPR use because the estimated efficacy and discontinuation rates for the pill, patch, and ring are very similar [
7]. We would also note that, aside from adjusting efficacy and discontinuation rates within the LARC/injectable category, we did not model any other changes over time in the probability of contraceptive discontinuation or in the consistency of correctness of method use. Nor did we simulate the effects of changes in coital frequency or in teenagers’ demographic characteristics. This is because our specific purpose was to isolate the effects of changes in contraceptive use during a typical act of intercourse, holding all else constant.
Overall, we found that changes in contraceptive use produced a reduction of 8.1 pregnancies per 1000 teens in the teen pregnancy rate, which corresponds to a little less than half of the decline in teen pregnancies during our period of interest (17 pregnancies per 1000 teenage women between 2002 and 2010) [
1]
10. Our results imply that more than half (about 58%) of this contraceptive effect was driven by increased condom use and that the remainder was attributable in roughly equal measure to increased PPR and LARC/injectable method use
11. Other simulation results (not shown here) indicated that about 30% of the “LARC/injectable method effect” was attributable to the growth in the number of teens who used an IUD, an implant, or an injectable. The remaining 70% of the effect was attributable to the fact that, among teens who used these three methods, there has been an increase in the share who rely more specifically on IUDs and implants rather than injectables.
2.2. How Important Was the Decline in Non-Contraception?
During our period of study, increases in the use of effective methods were accompanied by a substantial reduction in the number of non-contracepting teens. To understand the relative importance of the decline in non-contraception as compared to the increase in the use of effective methods, we performed a final counterfactual simulation in which we modeled a change in contraceptive behavior for the same number of teens as in our main specifications (approximately 5% of sexually active teens), but we assumed that the number of non-contraceptors remained constant. We instead achieved the desired change in contraceptive use by moving a subset of condom users onto more effective methods.
The top panel of
Table 3 shows our simulated counterfactual distribution of method use. We also restate the 2002 distribution that is reported in
Table 2. As was the case in our earlier simulations, we once again move 0.7% of teens out of the sterilization category. However, whereas our main specifications assumed a 4.9 percentage-point reduction in the share of teens who were non-contraceptors, we assumed instead for this simulation that there was a 4.9 percentage-point reduction in the share of teens who used condoms, as well as a 0.7 percentage point decline in sterilization. All of these “former condom users” were moved into the PPR and LARC/injectable method categories. We assumed that the ratio of new LARC/injectable method to PPR users was identical to the equivalent ratio as measured in our real-world 2011–2013 distribution (see
Table 2, column 4). Under this assumption, the sizes of the LARC/injectable method and PPR categories increased by 1.2 and 4.4 percentage points, respectively. As was the case for our earlier simulations, we also modeled increases in contraceptive efficacy and reductions in discontinuation rates among LARC/injectable method users in order to account for changes over time in the mix of LARC/injectable methods that are used by teens.
Table 3.
Counterfactual simulation of changes in teenage contraceptive use.
Table 3.
Counterfactual simulation of changes in teenage contraceptive use.
| Most Effective Method Used at Last Sex | (1) 2002 Distribution | (2) Counterfactual Distribution |
|---|
| Sterilization | 0.7% | 0.0% |
| LARC/injectable method | 9.8% | 11.0% |
| Pill, patch, ring (PPR) | 36.0% | 40.4% |
| Condom | 36.4% | 31.5% |
| No method | 17.1% | 17.1% |
| Simulated Reduction in the Number of Pregnancies per 1000 Teenaged Women | −3.0 |
We found that, when we moved from the 2002 distribution of method use to the counterfactual distribution shown above, the teen pregnancy rate was reduced by 3.0 pregnancies per 1000 teenage women. This effect was only about 37% as large as the effect that was produced when we modeled the change from the 2002 distribution to the actual 2011–2013 distribution (an overall decline of 8.1 pregnancies per 1000 women). In other words, moving non-contracepting teens onto condoms had a larger impact on the teen pregnancy rate than moving teen condom users onto PPR and LARC/injectable methods. Thus, our analyses indicate that the decline in teen pregnancy rates between 2002 and 2011–2013 was driven primarily by reductions in non-contraception, rather than by reductions in the use of less effective methods.
3. Discussion
There have been dramatic declines in teen pregnancy rates in the past decade, and previous research suggests that improvements in teen contraceptive use have played a major role in these declines [
3,
4,
5,
6]. A better understanding of the implications of changes in contraceptive behavior for historical declines can inform policymakers and practitioners as to the most effective strategies for sustaining the reduction in the rate of teen pregnancy, which remains high compared to other industrialized countries [
16]. Our analyses indicate that approximately half of the decline in teen pregnancies since 2002 was due to changes in contraceptive method use
12. This estimate fits within the range of other studies, which found that changes in contraceptive use accounted for between 47% and 86% of declines in teen pregnancy and childbearing [
4,
5]. Differences between our findings and those of other studies may be due, in part, to the more recent time period of our study (previous work highlighted trends in sexual activity and contraceptive use since the early 1990s and did not extend past the early 2000s). Our estimate of the contraceptive effect may, in fact, be a lower bound because we focus only on the effect of changes in methods used at a typical act of intercourse and do not model changes in other dimensions of contraceptive behavior. If changes in the mix of contraceptive methods were accompanied by, for instance, reductions in discontinuation rates, improvements in the consistency or correctness of use, or changes in dual method use
13, we might have found that changes in contraceptive behavior had an even more substantial impact on trends in teen pregnancy. For instance, Santelli
et al. 2007 modeled a reduction in nonuse as well as increased use of more effective methods and of multiple methods simultaneously and found a larger contraceptive effect. Moreover, recent research has documented an increase in dual method use among teens in recent years [
6].
Our work extends previous research by examining how changes in the mix of contraceptive methods are linked to declines in teen pregnancy. Previous research has found that the percentage of sexually active teens not using contraception declined from 1998 to 2006–2010 [
17], and we found that these declines have continued into 2011–2013. Declines in nonuse have been accompanied by increases in condom use and pill, patch or ring (PPR) use, and slight increases in LARC/injectable methods—all of which contributed to declines in teen pregnancy rates in the past decade.
Condoms were the most frequently used contraceptive method among sexually active teens, with more than 40% reporting condoms as their most effective method in 2011–2013. The increase in condom use since 2002 accounts for more than half of the contraceptive effect on declines in teen pregnancy rates in our models. Increases in the use of PPR methods and LARC/injectable methods account for the remaining contraceptive effect in equal measure. Our analyses highlight slight increases in teen use of PPR contraceptive methods during the time period of study, with 37% of teen women relying on these methods in 2011–2013. Our analyses also indicate an overall slight increase in the LARC/injectable methods (injectables, IUDs and implants). However, this overall slight increase in the combination of injectables and LARCs masks a decline in the use of injectable methods that was accompanied by a larger increase in LARCs (IUDs and implants). In fact, while LARC use is still very low among teens (about 3% used an IUD or implant in 2011–2013), it has increased by a factor of more than five since 2002 (see
Table 2).
Additional simulation analyses highlighted that the contraceptive effect was driven primarily by the drop in the percentage of teens using no method, rather than by the increase in the use of more effective methods. When we modeled only changes in the method mix among contraceptors, leaving the percentage of teens using no method at 2002 levels, we found that the magnitude of the contraceptive effect dropped by two-thirds from a decline of 8.1 pregnancies per 1000 teen women to a decline of three pregnancies per 1000 teen women. Women who do not use contraception have a very high rate of pregnancy: an average of 85% of sexually active women experience pregnancy over the course of a year. Thus, we find that take-up of even less effective methods among teens can result in a dramatic reduction in the teen pregnancy rate [
7].
Our findings suggest the need for a two-pronged approach to continue declines in teen pregnancy among sexually active teens into the future. First, policies and programs should continue to target sexually active youth who do not use contraception. Second, teen pregnancy rates could decline further if policymakers can increase the effectiveness of method use among existing contraceptors—for example, by providing evidence-based contraceptive counseling, affordable services and same-day prescriptions/insertions [
18,
19,
20].
Despite recent declines, more than one in ten sexually active teens in 2011–2013 (12%) did not use any method of contraception at last sex, highlighting the need for targeted efforts to improve contraceptive use among this population. Reasons for non-use among teens include concern about side effects (for hormonal and LARC methods), misunderstanding of the risk of pregnancy associated with unprotected intercourse, being “in the moment” and not wanting to break the mood, and partner resistance to the use of contraception [
21,
22,
23]. Many currently non-contracepting teens have used contraceptive methods in the past, as is evidenced by the high rates of sexually active teens who have ever used condoms (97%) and the pill (54%) [
24]. While method switching can lead to gaps in contraceptive coverage and increase the risk of unplanned pregnancy [
25], research suggests that providers can help to prevent gaps in contraceptive coverage by providing teens with multiple contraceptive options and helping them switch to another effective method if they are unhappy with their current method [
25]. Additionally, teens who do not use contraception often engage in other risky behaviors such as alcohol and drug use and are more likely to disconnected from school and family, highlighting the need for multiple and combined intervention efforts [
26].
A review of effective teen pregnancy prevention studies has documented several programs that have increased condom use among teens who were not using contraception, including very short STD prevention programs and longer, more intensive youth development programs [
27]. However, typical use failure rates for condoms are relatively high (at 18%), and may be even higher for teens [
28,
29], and many researchers have found that condom use declines as relationships become longer or more serious [
30,
31], suggesting that transitioning teens to more effective hormonal or long acting-methods of contraception can help teens avoid pregnancy.
Among more effective contraceptive methods, PPR methods remain popular among teens. These methods provide high levels of protection when used perfectly (0.3% failure rate), although typical use pregnancy rates are higher (9%) [
7,
8,
9], and many women ultimately switch off of these methods [
32,
33,
34], highlighting the importance of consistent and sustained method use. In the LARC/injectable method category, our study found a decline in injectable method use since the early 2000s. Qualitative research and interviews with providers indicate that clinics are more likely to prescribe and deliver injectables on-site
versus other longer-acting methods. However, side effects and difficulty with attending regular appointments have led to high discontinuation rates among injectable users [
23]. Although not currently as popular, LARCs (implants and IUDs) are recommended as a first-line method for teens, as they combine effectiveness and consistency and have very low typical use failure rates (less than 1%) [
35]. Additionally, despite higher upfront costs, these methods are cost-effective for women who do not intend to get pregnant for several years as their use does not require regular health care visits or prescription refills [
36]. Evidence suggests that the low level of LARC use in the United States is attributable in part to a lack of information regarding their benefits, misinformation about their likely side effects, and their high upfront costs [
11,
12]. However, evaluations of recent LARC-based interventions have found that young women are more likely to choose LARC methods when they are well-informed as to their benefits and potential side effects, same-day insertions are available, and cost barriers are removed [
19,
20].


