Article

The (In)Significance of Socio-Demographic Factors as Possible Determinants of Vietnamese Social Scientists’ Contribution-Adjusted Productivity: Preliminary Results from 2008–2017 Scopus Data

1
Sciences Po Paris, Campus de Dijon; 21000 Dijon, France
2
Vietnam Panorama Media Monitoring, Hanoi 100803, Vietnam
3
Institute of Philosophy (Vietnam Academy of Social Sciences), and Centre for Interdisciplinary Social Research, Western University Hanoi, Hanoi 100803, Vietnam
4
Centre for Interdisciplinary Social Research, Western University Hanoi, Hanoi 100803, Vietnam
5
Centre Emile Bernheim, Universite Libre de Bruxelles, 1050 Brussels, Belgium
*
Author to whom correspondence should be addressed.
Societies 2018, 8(1), 3; https://doi.org/10.3390/soc8010003
Submission received: 7 November 2017 / Revised: 21 December 2017 / Accepted: 22 December 2017 / Published: 26 December 2017

Abstract

:
As collaboration has become widespread in academia, and the number of authors per article has increased, the publication count is no longer an accurate indicator of scientific output in many cases. To overcome this limitation, this study defined and computed a relative count of publications called ‘CP’ (credit-based contribution points), based on the sequence-determines-credit (SDC) method, which takes into account the level of contribution of each author. Analyses were done on a sample of 410 Vietnamese social scientists whose publications were indexed in the Scopus database during 2008–2017. The results showed that the average CP of Vietnamese researchers in the field of social sciences and humanities is very low: more than 88% of authors have a CP less than five over a span 10 years. Researchers with a higher CP were mostly 40–50 years old; however, even for this sub-group, the mean CP was only 3.07. Multiple attributes of first-authorship—including knowledge, research skills, and critical thinking—could boost the CP by a ratio of 1:1.06. There is no evidence of gender differences in productivity, however, there is a regional difference. These findings offer significant insights into the education system in regard to science and technology, namely policy implications for science funding and management strategies for research funds.

1. Introduction

1.1. Overview

Scientific research is the driving force in the development of a country and the pillar of higher education systems. According to a 2001–2005 study, Vietnam only ranked fourth among 10 ASEAN countries (Association of Southeast Asian Nations) in terms of the number of scientific research articles [1]. Hien also analyzed data from ISI journals (indexed and ranked by the Institute of Scientific Information, now managed by Clarivate Analytics) to conclude that Vietnamese scientific output is low compared to East Asian countries and depends heavily on foreign authors [2], despite the fact that Vietnam was considered to be in a developmentally high-output stage [3,4,5]. Given the scant literature on this topic, especially in the context of Vietnam, a study on the performance of Vietnamese scientists would prove to be useful in assessing the true state of development of Vietnamese academia.

1.2. Literature Review

Countless factors come into play when it comes to determining the sources of influence on productivity, especially in science [5,6].
Age, one such factor, is indeed of great interest in the study of scientific productivity; research conducted on this subject has reached numerous conclusions. Scientific productivity tends to be highest when scientists are in their thirties and forties, then declines as they age further [7,8,9,10]. Explanations for this issue vary from author to author: accumulative advantage theory, benefit maximization theory, and intellectual impairment. As a strategic choice, scientists will reduce research productivity when they perceive a lack of expert recognition from the community [11]. In addition, the theory of maximizing benefits can also explain the decrease in productivity when scientists find that other jobs may be more beneficial for their promotion or income [12]. Lehman meanwhile concluded that the decline in scientific productivity with age may be due to intellectual weakness [7]; in a similar vein, Cooney et al. argued that older scientists become obsolete compared to their younger colleagues [13]. On a different note, a study by Rørstad and Aksnes among nearly 12,400 Norwegian university researchers found that the publication rate increases with time, typically to the age of 40–50 in the fields analyzed. In reference [14], the contradicting results between studies show that the effect of age on scientific productivity is unclear, especially when older authors can play a role in guiding young researchers and can thus contribute without directly writing articles [15].
Geographical factors, in some studies, also made a difference to research output among scientists. Most studies have shown that authors hailing from regions with underdeveloped economic conditions and/or limited communication networks and Internet tend to have a more modest body of published articles [16,17,18]. Prpić also concluded that female scientists are more concentrated in urban than in rural areas, demonstrating that highly productive scientists are often concentrated in economically developed regions [19]. However, the causes and effects of regional factors and their relationship to scientific productivity still receive little attention in the extant literature.
The issue of whether or not gender is a factor affecting scientific productivity is perhaps the most controversial. The majority of previous studies concluded that male researchers are more productive than females [20,21,22]. In the curriculum from primary school to university, key scientists are predominantly males, and only a very small number are women [23]. To explain this difference, many studies have suggested that childbirth and child care are the most important determinants of the productivity of female scientists [12,24,25,26]. A study by Kyvik found that: women with children under 11 years old published 41% fewer articles than men; the gap dropped to 8% with women and men with children over 10 years of age [27]. Women with children under 11 years old work 5.5 h per week less than male counterparts in the same situation, and there is no difference in work hours between men and women with children over 10 years old. However, there are also results that deny the difference in scientific productivity between male and female authors [28,29,30]. Lemoine reported the same number of women as men in national journal publications in Venezuela [31]. In the fields of science, technology or mathematics, men do not surpass women in the quantity and quality of scientific research, although these are not traditionally considered to be areas of expertise for women [32]. In a study by Van Arensbergen et al., it was observed in their samples of scientists that in the previous generation, women accounted for only 22%; today, the figure has increased to 45%. There are also fields more dominated by women than men, such as psycho-social studies [33]. According to a global and cross-disciplinary bibliometric analysis conducted by Larivière, based on an examination of over 5.4 million research papers and review articles with 27.3 million authors, the authors found that men dominate scientific production in nearly every country. Women are also underrepresented in terms of first authorship [34].
This study will provide insights into the effects of gender, age, research time and region on the relative scientific output of Vietnamese authors, continuing the line of recent studies such as [4,35].

2. Materials and Methods

2.1. Research Hypothesis and Analytical Framework

2.1.1. Research Hypothesis

Both nominal and relative productivity can measure the academic contribution of a scientist. Nominal productivity is defined as the number of publications of a scientist, whether written alone or with peers and regardless of position in the author list, if any. Relative productivity (or adjusted productivity) is measured using the placement of a scholar on the authors’ list of an article and suggests an indicator for author productivity based on their role and contribution to their final products.
Our analyses were conducted on the basis that the measure of relative productivity assures fairness among key authors and authors who play a minor role in publications. Moreover, given that Vietnamese scientists have a tendency to co-author, basic descriptive statistics around relative productivity (“cp”) will help provide a more in-depth overview of the current state of scientific contributions in Vietnam.
Thus we aim to assess factors of impact on the relative productivity by testing the following two hypotheses:
Hypothesis 1.
First-authorship in articles is one of the key determinants of the author’s contribution to research output; in addition, scientists of different age groups will have different levels of contribution.
Hypothesis 2.
Gender and regional differences contribute to scientific output as a factor of influence.

2.1.2. Analytical Framework

The dependent variable in this paper is a continuous variable. Therefore, we use the ordinary least squares (OLS) multivariate linear regression model with the general model as follows:
Y = β0 + β1X1 + β2X2 + … + βkXk
The condition is that k independent variables Xi must have the same sample size n as the dependent Y. Y must be numerical, while Xi can be numerical or categorical. Regression results provide the values of βi, which represent the linear impact of Xi on Y. The statistical significance of predictor variables in the model are determined based on the z-value and p-value; with p < 0.05 being the conventional level of statistical significance required for a positive result.
To ensure the validity of the model, the F-test was performed with the hypothesis pair of H0: β1 = β2 = βi = … = 0, and where for H1: at least one coefficient is not zero. The test result would determine the value of F and the coefficient p: in effect, if p < 0.05, hypothesis H0 would be rejected, which would confirm that regression coefficients in the model are not simultaneously null.

2.2. Dataset and Variables

2.2.1. Data

The subjects of this study are Vietnamese scientists who have published in Scopus-indexed scientific journals over the past 10 years, from 2008 to 2017. Through gathering author information from personal and institutional websites, along with databases such as Google Scholar and Scopus, the research team has obtained a dataset of 410 Vietnamese authors. For each scientist, we created a separate profile which includes all relevant factors such as age, sex, region, years of study since master graduation, the number of times as the key author, affiliated units, field of study, academic title of professor, associate professor, and the like.
Data were then entered into a Microsoft Excel spreadsheet, cleaned and saved in .csv form. Data processing and analyses were done in R (3.3.1).

2.2.2. Dependent Variable

This study will focus on the contribution of Vietnamese authors to scientific research in the world and the impact of several objective factors on their productivity. We measure scientific output not by the number of publications, but rather by relative productivity. This indicator can also be called the credit-based contribution point, abbreviated as ‘CP’, and is coded in our dataset as “cp”. CP represents the output of a scholar not only based on the number of papers they authored but also taking into account their contribution to each article they produced.
The relative productivity of an author was calculated by converting the nominal productivity using the method of sequence-determines-credit (SDC) [36]. Accordingly, the first author will be marked off 1/1, i.e., 100%, the second author has the value of ½ (corresponding to 50%), the third author 1/3 (i.e., 33%), the fourth author is ¼ (i.e., 25%), etc. In this manner, the further an author is placed from the first position (implying a more modest contribution compared to the lead author), the smaller the count added to their relative productivity.
Taking into consideration other available methods [36], this study found the SDC method to be the most suitable for the Vietnamese database. Several studies have shown that more than 70% of the publications of Vietnamese scientists involve international partners and there are indications of low contributions from the Vietnamese [37,38]. Thus, from the dataset of this paper, we determined the order of authors in each publication to reflect the level of contribution justly and the SDC method allows us to calculate the credit-based contribution point accordingly.
The relative productivity of the author is then calculated as the sum of all adjusted values from his or her publications.

2.2.3. Other Variables

Factors considered impact on the relative productivity include gender, age and region. They were used as predictor variables in our models, and are coded in our dataset as follows:
  • sex”, a categorical variable representing author gender, with two categories: “male” and “female”;
  • age”, a numerical variable recording author age. It was not directly employed in our models, but was used to calculate the next variable, which would, in turn, be used in our regressions;
  • age_gr”, a categorical variable representing age groups, calculated using “age”, with four categories: “less30” (30 years old or under), “b3040” (between 30 to 40), “b4050” (between 40 to 50), “g50” (over 50 years old);
  • region”, a categorical variable with four options: “north”, “center”, “south” and “overseas”. Vietnam’s inland stretches 1650 km from the north to the south, creating geopolitical, cultural and economic differences among its regions. The categorization is useful when looking at research networks created among the 410 social scientists, and in turn, their research output. The “overseas” factor denotes scientists who are working abroad.
  • In our analysis, we also drew parallels between relative productivity (“cp”) on one hand, and a total number of publications (nominal productivity) in relation to first authorship on the other. The two latter factors would be examined as the following variables:
  • ttlitems”, indicating the number of articles that an author has published;
  • au.key”, recorded as the number of articles in which an author held the first position.

3. Results

3.1. Descriptive Statistics

The majority (238 out of 410 scientists) came from northern Vietnam, accounting for more than 58%. The remainder came from the southern and central regions, and about 17% of the sample were Vietnamese scientists living abroad.
The number of male authors was higher, whether in general or by region (Figure 1). In general, the number of male scientists accounted for 62.2%, corresponding to 255/410 people. Whether or not this translated to a male dominance in the Vietnamese scientific community would be concluded after the analyses.
Author contribution could be expressed in nominal and relative productivity. In numerical values, the highest publication count was 63 articles, in stark contrast to the modest average of only 3.6 articles (Table 1). To add to this, over 300 authors were below average in terms of productivity. Meanwhile, in relative values, average productivity was 2.405, maximum 61.16 points.
Figure 1 shows the relationship between relative and nominal productivity by gender. It can be observed that most authors with a high number of published articles also had a high relative productivity, which led to the belief that there existed a positive relationship between the number of publications and author contribution in the publications. In fact, the correlation coefficient between the two factors was 0.926. However, given that each value represented a different aspect of author productivity, their relationship should be examined with care.
Figure 2 also showed that the two outlying data points had a much higher nominal productivity (“ttlitems”) value (≥50) than the rest (<30). Furthermore, both points turned out to be male scientists, thus creating a strong dispersion of nominal and relative productivity in terms of gender in this field. Concretely, the men’s average CP was 2.37 (p = 6.39 × 10⁻¹¹), significantly higher than that of women, 1.79 (p = 11 × 10−15).
We then removed the aforementioned outlying data points from the dataset and obtained new means, reported in Table 2 below:
Comparing the values in Table 1 and Table 2, it can be seen that the means and standard deviations decreased after the removal of extreme outliers. Nominal productivity (“ttlitems”) had the most significant drop, followed by relative productivity (“cp”): their respective means decreased by 0.374 and 0.286, and their respective standard deviations decreased by 1.953 and 1.752. This suggested that the extreme values might alter the general character of the dataset.
On the other hand, details on the contributions of scientists in publications based on age groups were reported in Table 3.
Table 3 showed the quantities of authors by age group and relative productivity. The majority of authors (36.59%) scored less than one in relative productivity. Within this majority, no author had published more than five articles.
In all age groups, the proportion of scientists with a relative productivity under one was the largest. Furthermore, as relative scientific output (“cp”) gradually increased from 1–2 points to 5–6 points, the number of authors decreased. It is worth noting that, from seven points of relative productivity and higher, the 40-to-50 age group was the largest (21 authors).
Figure 3 depicted relative productivity by region, which indicated the dispersion of “cp” values in different categories of “region”. Overseas authors had the highest relative productivity—3.58 points, which is above average—and are also the most dispersed in terms of relative productivity.
These basic descriptive statistics provided background evaluations regarding relative productivity and influential factors. Regression models shall help bring about more specific assessments.

3.2. Estimation Results

3.2.1. The Influence of Age and First Authorship on Relative Scientific Productivity

To test the first hypothesis, relative scientific productivity (“cp”) was examined against age groups (“age_gr”) and first authorship (“au.key”). While “au.key” was a continuous variable, “age_gr” was a categorical variable and was divided into four groups: 30 years and under (“less30”), from 30 to less than 40 years old (“b3040”), from 40 to less than 50 years old (“b4050”), and 50 years old and above (“g50”).
After the data were processed in R, the following results were obtained:
Table 4 showed that first authorship (“au.key”) had a statistically significant coefficient. For the age variable (“age_gr”), only the 40-to-50 age group had a statistically significant coefficient. Since all independent variables had at least one significant coefficient, the regression model could be accepted. The first hypothesis, maintaining that first authorship and age had an impact on relative productivity was thus confirmed.
Using the regression results, in which “au.key” is a continuous variable and “b4050” is a categorical variable, we constructed an equation expressing the relationship between variables as follows:
Y = β0 + β1X1 + β2X2 + … + βkXk
↔ cp = 0.403 + 1.060 × au.key + 0.243 × b4050
Note that only the 40-to-50 age group could be included in the equation, with the other two admitting statistically insignificant coefficients. The coefficient of greatest significance (β1) was that of the variable “au.key” and was positive, indicating that one additional publication in which the scholar was the lead author would increase relative productivity by 1060 points (other factors being kept constant). Using this equation, if a 45-year-old author played the leading role in two articles, the estimated relative productivity could be calculated as follows:
0.403 + 1.060 × 2 + 0.243 × 1 = 2.766
On another note, the insignificance of the other two age groups in the regression model, “less30” and “g50”, was telling in itself, and shall be discussed towards the end of the article.

3.2.2. The Influence of Gender and Region on Relative Scientific Productivity

In this model, factors considered to have an impact on relative productivity included region (“region”) and gender (“sex”). Regression models similar to above were used, yielding the following estimation results:
The results from Table 5 showed that no regression coefficients were statistically significant (in all cases). On the other hand, the F-test performed on the null hypothesis H0 (coefficients not simultaneously equal to zero) suggests that the null hypothesis could not be rejected decisively at the 10% conventional level. In other words, it was impossible to verify that the coefficients of “Sex” and “Region” were not simultaneously equal to zero. Hypothesis 2 was thus rejected: the gender of the scholar and the geographic region where the scholar was based had no empirically verifiable effect on their scientific output in terms of relative productivity.

3.2.3. Verifying the Impact of Extreme Outliers on the Overall Character

The results from the two above models show that only first-authorship had a general impact on productivity, while age only affected scientific contribution for one single age group, and gender and region did not influence author output, in terms of relative productivity. However, could these results be due to the extreme data points? To answer this question, we eliminated outliers (three observations with a nominal productivity of ≥50 works) and reran the models (Appendix A) on the modified dataset. The results were then compared with those of the two original models.
It was remarked that the number of significant variables obtained in the new regression models was the same. More specifically, in the model without outliers, the results also showed that the effect of first authorship (“au.key”) and age (“age_gr”) among the 40-to-50-year-old age group (at “b4050”) on relative productivity (“cp”) were statistically significant. The magnitude of the coefficients corresponding to these two variables, “au.key” and “age_gr” were also not significantly different from that of the original models. It could be affirmed that the outlying observations did not affect the general characteristics of the dataset. Therefore, the above results were reliable.
In addition, it could be seen that the values of R2 and adjusted R2 in the original regression models were higher than those of the new models (i.e., outliers removed). This showed that the outlying values contributed significantly to the increased meaningful interpretation of the model.
Further statistical tables and visualization of the data are provided in Appendix B and Appendix C.

4. Discussion

4.1. Limitation

Although several insights could be gleaned from analyzing this dataset, the study is not without limitations. Specifically, the dependent variable in this study is open to redefinition. Here, the SDC method is applied to measure the scientific productivity of Vietnamese social science researchers and this relative productivity is the dependent variable. However, SDC is not the only method available. There are different ways to calculate the relative contribution of authors to a research paper, such as the traditional method, the “equal contribution” norm, the “first-last-author-emphasis” norm, or the “percent-contribution-indicated” approach [36]. Hence, the results obtained in this study are not conclusive. As measuring research productivity is crucial for academic promotions, granting, and award decisions, the results should not yet be used as the basis for making policies in this area. Therefore, the results may be sensitive to the weights assigned to the author sequences, and should only be considered “preliminary”.
These preliminary results, however, do hint at several directions for future research. First, one could test these results by using alternative methods for assigning credit points to authors in a research paper. Given that first author and solo author get equal points in this study, one could reasonably assume the solo author should be awarded more points than the first author of a co-authored paper. Using alternative methods could test the robustness of the dependent variable. Second, one could also take into account the association between foreign co-authorship and the research productivity of Vietnamese scientists. Analyzing how this factor is associated with relative contribution could yield a more multifaceted picture of academic output in Vietnam’s social science disciplines.

4.2. Implications

By analyzing images and statistics, we hoped this article would reach valuable conclusions on the factors affecting scientific output in terms of the relative productivity of Vietnamese authors and the current status of academia in Vietnam.
First, the results obtained from the first regression model indicated that age only had an effect on relative productivity for scientists from 40 to fewer than 50 years old. This was also the largest category, grouping 165 out of 410 scholars (over 40%). Furthermore, the results also showed that authors aged between 40 and 50 had a higher mean relative productivity (3.07, with p = 1.96 × 10⁻¹⁴), the largest average nominal productivity (4.41 articles) and the largest average number of articles with first authorship (2.29 articles). Meanwhile, all other age groups admitted insignificant coefficients, suggesting that first authorship and age had no effect on scientists outside of the 40 to 50 age range. This curious occurrence could be explained by various reasons. It should first be remarked that, as said above, the majority of authors in our sample belonged to this age category; thus, it is possible that the other groups were not large enough to show the impact of these factors. Technical aspects aside, authors in the 40–50 age range were also the most productive, which contrasted with the general inactivity of authors in other age categories. Perhaps the period between 40 and 50 years of age was a sort of “critical period” in the career of a scholar, and it was consequently the only age range in which author productivity could be defined with its base characteristics, including the impact of older age and first authorship.
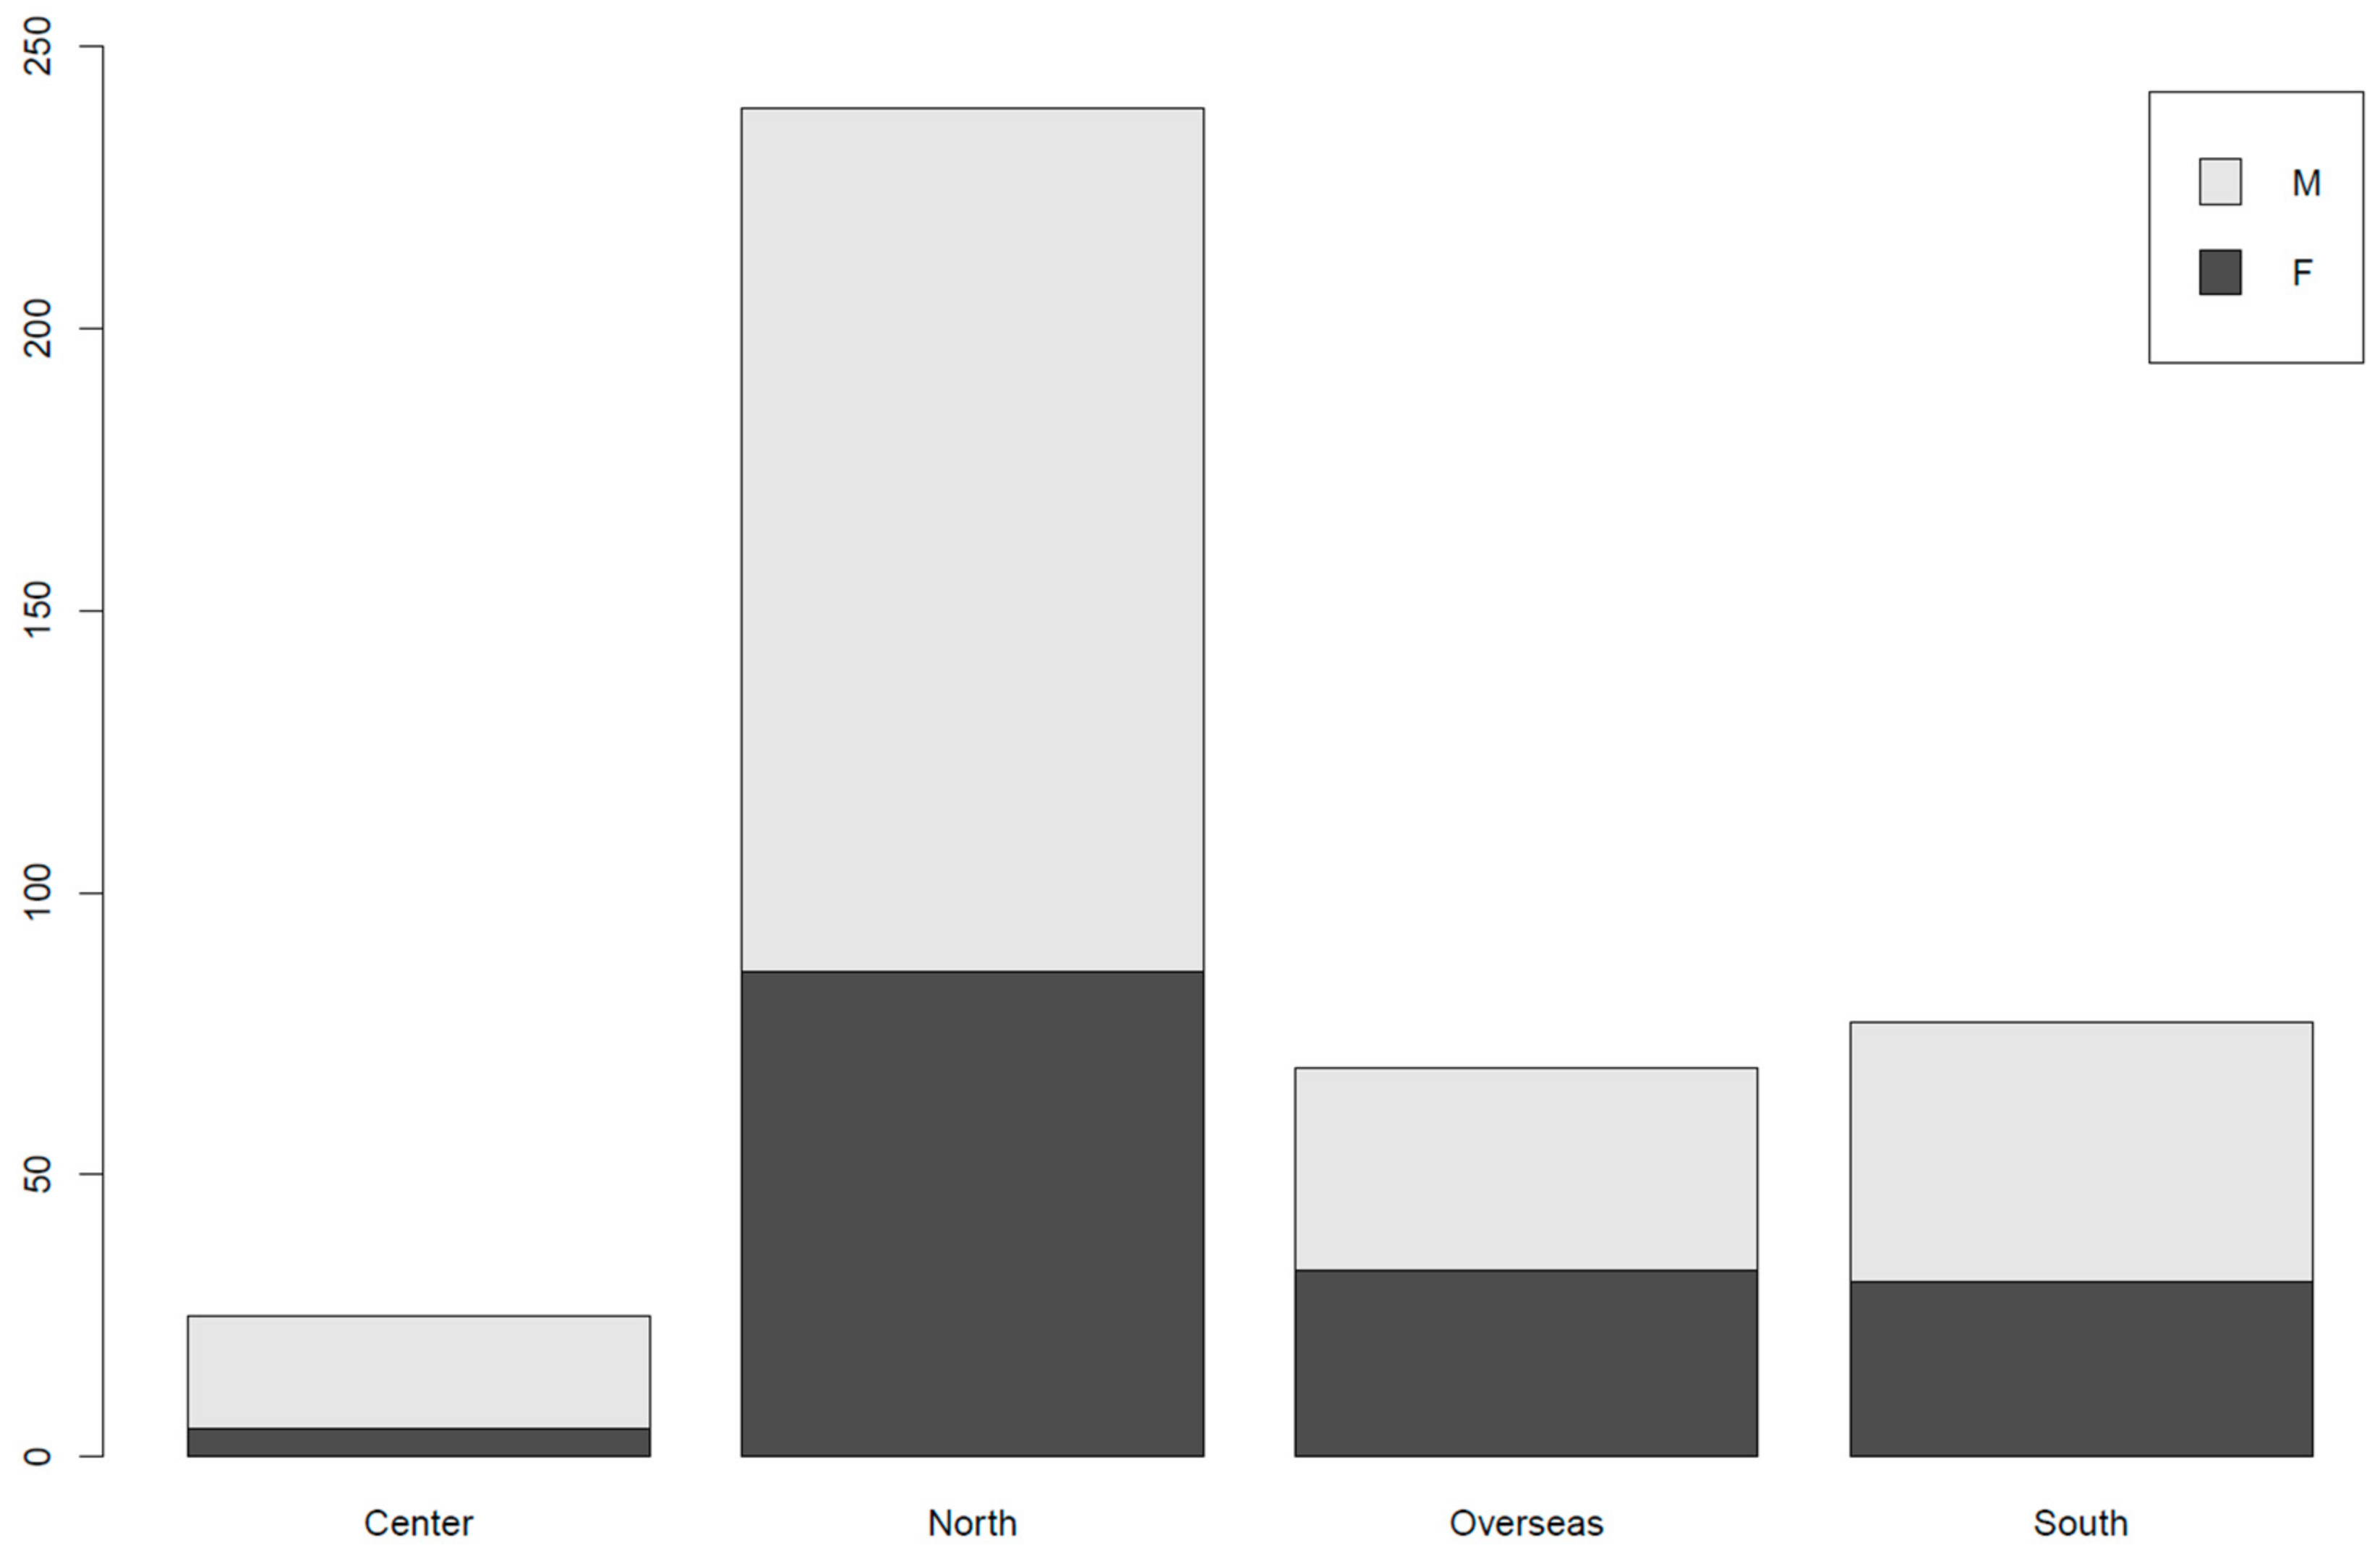
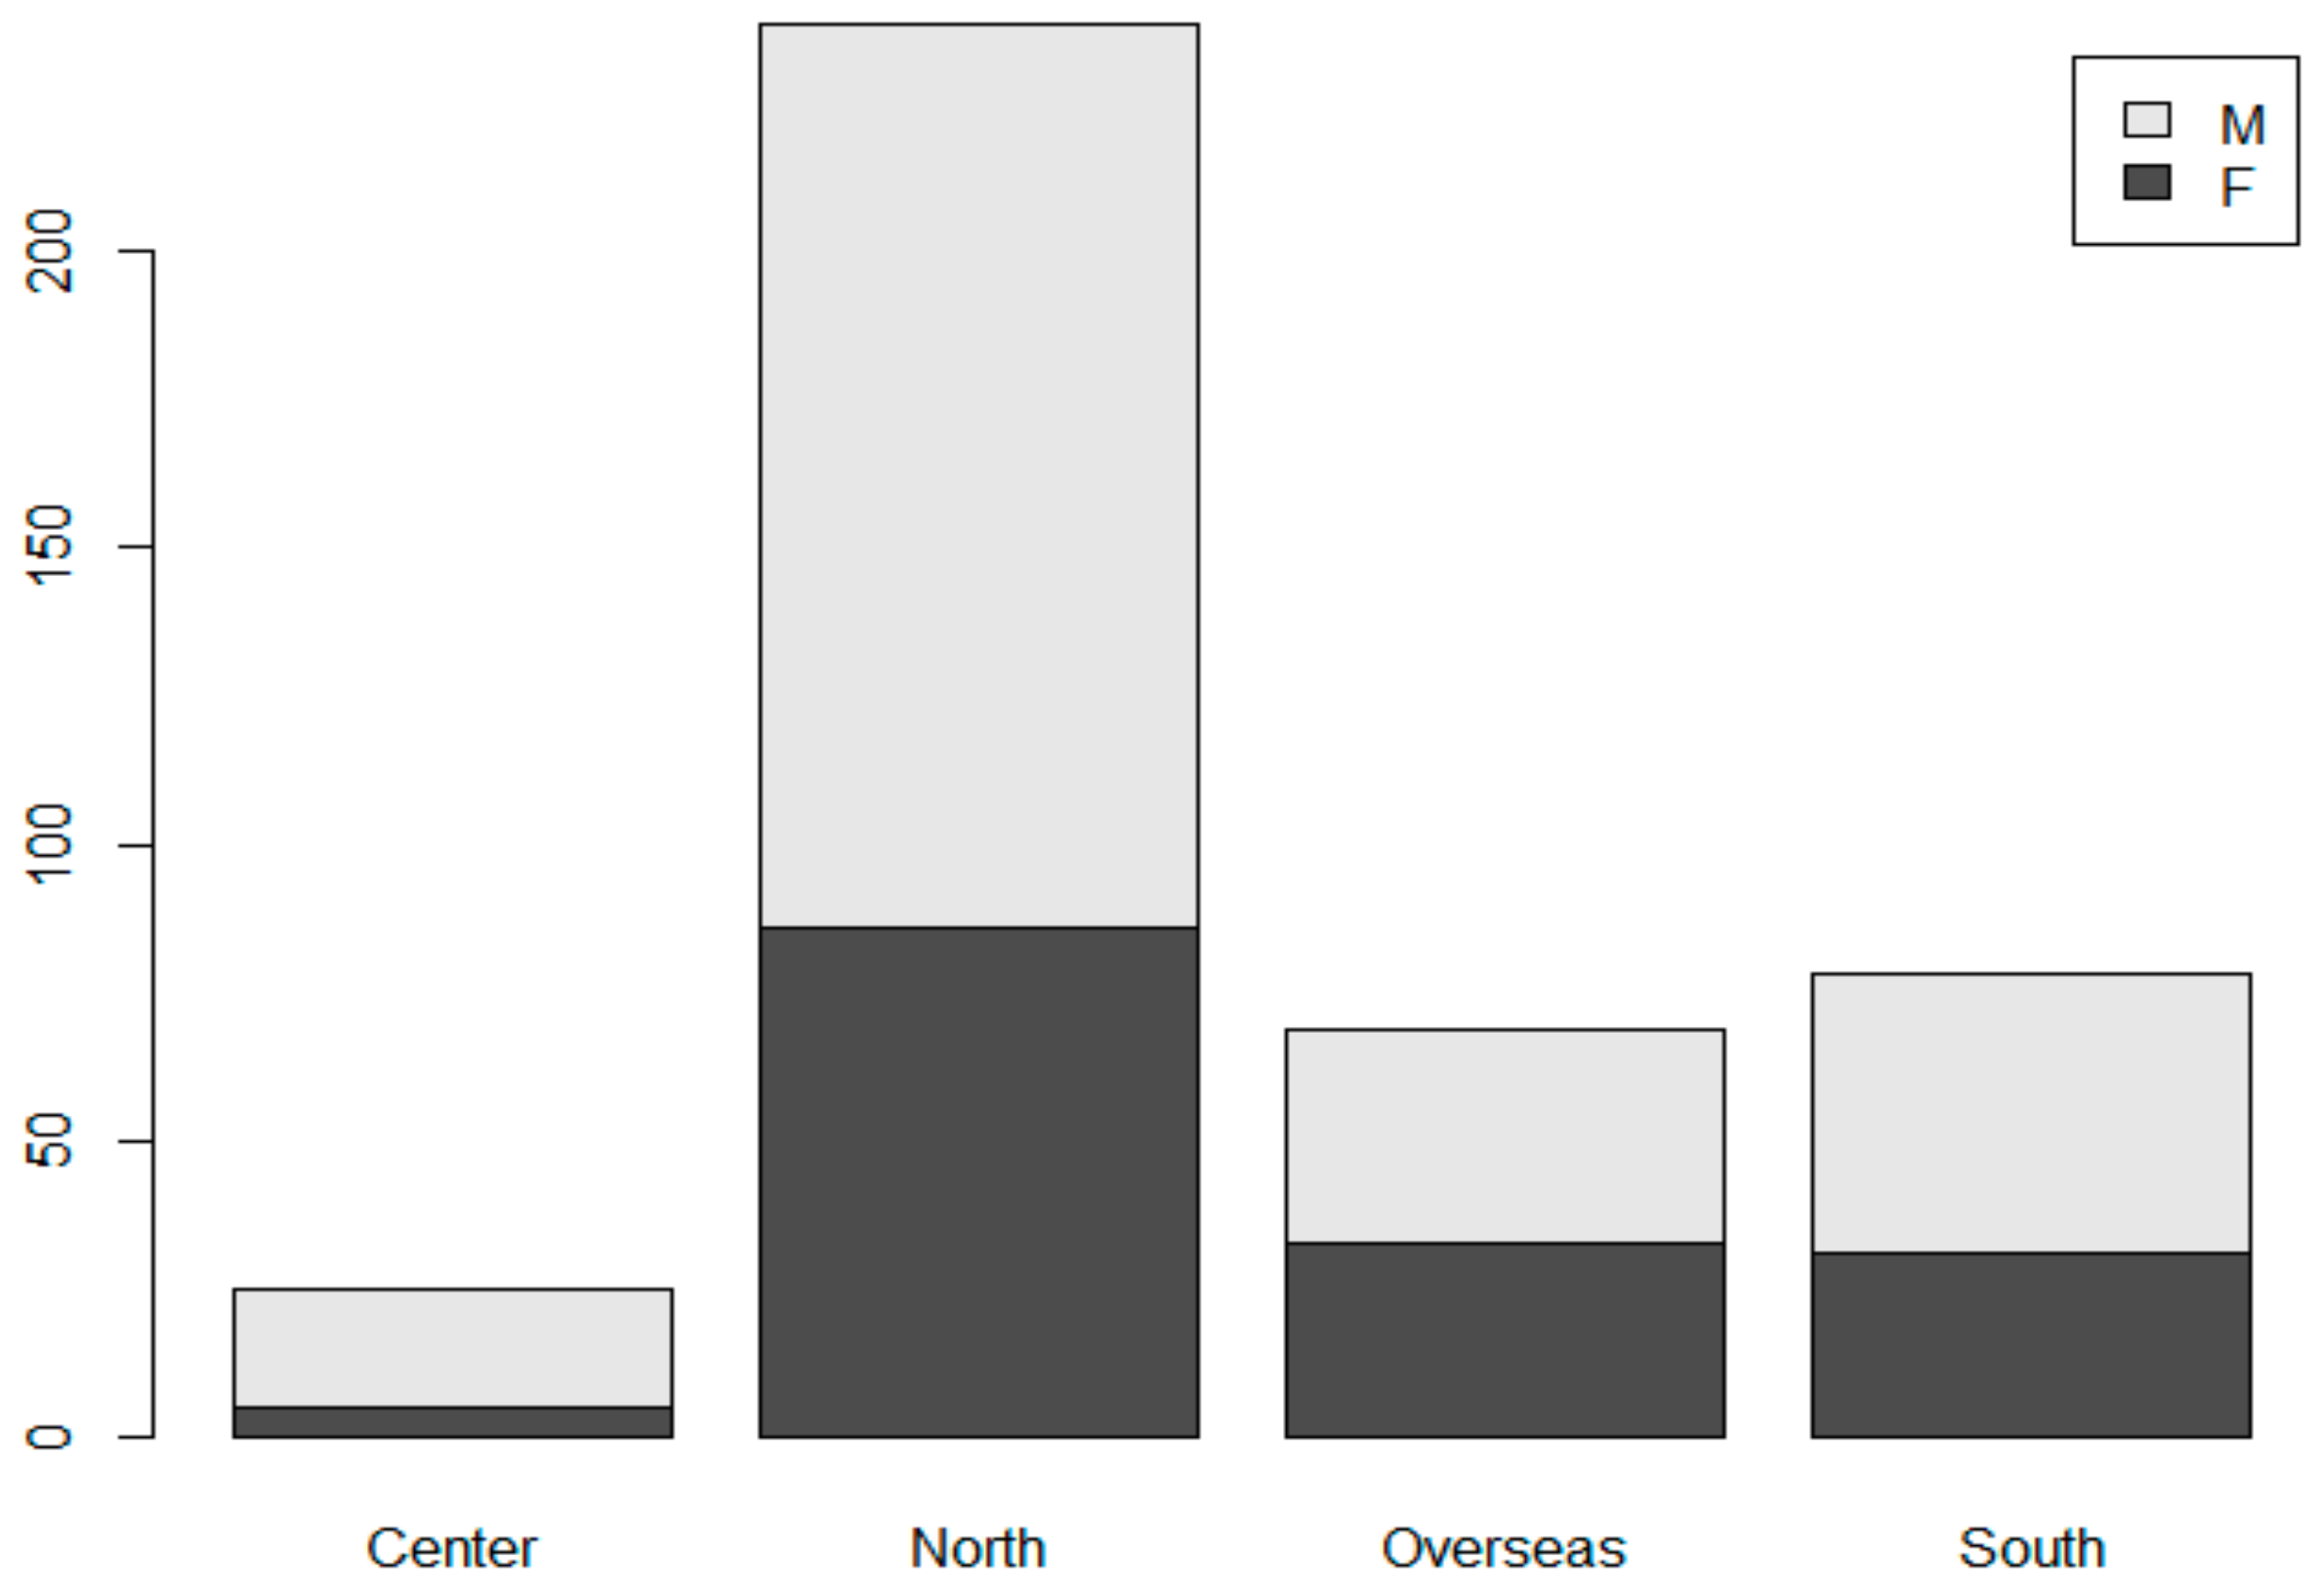
Secondly, gender and region did not affect scientific output in terms of relative productivity. While the results of previous studies suggested that men were more productive than women in research [20,21,
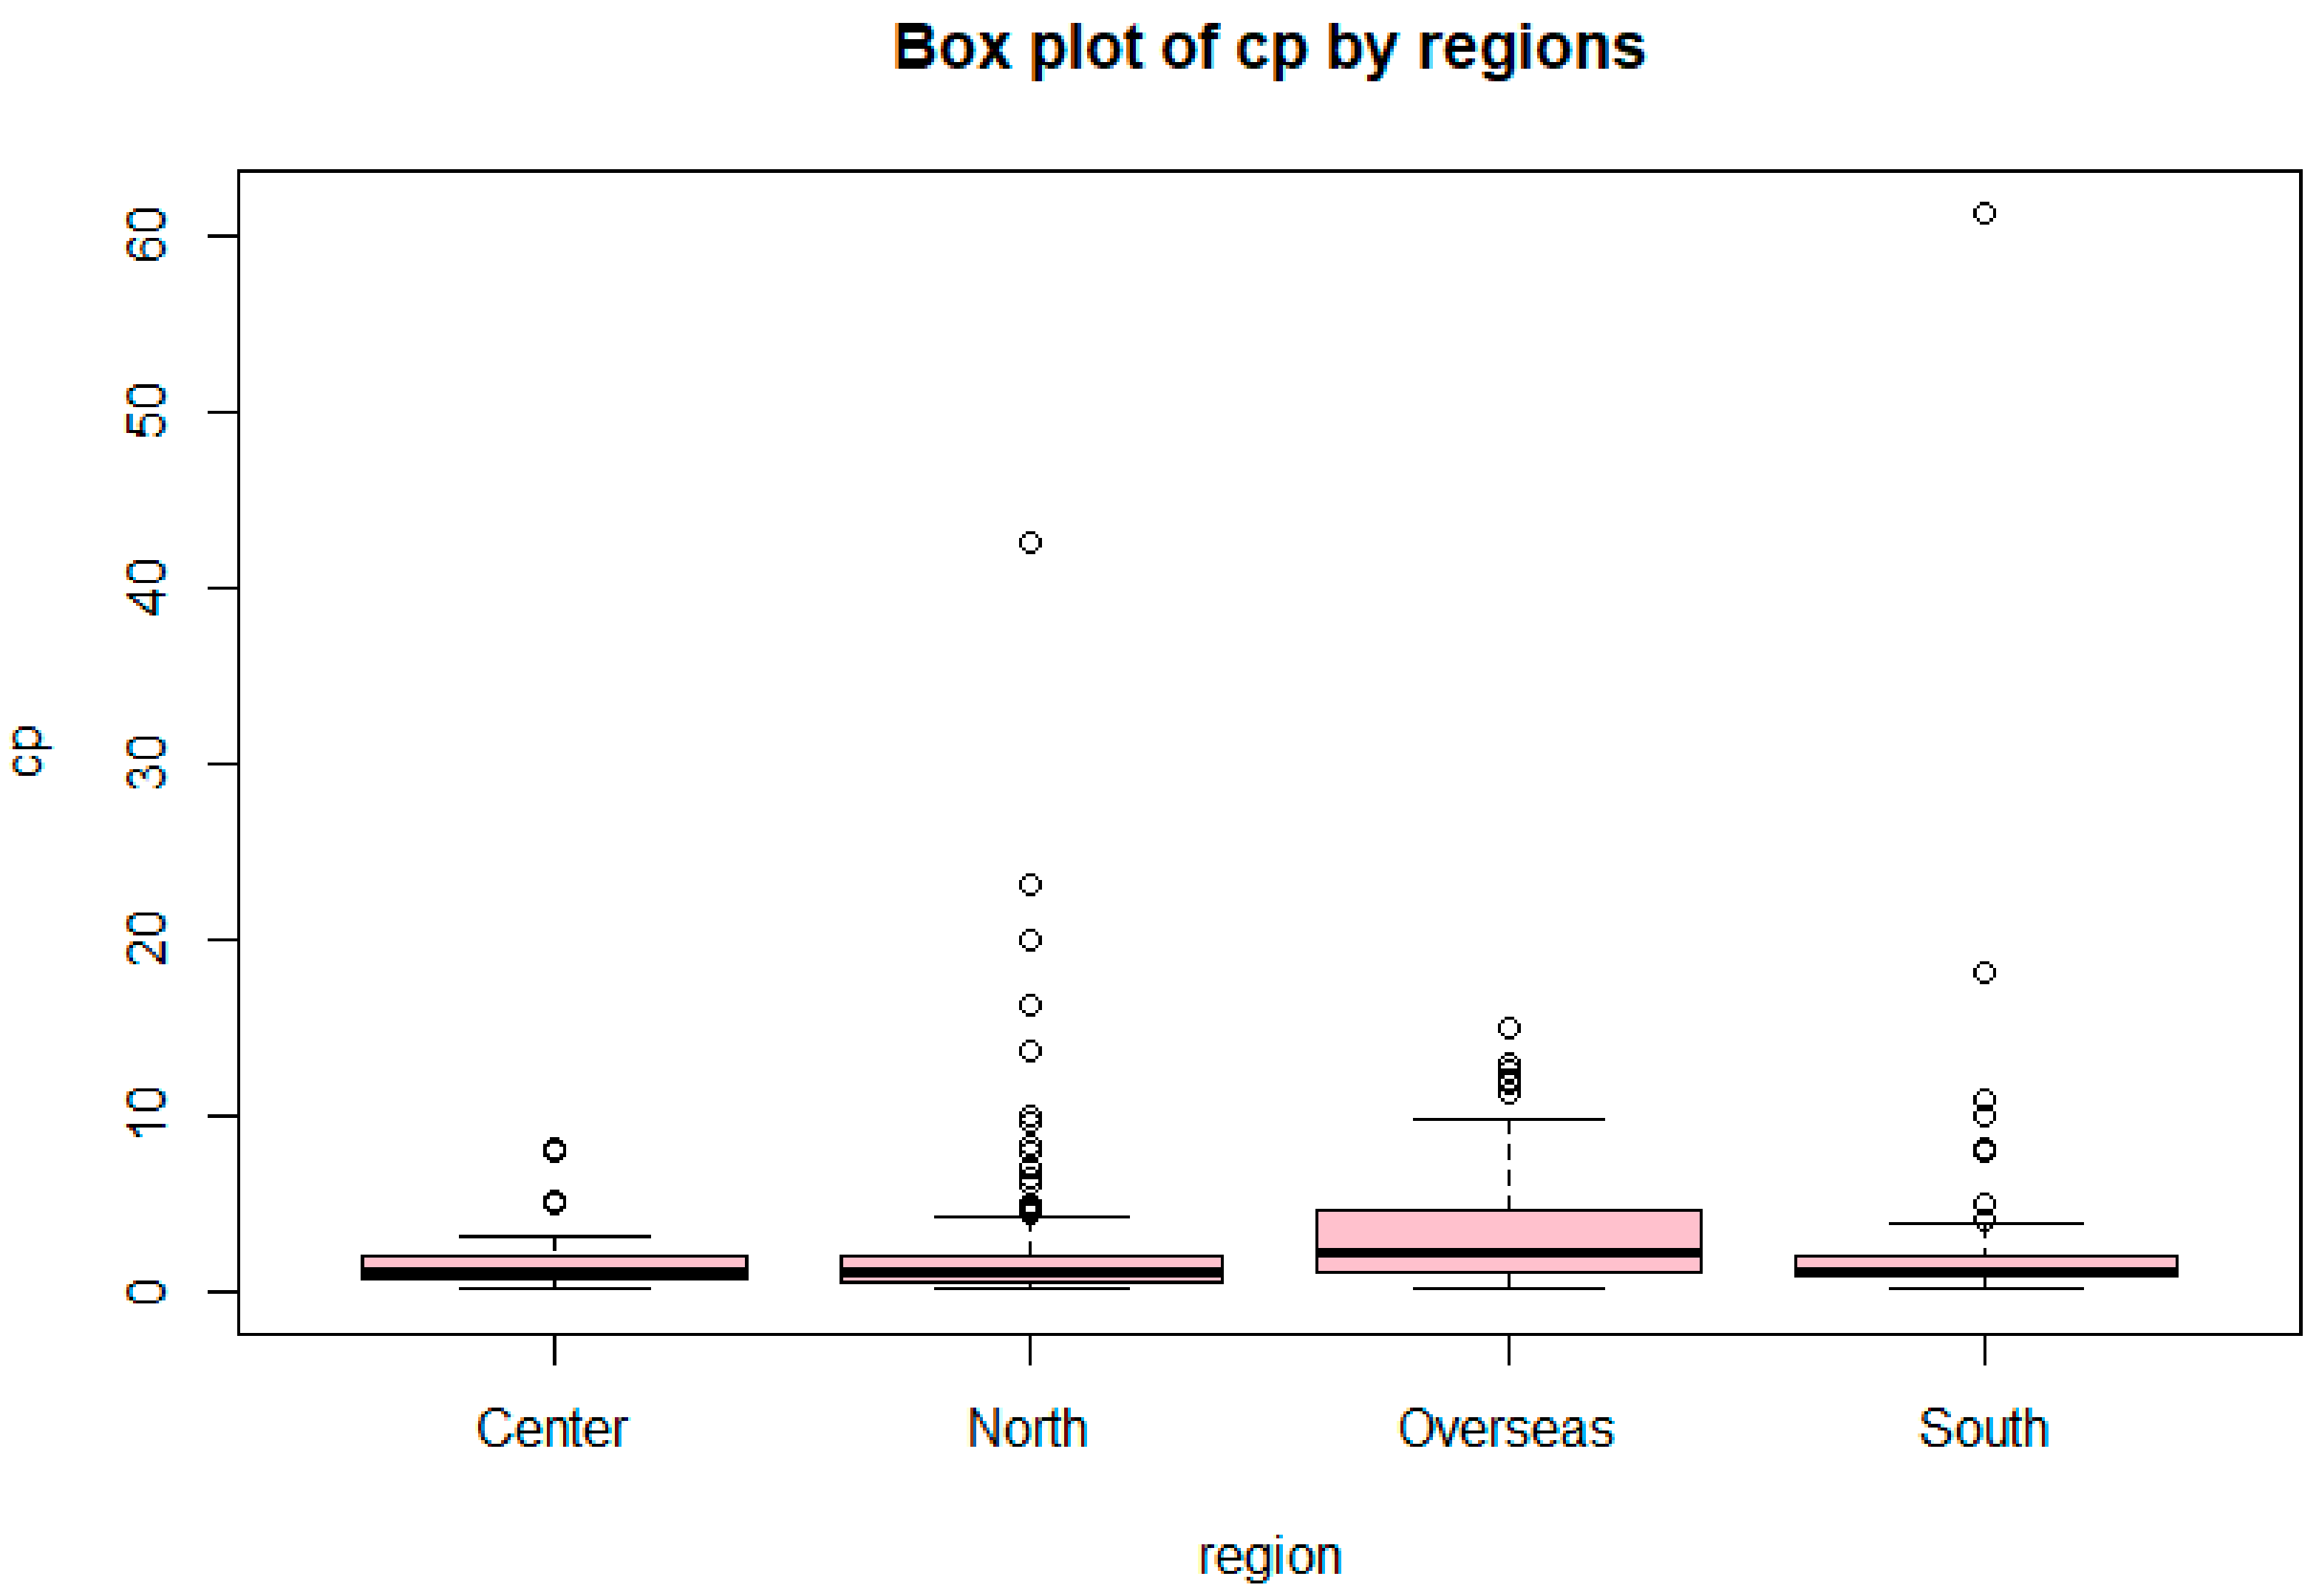
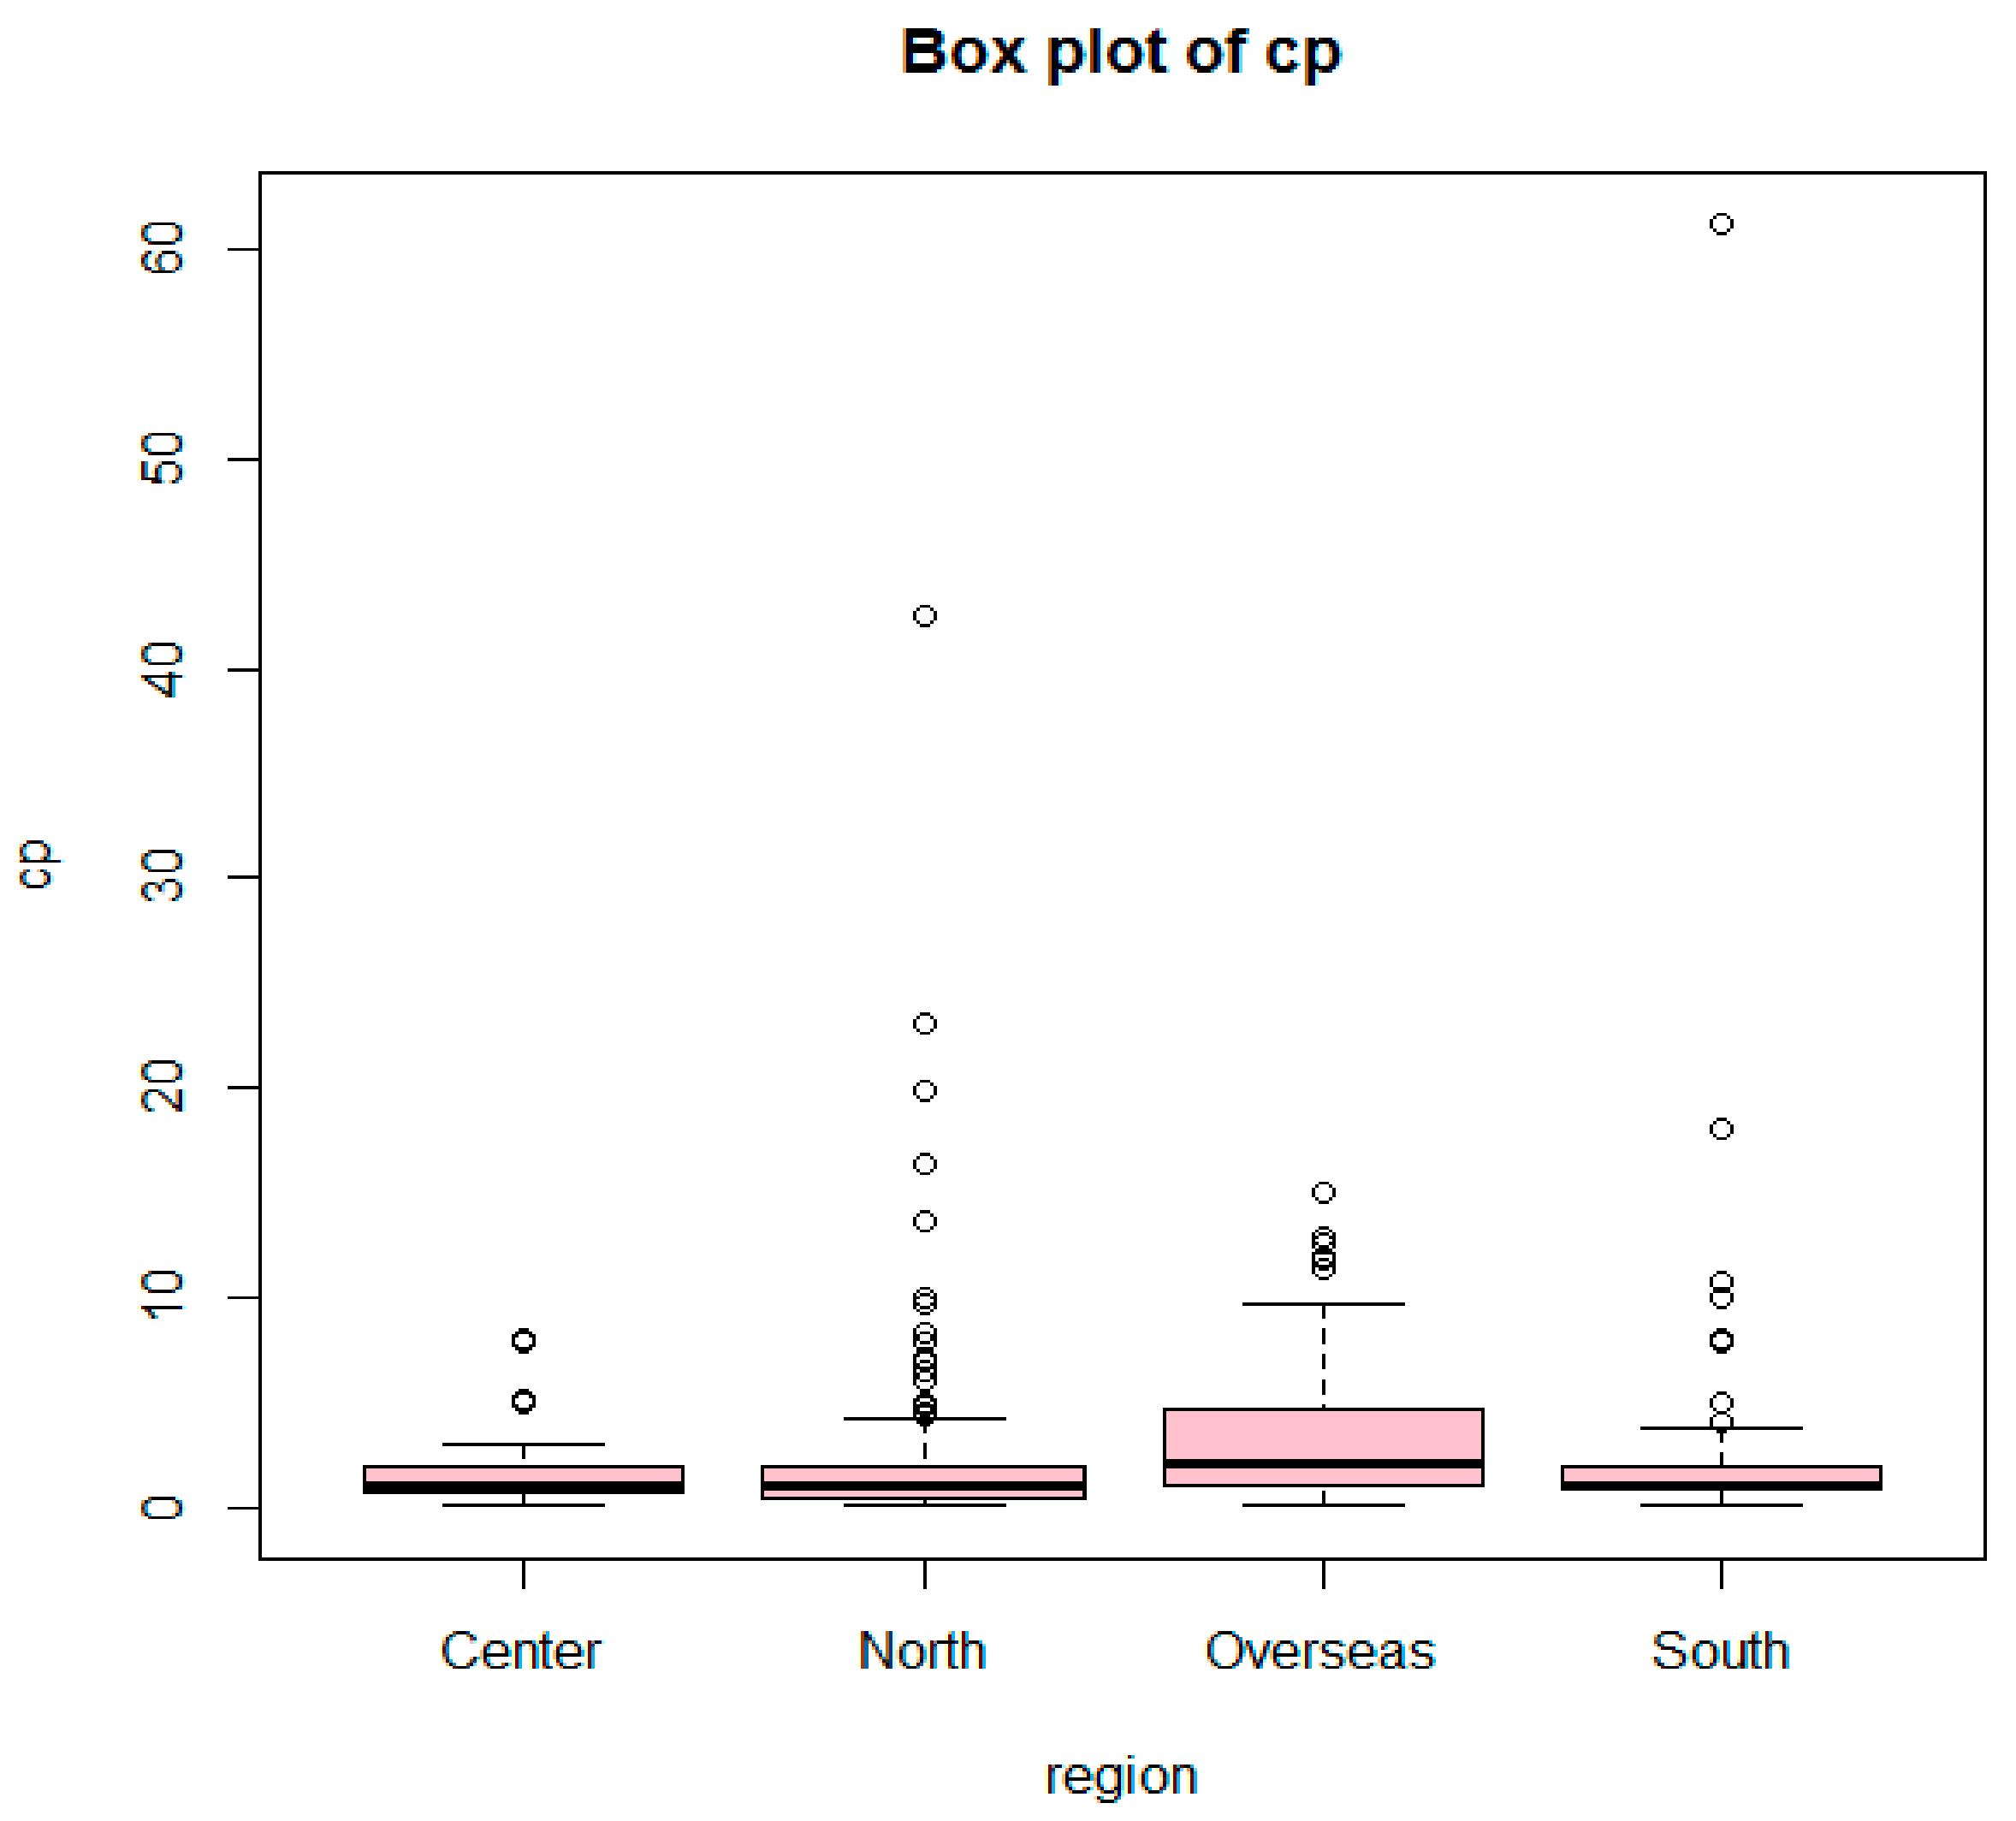
22], our finding showed no difference in CP-based productivity between males and females. As for regions, it seemed that scientists were not affected by differences in culture, infrastructure, and policy that are specific to each region of Vietnam. This could be explained by the fact that scientists today have more access to academic resources which have become more and more readily available on the Internet. The task of researching and reviewing literature has thus become much less demanding. With these results, it could be said that when the contribution to each publication was taken into account, and not merely the count of articles, the scientific output of authors in the social sciences in Vietnam did not depend on objective factors such as gender and geographical affiliation [39]. The main determinant of scientific output was thus the aptitude of the researcher, but also the motivation to do scientific research, especially in the case of the social sciences, which were still more or less underappreciated in Vietnam. In this respect, university administrations could play a role in supporting Vietnamese social scientists, for example by simplifying procedures of updating scientist curriculum vitae in official records or applications for project funding.
Finally, the relative productivity turned out low for most Vietnamese authors—in other words, the level of contribution to their published works was not high. Although the maximum relative productivity has reached 61.16 points, more than 88% of the authors scored under five points of relative productivity. A direct explanation for this phenomenon was that their nominal productivity—which was the total number of publications—was also low: about 79% of scientists published less than five articles in the span of 10 years of research. This indicates not only the nascent state of Vietnamese social sciences but perhaps also limitations in current science and technology funding policies and management strategies of scientific research funds in Vietnam. In fact, there exist few funding sources for science and technology in Vietnam, and even fewer for the social sciences specifically. They are mostly public and inefficiently managed, with inadequate coverage in terms of researchers taken into consideration. A suggested solution would be for these funds to take a concrete direction by putting the focus on one or a few particular disciplines in order to devise specific funding policies.
Another factor directly linked to the low relative productivity was first authorship. The average Vietnamese social scientist rarely assumed the role of lead author, while first authorship was found to be an excellent way to boost productivity, with its coefficient being βau.key = 1.060 (p = 2 × 10⁻¹⁶). The experience of being a lead author could enrich a scientist in terms of knowledge, insights and research skills—all of which are critical qualities that would boost productivity. A lack or scarcity of this experience, as part of productivity cultures in the academia [40], would set authors back in terms of this productivity boost, which would explain the lower relative output.
The international trend of collaboration in scientific research also came into play. Nowadays, the number of authors participating in the same project is increasing more and more. It could be observed in our dataset that Vietnamese social scientists were not exempt from this tendency. In this context, the contribution of the author to their scientific projects becomes even more important, and the highest level of contribution per article would be achieved by being either the solo or lead author. Yet about 60% of the authors in our sample did not play a leading role in more than half of their articles. The average ratio of solo publications to nominal productivity was only 0.16. Put into perspective with the fact that relative productivity, which represents not only the quantity of works, but also the general contribution of the author to their published articles, was low in our sample, this raised a number of questions: What is the value of collaboration in scientific research for authors? Does the experience of collaborating truly boost the scientists’ research productivity, as was the conclusions of previous studies [41,42,43]? Or do they only boost the absolute number of articles they have worked on, but not the amount of contribution they bring to academia, or the significance of their role in a project? And ultimately, does working in collaboration hone the research skills of co-authors as scientists as much as the experience of single authoring would do? These questions give rise to the need for understanding the upcoming acculturation process both within academia and beyond [39,40]. In the Vietnamese context alone, Ho et al. found the possibility of a research network to be socially unsustainable due to the big gap between the most productive researcher and the remaining members of his or her network [44]. This kind of study allows local researchers to grasp their own academic landscape, thereby improving their collaboration, as well as helping to inform policy-makers.

5. Conclusions

To put it briefly, in the discipline of social science in Vietnam, the majority of authors belonged to the 40-to-50 age range; this age category displayed basic characteristics of their academic career, which included the impact of first authorship and age on their relative productivity (measured as CP using the SDC method) and which did not manifest in other age groups. On the contrary, age and geographical region did not have any impact on scientific output. Attention should be paid to the effect of first authorship and its boost to scientific productivity, particularly in the administration of academic institutions and policy management in science and technology funds. Namely, the simplification of administrative procedures for scientists as well as more efficient financial support for research activities—especially for single authors—could prove to be good incentives for scholars and increase their contribution to the national education system.
The issues that have been discussed will be increasingly important when the consideration of the costs of doing science and the benefits of collaboration [45], including open data and shared resources, become a demand by both funders and the public at large [46,47].

Acknowledgments

We would like to thank Vuong & Associates for their research initiative The Network of Vietnamese Social Scientists (“NVSS”), which enabled the research process and provided the raw data for the study. We particularly thank Dam Thu Ha and Nghiem Phu Kien Cuong for their excellent research assistance. We especially thank Pham Hung Hiep, Nancy K. Napier and Dam Quang Minh for their valuable comments. We are also grateful for useful comments from participants—who came from different academic disciplines—in the seminar “Beauty and the Light of Hope” co-organized by Western University Hanoi and Vuong & Associates in Hanoi, on 3 October 2017, particularly Nguyen Tu Cuong (mathematics), Nguyen Ngoc Chau (biology), Pham Duc Chinh (mechanics), Khuat Thu Hong (sociology), Le Van Canh (linguistics), Nguyen Viet Cuong, Tran Quang Tuyen, Vu Van Huong and Tran Toan Thang (economics), Hoang Anh Tuan Kiet (physics), Tran Kien (law), Bui Quang Khiem (fine arts), Nguyen Pham Muoi (media), Bach Ngoc Chien (governance), to name just a few. We would especially extend our thanks to the reviewers for their great suggestions and constructive criticisms that have enabled us to significantly improve the quality of the manuscript.

Author Contributions

These authors contributed equally to this work. Q.-H.V. conceived and designed the study; all co-authors (T.-T.V., H.K.T.N., T.M.H., T.M.H., Q.-H.V.) contributed equally for the remaining tasks of the research and manuscript preparation, i.e., data set preparation, analysis, interpreting results, and writing and checking the paper.

Conflicts of Interest

The authors declare no conflict of interest.

Appendix A. The Estimation Result of the Influence of the Leading Role, Gender, Age Group, and Region on Adjusted Productivity with Full Data (a), and Data Have Eliminated the Outliers (b).

(N = 410)
Interceptau.keyAge_grSexRegion
“b4050”“g50”“less30”“M”“North”“Overseas”“South”
β0β1β2β3β4β5β6β7β8
cp0.1441.061 ***0.238 *0.142−0.069−0.0070.3180.3170.123
[0.621][85.841][2.009][0.966][−0.218][−0.061][1.415][1.290][0.514]
(0.535)(2 × 10⁻¹⁶)(0.045)(0.335)(0.827)(0.951)(0.148)(0.198)(0.608)
Residual s.e. = 1.038 on 401 df. Multiple R2 = 0.951, Adj. R2 = 0.9496. F-stat = 964.5 on 8 and 401 df, p-value: 2.2 × 10⁻¹⁶
(N = 407)
cp0.1831.061 ***0.226 *0.086−0.096−0.0290.2450.3010.150
[0.877][56.096][2.120][0.653][−0.344][−0.300][1.351][1.372][0.697]
(0.381)(2 × 10⁻¹⁶)(0.035)(0.514)(0.731)(0.764)(0.177)(0.171)(0.486)
Residual s.e. = 0.925 on 398 df. Multiple R2 = 0.898, Adj. R2 = 0.896. F-stat = 439.1 on 8 and 398 df, p-value: 2.2 × 10⁻¹⁶
Notes: Signif. codes: 0 ‘***’ 0.001 ‘**’ 0.01 ‘*’ 0.05 ‘.’ 0.1 ‘.’ 1; z-value in square brackets; p-value in round brackets; baseline category for: “Age_gr” = “b3040”, “Sex” = “F”, “Region” = “Center”.

Appendix B. Tables

Table A1. Some descriptive statistics for the variables used in the article.
VariableMinMeanMaxSD95% CIp-Value
Adjusted productivity (“cp”)0.052.4161.164.621.96–2.852.2 × 10−16
Nominal productivity (“ttlitems”)13.60635.893.03–4.172.2 × 10−16
Number of articles in leading role (“au.key”)01.77604.241.36–2.184.48 × 10−5
Age (“age”)1942.10729.1541.21–42.992.2 × 10−16
Table A2. Descriptive statistics for variables after the removal of the outlying data points.
VariableMinMeanMaxSD95% CIp-Value
Adjusted productivity (“cp”)0.052.12232.871.84–2.402.2 × 10−16
Nominal productivity (“ttlitems”)13.23283.932.84–3.612.2 × 10−16
Number of articles in leading role (“au.key”)01.52222.541.28–1.772.2 × 10−16
Age (“age”)1942.06729.1741.17–42.962.2 × 10−16
Table A3. Distribution of authors by age group and relative productivity (“cp”).
Age GroupAge < 3030 ≤ Age < 4040 ≤ Age < 50≥50SUM
Adj. Prod. (“cp” Point)Freq.Cum.Freq.Cum.Freq.Cum.Freq.Cum.# PeopleProportion
cp < 16661614949343415036.59%
1 ≤ cp < 2410451064392266011828.78%
2 ≤ cp < 3 111191251811012725012.20%
3 ≤ cp < 4 112913414124072245.85%
4 ≤ cp < 5 012614010134375194.63%
5 ≤ cp < 6 01251458142075133.17%
6 ≤ cp < 7 0120145114317620.49%
cp ≥ 7012515522187790348.29%
Table A4. Estimation results of “cp” against “age_gr” and “au.key”.
Interceptau.keyAge_gr
“b4050”“g50”“less30”
β0β1β2β3β4
cp0.403 ***1.060 ***0.243 *0.146−0.136
[4.687][86.876][2.064][1.025][−0.437]
(3.8 × 10⁻⁶)(2 × 10⁻¹⁶)(0.0396)(0.3058)(0.6626)
Signif. codes: ‘***’ 0.001 ‘**’ 0.01 ‘*’ 0.05 ‘.’ 0.1; z-value in square brackets; p-value in round brackets; baseline category for: “Age_gr” = “b3040”. Residual s.e. = 1.038 on 405 df. Multiple R2 = 0.9501, Adj. R2 = 0.9496. F-stat = 1929 on 4 and 405 df, p-value = 2.2 × 10⁻¹⁶.
Table A5. Estimation results of “cp” against “Region” and “Sex”.
InterceptSexRegion
“M”“North”“Overseas”“South”
β0β1β2β3β4
cp1.5500.724−0.0321.6550.764
[1.560][1.534][−0.033][1.532][0.721]
(0.119)(0.126)(0.974)(0.126)(0.471)
Signif. codes: ‘***’ 0.001 ‘**’ 0.01 ‘*’ 0.05 ‘.’ 0.1; z-value in square brackets; p-value in round brackets; baseline category for: “Sex” = “F”, “Region” = “Center”. Residual s.e. = 4.594 on 405 df. Multiple R2 = 0.02281, Adj. R2 = 0.0132. F-stat = 2.363 on 4 and 405 df, p-value = 0.0525.

Appendix C. Figures

Figure A1. Regional and gender distribution of scientists.
Societies 08 00003 g0a1
Figure A2. Relationship between nominal productivity and relative productivity by sex.
Societies 08 00003 g0a2
Figure A3. Relative productivity distribution by region.
Societies 08 00003 g0a3

References

  1. Nguyen, T.V.; Pham, L.T. Scientific output and its relationship to knowledge economy: An analysis of ASEAN countries. Scientometrics 2011, 89, 107–117. [Google Scholar] [CrossRef]
  2. Hien, P.D. A comparative study of research capabilities of East Asian countries and implications for Vietnam. Higher Educ. 2010, 60, 615–625. [Google Scholar] [CrossRef]
  3. Nguyen, T.V.; Ho-Le, T.P.; Le, U.V. International collaboration in scientific research in Vietnam: An analysis of patterns and impact. Scientometrics 2017, 110, 1035–1051. [Google Scholar] [CrossRef]
  4. Vuong, Q.H.; Ho, T.M.; Vuong, T.T.; Nguyen, V.H.; Napier, N.K.; Pham, H.H. Nemo solus satis sapit: Trends of research collaborations in the Vietnamese social sciences, observing 2008–2017 Scopus data. Publications 2017, 5, 24. [Google Scholar] [CrossRef]
  5. Vuong, Q.H.; Ho, T.M.; Vuong, T.T.; Napier, N.K.; Pham, H.H. Gender, age, research experience, leading role and academic productivity of Vietnamese researchers in the social sciences and humanities: Exploring a 2008-2017 Scopus dataset. Eur. Sci. Ed. 2017, 43, 51–55. [Google Scholar] [CrossRef]
  6. Vuong, Q.H.; Napier, N.K. Academic research: The difficulty of being simple and beautiful. Eur. Sci. Ed. 2017, 43, 32–33. [Google Scholar] [CrossRef]
  7. Lehman, H.C. Age and Achievement; Princeton University Press: Princeton, NJ, USA, 1953/2017; pp. 3–21. ISBN 9870691627120. [Google Scholar]
  8. Dennis, W. Creative productivity between the ages of 20 and 80 years. J. Gerontol. 1966, 21, 1–8. [Google Scholar] [CrossRef] [PubMed]
  9. Cole, S. Age and scientific performance. Am. J. Sociol. 1979, 84, 958–977. [Google Scholar] [CrossRef]
  10. Over, R. Does research productivity decline with age? Higher Educ. 1982, 11, 511–520. [Google Scholar] [CrossRef]
  11. Allison, P.D.; Stewart, J.A. Productivity differences among scientists: Evidence for accumulative advantage. Am. Sociol. Rev. 1974, 39, 596–606. [Google Scholar] [CrossRef]
  12. Kyvik, S. Age and scientific productivity. Differences between fields of learning. Higher Educ. 1990, 19, 37–55. [Google Scholar] [CrossRef]
  13. Cooney, T.M.; Schaie, K.W.; Willis, S.L. The relationship between prior functioning on cognitive and personality dimensions and subject attrition in longitudinal research. J. Gerontol. 1988, 43, P12–P17. [Google Scholar] [CrossRef] [PubMed]
  14. Rørstad, K.; Aksnes, D.W. Publication rate expressed by age, gender and academic position—A large-scale analysis of Norwegian academic staff. J. Informetr. 2015, 9, 317–333. [Google Scholar] [CrossRef]
  15. Bonaccorsi, A.; Daraio, C. Age effects in scientific productivity. Scientometrics 2003, 58, 49–90. [Google Scholar] [CrossRef]
  16. Pan, R.K.; Kaski, K.; Fortunato, S. World citation and collaboration networks: Uncovering the role of geography in science. Sci. Rep. 2012, 2, 902. [Google Scholar] [CrossRef] [PubMed]
  17. Uthman, O.A.; Uthman, M.B. Geography of Africa biomedical publications: An analysis of 1996–2005 PubMed papers. Int. J. Health Geogr. 2007, 6, 46. [Google Scholar] [CrossRef] [PubMed]
  18. Duque, R.B.; Ynalvez, M.; Sooryamoorthy, R.; Mbatia, P.D.; Dan-Bright, S.; Shrum, W. Collaboration paradox: Scientific productivity, the Internet, and problems of research in developing areas. Soc. Stud. Sci. 2005, 35, 755–785. [Google Scholar] [CrossRef]
  19. Prpić, K. Gender and productivity differentials in science. Scientometrics 2002, 55, 27–58. [Google Scholar] [CrossRef]
  20. Fulton, O. Rewards and Fairness: Academic Women in the United States; Centre for Research in the Educational Sciences, University of Edinburg: Edinburgh, UK, 1973; ISBN 978-0904170146. [Google Scholar]
  21. Cole, J.R.; Zuckerman, H. The productivity puzzle: Persistence and change in patterns of publication of men and women scientists. In Women in Science; Steinkemp, M.W., Maehr, M.L., Eds.; JAI Press: Greenwich, CT, USA, 1984; Volume 2, pp. 217–258. ISBN 0892322888. [Google Scholar]
  22. Bernard, J. Academic Women; Pennsylvania State University Press: Pennsylvania, PA, USA, 1964; ISBN 9780452003897. [Google Scholar]
  23. Alic, M. The history of women in science: A women’s studies course. Women’s Stud. Int. Forum 1982, 5, 75–81. [Google Scholar] [CrossRef]
  24. Kyvik, S. Motherhood and scientific productivity. Soc. Stud. Sci. 1990, 20, 149–160. [Google Scholar] [CrossRef]
  25. Reskin, B.F. Scientific productivity, sex, and location in the institution of science. Am. J. Sociol. 1978, 83, 1235–1243. [Google Scholar] [CrossRef] [PubMed]
  26. Suitor, J.J.; Mecom, D.; Feld, I.S. Gender, household labor, and scholarly productivity among university professors. Gend. Issues 2001, 19, 50–67. [Google Scholar] [CrossRef]
  27. Kyvik, S.; Teigen, M. Child care, research collaboration, and gender differences in scientific productivity. Sci. Technol. Hum. Values 1996, 21, 54–71. [Google Scholar] [CrossRef]
  28. Leta, J.; Lewison, G. The contribution of women in Brazilian science: A case study in astronomy, immunology and oceanography. Scientometrics 2003, 57, 339–353. [Google Scholar] [CrossRef]
  29. Gupta, B.M.; Kumar, S.; Aggarwal, B.S. A comparison of productivity of male and female scientists of CSIR. Scientometrics 1999, 45, 269–289. [Google Scholar] [CrossRef]
  30. Breimer, L.H.; Nilsson, T.K. A longitudinal and cross-sectional study of Swedish biomedical PhD processes 1991–2009 with emphasis on international and gender aspects. Scientometrics 2010, 85, 401–414. [Google Scholar] [CrossRef]
  31. Lemoine, W. Productivity patterns of men and women scientists in Venezuela. Scientometrics 1992, 24, 281–295. [Google Scholar] [CrossRef]
  32. Sotudeh, H.; Khoshian, N. Gender differences in science: The case of scientific productivity in Nano Science & Technology during 2005–2007. Scientometrics 2014, 98, 457–472. [Google Scholar] [CrossRef]
  33. Van Arensbergen, P.; van der Weijden, I.; van den Besselaar, P. Gender differences in scientific productivity: A persisting phenomenon? Scientometrics 2012, 93, 857–868. [Google Scholar] [CrossRef] [PubMed] [Green Version]
  34. Larivière, V.; Ni, C.; Gingras, Y.; Cronin, B.; Sugimoto, C.R. Bibliometrics: Global gender disparities in science. Nature 2013, 504, 211–213. [Google Scholar] [CrossRef] [PubMed]
  35. Ho, T.M.; Nguyen, V.H.; Vuong, T.T.; Dam, Q.M.; Pham, H.H.; Vuong, Q.H. Exploring Vietnamese co-authorship patterns in social sciences with basic network measures of 2008–2017 Scopus data. F1000Research 2017, 6, 1559. [Google Scholar] [CrossRef] [PubMed]
  36. Teja, T.; Hochberg, M.E.; Rand, T.A.; Rey, V.H.; Krauss, J. Author sequence and credit for contributions in multiauthored publications. PLoS Biol. 2007, 5, e18. [Google Scholar] [CrossRef]
  37. Ho, D.M. Scientific publications in Vietnam as seen from Scopus during 1996–2013. Scientometrics 2015, 105, 83–95. [Google Scholar] [CrossRef]
  38. Vuong, Q.H.; Tran, T.D.; Napier, N.K.; Dau, T.H. Business education in the emerging economy of Vietnam: Twenty years of expectations, illusions, and lessons. In Innovation in Business Education in Emerging Markets; Alon, I., Jones, V., McIntyre, J., Eds.; Palgrave Mcmillan: New York, USA, 2013; pp. 96–109. [Google Scholar] [CrossRef]
  39. Vuong, Q.H. Global mindset as the integration of emerging socio-cultural values through mindsponge processes: A transition economy perspective. In Global Mindsets: Exploration and Perspectives; Kuada, J., Ed.; Routledge: London, UK, 2016; pp. 109–126. ISBN 1138831778. [Google Scholar]
  40. Vuong, Q.H. Learning to love the reviewer. Eur. Sci. Ed. 2017, 43, 83. [Google Scholar]
  41. Bordons, M.; Gómez, I.; Fernández, M.; Teresa, Z.; Angeles, M.; Méndez, A. Local, domestic and international scientific collaboration in biomedical research. Scientometrics 1996, 37, 279–295. [Google Scholar] [CrossRef]
  42. Hampton, S.E.; Parker, J.N. Collaboration and productivity in scientific synthesis. BioScience 2011, 61, 900–910. [Google Scholar] [CrossRef]
  43. Lee, S.; Bozeman, B. The impact of research collaboration on scientific productivity. Soc. Stud. Sci. 2005, 35, 673–702. [Google Scholar] [CrossRef]
  44. Ho, T.M.; Nguyen, H.K.T.; Vuong, T.-T.; Vuong, Q.-H. On the sustainability of co-authoring behaviors in Vietnamese social sciences: A preliminary analysis of network data. Sustainability 2017, 9, 2142. [Google Scholar] [CrossRef]
  45. Vuong, Q.H. The (ir)rational consideration of the cost of science in transition economies. Nat. Hum. Behav. 2018, 2, 1. [Google Scholar] [CrossRef]
  46. Vuong, Q.H. Open data, open review and open dialogue in making social sciences plausible. Nature: Scientific Data Updates (12 December 2017). Available online: http://blogs.nature.com/scientificdata/2017/12/12/authors-corner-open-data-open-review-and-open-dialogue-in-making-social-sciences-plausible/ (accessed on 26 December 2017).
  47. Vuong, Q.H. Survey data on Vietnamese propensity to attend periodic general health examinations. Sci. Data 2017, 4, 170142. [Google Scholar] [CrossRef] [PubMed]
Figure 1. Regional and gender distribution of scientists.
Societies 08 00003 g001
Figure 2. Relationship between nominal productivity and relative productivity by sex.
Societies 08 00003 g002
Figure 3. A box plot of “cp”—Relative productivity distribution by regions.
Societies 08 00003 g003
Table 1. Descriptive statistics for the variables in the study.
VariableMinMeanMaxSD95% CIp-Value
Adjusted productivity (“cp”)0.052.4061.164.621.96–2.852.2 × 10−16
Nominal productivity (“ttlitems”)13.60635.893.03–4.172.2 × 10−16
# articles in leading role (“au.key”)01.77604.241.36–2.184.5 × 10−5
Age (“age”)1942.10729.1541.21–42.992.2 × 10−16
Table 2. Descriptive statistics for variables after the removal of the outlying data points.
VariableMinMeanMaxSD95% CIp-Value
Adjusted productivity (“cp”)0.052.119232.8721.840–2.3992.2 × 10−16
Nominal productivity (“ttlitems”)13.226283.9342.843–3.6092.2 × 10−16
# articles in leading role (“au.key”)01.523222.5431.278–1.7712.2 × 10−16
Age (“age”)1942.06729.17141.168–42.9552.2 × 10−16
Table 3. Distribution of authors by age group and relative productivity.
Age Group<30[30,40)[40,50)≥50Total
CPFCSFCSFCSFCS# PeopleProportion
<16661614949343415036.59%
[1,2)410451064392266011828.78%
[2,3)111191251811012725012.20%
[3,4)112913414124072245.85%
[4,5)012614010134375194.63%
[5,6)01251458142075133.17%
[6,7)0120145114317620.49%
[7,∞)012515522187790348.29%
Notes: F: Frequency; CS: Cumulative Sum.
Table 4. Estimation results of “cp” against “age_gr” and “au.key”.
Interceptau.keyAge_gr
“b4050”“g50”“less30”
β0β1β2β3β4
cp0.403 ***1.060 ***0.243 *0.146−0.136
[4.687][86.876][2.064][1.025][−0.437]
(3.8 × 10⁻⁶)(2 × 10⁻¹⁶)(0.039)(0.306)(0.663)
Signif. codes: ‘***’ 0.001 ‘**’ 0.01 ‘*’ 0.05 ‘.’ 0.1; z-value in square brackets; p-value in round brackets; baseline category for: “Age_gr” = “b3040”. Residual s.e. = 1.038 on 405 degrees of freedom (df). Multiple R2 = 0.9501, Adj. R2 = 0.9496. F-stat = 1929 on 4 and 405 df, p < 2.2 × 10⁻¹⁶.
Table 5. Estimation results of “cp” against “Region” and “Sex”.
InterceptSexRegion
“M”“North”“Overseas”“South”
β0β1β2β3β4
cp1.5500.724−0.0321.6550.764
[1.560][1.534][−0.033][1.532][0.721]
(0.119)(0.126)(0.974)(0.126)(0.471)
Signif. codes: ‘***’ 0.001 ‘**’ 0.01 ‘*’ 0.05 ‘.’ 0.1; z-value in square brackets; p-value in round brackets; baseline category for: “Sex” = “F”, “Region” = “Center”. Residual s.e. = 4.594 on 405 degrees of freedom (df). Multiple R2 = 0.02281, Adj. R2 = 0.01316. F-stat = 2.363 on 4 and 405 df, p-value: 0.05253.

