A 3D FEM-Based Numerical Analysis of the Sheet Metal Strip Flowing Through Drawbead Simulator


1
Department of Materials Forming and Processing, Rzeszow University of Technology, al. Powst. Warszawy 8, 35-959 Rzeszow, Poland
2
State School of Higher Vocational Education, Rynek 1, 38-400 Krosno, Poland
*
Author to whom correspondence should be addressed.
Metals 2020, 10(1), 45; https://doi.org/10.3390/met10010045
Submission received: 29 November 2019
/
Revised: 21 December 2019
/
Accepted: 23 December 2019
/
Published: 25 December 2019
(This article belongs to the Special Issue Forming Processes of Modern Metallic Materials)
Abstract
:Drawbeads are elements of the stamping die and they are used to compensate material flow resistance around the perimeter of the drawpiece or to change the stress state in specific regions of the drawpiece. This paper presents the results of experimental and numerical analyses of tests of sheet metal flowing through a drawbead. The tests have been carried out using a special tribological simulator of the drawbead. Experimental tests to determine the coefficient of friction (COF) have been carried out for three widths of sheet metal strip and two drawbead heights. The three-dimensional (3D) elastic-plastic numerical computations were performed using the MSC. Marc program. Special attention was given to the effect of material flow through the drawbead on the distribution of the normal stress on the tool-sheet interface. The mesh sensitivity analysis based on the value of the drawing force of the specimen being pulled through the drawbead allowed an optimal mesh size to be determined. The errors between the numerically predicted values of the COF and the values experimentally determined ranged from about 0.95% to 7.1% in the cases analysed. In the case of a drawbead height of 12 mm, the numerical model overestimated the value of the COF for all specimen widths analysed. By contrast, in the case of a drawbead height of 18 mm, all experimentally determined friction coefficients are underestimated by Finite Element Method (FEM). This was explained by the different character of sheet deformation under friction and frictionless conditions. An increase in the drawbead height, with the same sheet width, increases the value of the COF.
1. Introduction
Drawbeads are used to compensate material flow resistance around the perimeter of the drawpiece or to change the stress state in specific regions of the drawpiece [1,2]. Typically, drawbeads are located between the die and blankholder surfaces. The quality of deep drawn parts largely depends on controlling the movement of the material into the die hole. For this purpose, a blankholder or drawbeads are used. When using the blankholder, the increased resistance of the material flow in the flange of the drawpiece is achieved by friction. When a greater flow resistance is required, especially locally in certain areas of the flange of the drawpiece, drawbeads are used. Then, the increased resistance in the flange results both from friction and from cyclic plastic deformation of the sheet metal [3,4] and drawbead geometry imposes a change in the curvature of the sheet. The most widely used geometrical form of a drawbead cross section is circular (Figure 1).
The tribological and mechanical properties of the sheet metal and friction processes, i.e., the lubrication conditions and the dynamics of contact, play a decisive role in determining the quality of the parts formed [5,6,7,8]. To investigate the behaviour of the sheet while flowing through the drawbead, the drawbead test (DBT) is commonly attributed to friction modelling at the drawbead in sheet metal forming (SMF). A method of friction determination using the DBT has been developed by Nine [9]. Nine’s drawbead simulator mainly tests the friction condition between the blankholder and the die, which fails to reflect the change of coefficient of friction (COF) in each region caused by different stress modes. Several authors have conducted research to better understand the frictional phenomena in sheet metal forming [10,11,12,13] and mechanics of sheet deformation at the drawbeads [14,15,16] and over the years, analytical, semi-empirical and numerical approaches have been developed.
Lee et al. [17] developed numerical procedures to predict the drawbead restraining force (DBRF) using a semi-analytical method. The effect of process parameters and material properties including the shape of the yield surface is investigated. Xie [18] studied the effect of the geometric parameters influencing the semi-circular drawbead force. The inverse model of the drawbead geometric parameters has been established based on the neural network and genetic algorithm. This enabled a nonlinear relationship between drawbead geometry and forming quality to be obtained. Zhang et al. [19] proposed a new method for automatic optimisation of drawbead geometry in SMF based on the iterative learning control model. The process improves the level of automation and the efficiency of drawbead design and decreases the dependency on engineering experience. Halkaci et al. [20] used a shallow drawbead to reduce the wrinkling tendency in hydromechanical deep drawing. A shallow drawbead added to the blankholder increased the limiting drawing ratio of aluminium alloy sheet.
Experimental testing of the material flowing through the drawbead using friction simulators permits not only the determination of the DBRF but also the evaluation of the value of the COF. Due to a strong effect of the type of material, coating, lubricant and surface topography of both the workpiece and the tool, etc. on the value of frictional resistances determined using DBS, there are no universal models of friction. Thus, the experimental testing of draw beads is still necessary. Bassoli et al. [21] proposed a versatile draw bead simulator to measure the restraining force exerted on sheet metal by the draw bead during deep drawing. It was found that the restraining force was slightly augmented when the sheet metal thickness was increased. As a consequence of cyclic bending and unbending of the sheet metal, the material experienced work hardening and wall thinning. Nanayakkara and Hodgson [22] proposed a method to determine the draw bead contact conditions as a function of bead penetration which was based on the drawbead simulator. The results give a useful relationship between the rates of change of the contact angle with increasing bead penetration.
Many studies on drawbeads have emerged, particularly encouraged by the rapid progress of computational methods. Numerically, there are still numerous difficulties in accurately modelling and describing drawbead geometries and actions [23]. Duarte et al. [24] proposed a hybrid approach for estimating the DBRF throughout the explicit dynamic finite element (FE) method. A comparison of the numerical results with the experimental data provided by Nine [9] shows that the average of absolute error with respect to experimental data bases was around 6%. Moon et al. [25] employed drawbead forces computed by equivalent drawbead models in a finite element modelling (FEM) of the stamping process. Joshi et al. [26] conducted the experimental investigations on different semi-circular drawbead geometries and compared them to those obtained from Stoughton’s analytical drawbead model [27]. This model significantly overpredicted the DBRF, whereas the numerical two-dimensional (2D) plane strain drawbead model accurately predicted the DBRF. Bramhakshatriya et al. [28] conducted the numerical computations of hemispherical cup forming using a circular drawbead. The numerical results were in good agreement when compared with the experimental ones.
Knowledge of the frictional resistances that have arisen in the drawbead region of the stamping die is necessary in order to prepare an appropriate design of die tool and to forecast the material flow during the forming of drawpieces, especially those with complex shapes [7,29,30]. Most of the research is focused on the estimation of the drawbead restraining force in sheet metal forming. Academic investigations on the determination of the COF during sheet metal flow through the drawbead are limited. The majority of FEM-based computations are based on the analysis of a 2D plane-strain state model of the physical drawbead which does not accurately reflect the material deformation in the drawbead. The aim of this paper is experimental study and three-dimensional (3D) elastic-plastic FEM-based numerical modelling of the frictional phenomena and material deformation during the flow of the sheet metal through the drawbead. Different set-up conditions, including drawbead height and specimen widths, have been considered.
2. Experimental
2.1. Material
DC04 cold rolled steel sheet for drawing with a thickness of 0.8 mm was used as a test material. Due to good weldability and excellent formability, DC04 steel sheet is well-suited to the manufacturing of structural elements, especially in the transport and household appliance industries. Examples of typical applications for this steel are side panels, floor panels and car bodies. The chemical composition of this steel (Table 1) is restricted by the requirements of EN 10130:2009 [31].
The mechanical properties of sheet metals (Table 2) were determined in a uniaxial tensile test in machine Z100 (Zwick/Roell, Ulm, Germany) according to EN ISO 6892-1:2016 [32]. The plastic properties are characterised by the strain hardening coefficient K and strain hardening exponent n. These parameters were determined by approximation of the true stress–true strain relation by the Hollomon equation:
where σ is stress and ε is plastic strain. Three samples were tested for each direction of the specimen: At an angle of 0°, 45° and 90° with respect to the rolling direction of the sheet metal.
The values of the basic surface roughness parameters determined using a Talysurf CCI Lite 3D optical profiler (Taylor Hobson, Leicester, UK) are as follows: Average roughness Sa = 1.31 μm, root mean square roughness Sq = 1.53 μm, maximum pit depth Sv = 6.98 μm, total height St = 11.39 μm, 10-point peak-valley surface roughness Sz = 9.41 μm and the highest peak of the surface Sp = 4.41 μm.
2.2. Method
The frictional resistances arising in the drawbead region of the stamping die have been determined using a special tribological drawbead simulator (DBS). The model of the simulator is shown in Figure 2. The device is designed to allow the separation of the deformation resistance of the sheet and the frictional resistance from the total resistance of the sheet metal deformation at the drawbead. The frame (1) of the device is mounted in the bottom grip of the universal tensile testing machine Z100 (Zwick/Roell, Ulm, Germany). The specimen (3) is mounted in the upper grip of this machine. During the tests the unsupported end of the specimen has a tendency to bend. The stability of the contact area of the sheet and the working rollers (4) was achieved by a supporting roller (5). During tests the values of the drawing (friction) and clamping (normal) force were measured by using two load cells (6 and 7) placed at surface of the upper tension member (2) and horizontal tension member (8), respectively. When the test was carried out with fixed rollers, the rotation of the working rollers (4) was blocked by using pins (9). Adjustment of the value of the drawbead height was realised by a wing nut (10). A personal computer was used to register the values of both the drawing and clamping forces. The measuring signals from both tension members (2 and 8) were transmitted to a 4-channel C series strain/bridge input module NI-9237 (National Instruments, Austin, TX, USA) into the LabView program (National Instruments, Austin, TX, USA). The values of the forces were registered with a frequency of 50 Hz.
The method of determining the COF requires two tests of drawing a sheet metal strip over rotating (Figure 3a) and fixed (Figure 3b) rollers. Drawing the specimen over a set of rotating rollers allows one to minimise the frictional resistance. The drawing force in this case is mainly associated with overcoming the deformation resistance of the sheet metal strip. A set of fixed rollers represents the total resistance of drawing the specimen through the drawbead.
The value of the COF is determined from [33]:
where α is the quarter contact angle of actual engagement of the strip over the middle roller, FR is the pulling force obtained with the freely rotating rollers, FF is the pulling force obtained with fixed rollers and NF is the normal force obtained with fixed beads.
To avoid breaking the specimen at large wrap angles and when testing mild sheets due to excessive drawing resistance, it is necessary to ensure clearance c (Figure 4) between the rollers. The clearance value should be appropriately set. Too small an amount of clearance may lead to blocking the specimen, especially when testing the drawing specimen with fixed beads. On the other hand, excessive clearance may cause an unfavourable change in the character of the specimen deformation [34]. In this paper, the clearance is set according to the paper of Nanayakkara et al. [33], which suggests setting a clearance of 1.55 mm for a sheet thickness of 0.8 mm.
A change of friction conditions in DBS may be obtained by changing the wrap angle of the counter-sample, the lubrication conditions, the shape and dimensions of the drawbead model, and the drawing speed of the sheet. The results of a wide range of experimental investigations prepared using a simulator that had been developed (Figure 2) were presented in a recent paper of the author [1]. In this paper, the aim of experimental research is to provide experimental data for the preparation and validation of the numerical model.
The research was carried out on sheet metal strips with dimensions 400 mm × w mm × 0.8 mm (length × width × thickness). The specimens were cut along the direction of sheet rolling. Three specimen widths, i.e., 7 mm, 14 mm and 20 mm, were considered. Moreover, two heights h of the drawbead (Figure 4), i.e., 12 and 18 mm, were investigated. The friction tests were conducted under dry friction conditions. The velocity of drawing the specimens was 10 mm·s−1. The set of rollers that was used had a surface roughness characterised by an arithmetical mean deviation of the profile Ra = 0.63 μm.
3. Numerical Modeling
3.1. Description of the FE Model
Numerical modelling of the drawing of sheet metal through the drawbead model was carried out in the finite element-based MSC.Marc program (MSC Software, Newport Beach, CA, USA). The rollers were assumed to be non-deformable, which only allowed the inclusion of the external surfaces of the rollers in the numerical model. Displacement is applied to the first end of the specimen. In contrast, the second end of the specimen was free. The simulations took place in two stages. In the first stage, one of the ends of the sheet metal strip was blocked. Then, the displacement was imposed on the middle roller to reach the desired height of the drawbead h (Figure 5a). After that, the displacement was applied to one end of the specimen (Figure 5b).
The material model was assumed to be an elastic-plastic. The numerical computations have been performed with material behaviour described by the von Mises [35] yield criterion, including the strain hardening phenomenon according to the Hollomon equation. The average values of K and n constants in Equation (1), were determined based on Table 2. The remaining material parameters were as follows: Young’s modulus E = 186,891 MPa, Poisson’s ratio ν = 0.3, material density ρ = 7860 kg·m−3.
The contact conditions between the sheet and the surfaces of the rollers were described by Coulomb’s law:
where σt is the shear stress, σn is the normal stress, μ is COF, t is the tangential vector and vr is the relative sliding velocity.
Alternatively, Equation (3) can be rewritten as a relationship between tangential and normal forces:
where FT is the tangential (friction) force and FN is the normal force.
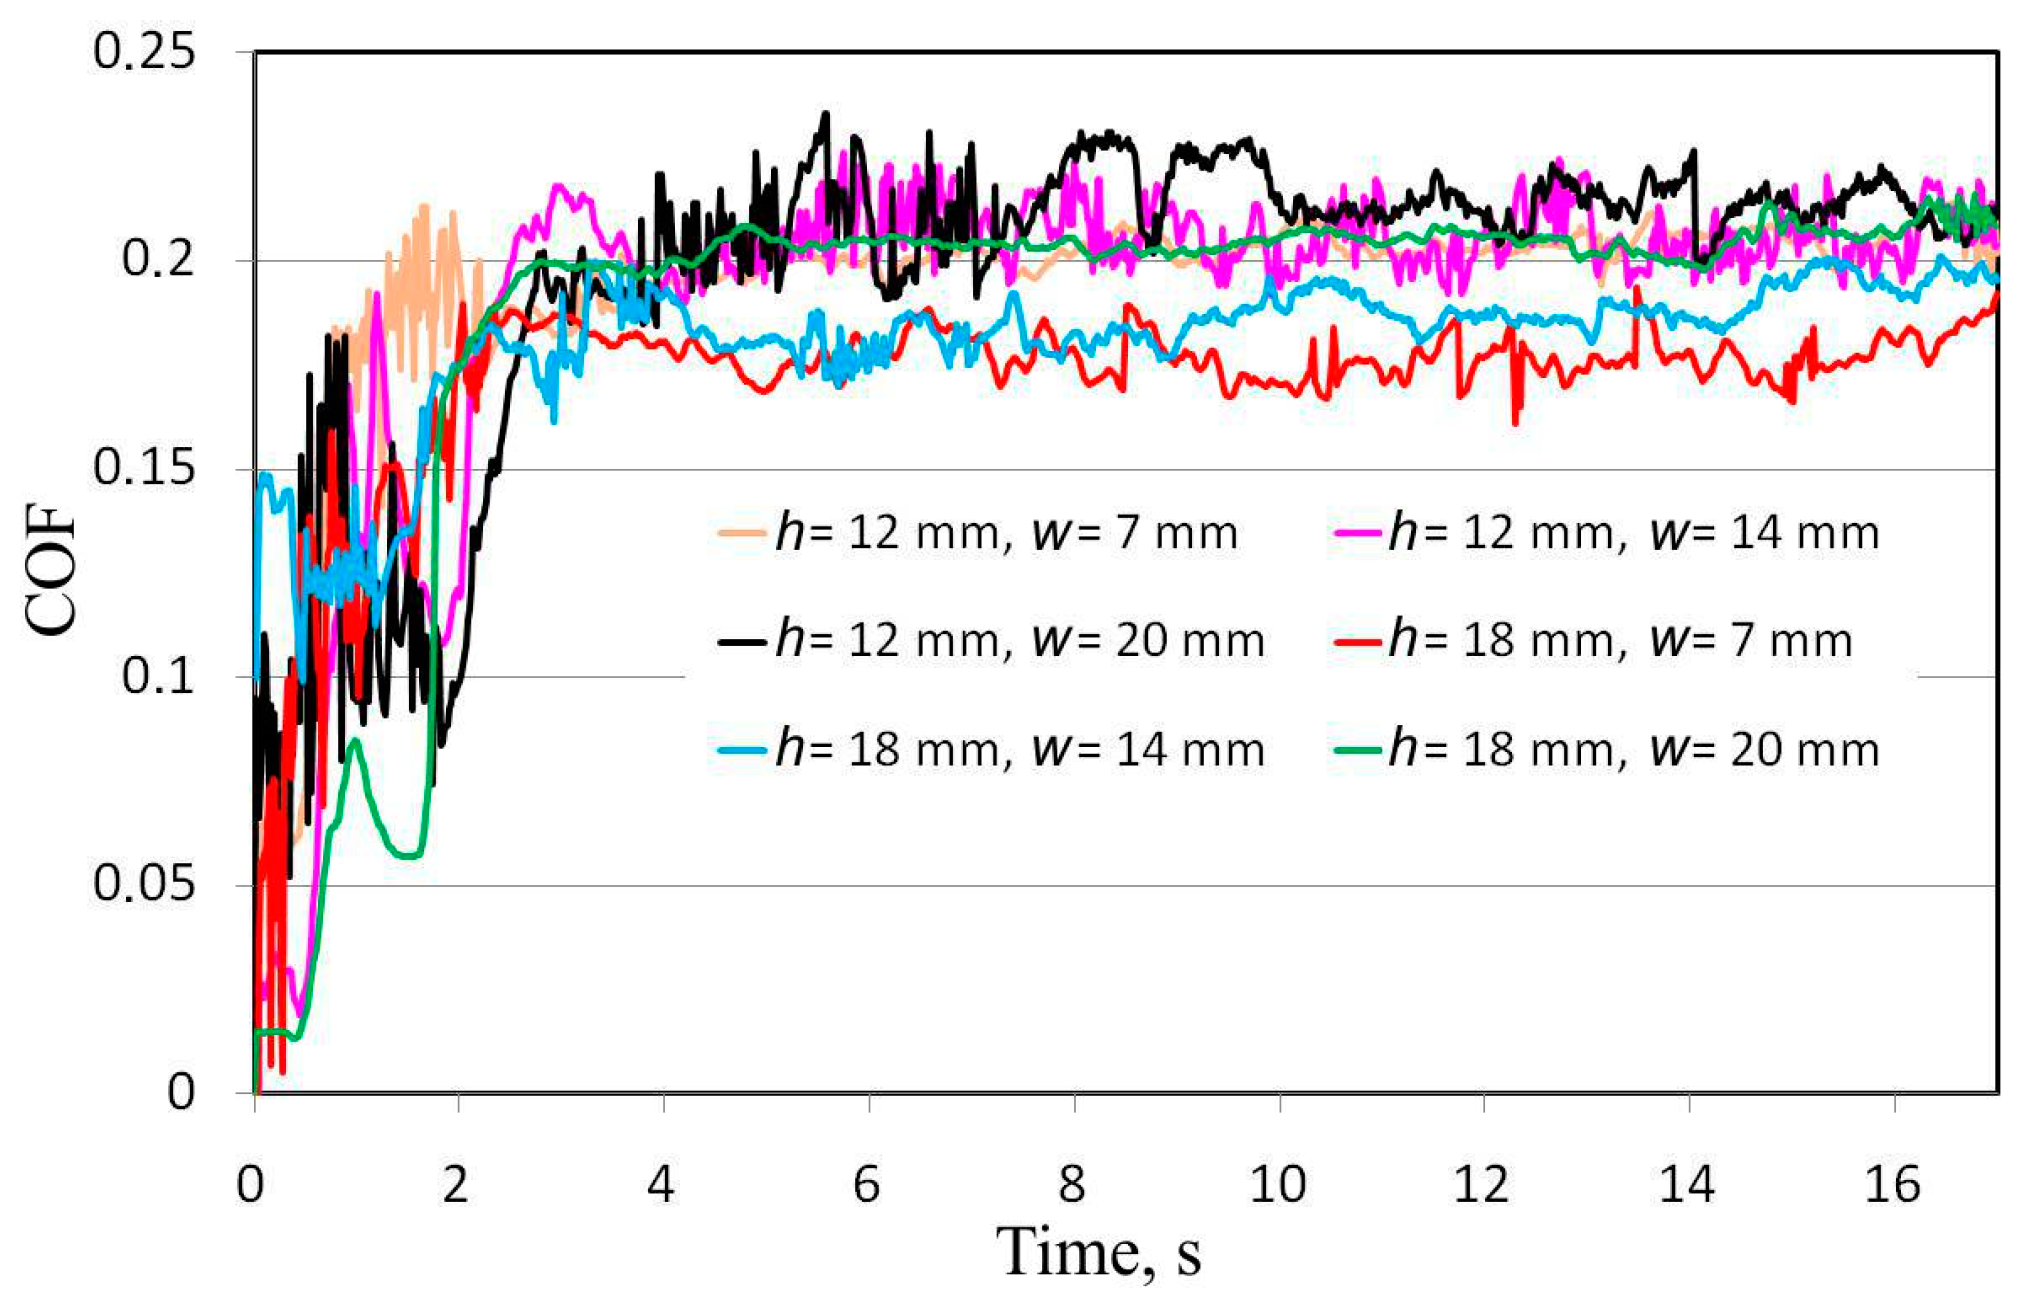
Experimentally determined variations of COF when pulling a sheet metal strip through a drawbead simulator are shown in Figure 6. The variation in COF can be divided into two regions (Figure 7):
(1) The first region (0–2.5 s) with an increase in the COF due to the positioning the middle roller to the desired value.
(2) The second region (2.5–17 s) with the changes in the COF stabilised during the stage of pulling the sheet strip through the DBS.
Two simulations are required for the determination of the numerically predicted COF:
(1) In the model with blocked pins, the COF was assumed based on the experimental investigations. For the stage of setting the position of the middle roller, a linear increase in the COF was assumed. In the case of the drawing, a constant value of the COF was assumed, which corresponded to the average value of the experimentally determined COF (Table 3).
(2) In the model with freely rotatable rollers, the COF was assumed to be 0.
3.2. Mesh Sensitivity Analysis
To discretise the sheet metal, the spatial 8-node isoparametric finite elements hex-8 were used with a formulation assumed strain that improves the behaviour of these elements during bending [36]. The hex-8 element has been successfully used by Fejkiel [37] to study the flowing of a sheet specimen through a drawbead. An appropriate element size is crucial in the analysis of the sheet deformation in metal forming operations. In the aforementioned investigations of Fejkiel [37] it was found that five layers of spatial hex-8 elements are appropriate to get accurate results. In this paper, a mesh sensitivity analysis (MSA) was carried out for five elements through the sheet thickness and different sizes of mesh se × se at the sheet plane: 3.334 × 3.334 mm2, 1.667 × 1.667 mm2, 0.833 × 0.833 mm2 and 0.417 × 0.417 mm2. MSA was carried out for the highest sheet width considered w = 20 mm and the highest drawbead height considered h = 18 mm. The aforementioned sizes of finite elements in the sheet metal plane correspond to dividing the sheet with 6, 12, 24 and 48 elements (Figure 8). More and more dense meshes of finite elements were determined by division of the superordinated mesh into four equal elements. In order to reduce computation time in MSA, the distance of sheet drawing was reduced to 70 mm. The constant value of COF in MSAs was assumed to be 0.2.
4. Results and Discussion
The average drawing force of the metal strip in fixed rollers was adopted as the parameter constituting the basis for the selection of mesh size. Due to the extremely disproportional ratio of height in the thickness direction to length of the elements with a size se = 3.334 mm, the numerical calculations of a model including elements of such sizes failed (Figure 9).
In the case of the remaining mesh sizes, the computations were successfully completed. For the numerical model containing finite elements of size se = 1.667 mm, the value of the average drawing force was 1041.6 N with a computation time of about 102 min. Twice reducing the dimensions of the finite elements from se = 1.667 mm to se = 0.833 mm caused an increase in the average value of the drawing force by about 1%, while the central processing unit (CPU) time increased almost 10 times. Further reduction of the mesh size was not rational due to the long CPU time, i.e., over 105 h (Table 4). From the point of view of the effect of mesh size on CPU time and the change in the value of the drawing force, the model with elements se = 1.667 mm is the most advantageous.
In the FEM numerical simulation, it is not possible to take the roughness of the rollers and friction mechanisms in the form of adhesive wear, ploughing, and the interaction of the roughness asperities of the sheet metal surface and tools into account. The value of the COF determined experimentally and introduced into the FEM model is a result of complex contact phenomena defined by the value of the COF introduced. Therefore, it is possible to determine the response of the numerical model in the form of values of both the drawing and clamping forces, and the determination of the value of the COF according to the modified version of Equation (2):
where is the numerically predicted pulling force obtained with the fixed rollers, is the numerically predicted pulling force obtained with freely rotating rollers and is the numerically predicted normal force obtained with fixed beads.
Variations in the drawing and clamping forces of the middle roller under the conditions of height of drawbead h = 12 mm and specimen width w = 20 mm and under the conditions of freely rotatable and fixed rollers are presented in Figure 10a,b, respectively. Based on such results, the instantaneous values of process forces and the variations in the value of COF were determined from Equation (5).
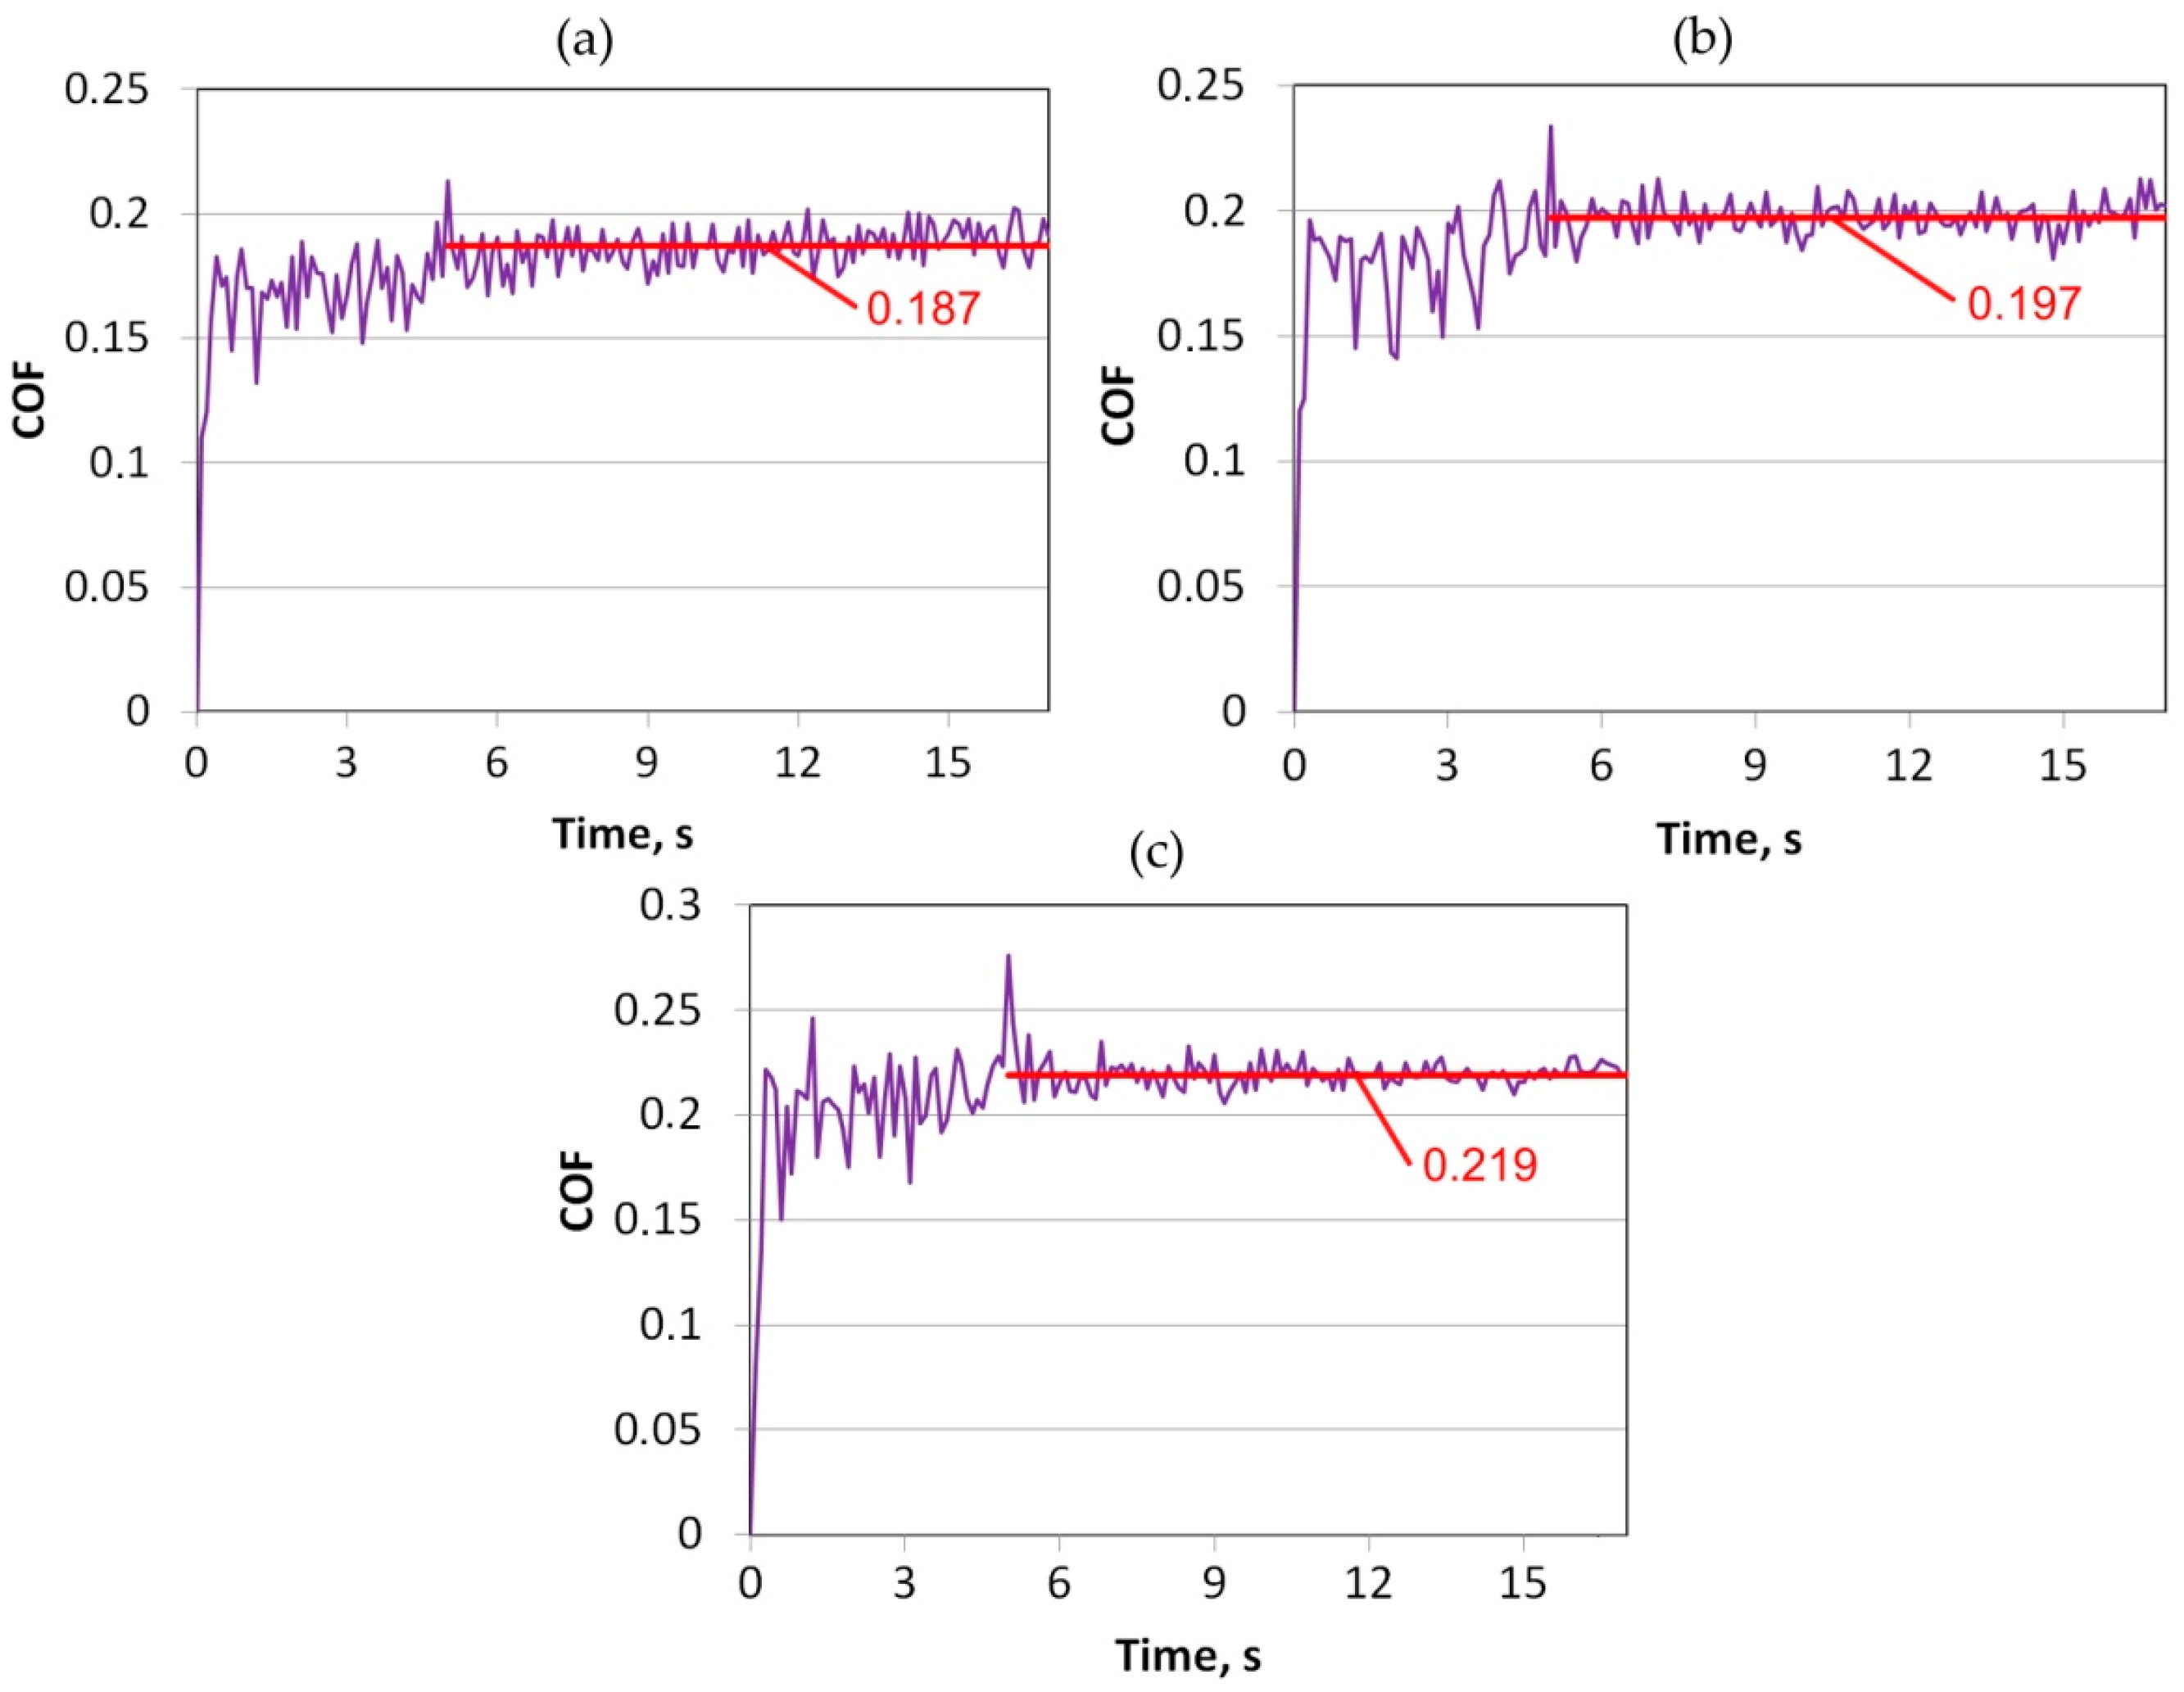
The results of the variation of COF for the height of drawbead h = 18 mm are presented in Figure 11. The average value of COF was calculated for the stage of drawing the specimen (Figure 11). A comparison of the experimentally determined and numerically predicted values of COF for the drawbead heights of h = 12 mm and h = 18 mm are presented in Figure 12a,b, respectively. The errors between the predicted values of the COF and those experimentally determined in the cases analysed ranged from about 0.95% to 7.1%. For the drawbead height h = 18 mm smaller error values of COF were observed (Figure 12b) compared to the drawbead height h = 12 mm (Figure 12a). The next observation is that the numerical model overestimated the value of COF for all specimen widths analysed. In the numerical model increasing the drawbead height, at the same sheet width, increases the value of COF. This conclusion has been confirmed for the two sample widths analysed, 12 and 18 mm. The difference in the COF between the largest and smallest width of the samples was about 8.8%.
The differences between the average values of COF determined in two ways can be partially explained by the deviation of the specimen profile from the ideal case. During the friction test in both the friction and frictionless cases, one end of the specimen was mounted in the grip of the tensile machine. The second end of the specimen was free (Figure 13a). As a result of the lack of tension force in the specimen material located opposite to the grip of the testing machine, the wrap angles of the specimen around the input roller α1 and the output roller α2 are not equal (Figure 13b,c). This also translates into a lack of symmetrical wrapping of the middle roller. The values of the wrapping angles of the rollers operating under friction and frictionless conditions α and β are different. The experimental method of determination of the COF assumes that the wrap angles of both the middle and output rollers are the same and result from the geometry of the drawbead. Thus, the COF determined on the basis of Equation (2) may be disturbed. Future work will be focused on the verification of this hypothesis for different specimen widths and thicknesses.
The sheet strip between the middle roller and the output roller dominates the tensile stresses resulting from counteracting the pulling force by frictional forces on the surfaces of both the middle and input rollers. In the contact zone between the sheet metal strip and the input roller, the sheet metal is bent for the first time, thus, the elastic deformation of the sheet exerts a significant impact on the character of the material flow. As the sheet drawing progresses, the sheet material is bent and straightened, intensifying the effect of the strain hardening phenomenon on the resistance of specimen drawing. The varied character of sheet deformation during flow through the drawbead causes the wrap angle of the rollers to be different from the analytical value resulting from the geometry of the drawbead.
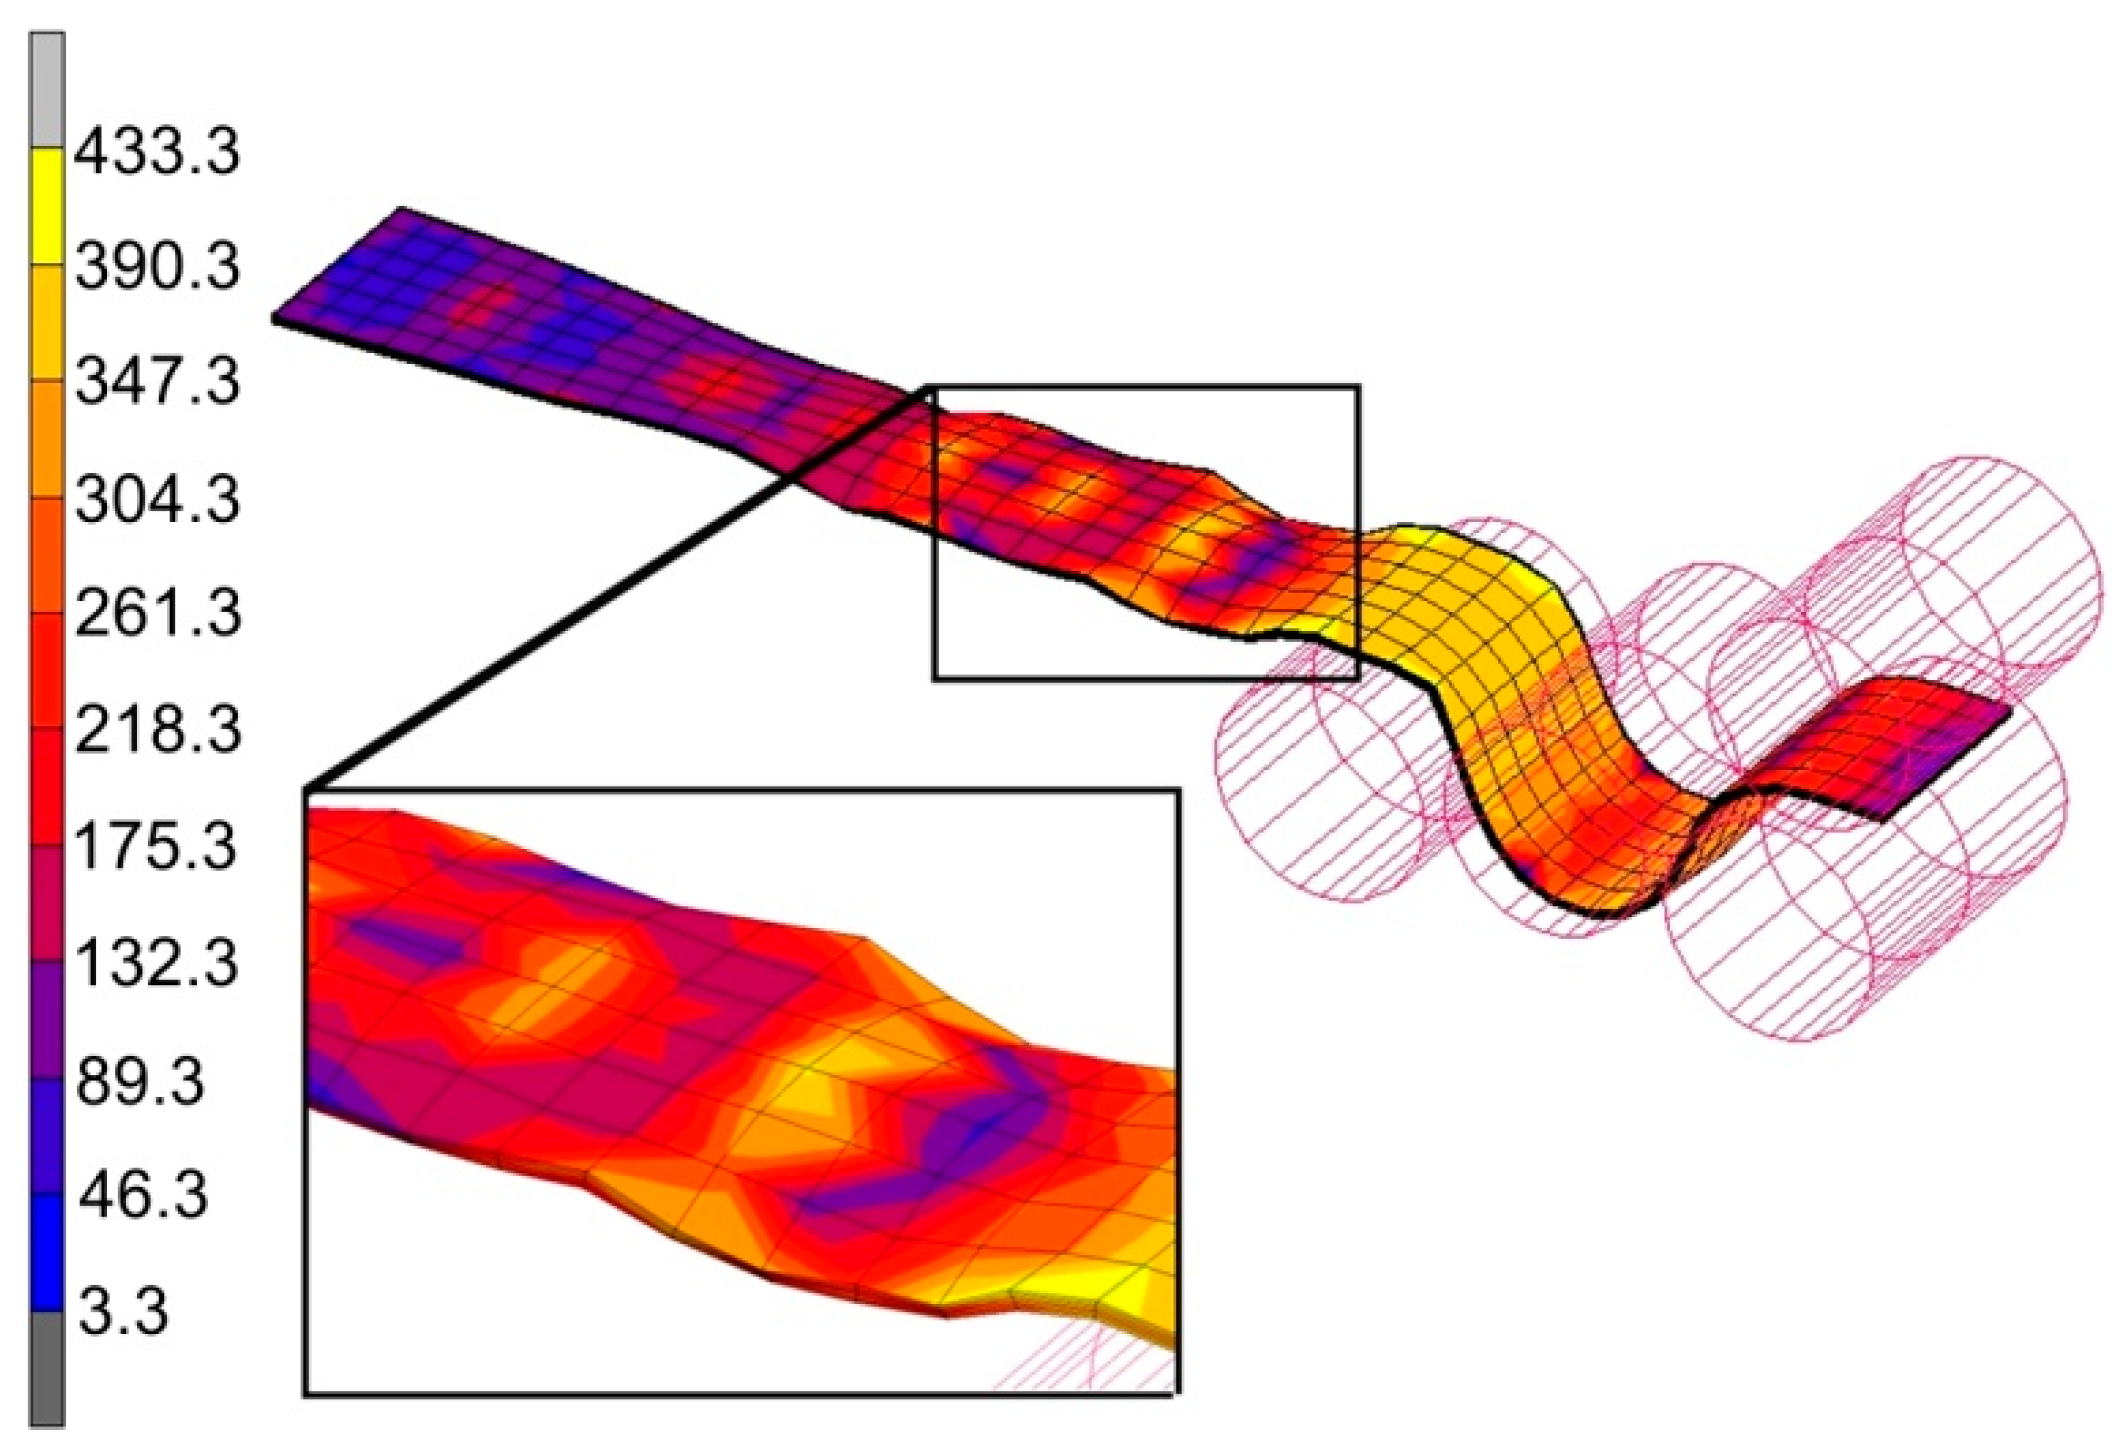
In addition to the difference in the wrap angles of individual rollers, another effect that has been noticed is the non-uniform distribution of normal stress in the sheet metal material (Figure 14). While the distribution of stresses is similar when sheet metal is drawn under friction and frictionless conditions, there is a significant difference in the maximum values of normal stresses. The value of maximum normal stresses in the contact area between the sheet metal and rollers under friction conditions is about 33% higher compared to the frictionless conditions. A similar observation was noticed in the case of the process of drawing the specimen through the drawbead with a height of h = 12 mm.
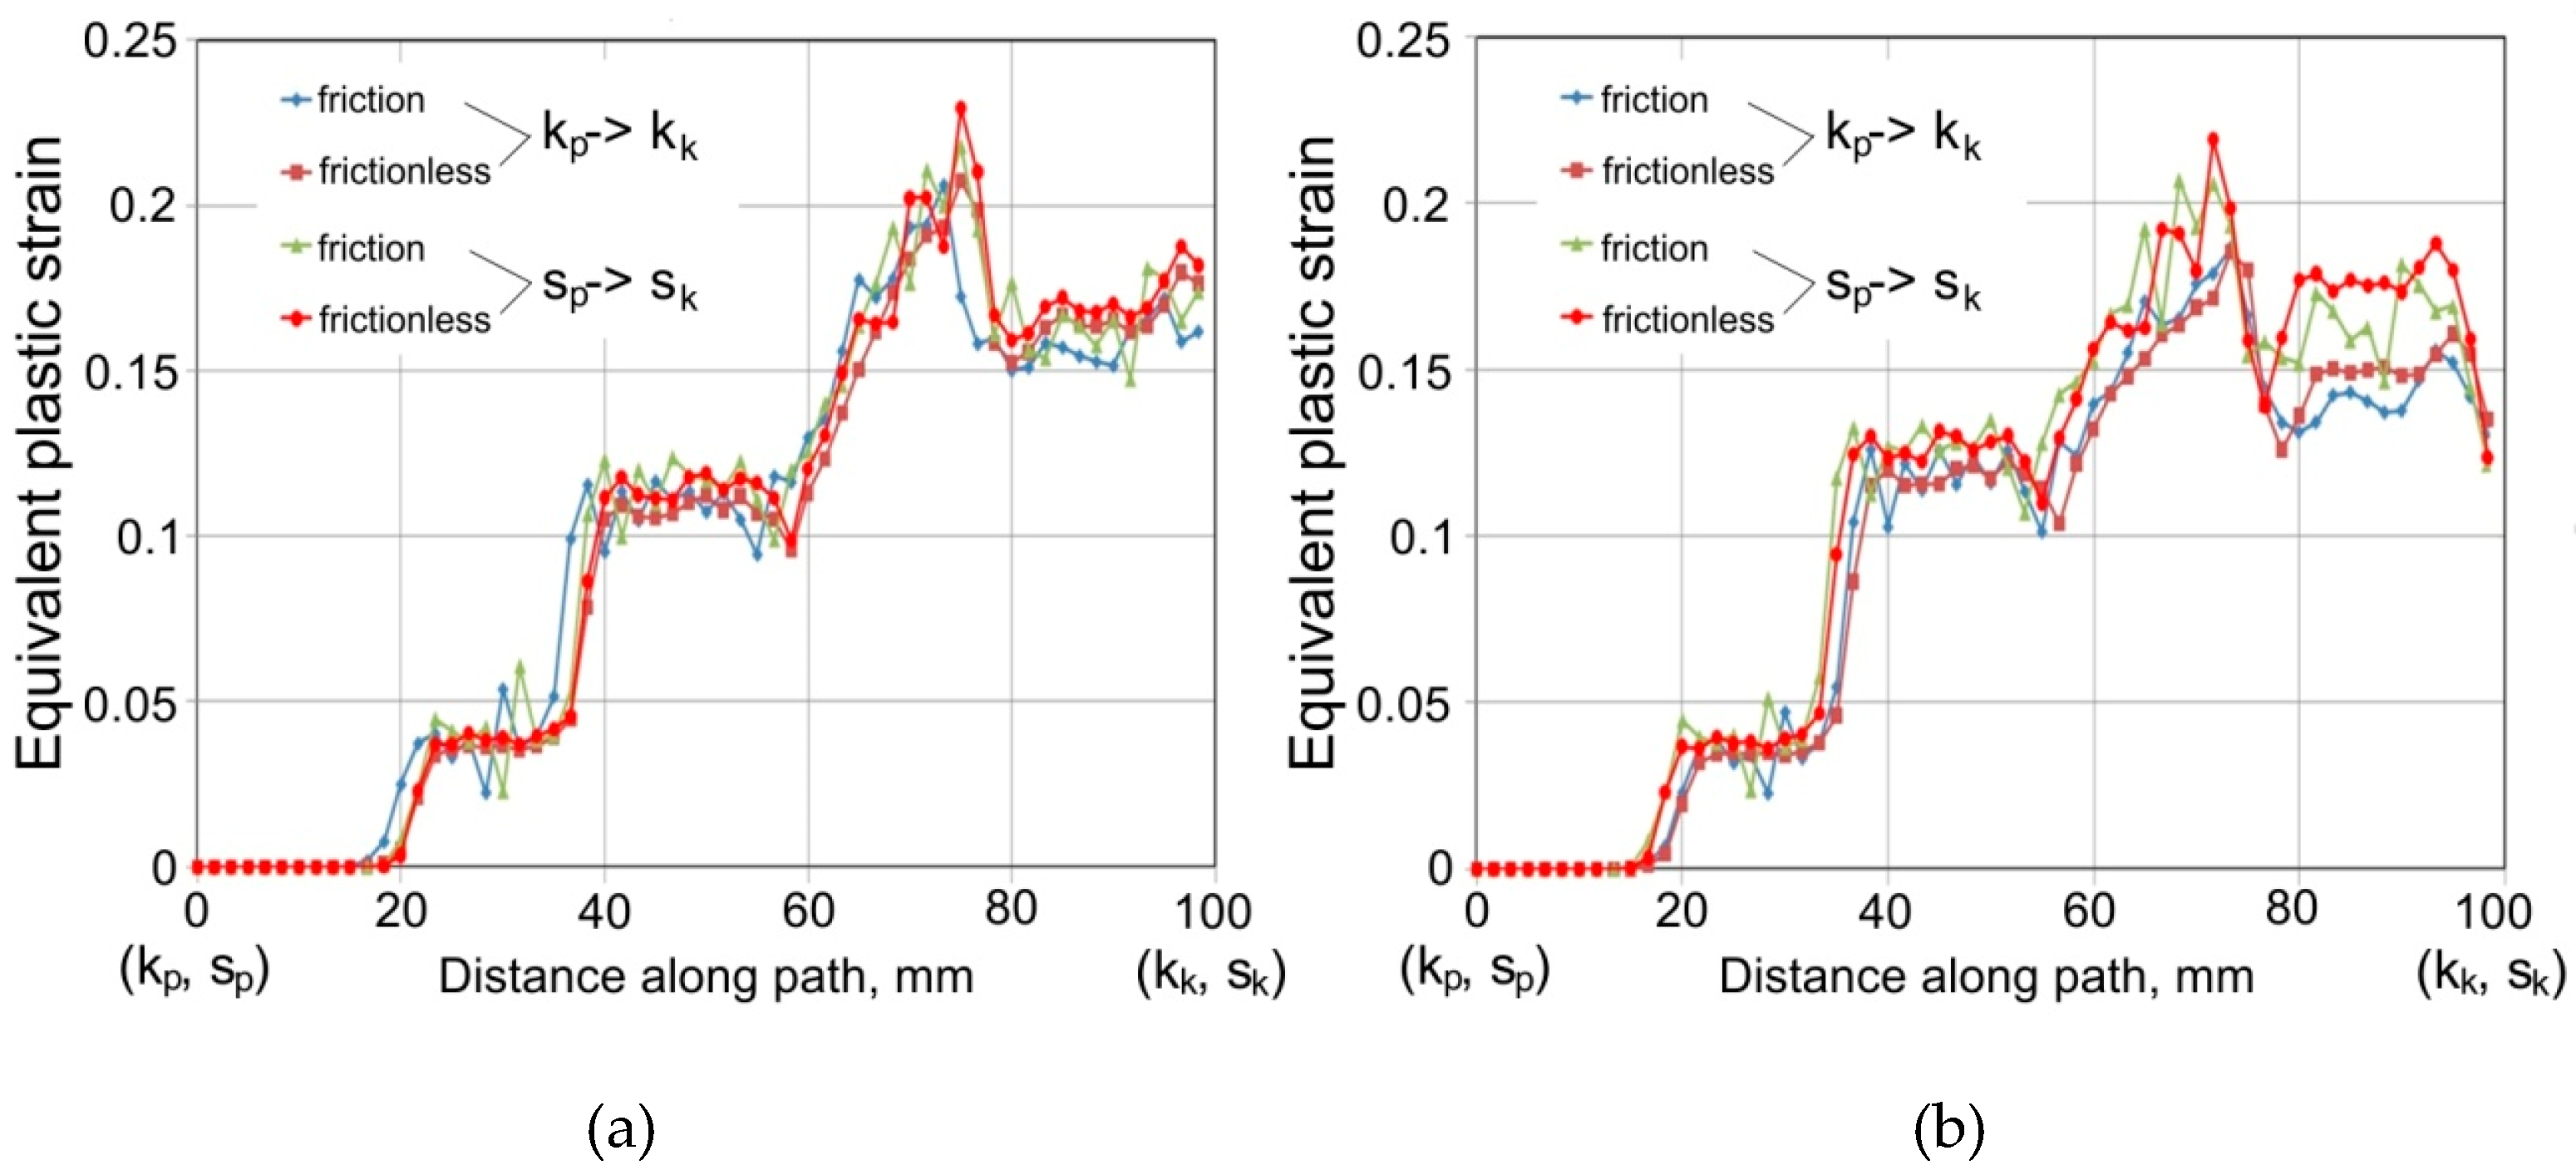
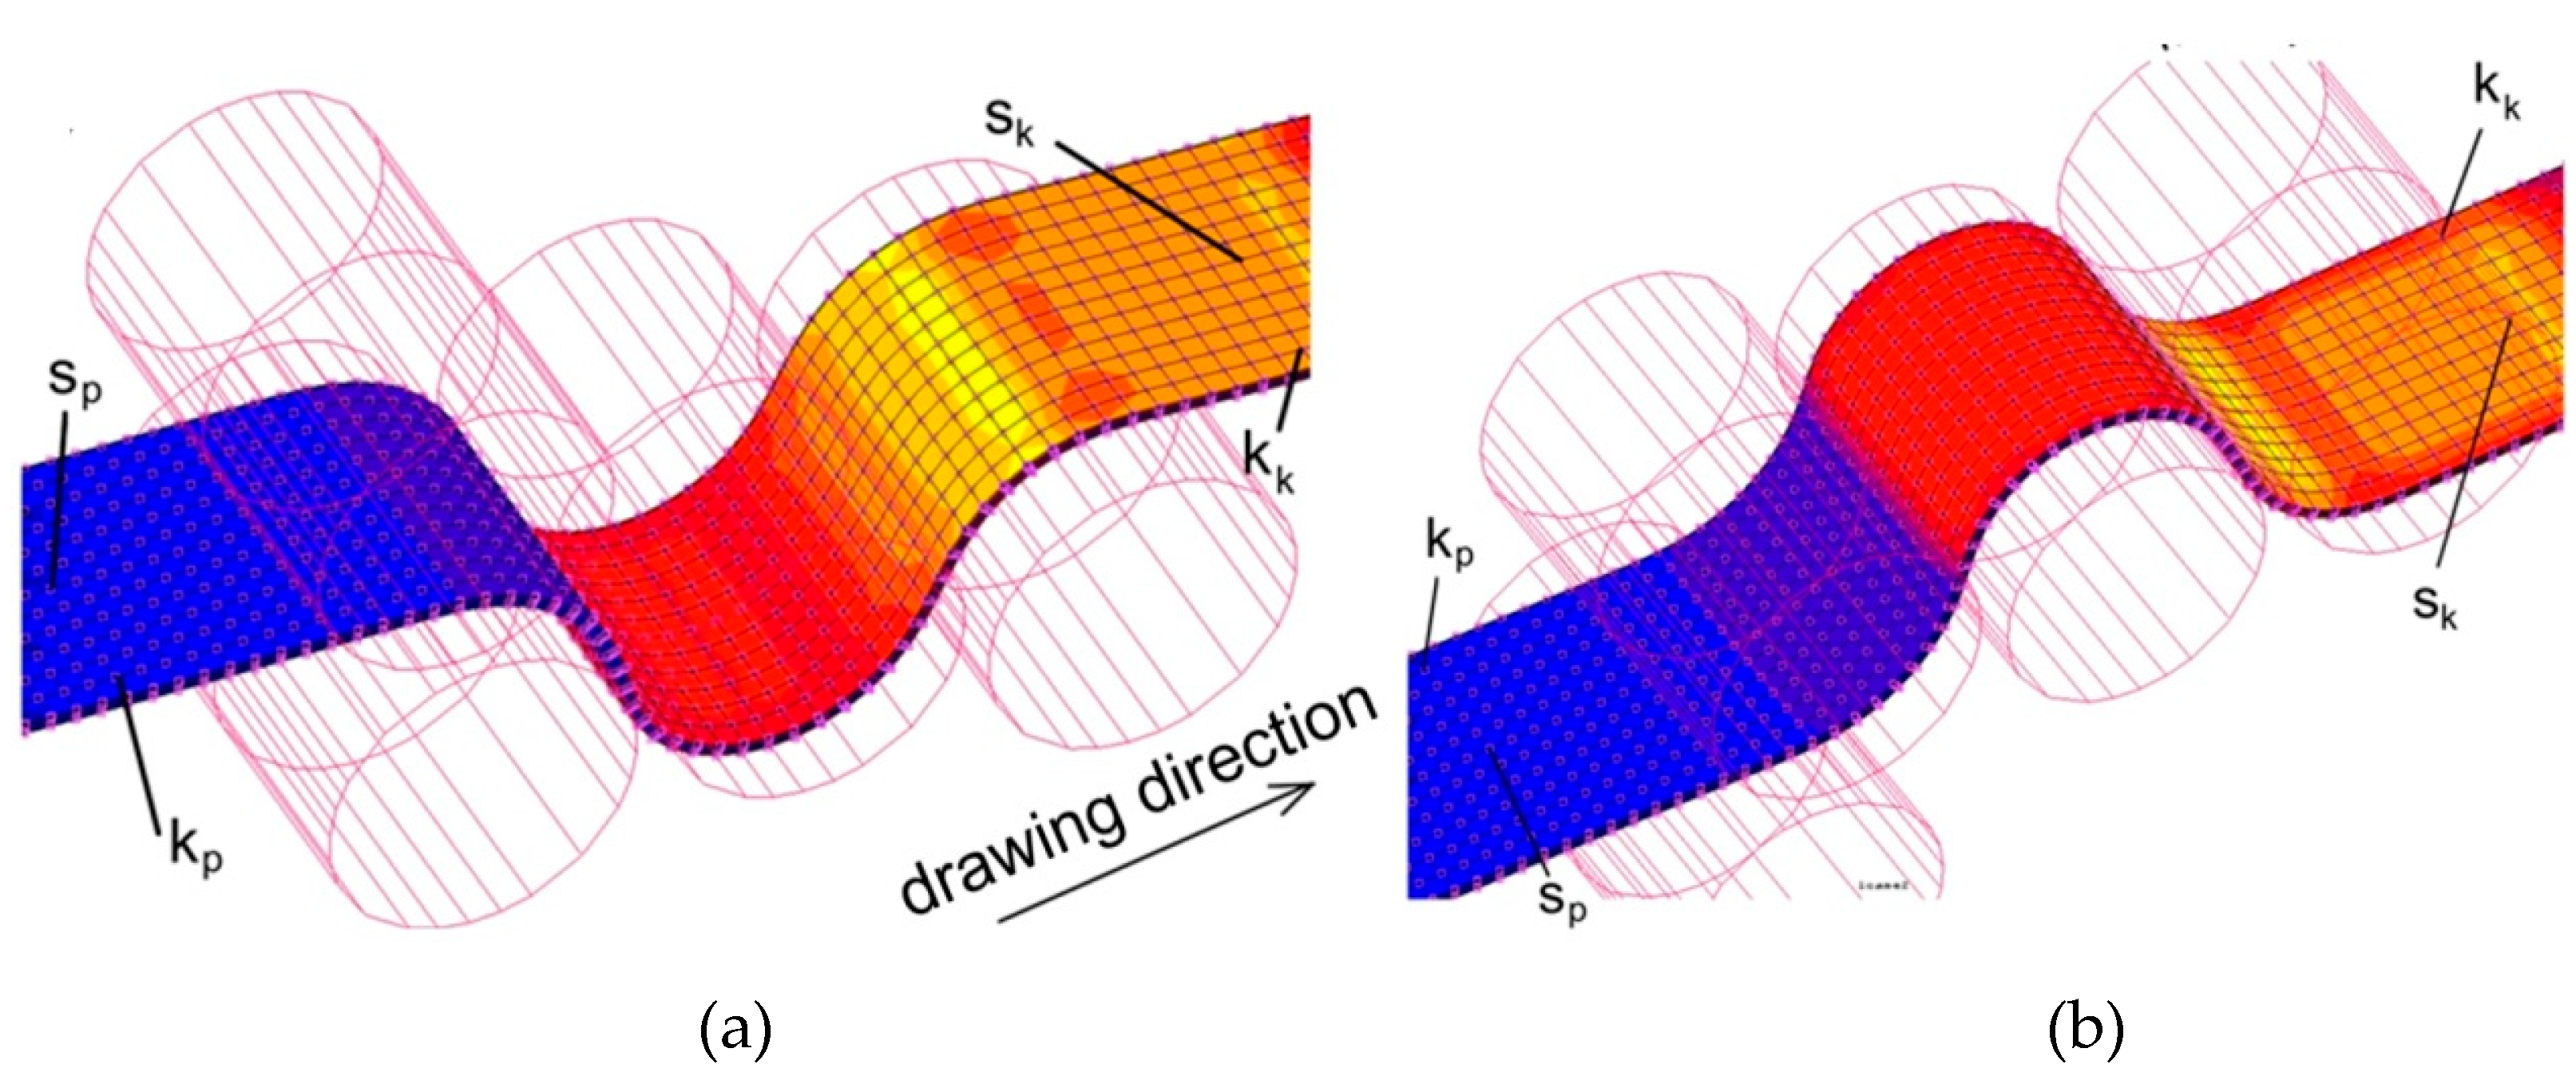
The next stage of the research determined the distribution of equivalent plastic strains (EPSs) along the width of the specimen. These results were obtained for two planes lying in the middle part of the specimen and at its edge on the internal (Figure 15a) and external (Figure 15b) surfaces of the specimen. The distributions thus correspond to the stage of passing the specimen through the drawbead.
Three zones with different levels of EPS can be distinguished both on the external (Figure 16a) and the internal (Figure 16b) surfaces of the sheet metal. The individual levels correspond to the locations where the specimen material contacts the surface of the rollers. In these locations, the material flow associated with the frictional contact between the rollers and the sheet metal strip is inhibited. Therefore, rapid changes in the value of EPS occur in the zones that are between the rollers. The region where a large amount of EPS occurs corresponds to the region where the highest normal stresses occur on the surface of the output roller (Figure 14). The character of change of EPS on both surfaces of the specimen is similar (Figure 16a,b). The locations of measurement of the EPS over the specimen width and different friction conditions do not have a significant effect on the value and distribution of the EPS.
5. Conclusions
This article presents the results of experimental and numerical analyses of the sheet metal flowing through a drawbead simulator. Tribological tests have been carried out on DC04 steel sheets commonly used in the automotive industry using a special tribological drawbead simulator. The following conclusions are drawn from the research:
(1) From the point of view of the effect of mesh size on CPU time and the change in the value of the drawing force, the model element length se = 1.667 mm was the most advantageous.
(2) The errors between the experimentally determined and numerically predicted values of the COF in the cases analysed ranged from about 0.95% to 7.1%.
(3) In the case of drawbead height of 12 mm, the numerical model overestimated the value of COF for all the specimen widths analysed; in contrast, in the case of drawbead height h = 18 mm, all the experimentally determined friction coefficients are underestimated by FEM; this can be explained by the different character of the sheet deformation around input and output rollers in the experiment, which translates into a lack of symmetrical wrapping of the middle roller, and input and output rollers.
(4) In the numerical model increasing the drawbead height, at the same sheet width, increases the value of the COF; the difference in the COF between the largest and smallest widths of the samples was about 8.8%.
(5) The value of maximum normal stresses in the contact area between sheet metal and rollers under friction conditions was about 33% higher compared to frictionless conditions.
Author Contributions
Conceptualization, T.T.; Data curation, R.F.; Investigation, R.F.; Methodology, T.T.; Software, T.T.; Validation, R.F.; Writing—Original draft, T.T.; Writing—Review and editing, T.T. All authors have read and agreed to the published version of the manuscript.
Funding
This research received no external funding.
Conflicts of Interest
The authors declare no conflict of interest.
References
- Trzepieciński, T.; Bazan, A.; Lemu, H.G. Frictional characteristics of steel sheets used in automotive industry. Int. J. Automot. Technol. 2015, 16, 849–863. [Google Scholar] [CrossRef]
- Olsson, D.D.; Bay, N.; Andreasen, J.L. Direct Friction Measurement in Draw Bead Testing. In Proceedings of the 8th International Conference on Technology of Plasticity, Verona, Italy, 9–13 October 2005. [Google Scholar]
- Trzepieciński, T.; Lemu, H.G. Effect of computational parameters on springback prediction by numerical simulation. Metals 2017, 7, 380. [Google Scholar] [CrossRef] [Green Version]
- Zhang, R.; Shao, Z.; Lin, J. A review on modelling techniques for formability prediction of sheet metal forming. Int. J. Lightweight Mater. Manuf. 2018, 1, 115–125. [Google Scholar] [CrossRef]
- Figueiredo, L.; Ramalho, A.; Oliveira, M.C.; Menezes, L.F. Experimental study of friction in sheet metal forming. Wear 2011, 271, 1651–1657. [Google Scholar] [CrossRef]
- Wang, C.; Ma, R.; Zhao, J.; Zhao, J. Calculation method and experimental study of coulomb friction coefficient in sheet metal forming. J. Manuf. Process. 2017, 27, 126–137. [Google Scholar] [CrossRef]
- Trzepieciński, T.; Gelgele, H.L. Investigation of anisotropy problems in sheet metal forming using finite element method. Int. J. Mater. Form. 2011, 4, 357–369. [Google Scholar] [CrossRef]
- Dou, S.; Xia, J. Analysis of sheet metal forming (stamping process): A study of the variable friction coefficient on 5052 aluminium alloy. Metals 2019, 9, 853. [Google Scholar] [CrossRef] [Green Version]
- Nine, H.D. Drawbead forces in sheet metal forming. In Mechanics of Sheet Metal Forming, 1st ed.; Koistinen, D.P., Wang, N.M., Eds.; Springer: Boston, MA, USA, 1978; pp. 179–211. [Google Scholar]
- Jadhav, S.; Schoiswoh, M.; Buchmayr, B. Tribology test methods and simulations of the effect of friction on the formability of automotive steel sheets. Metall. Ital. 2018, 9, 56–63. [Google Scholar]
- Sigvant, M.; Pilthammar, J.; Hol, J.; Wiebenga, J.H.; Chezan, T.; Carleer, B.; van den Boogard, T. Friction in sheet metal forming: Influence of surface roughness and strain rate on sheet metal forming simulation results. Procedia Manuf. 2019, 29, 512–519. [Google Scholar] [CrossRef]
- Recklin, V.; Dietrich, F.; Groche, P. Influence of test stand and contact size sensitivity on the friction coefficient in sheet metal forming. Lubricants 2018, 6, 41. [Google Scholar] [CrossRef] [Green Version]
- Li, G.; Long, X.; Yang, P.; Liang, Z. Advance on friction of stamping forming. Int. J. Adv. Manuf. Technol. 2018, 96, 21–38. [Google Scholar] [CrossRef]
- Murali, A.; Gopal, B.; Rajadurai, C. Analysis of influence od draw bead location and profile in hemispherical cup forming. Int. J. Eng. Technol. 2010, 2, 356–360. [Google Scholar] [CrossRef] [Green Version]
- Wang, Z.; Zhang, Q.; Liu, Y.; Zhang, Z. A robust and accurate geometric model for automated design of drawbeads in sheet metal forming. Comput. Aided Des. 2017, 92, 42–57. [Google Scholar] [CrossRef]
- Larsson, M. Computational characterization of drawbeads: A basic modeling method for data generation. J. Mater. Process. Technol. 2009, 209, 376–386. [Google Scholar] [CrossRef]
- Lee, M.G.; Chung, K.; Wagoner, R.H.; Keum, Y.T. A numerical method for rapid estimation of drawbead restraining force based on non-linear, anisotropic constitutive equations. Int. J. Solids Struct. 2008, 45, 3375–3391. [Google Scholar] [CrossRef] [Green Version]
- Xie, Y. Geometric parameter inverse model for drawbeads based on grey relational analysis and GA-BP. AIP Conf. Proc. 2013, 1567, 1044–1047. [Google Scholar]
- Zhang, Q.; Liu, Y.; Zhang, Z. A new method for automatic optimization of drawbead geometry in the sheet metal forming process based on an iterative learning control mode. Int. J. Adv. Manuf. Technol. 2017, 88, 1845–1861. [Google Scholar] [CrossRef]
- Halkaci, H.S.; Turkoz, M.; Dilmec, M. Enhancing formability in hydromechanical deep drawing process adding a shallow drawbead to the blank holder. J. Mater. Process. Technol. 2014, 214, 1638–1646. [Google Scholar] [CrossRef]
- Bassoli, E.; Sola, A.; Denti, L.; Gatto, A. Experimental approach to measure the restraining force in deep drawing by means of a versatile draw bead simulator. Mater. Manuf. Process. 2019, 34, 1286–1295. [Google Scholar] [CrossRef]
- Nanayakkara, N.K.B.M.P.; Hodgson, P. Determination of drawbead contacts with variable bead penetration. Comput. Methods Mater. Sci. 2006, 6, 188–194. [Google Scholar]
- Alves, J.L.; Oliveira, M.C.; Menezes, L.F. Modeling Drawbeads in Deep Drawing Simulations. In III European Conference on Computational Mechanics; Motasoares, C.A., Ed.; Springer: Dordrecht, The Netherlands, 2006; p. 533. [Google Scholar]
- Duarte, E.N.; Oliveira, S.A.G.; Weyler, R.; Neamtu, L. A hybrid approach for estimating the drawbead restraining force in sheet metal forming. J. Braz. Soc. Mech. Sci. Eng. 2010, 32, 283–291. [Google Scholar] [CrossRef] [Green Version]
- Moon, S.J.; Lee, M.G.; Lee, S.H.; Keum, Y.T. Equivalent drawbead models for sheet forming simulation. Met. Mater. Int. 2010, 16, 595–603. [Google Scholar] [CrossRef]
- Joshi, Y.; Christiansen, P.; Masters, I.; Bay, N.O.; Dashwood, R. Numerical modelling of drawbeads for forming of aluminium alloys. J. Phys. Conf. Ser. 2016, 734, 032082. [Google Scholar] [CrossRef] [Green Version]
- Stoughton, T.B. Model of Drawbead Forces in Sheet Mmetal Forming. In Proceedings of the 15th International Deep Drawing Research Group, Dearbon, MI, USA, 16–18 May 1988; p. 205. [Google Scholar]
- Bramhakshatriya, G.M.; Sharma, S.K.; Patel, B.C. Analysis on Effect of Die Fillet Radius and Draw Bead on Hemispherical Cup Forming. In Proceedings of the 2012 Students Conference on Engineering and Systems, Allahabad, Uttar Pradesh, India, 16–18 March 2012; pp. 1–6. [Google Scholar]
- Trzepieciński, T. 3D elasto-plastic FEM analysis of the sheet drawing of anisotropic steel sheet. Arch. Civ. Mech. Eng. 2010, 10, 95–106. [Google Scholar] [CrossRef]
- Tisza, M.; Lukács, Z.; Kovács, P.; Budai, D. Some recent developments in sheet metal forming for production of lighteight automotive parts. J. Phys. Conf. Ser. 2017, 896, 012087. [Google Scholar] [CrossRef]
- EN 10130 2009. Cold Rolled Low Carbon Steel Flat Products for Cold Forming—Technical Delivery Conditions; European Committee for Standardization: Brussels, Belgium, 2009. [Google Scholar]
- ISO 6892-1:2016. Metallic Materials—Tensile Testing—Part 1: Method of Test at Room Temperature; International Organization for Standardization: Geneva, Switzerland, 2016. [Google Scholar]
- Nanayakkara, N.K.; Kelly, G.L.; Hodgson, P.D. Determination of the coefficient of friction in partially penetrated draw beads. Steel Gr. 2004, 2, 677–680. [Google Scholar]
- Meinders, V.T. Developments in Numerical Simulations of the Real-Life Deep Drawing Process. Ph.D. Thesis, University of Twenty, Enschede, Holland, 11 February 2000. [Google Scholar]
- Von-Mises, R. Mechanik der festen Körper im plastisch—Deformablen Zustand. Nachrichten von der Gesellschaft der Wissenschaften zu Göttingen. Mathematisch. Physikalische Klasse 1913, 1913, 582–592. [Google Scholar]
- Marc® Volume B: Element Library; MSC Software Corporation: Santa Ana, CA, USA, 2010.
- Fejkiel, R. An Analysis of Frictional Resistance during Sheet Metal Passing Through the Draw Bead in the Sheet Metal Forming Process. Ph.D. Thesis, Rzeszow University of Technology, Rzeszów, Poland, 4 July 2019. [Google Scholar]
Figure 1.
Cross-section of a typical drawbead with circular form.

Figure 2.
Cross-section of a typical drawbead with circular form: 1—frame, 2—upper tension member, 3—specimen, 4—working rollers, 5—support roller, 6 and 7—load cells, 8—horizontal tension member, 9—pin, 10—wing nut.
Figure 2.
Cross-section of a typical drawbead with circular form: 1—frame, 2—upper tension member, 3—specimen, 4—working rollers, 5—support roller, 6 and 7—load cells, 8—horizontal tension member, 9—pin, 10—wing nut.

Figure 3.
The concept behind the determination of frictional resistance: (a) rotatable rollers, (b) fixed rollers.
Figure 3.
The concept behind the determination of frictional resistance: (a) rotatable rollers, (b) fixed rollers.

Figure 4.
Parameters of a drawbead: c—clearance, h—drawbead height, g—sheet thickness, α—quarter contact angle of actual engagement of the strip over the middle roller.
Figure 4.
Parameters of a drawbead: c—clearance, h—drawbead height, g—sheet thickness, α—quarter contact angle of actual engagement of the strip over the middle roller.

Figure 5.
Geometry and boundary conditions of the Finite Element Method (FEM) model of the drawbead simulator: (a) first and (b) second stage of simulation.
Figure 5.
Geometry and boundary conditions of the Finite Element Method (FEM) model of the drawbead simulator: (a) first and (b) second stage of simulation.
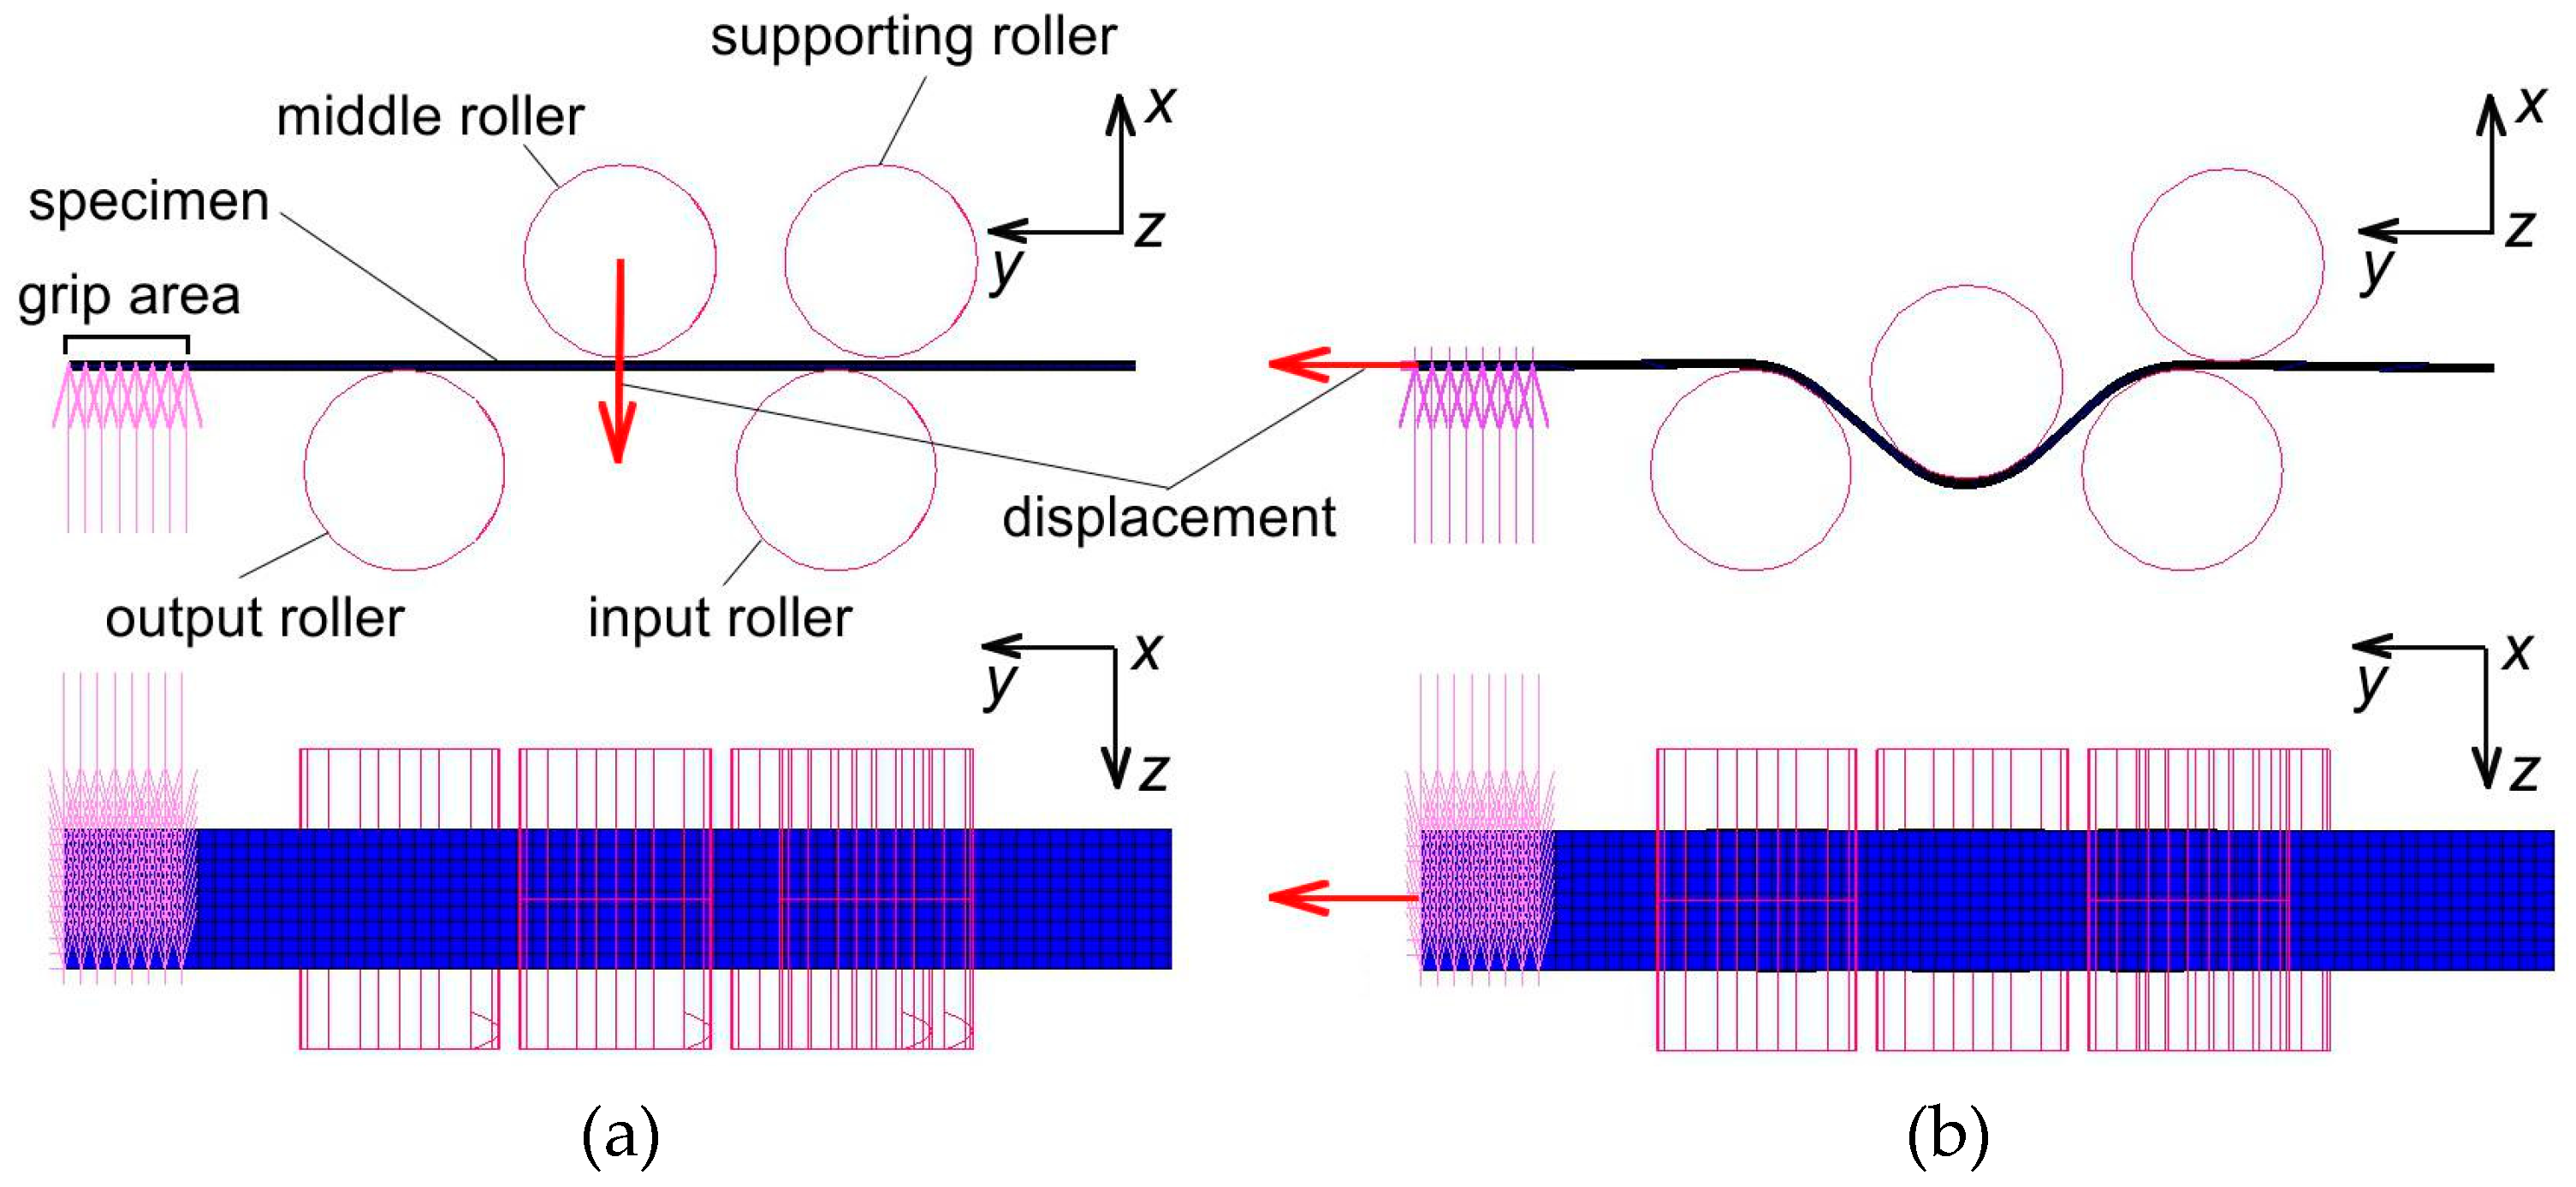
Figure 6.
Experimentally determined variation of the coefficient of friction during a drawbead test.
Figure 6.
Experimentally determined variation of the coefficient of friction during a drawbead test.

Figure 7.
Experimentally determined variation of the COF during a DBS test for height of drawbead h = 18 mm and specimen width w = 20 mm.
Figure 7.
Experimentally determined variation of the COF during a DBS test for height of drawbead h = 18 mm and specimen width w = 20 mm.

Figure 8.
View of the mesh in the mesh sensitivity analysis (MSA).

Figure 9.
Distribution of von Mises equivalent plastic strain in the specimen discretised with elements with a size of se = 3.334 mm.
Figure 9.
Distribution of von Mises equivalent plastic strain in the specimen discretised with elements with a size of se = 3.334 mm.
Figure 10.
Numerically predicted variation of the drawing and normal force for a specimen pulled to flow by a system of (a) rotatable and (b) fixed rollers for height of drawbead h = 12 mm and specimen width w = 20 mm.
Figure 10.
Numerically predicted variation of the drawing and normal force for a specimen pulled to flow by a system of (a) rotatable and (b) fixed rollers for height of drawbead h = 12 mm and specimen width w = 20 mm.
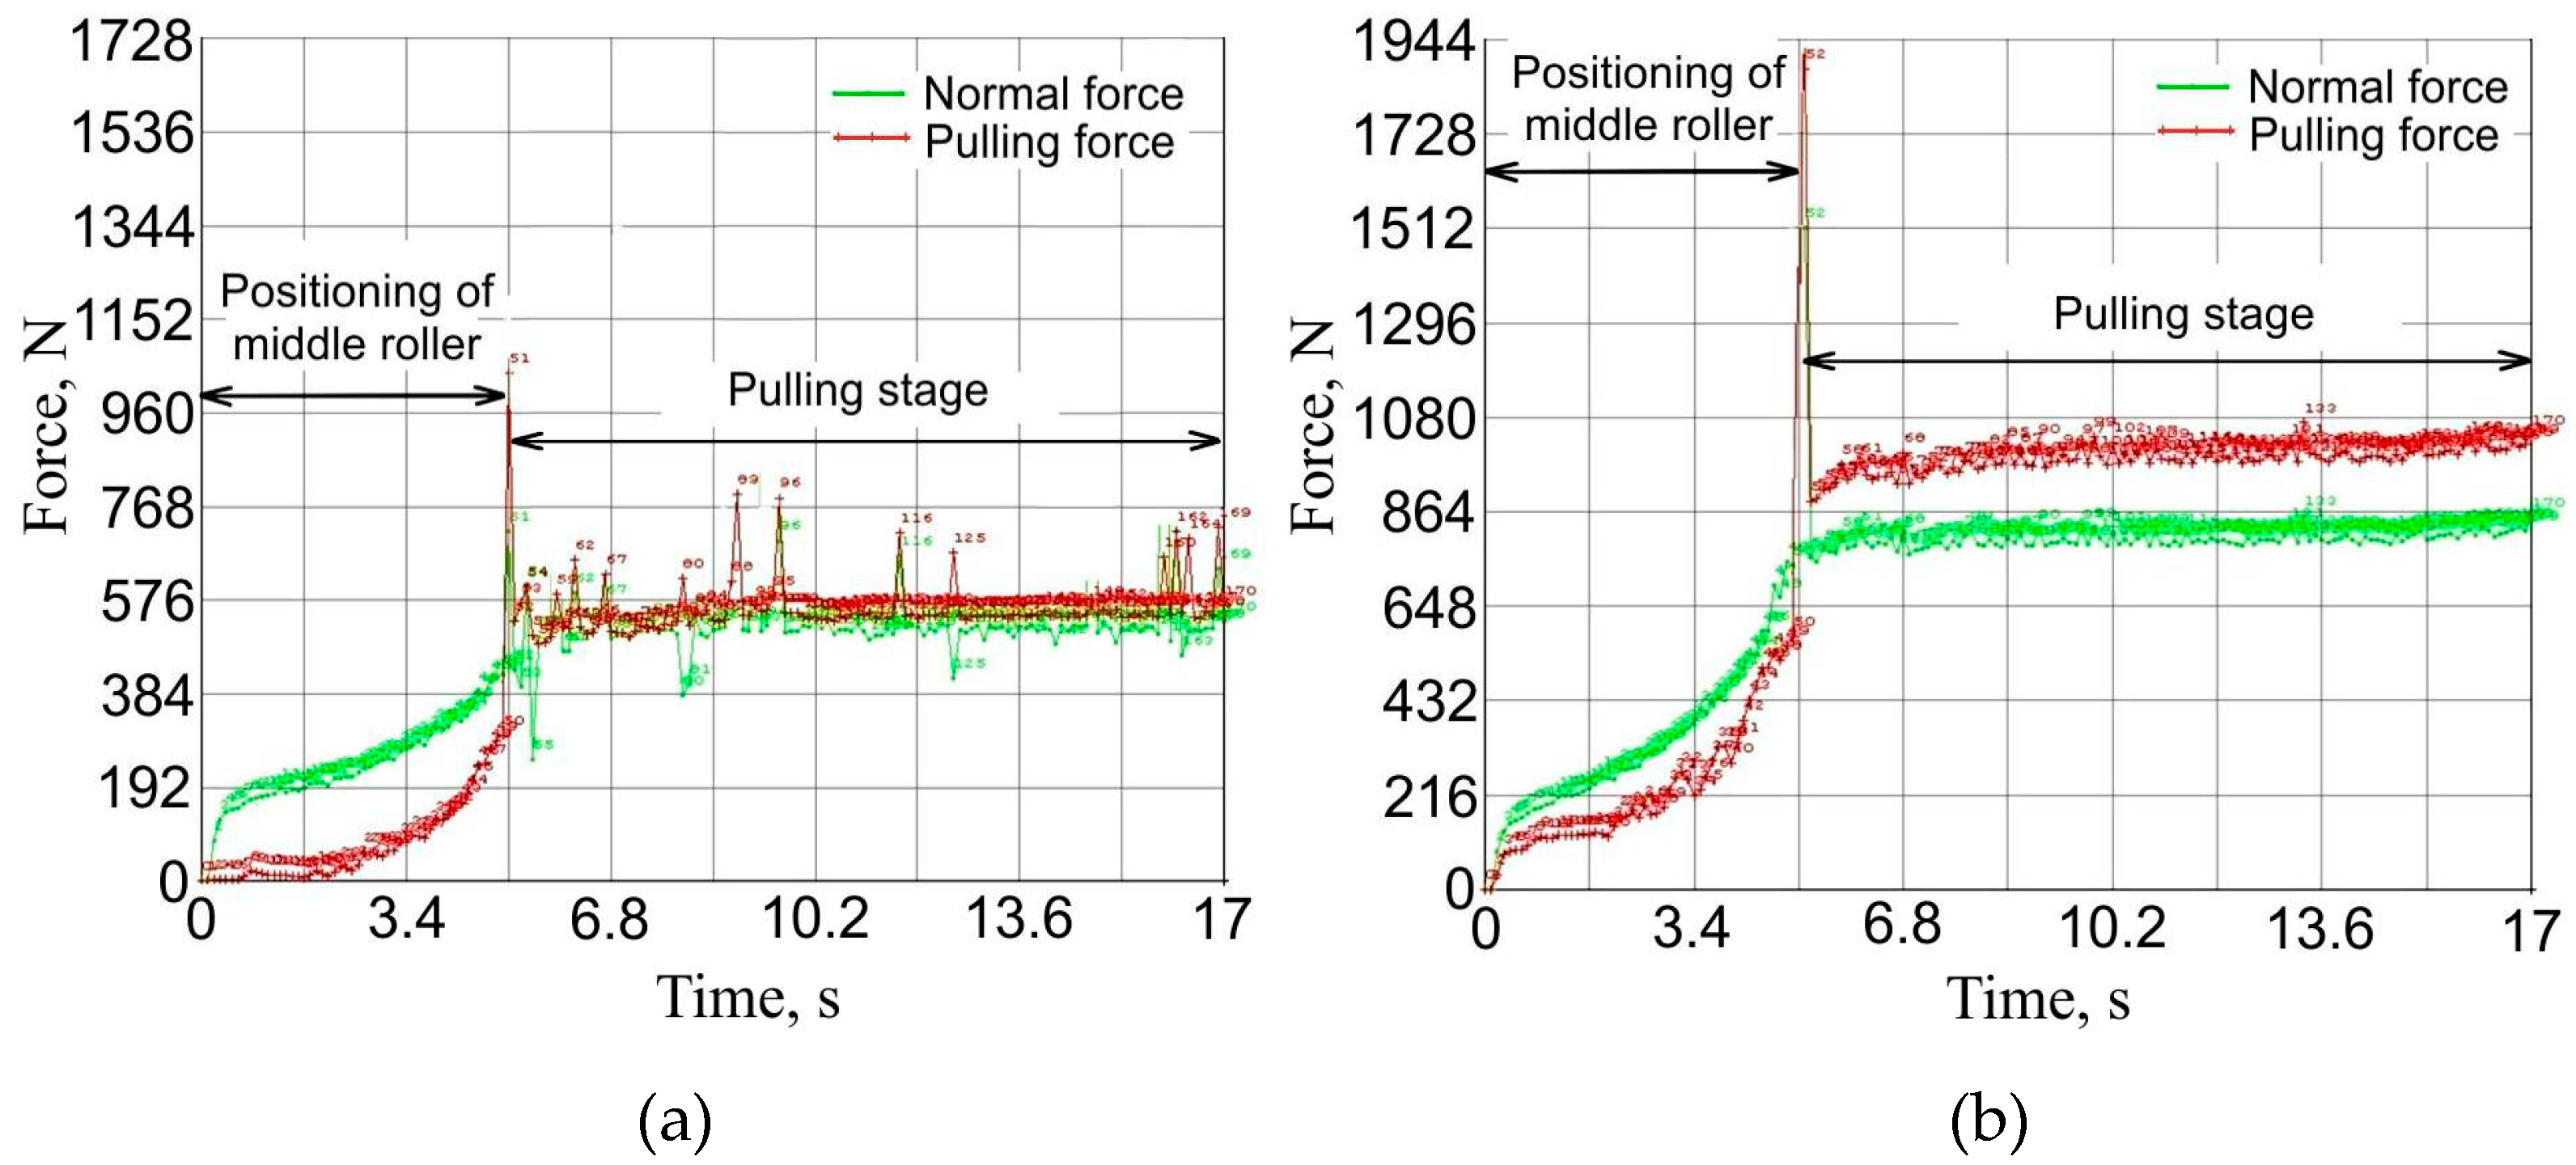
Figure 11.
Numerically predicted variation of the COF for height of drawbead h = 18 mm and different specimen widths: (a) 20 mm, (b) 14 mm and (c) 7 mm.
Figure 11.
Numerically predicted variation of the COF for height of drawbead h = 18 mm and different specimen widths: (a) 20 mm, (b) 14 mm and (c) 7 mm.

Figure 12.
Comparison of average values of COF determined experimentally and based on FEM for drawbead heights of (a) h = 12 mm and (b) h = 18 mm.
Figure 12.
Comparison of average values of COF determined experimentally and based on FEM for drawbead heights of (a) h = 12 mm and (b) h = 18 mm.

Figure 13.
The character of the specimen deformation around the working rollers (a) for the drawbead height of h = 18 mm, and specimen width w = 20 mm for (b) the friction and (c) frictionless conditions.
Figure 13.
The character of the specimen deformation around the working rollers (a) for the drawbead height of h = 18 mm, and specimen width w = 20 mm for (b) the friction and (c) frictionless conditions.

Figure 14.
Distribution of normal stress in the specimen material for a specimen width w = 20 mm, and drawbead height of h = 18 mm under (a) friction and (b) frictionless conditions.
Figure 14.
Distribution of normal stress in the specimen material for a specimen width w = 20 mm, and drawbead height of h = 18 mm under (a) friction and (b) frictionless conditions.

Figure 15.
Paths of measuring the equivalent plastic strain on (a) the internal and (b) external surfaces of specimen: sp and kp—start points, sk and kk—end points.
Figure 15.
Paths of measuring the equivalent plastic strain on (a) the internal and (b) external surfaces of specimen: sp and kp—start points, sk and kk—end points.

Figure 16.
Distribution of EPS on (a) the internal and (b) external surface of specimen.

Table 1.
Chemical composition of DC04 steel sheet (in wt.%).
| C | Mn | P | S | Fe |
|---|---|---|---|---|
| ≤0.08 | ≤0.4 | ≤0.03 | ≤0.03 | remainder |
Table 2.
Selected mechanical properties of DC04 steel sheet.
| Specimen Orientation | Yield Stress Rp0.2 (MPa) | Ultimate Tensile Stress Rm (MPa) | Elongation A50 (%) | Strengthening Coefficient K (MPa) | Strain Hardening Exponent n |
|---|---|---|---|---|---|
| 0° | 179 | 311 | 22 | 471 | 0.19 |
| 45° | 189 | 305 | 21 | 488 | 0.19 |
| 90° | 183 | 289 | 23 | 479 | 0.17 |
Table 3.
Experimentally determined values of coefficient of friction.
| Drawbead Height h, mm | Specimen Width w, mm | COF |
|---|---|---|
| 12 | 7 | 0.202 |
| 14 | 0.205 | |
| 20 | 0.221 | |
| 18 | 7 | 0.176 |
| 14 | 0.191 | |
| 20 | 0.206 |
Table 4.
Parameters and results of MSA.
| Element Size se × se mm2 | Number of Elements | Number of Nodes | Average Drawing Force, N | Computation Time, s |
|---|---|---|---|---|
| 3.334 × 3.334 | 1620 | 2695 | - | 1240 |
| 1.667 × 1.667 | 6480 | 8502 | 1041.6 | 6115 |
| 0.833 × 0.833 | 35,920 | 32,550 | 1050.1 | 56,829 |
| 0.417 × 0.417 | 103,680 | 127,302 | 1061.0 | 381,197 |
© 2019 by the authors. Licensee MDPI, Basel, Switzerland. This article is an open access article distributed under the terms and conditions of the Creative Commons Attribution (CC BY) license (http://creativecommons.org/licenses/by/4.0/).
Share and Cite
MDPI and ACS Style
Trzepiecinski, T.; Fejkiel, R. A 3D FEM-Based Numerical Analysis of the Sheet Metal Strip Flowing Through Drawbead Simulator. Metals 2020, 10, 45. https://doi.org/10.3390/met10010045
AMA Style
Trzepiecinski T, Fejkiel R. A 3D FEM-Based Numerical Analysis of the Sheet Metal Strip Flowing Through Drawbead Simulator. Metals. 2020; 10(1):45. https://doi.org/10.3390/met10010045
Chicago/Turabian StyleTrzepiecinski, Tomasz, and Romuald Fejkiel. 2020. "A 3D FEM-Based Numerical Analysis of the Sheet Metal Strip Flowing Through Drawbead Simulator" Metals 10, no. 1: 45. https://doi.org/10.3390/met10010045
Note that from the first issue of 2016, this journal uses article numbers instead of page numbers. See further details here.