A Study of the Coefficient of Friction in Steel Sheets Forming


Department of Materials Forming and Processing, Rzeszow University of Technology, al. Powst. Warszawy 8, 35-959 Rzeszów, Poland
Metals 2019, 9(9), 988; https://doi.org/10.3390/met9090988
Submission received: 22 August 2019
/
Revised: 3 September 2019
/
Accepted: 4 September 2019
/
Published: 6 September 2019
(This article belongs to the Special Issue Forming Processes of Modern Metallic Materials)
Abstract
:The aim of this paper was to compare the tribological properties of a deep drawing quality steel sheet using the three commonly used friction tests, i.e., the strip drawing test, draw bead test, and bending under tension test. All tests have been carried out using a specially designed friction simulator. The test material was a 0.8-mm-thick DC04 steel sheet, commonly used in the automotive industry. Uniaxial tensile tests have been carried out to characterise the mechanical properties of the specimens. Furthermore, measurements of the sheet surface topography have been carried out to characterise the tribological properties of the specimens. The friction tests have been conducted under different pressure and lubrication conditions, surface roughnesses of tools represented by counter-samples, and orientations of the specimens according to the direction of the sheet rolling. A comparative analysis of the results of the friction tests revealed different values of friction. In the strip drawing test, the value of the coefficient of friction decreases as the contact pressure increases for both dry and lubricated conditions. In the draw bead test, the specimens oriented along the rolling direction demonstrated a higher value of the coefficient of friction compared to the samples cut transverse to the rolling direction. In contrast to the strip drawing test, the specimens tested in the bending under tension test exhibit a tendency to an increase in the value of the coefficient of friction with the increasing contact pressure.
1. Introduction
One of the most important technological phenomena, which largely influences the flow characteristics of a deformed material, is friction. The amount of friction generated in metal forming is mainly determined by the shear strength of the friction connections [1]. The type of friction joint created mainly depends on the materials of the friction pair and the surface roughness of the bodies in contact. Friction depends on several parameters and phenomena such as lubrication, normal pressure, surface roughness of the tool and sheet, sliding speed, materials of the contact pair, and temperature [2]. Under warm and hot forming conditions the coefficient of friction is usually higher than in the cold forming due to the increased adhesion between the bodies in contact. Under lubricated conditions, it is known [3,4] that friction changes as the material plastically deforms and surface roughness increases, causing a transition from a hydrodynamic to a mixed friction regime where the metal to metal contact is increased.
In sheet metal forming, the value of the drawing force, friction conditions occurring in the various areas of the workpiece and the temperature are changing. The non-uniformity of the deformation of the drawpiece is mainly determined by the occurrence of friction forces at the interface of the deformed material and the tool. Many factors affect the contact phenomena: The amount of normal pressure, material grade, topography both of the sheet and tool surfaces, type of lubricant, and temperature [5]. The unfavourable effects of friction include [6,7]: Non-uniformity in the workpiece deformation, increase of the surface roughness of the workpiece, and the intensification of the tool wear. The advantageous effect of the friction between the workpiece and punch on the stamping process is the increasing of the maximum allowable drawing force. Moreover, Menezes et al. [8] concluded that the variations in the coefficient of friction between the tool surfaces and the workpiece directly affect the stress distribution and shape of the workpiece, having implications on the microstructure of the material being processed.
To represent the friction phenomena in sheet metal forming, simulation tests have been developed. The friction tests the simulating friction and lubrication conditions in sheet metal forming can be divided into tests that simulate processes and tests which simulate tribological conditions. These tests simulate friction conditions in the specific contact areas between the sheet and tools. The coefficient of friction is calculated based on the assumed friction model. Experimental tests of the friction coefficient value only allow the determination of friction in selected areas of the drawpiece, which leads to the need to use multiple friction tests. In addition to many simulation tests used in the industry, numerical methods have been used to study the interactions in the sheet-tool interface [9,10,11].
Knowledge of the friction is necessary to prepare an appropriate design of the die tool and to forecast the material flow during the forming of drawpieces, especially those with complex shapes. This provides a good justification for work on the proper planning of friction tests using the right simulator. In this paper, there are three typical friction tests: The strip drawing test, bending under tension test, and draw bead test were used to characterise the friction phenomena of the DC04 steel sheet tested under dry friction and lubricated conditions.
2. Material and Methods
2.1. Material
Friction tests were performed on deep-drawing quality (DDQ) steel sheets with a thickness of 1 mm assigned to form complex-shaped drawpieces. The mechanical properties determined in a uniaxial tensile test (as given in Table 1) according to the EN ISO 6892-1: 2016 are the yield stress Rp0.2, ultimate strength Rm, strain hardening coefficient K, and strain hardening exponent n in the Hollomon equation. Three samples were tested for each orientation of the specimen: Along the rolling direction (0°) and transverse (90°) to the rolling direction (RD).
2.2. Surface Characterisation
Measurement of the surface roughness parameters was carried out using a Talysurf CCI Lite 3D optical profiler equipped with a Nikon 5x/0.13 lens. The height resolution was 0.01 nm and the sampling interval in two orthogonal directions was 3.2 μm. The values of basic surface roughness parameters are listed in Table 2.
2.3. Methods
2.3.1. Bending under Tension Test
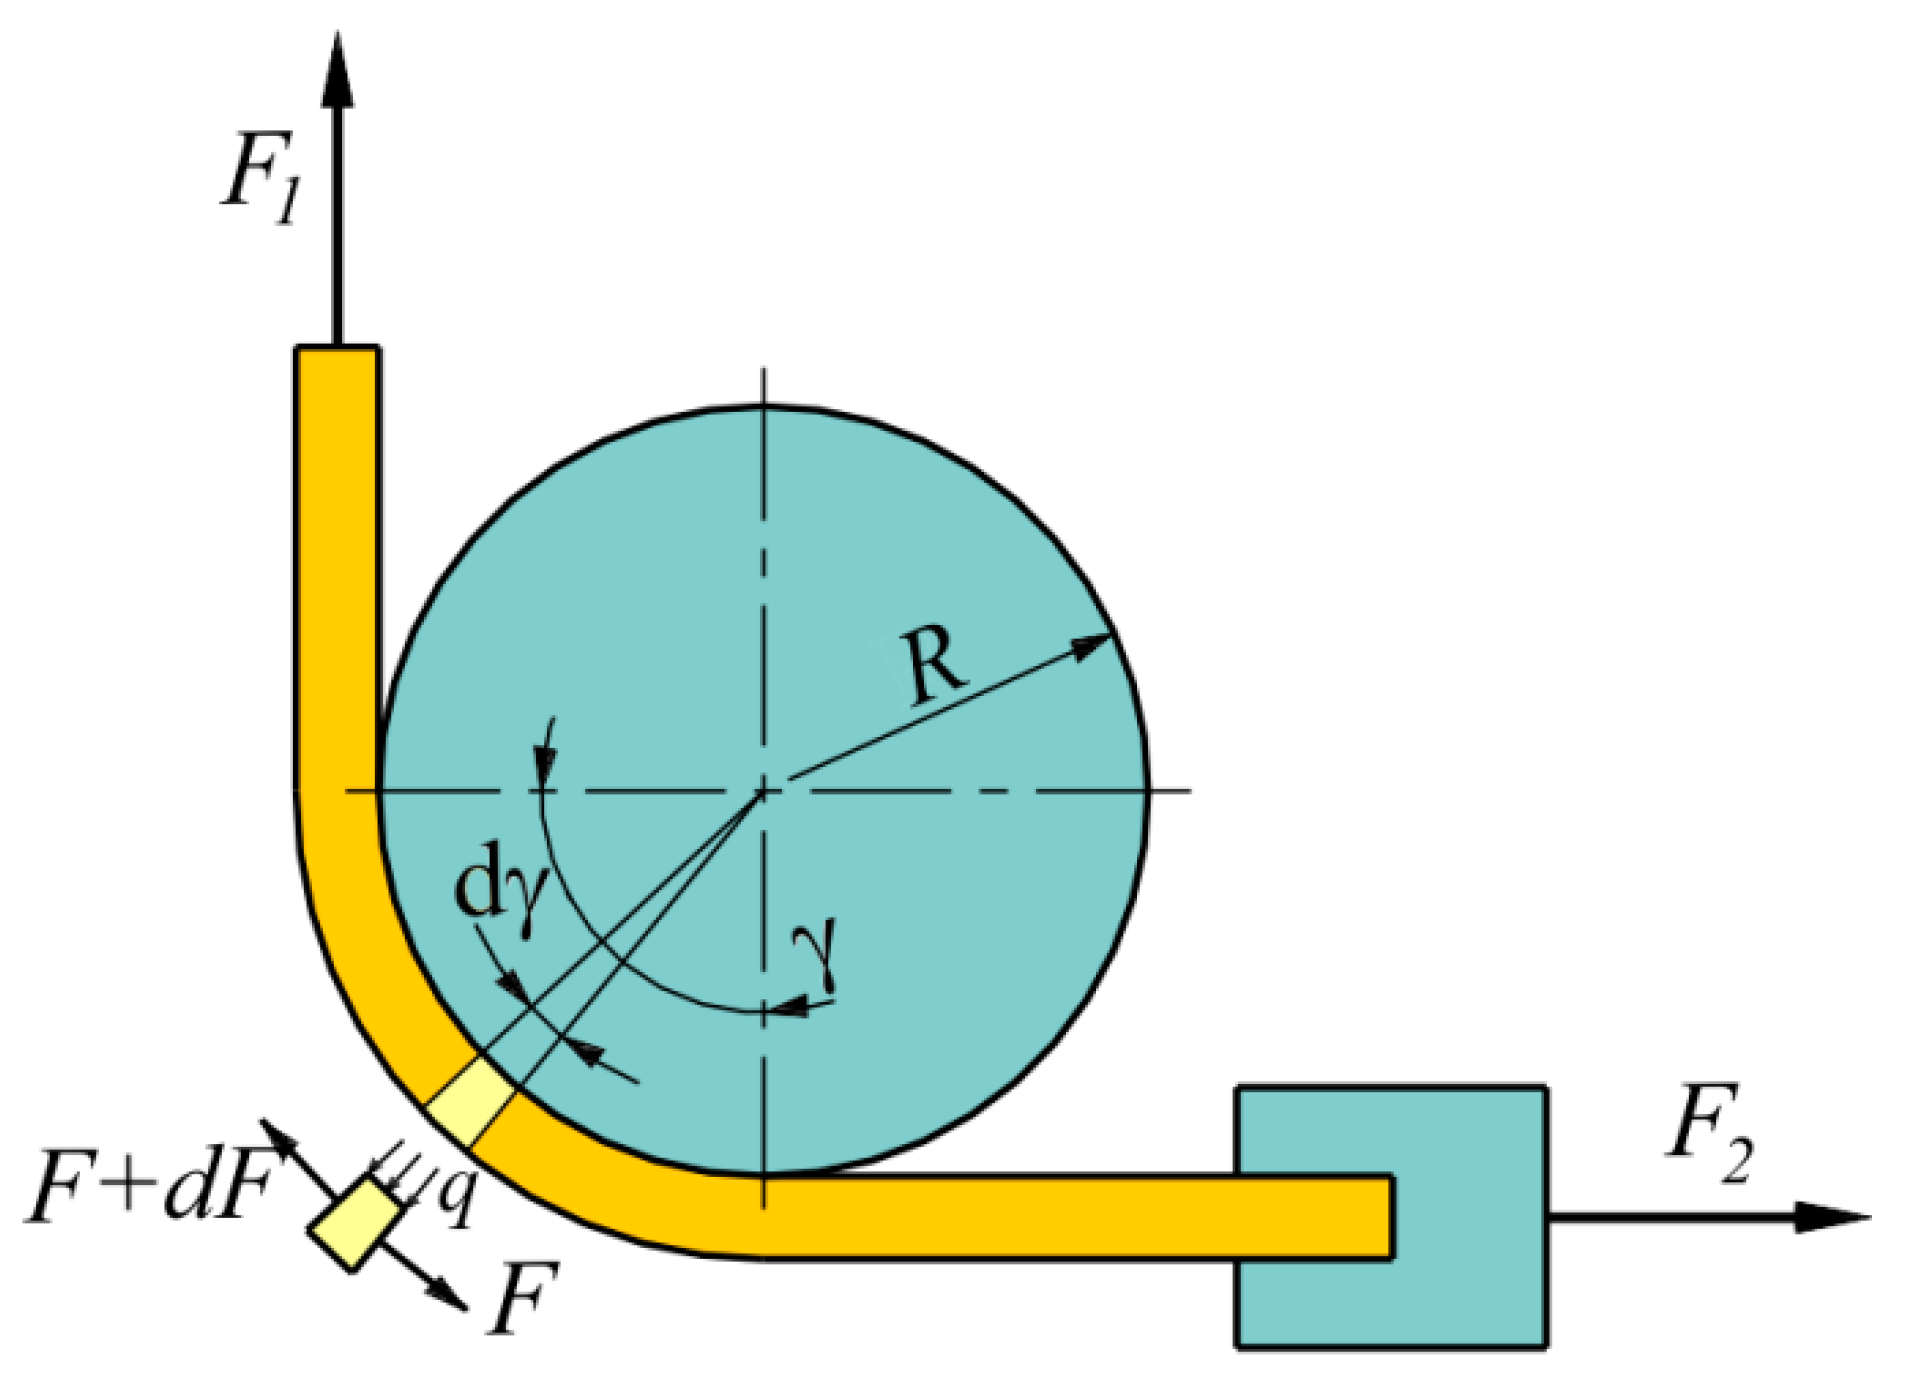
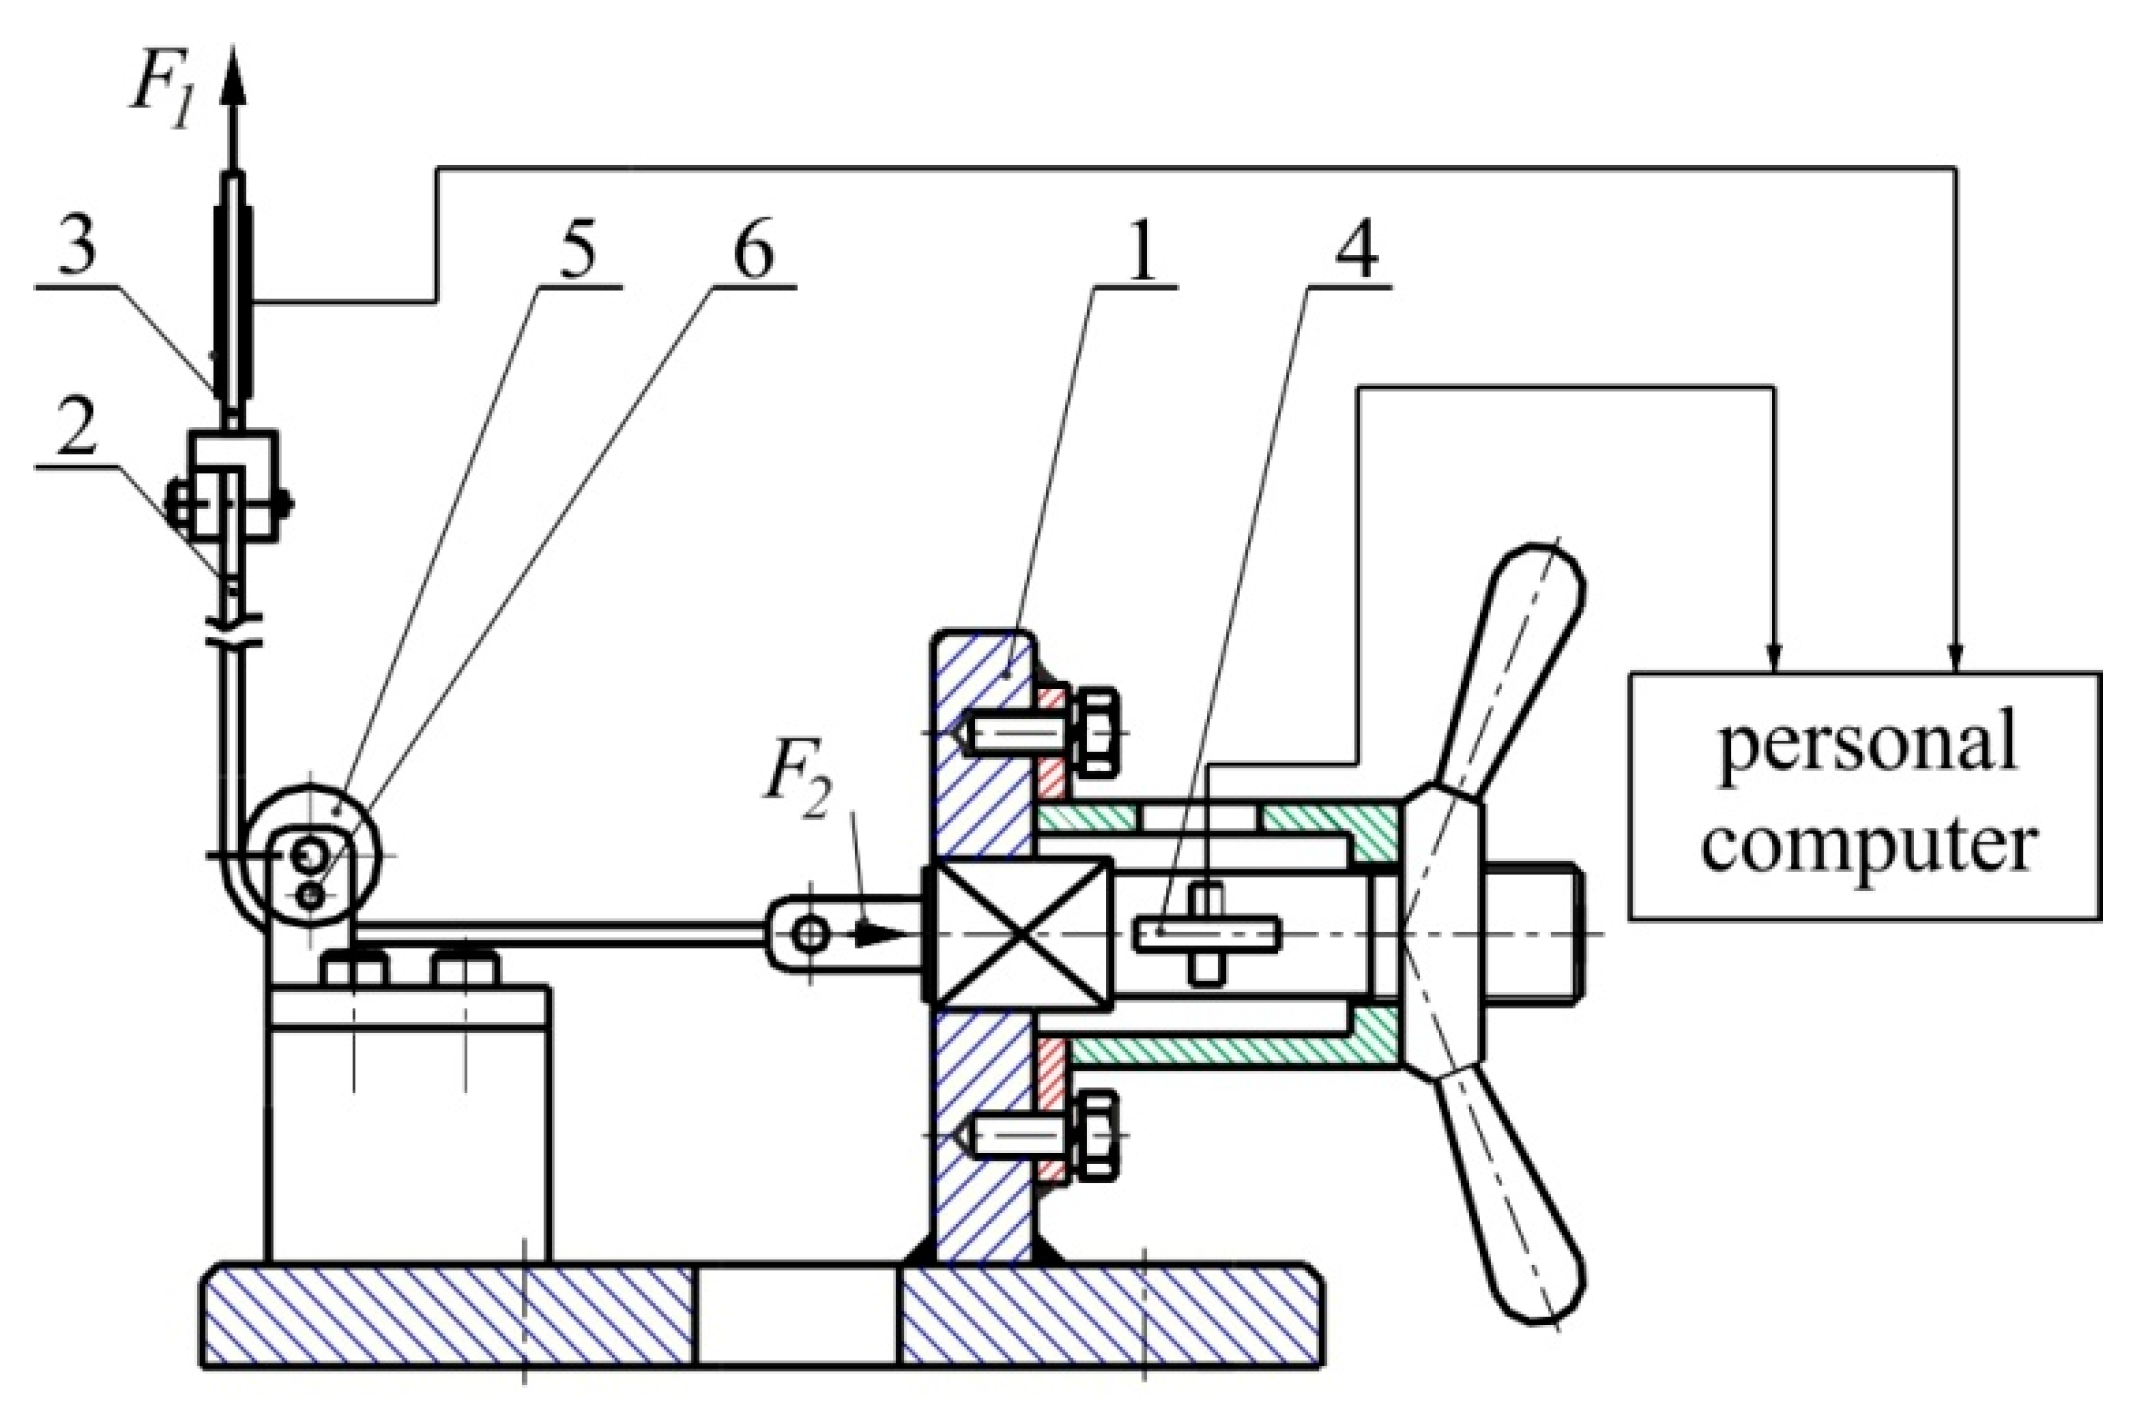
The bending under tension (BUT) test developed by Littlewood and Wallace [12] is attributed to the friction modeling on the edge of the die. The test consists of drawing the strip of metal around a cylindrical counter-sample (Figure 1). Figure 2 shows the configuration of the BUT test.
The BUT test allows one to not only determine the value of the coefficient of friction, but also its change during the process of stretching the specimen over the roller. This change may be related to the change of the sheet topography and increased normal pressure as a result of sheet deformation [13] and a change under the contact conditions related to the strain hardening phenomenon. The presence of friction between the roller and the sheet results in F1 > F2 (Figure 1). The tensile forces F1 and F2 are measured simultaneously during the test. Increasing the upper grip displacement increases the sample deformation until fracture. Assuming that the value of the coefficient of friction is the same for the entire contact surface and the wrap angle γ is constant during the deformation, the coefficient of friction can be determined from the equation:
In the present study, specimens for the BUT test were carefully prepared to assure a constant width of 10 mm.
2.3.2. Draw Bead Test
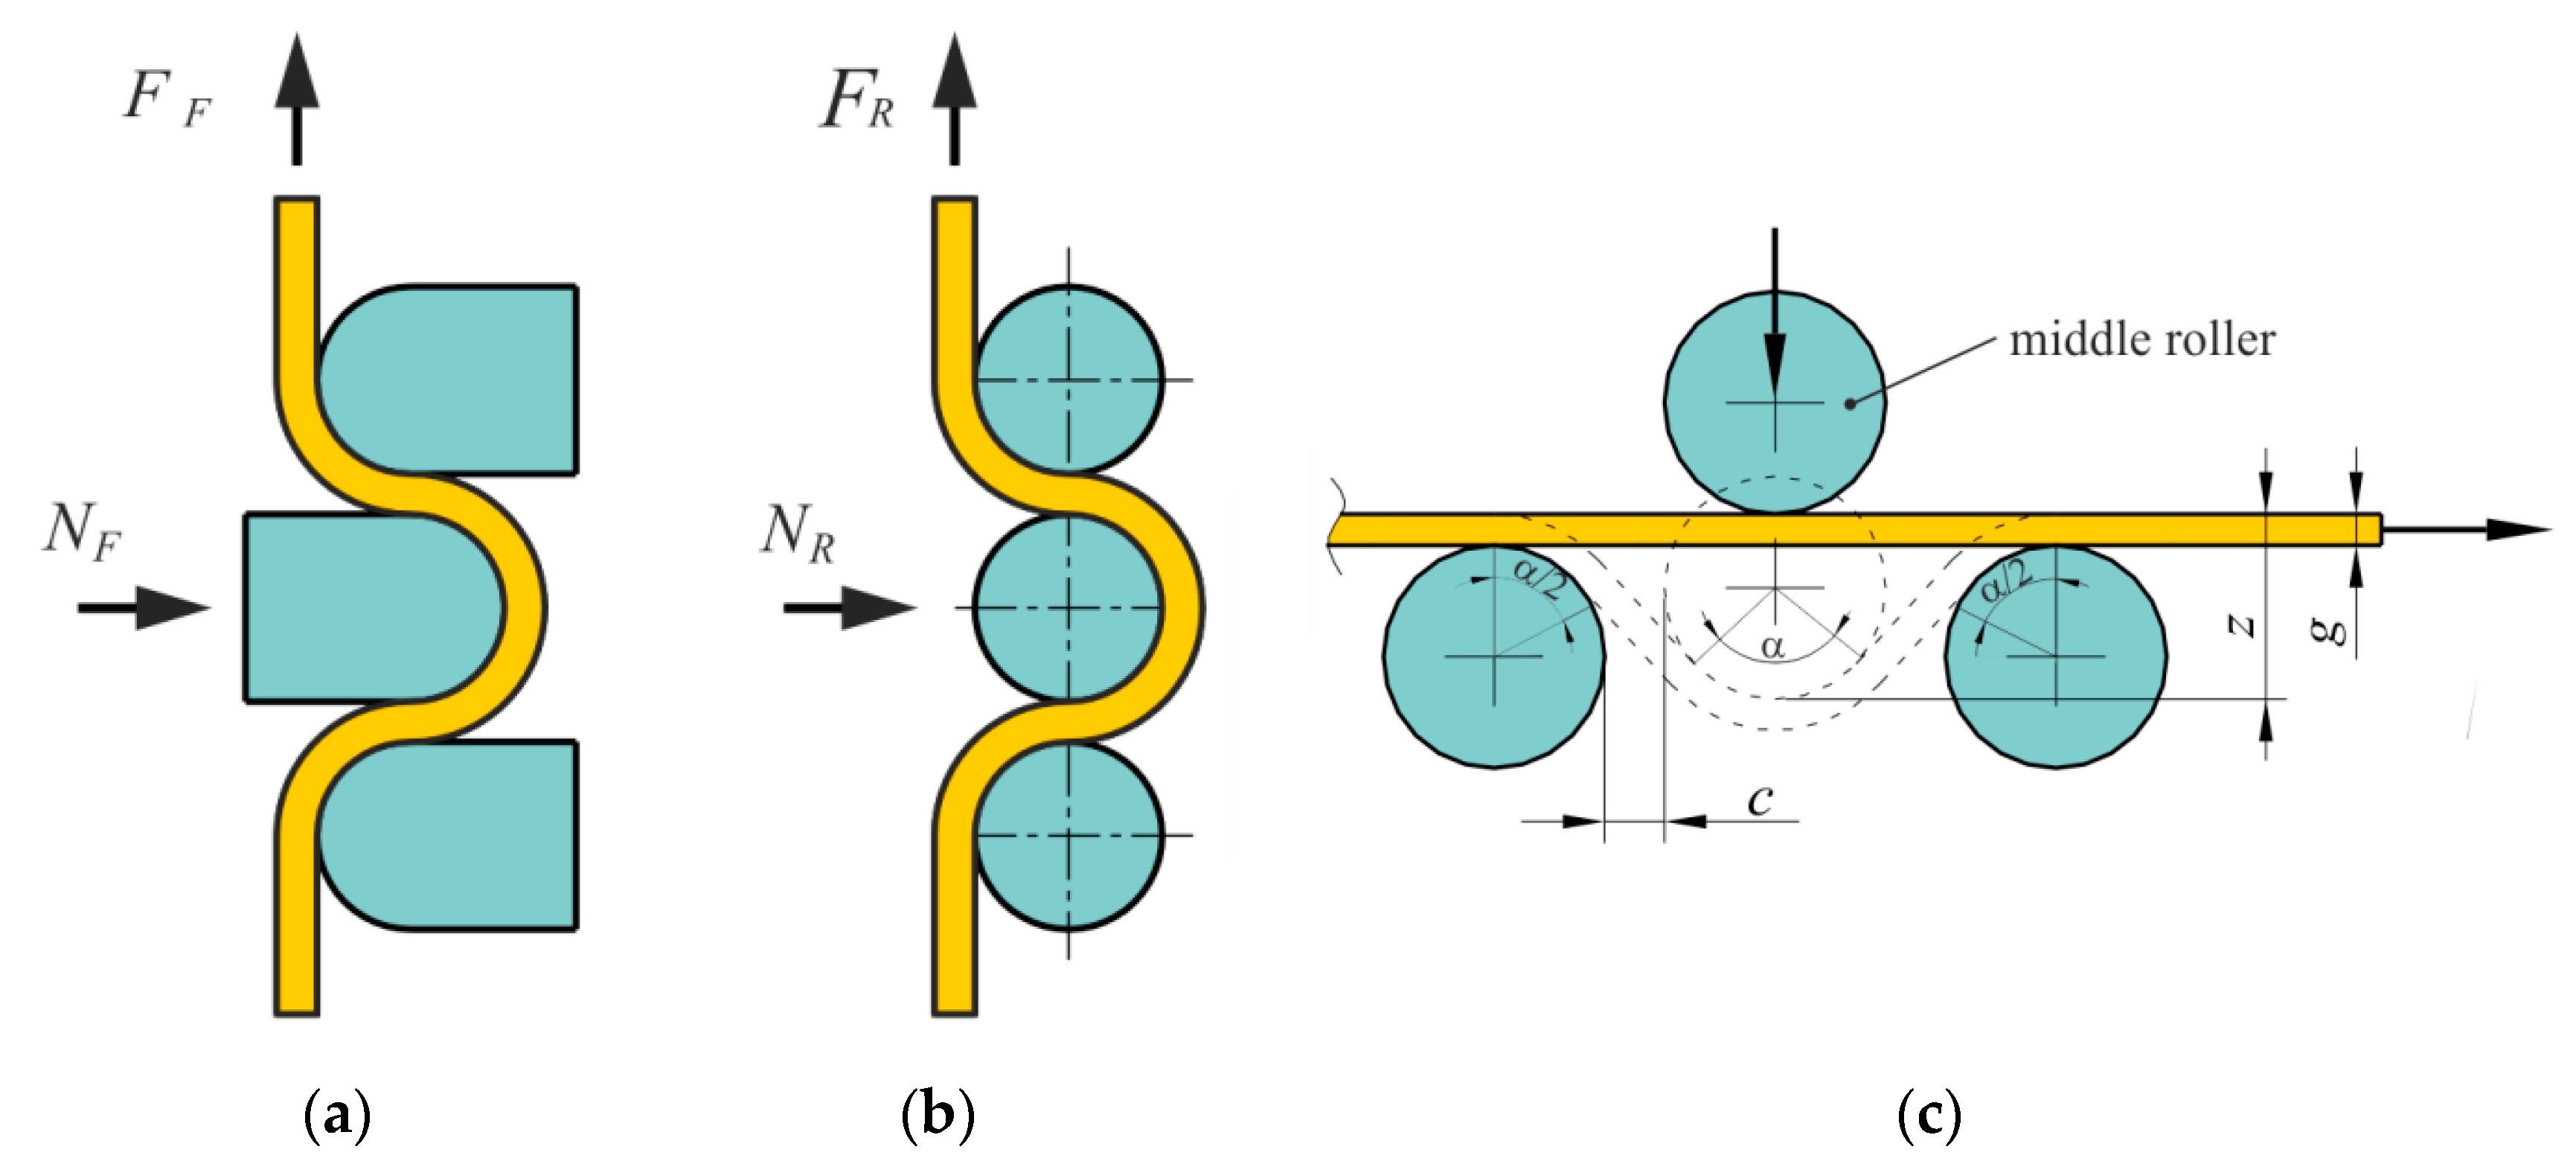
The draw bead test (DBT), according to the concept which was developed by Nine [14], is attributed to friction modelling at the draw bead in sheet metal forming. The curvature of the metallic sheet passing through the draw bead model (Figure 3) is changed several times, the sheet is alternately bent and straightened. The idea behind the method is to provide the ability to separate the deformation resistance of the sheet from the friction. In the DBT, the values of the pulling force and the clamping force are measured when pulling the strip over fixed and rotatable rollers (Figure 3). Drawing the sheet metal over a set of rotatable rolls allows one to minimise the resistance due to friction. The pulling force in this case may be connected with the deformation resistance of the sheet. The system of fixed rollers represents the total resistance of sheet drawing through the draw bead.
When the wrap angle α (Figure 3c) is not equal to 180° the value of the coefficient of friction is determined from the equation [15]:
where α is the quarter contact angle of the actual engagement of the strip over the middle roll.
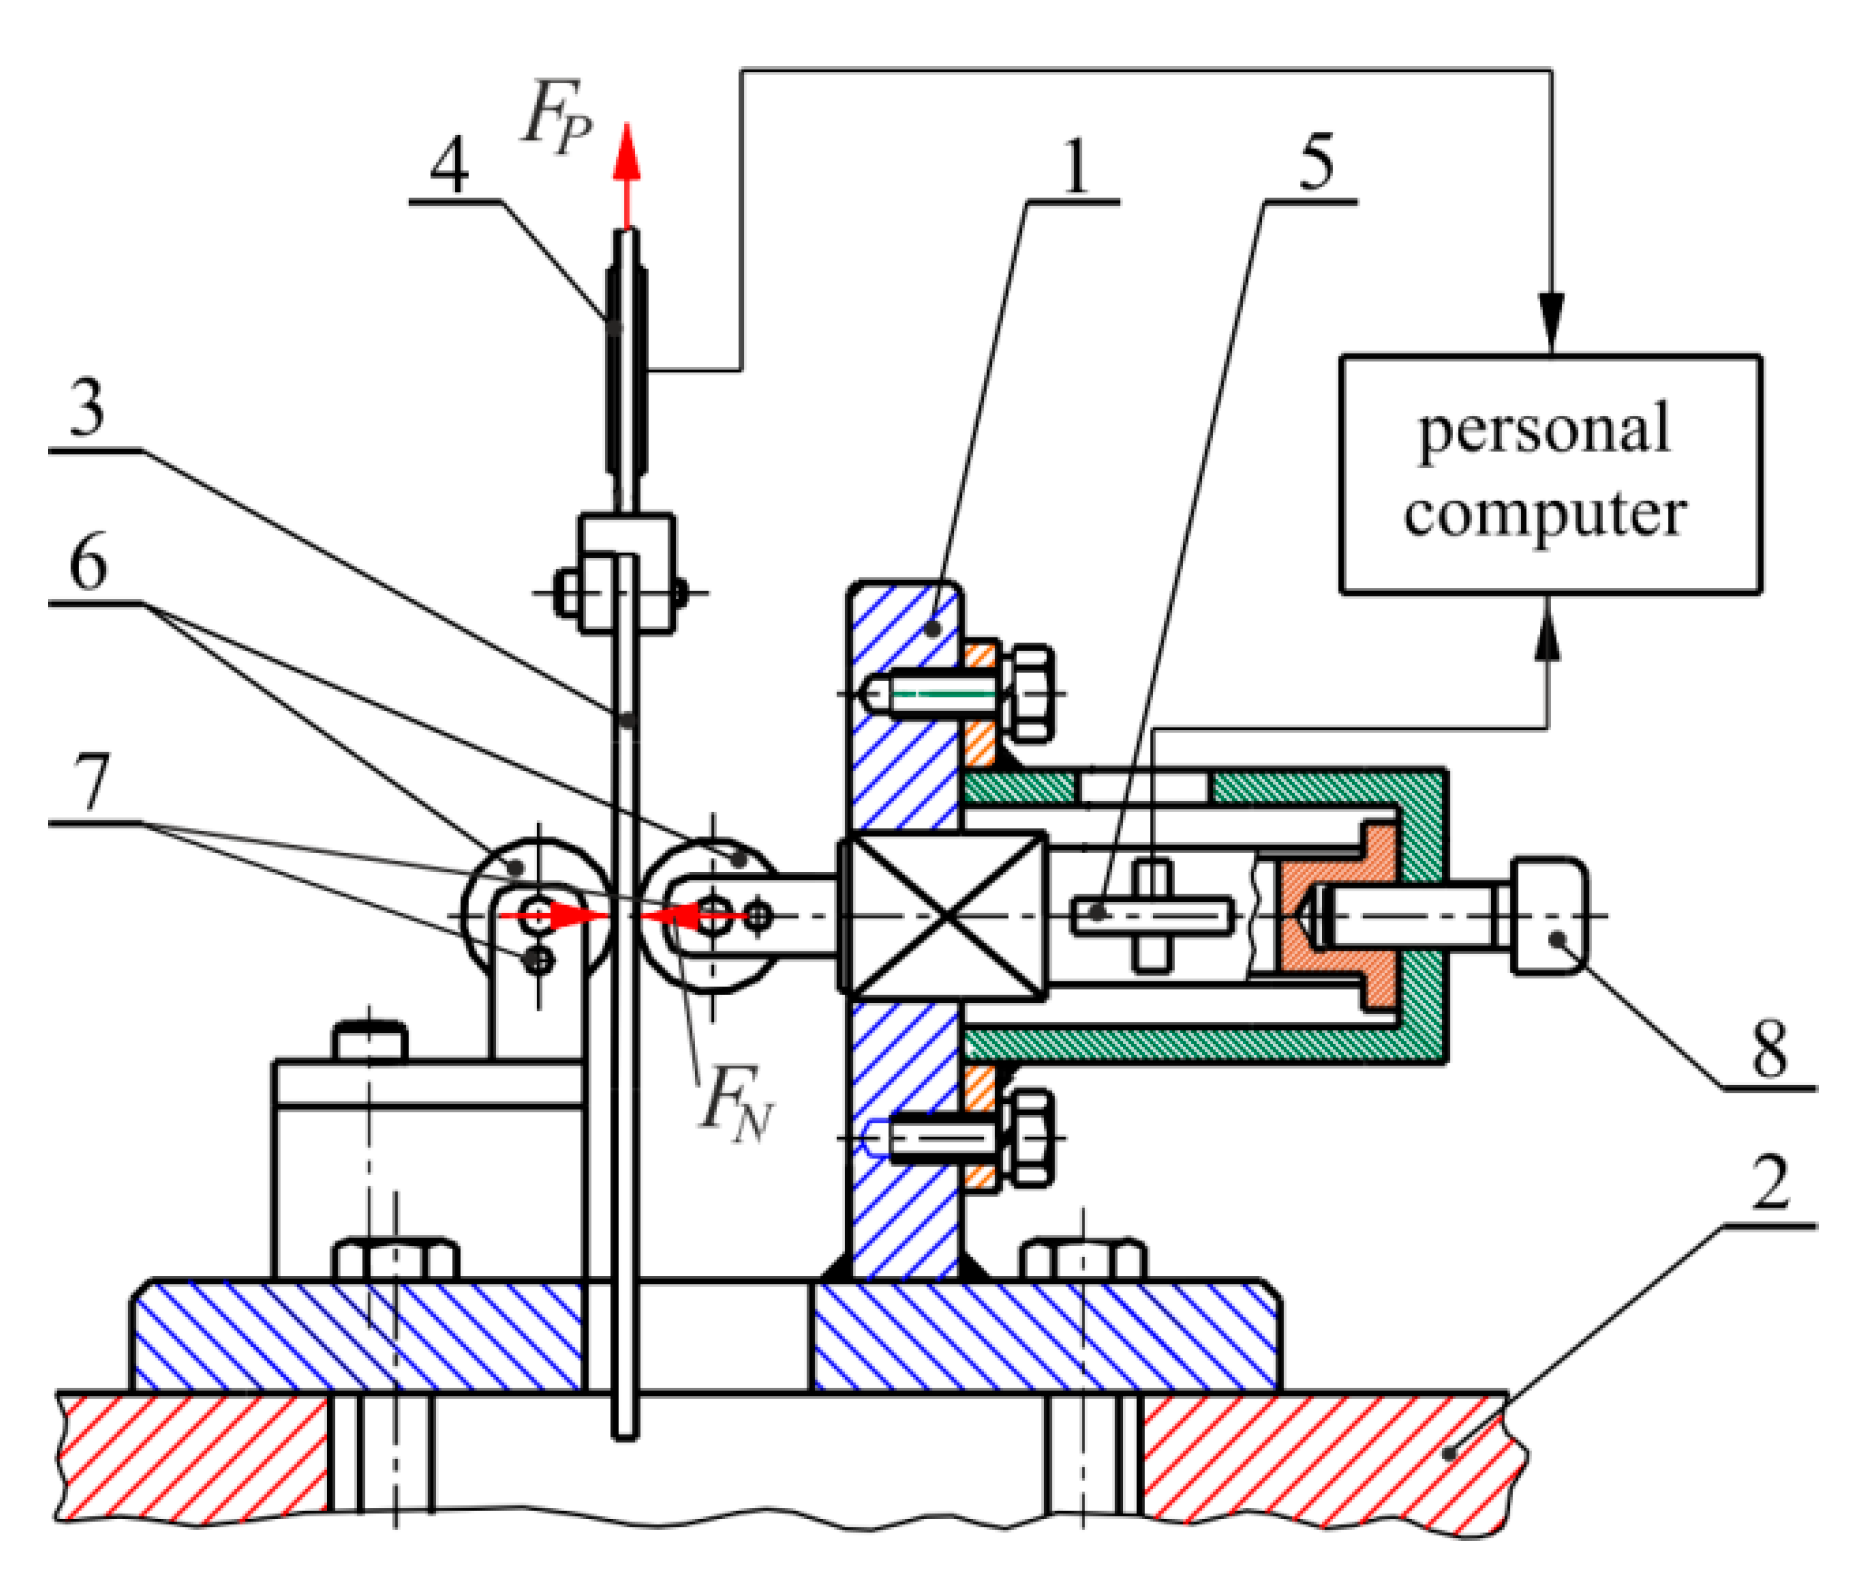
In general, the simulator (Figure 4) is equipped with four replaceable rollers.
During the maximum displacement of the middle roller equal to its diameter, the wrap angle of the middle roller is not equal to 180°, because it is necessary to ensure adequate clearance c (Figure 3c) between the counter-samples to prevent the specimen from blocking. This is especially important when testing sheets with a high susceptibility to galling and low susceptibility to strain hardening. Inadequate clearance c may lead to specimen destruction. Excessive drawing resistance may occur and, consequently, the sample may even break at large wrap angles and when testing mild sheets. According to the investigations of Trzepieciński et al. [3] the clearance c (Figure 3c) is maintained at c = g + g/2. In the present study, the samples were prepared as strips having a width of 20 mm and about 400 mm in length, cut along the RD and the transverse direction of the sheet.
2.3.3. Strip Drawing Test
In the sheet forming process, the strip drawing test (SDT) is attributed to modelling the friction phenomenon between the punch and the die wall. This test consists in drawing a strip of metal placed between non-rotating counter-samples, usually flat or with a cylindrical shape. The occurrence of frictional forces on the two contact surfaces is conducive to achieving a greater accuracy of measurement of the coefficient of friction. As in most of the friction tests, a flat specimen several times wider than the thickness is drawn in a plane strain state. Parameters affecting the change in the frictional resistance are the counter-sample pressure force, lubrication conditions, sample drawing speed, surface roughness of the counter-samples, and temperature.
Figure 5 shows the configuration of the SDT. The sheet strip was placed between two fixed cylindrical rollers with an equal radii of 20 mm and roughness Ra = 0.32 μm and Ra = 0.63 μm. The value of the Ra parameter was measured along the generating line of the roller surfaces. The rollers were made of a cold worked tool steel.
The samples were prepared as strips having a width of 20 mm and a length of about 260 mm and were cut along the rolling direction (0°) and transverse to the RD (90°). Values of both forces, the clamping force FN, and the pulling force FP, were constantly recorded using the electrical resistance strain gauge technique. The value of the coefficient of friction was evaluated during the test and the average value of the coefficient of friction was determined using Equation (3).
The friction tests were carried out for two contact conditions: Dry and lubricated. Dry tests were carried out by degreasing the surface of the specimens using acetone while the machine oil L-AN 46 with a viscosity of 44 mm2·s−1 at 40 °C was used for lubricated conditions. A sliding velocity of 0.001 m·s−1 was used, which is relatively high compared to the industrial values [3].
Each friction test has been repeated three times, and the average value of the coefficient of friction has been determined.
3. Results and Discussion
3.1. Bending under Tension Test
To describe how the coefficient of friction changes as the sample elongates, the coefficient of relative elongation is introduced:
where l0 is the length of the sheet strip before deformation, and l1 is the length of the sheet strip after deformation.
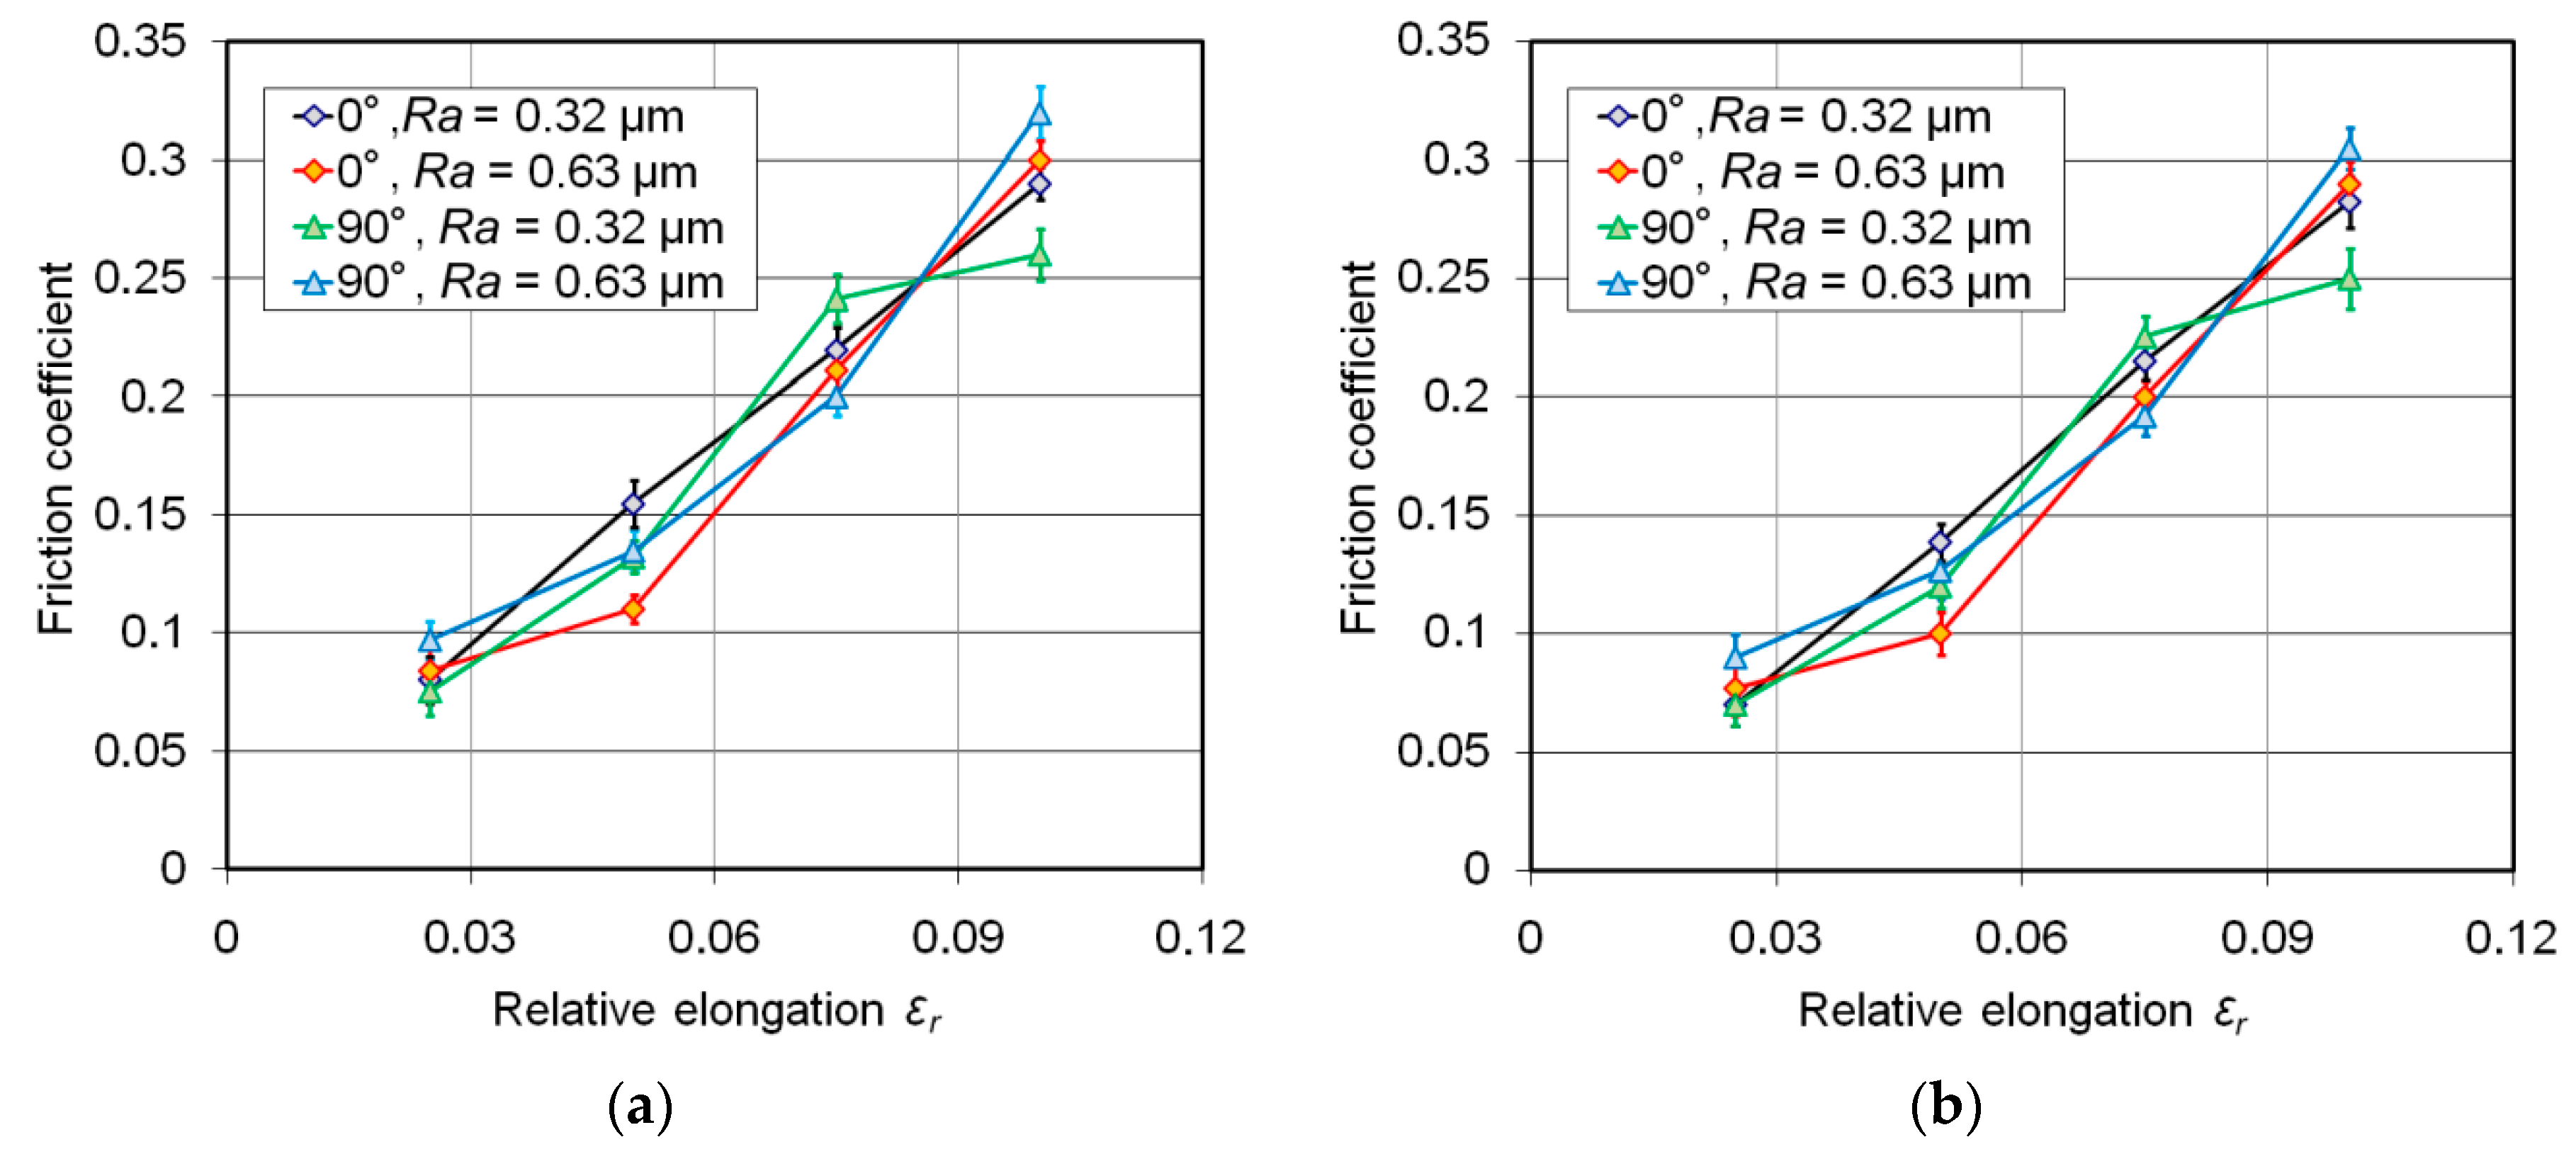
In Figure 6, results from the BUT test are presented. The value of the coefficient of friction increases as the relative elongation increases in both dry (Figure 6a) and lubricated (Figure 6b) conditions. The most linear relation between the relative elongation and the value of the coefficient of friction is observed for the rollers with a surface roughness of Ra = 0.32 μm and a specimen orientation of 0°. The increase in friction with the relative elongation is apparently due to the roughening of the strip by plastic deformation.
To examine the effectiveness of sheet lubrication the Le-index was introduced, defined as follows:
where μd is the coefficient of friction determined under dry conditions and μo is the coefficient of friction determined in the presence of a lubricant.
The greatest efficiency of lubrication (ca. 7–13%) is observed for the small values of sheet deformation (Figure 7). Under these conditions, the surface pressures are the smallest. With the increase of pressure, the lubricant reduced the friction to a smaller extent. This may be a result of changes of metal sheet surface topography under the deformation process, which causes the real contact area to increase with the normal pressure. The real contact area depends on, for instance, the roughness parameters of the sheet metal, the inclination to strain hardening of roughness asperities, and the geometry of the contact surface. This makes it difficult to generalise and interpret the results obtained for the variation of the coefficient of friction.
3.2. Draw Bead Test
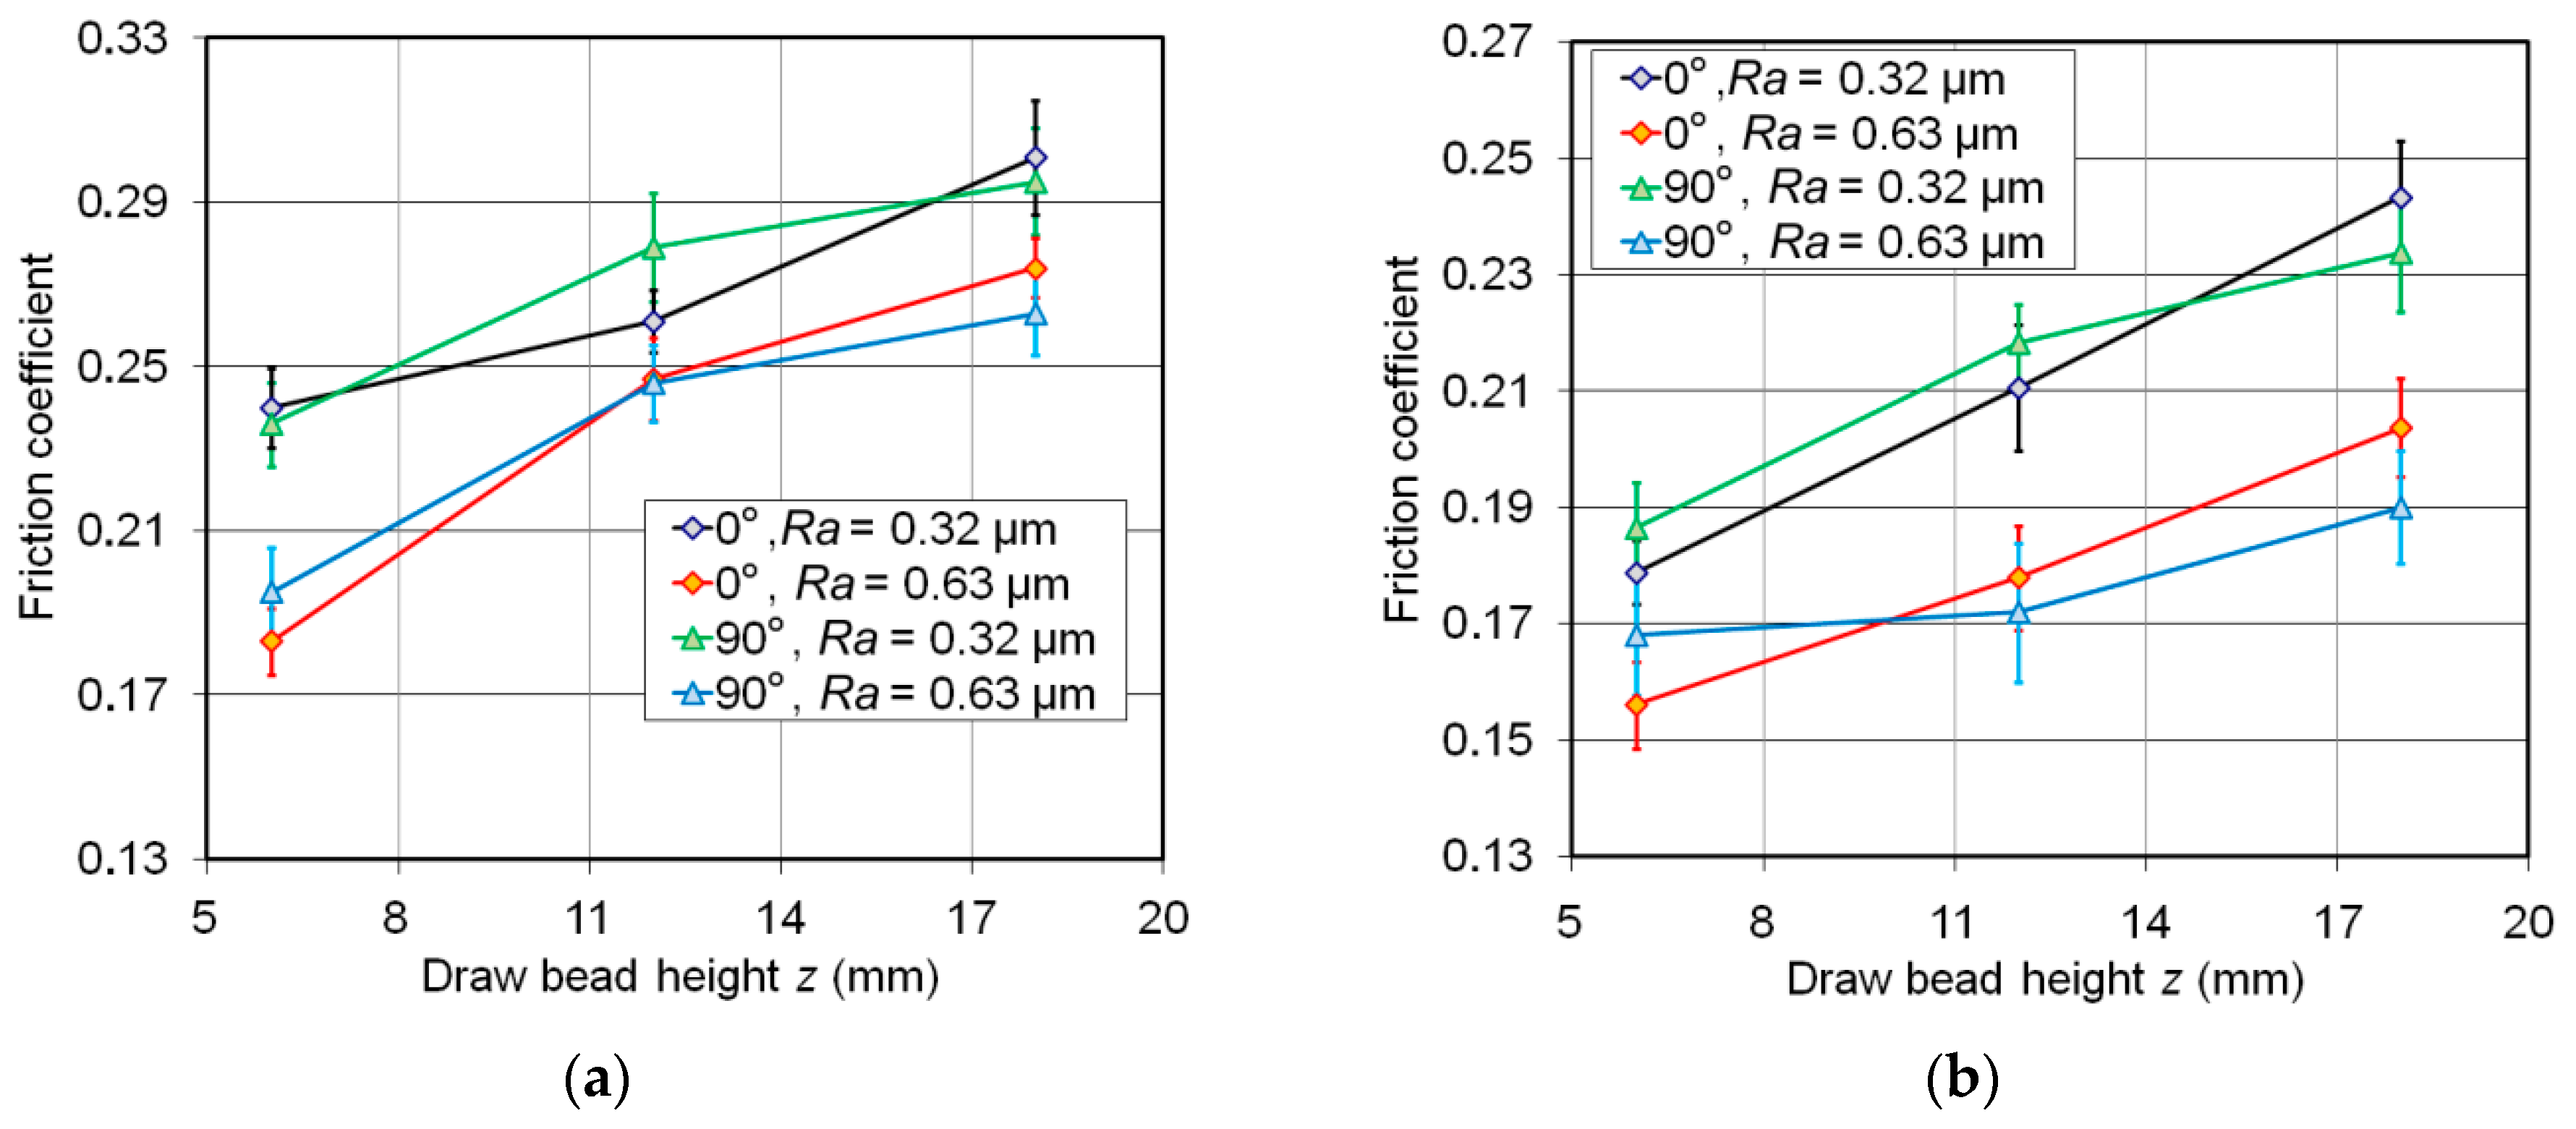
The results of the DBT demonstrate that the value of the coefficient of friction tested under dry friction conditions is higher than in the case of the lubricated sheets (Figure 8). Under both friction conditions, the samples tested with the rollers with a surface roughness of Ra = 0.32 μm demonstrated a higher value of coefficient of friction compared to the samples tested with the rollers with a surface roughness of Ra = 0.63 μm. For all sheets an increase in the draw bead height z (Figure 3c) leads to an increase in the value of the coefficient of friction (Figure 8). The trend to an increase is similar for both roughness of rolls analysed. The bead height z directly influences the wrap angle of the middle roller. It should be noted that, according to the Amontons–Coulomb theory, the friction force does not depend on the contact area. However, the change in the wrap angle of the rollers has an effect on the character of plastic deformation of the specimen and in consequence on the value of pulling and normal forces. Increasing the draw bead height increases the plastic resistance to drawing the sample and increases nominal pressures. Under these conditions, there is an increase in the share of the mechanical interactions of the surface asperities, which increases the total resistance during drawing the sample through the draw bead. The opposite occurs when using rollers with a roughness of 0.32 μm.
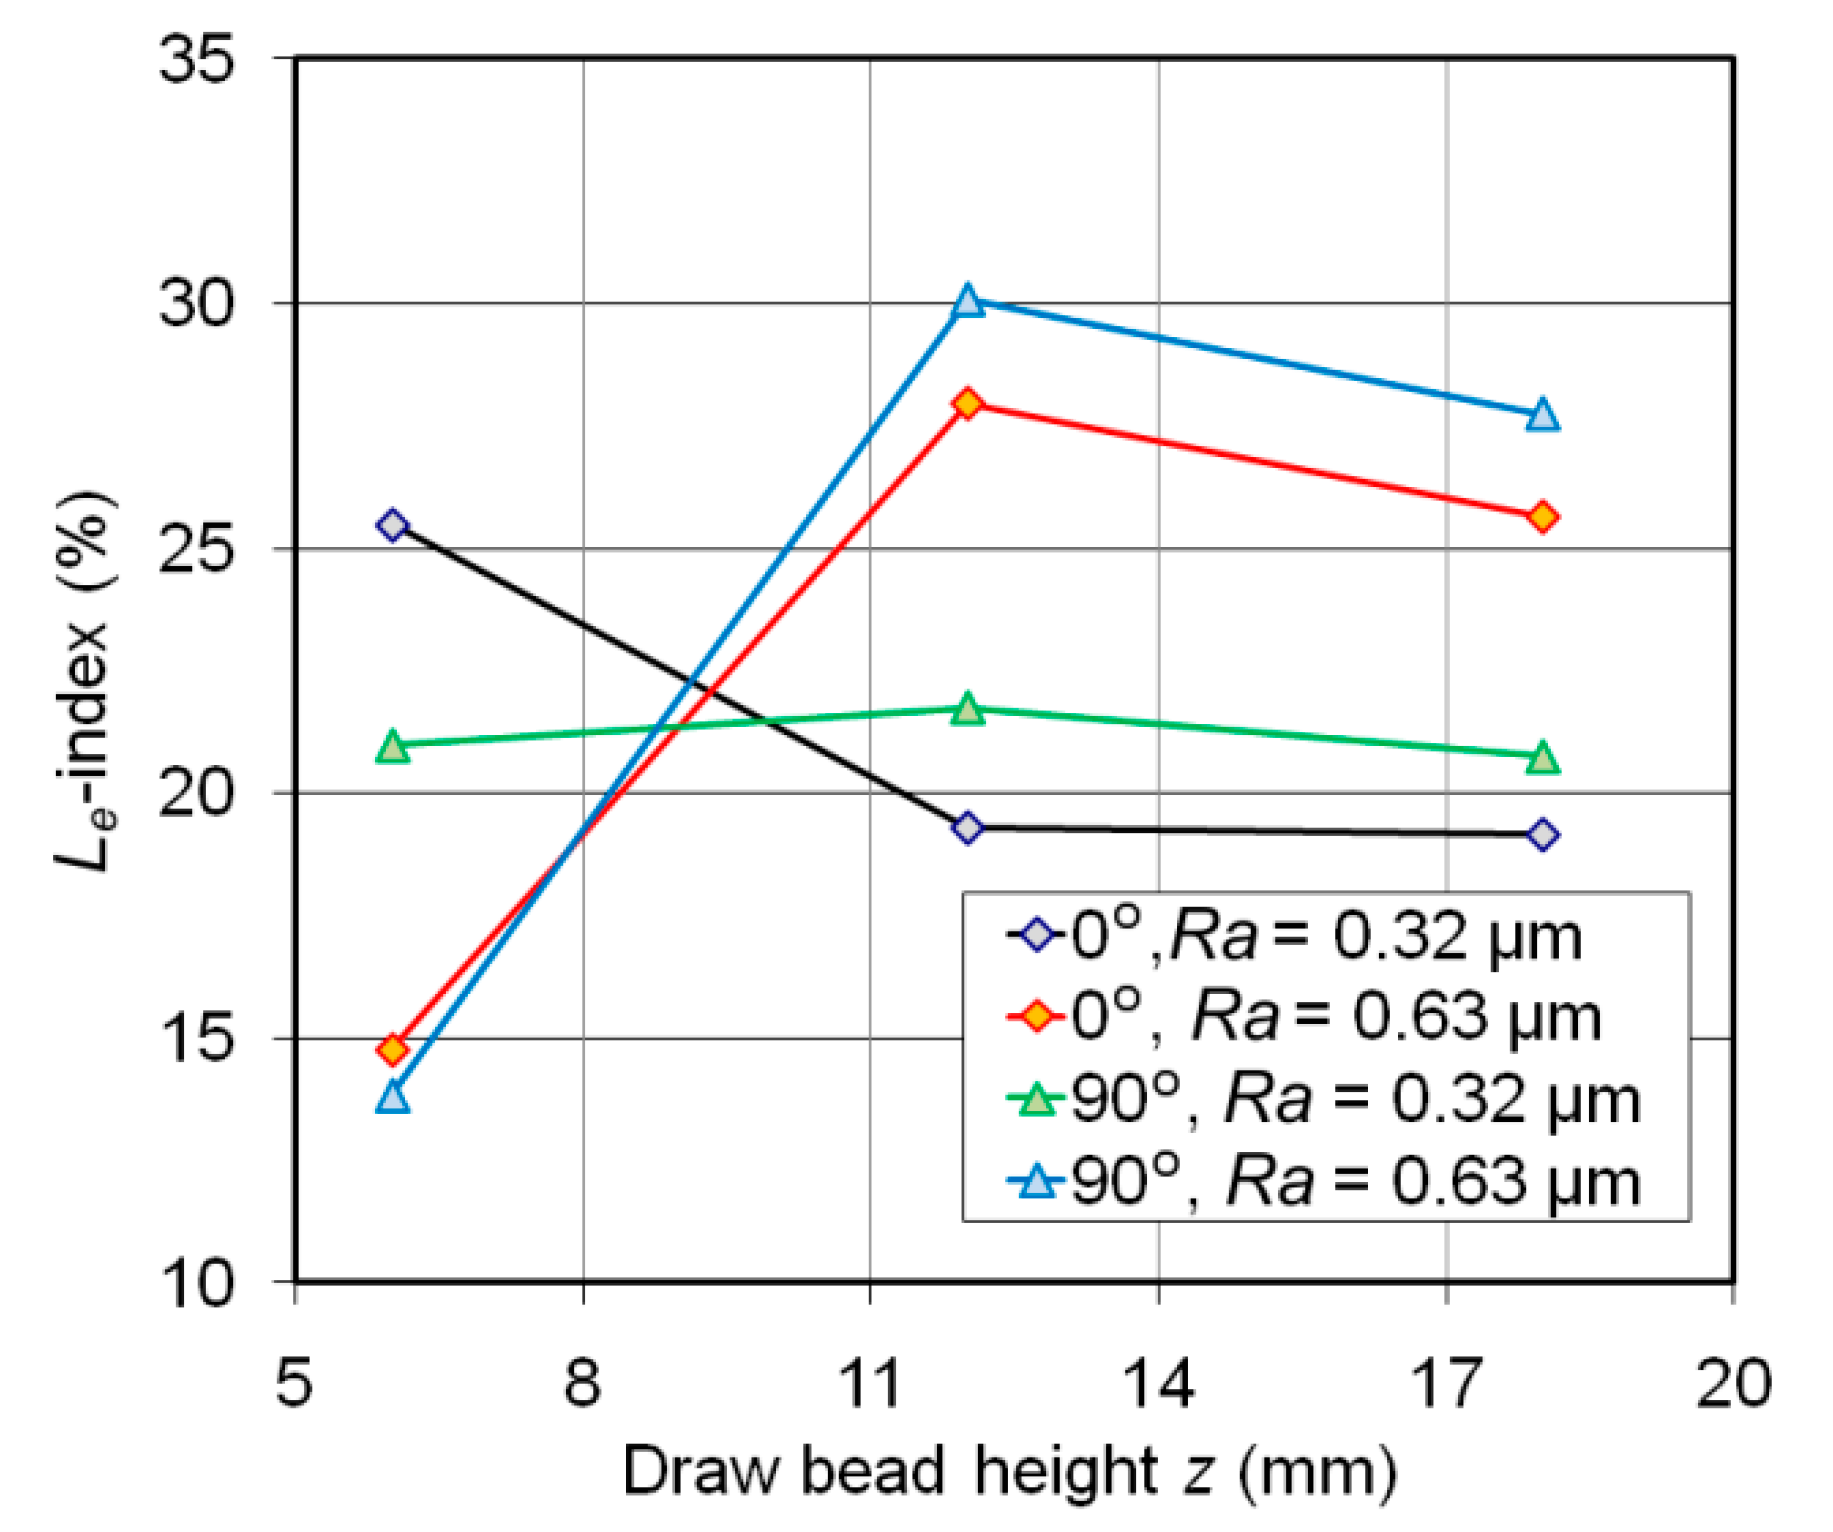
In Figure 9, the effect of the draw bead height on the effectiveness of lubrication is presented. An increase in the draw bead height results in a continuous decrease in the lubrication efficiency value. For draw bead heights of 12–18 mm a lubrication effectiveness was stabilised at the level of 19–22%. In the case of friction on rollers with a roughness of 0.63 μm, as the draw bead height z increases, the lubrication efficiency increases, but only up to z = 12 mm (Figure 9). Further increase of the draw bead height results in a decrease of the lubrication efficiency. The value of the coefficient of friction under oil lubrication conditions is reduced by more than 25% compared to dry conditions. In the case of draw bead heights of 12 mm and 18 mm, the Le-index for the roller with Ra = 0.32 μm is lower than that with Ra = 0.63 μm. The rollers with a lower surface roughness are characterised by a small volume of surface roughness valleys, which trap the lubricant. The increased draw bead height led to an increase of the contact area between the rollers and the specimen surface. Although the roughness asperities of the rollers with Ra = 0.63 μm are more at risk of flattening, the resulting surface roughness valleys, which form reservoirs of the lubricant, are higher than in the case of the roller with a surface roughness of Ra = 0.32 μm.
3.3. Strip Drawing Test
The value of the friction coefficient decreases as the contact pressure increases for both dry (Figure 10a) and lubricated conditions (Figure 10b). This trend is in general observed for both orientations. The contact pressure in the strip drawing test may be determined using equation [16]:
where Fc is the clamping force, w is the specimen width, R is the counter-sample radius and E* is a combined modulus of elasticity:
where E1 and E2 are Young’s moduli of the sheet and counter-sample materials, respectively; ν1 and ν2 are Poisson’s ratios of the sheet and counter-sample materials, respectively.
The decreasing of the coefficient of friction with the increased contact pressure may be the result of the dependence of friction on the clamping (normal) force where beyond a certain load the relationship between the friction force and clamping force is nonlinear and the value of the friction coefficient is not constant. In other words, the coefficient of friction changes with a normal load. The nonlinear dependence between the clamping force and the value of the coefficient of friction was previously studied by the author and the results are reported elsewhere [3].
For both contact conditions, when the sheet was tested using a roller with Ra = 0.32 μm, the value of the coefficient of friction for samples cut along the RD (0°) was lower than in the case of samples cut perpendicular (90°) to the RD. In the case of the test conducted with the roller with Ra = 0.63 μm, the situation is the contrary. This may be attributed to the directional topography. In the range of contact pressures between 40 MPa and 120 MPa, with specimens tested under dry friction conditions, the values of the coefficient of friction for the following conditions: Orientation of 0° and Ra = 0.32 μm, and orientation of 90° and Ra = 0.63 μm, are similar. Furthermore, the values of the coefficient of friction for the following conditions: Orientation of 0° and Ra = 0.63 μm, and orientation of 90° and Ra = 0.32 μm, are also similar. The value of the coefficient of friction for lubricated conditions and a specimen orientation of 90° decreases as the surface roughness of the roller increases (Figure 10b). The contrary trend is observed for the specimen orientation of 0°. However, if the contact pressure is higher than 120 MPa, the values of the coefficient of friction for a specimen orientation of 0° and both of the surface roughness (0.32 μm and 0.63 μm) are within the range of the standard deviation.
At low interface pressures and both contact conditions, the decreased roughness develops less asperity contact, so the friction coefficient decreases. The high contact pressures decrease the ability of the lubricant to separate the contacting surfaces, so the friction coefficient stabilises. At higher interface pressures, the friction mainly depends on the surface roughness of the bodies in contact and the specimen orientation. In the case of the high surface roughness and dry friction conditions, the load pressure acts on the asperities, which results in a higher degree of surface flattening and increased friction. In this case the difference between the friction measured on the samples cut along the RD and transverse to the RD may be due to surface flattening. The high surface roughness ensures better lubrication due to the high volume of the valleys in the roughness profile. In the case of the high surface roughness and lubrication conditions, the load pressure acts on the asperities, which results in a higher degree of surface flattening and increased friction.
It is well known that effective lubrication results in low friction, which reduce the loads imposed on the workpiece. The presence of an effective lubricant film also reduces the amount of direct contact of roughness asperities between the tooling and workpiece. This effect appears to be due to the manner in which the lubricant is captured by roughness on the surface of the sheet.
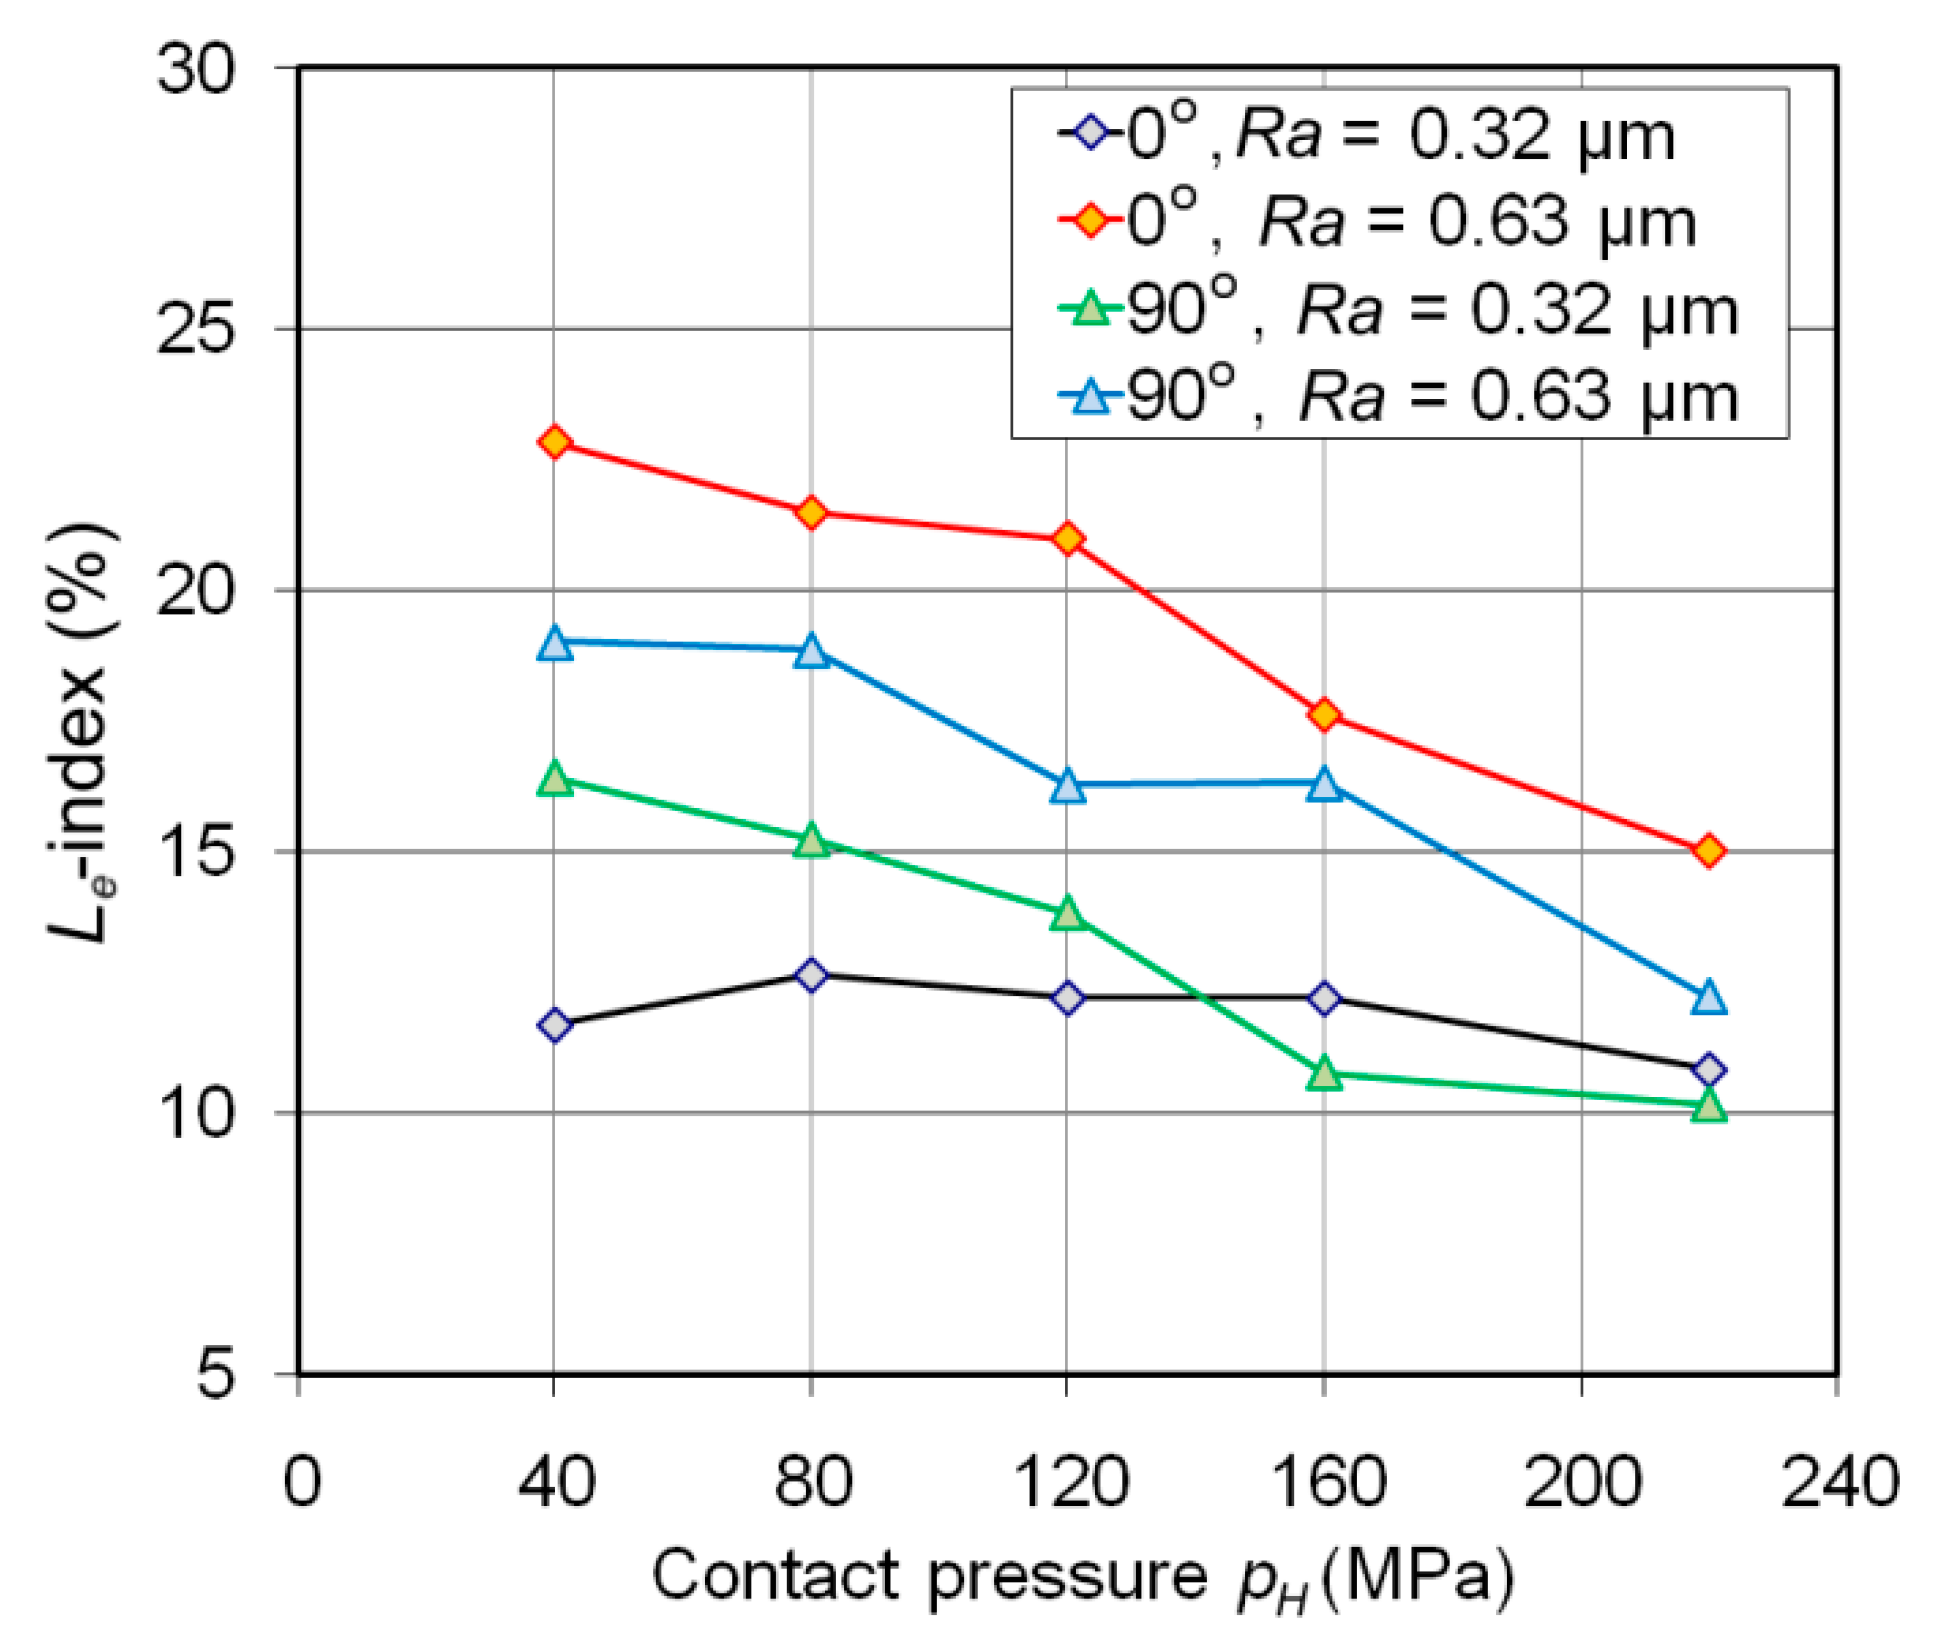
As shown in Figure 11, the Le-index value has a linear relationship with the value of contact pressure. In the case of the two combinations of rollers and specimen orientations: Orientation of 0° and Ra = 0.63 μm, and orientation of 90° and Ra = 0.32 μm, the value of the Le-index clearly decreases with an increasing value of contact pressure pH. For a sample orientation at 0° tested with the roller characterised by Ra = 0.32 μm, on the other hand, a similar effectiveness of lubrication is observed in the whole range of the pressure values, approximately 12%. In the case of the higher surface roughness of the contact bodies, a higher volume of lubricant may be trapped in the surface pits and consequently the effectiveness of lubrication is higher. This is confirmed by the data in Figure 11. The lubrication is more effective for rollers characterised by Ra = 0.63 μm than in the case of rollers with a roughness of Ra = 0.32 μm.
The coefficient of friction is the result of the mutual interaction between the rough surfaces of the tool and the sheet metal to be formed whose topography is constantly changing. In each of the friction tests, there are different kinematics of the mutual movement of the surface in contact and the sheet is subjected to different pressure values. In addition, a very important factor is the difference between the mechanical strength of the tool and the sheet. This determines the contribution of the mechanism of surface roughening in total friction. The mechanical strength of the tool material is always greater than the strength of the material to be formed. In the case of the low tool roughness, there is a reduced effect of flattening the surface asperities of the sheet metal by the roughness asperities of the tool surface. However, under these conditions there is an increased real contact area and the valleys in the topography of the tool surface retain less lubricant. When the surface roughness of the tool is high then it is obvious that the lubricant may be delivered in sufficient quantities to the contact interface. However in this case, the friction is mainly influenced by the ploughing of the sheet surface by the hard asperities of the tool surface.
4. Conclusions
This paper presents and discusses the results of friction tests of deep drawing steel sheets in various friction process conditions. The following conclusions are drawn from the research:
- −
- the specimens tested in the BUT test exhibit a tendency to an increase in the value of the coefficient of friction with the increasing relative elongation; this relationship is observed for both the specimen orientations and contact conditions analysed; the lubricant reduced the coefficient of friction, but the intensity of its action in the test results analysed depends on the specimen orientation and the value of the surface roughness of the counter-samples; for both sample orientations, the greatest efficiency of lubrication is observed for the small values of sheet deformation,
- −
- in the DBT, the most pronounced differences in friction were due to the surface roughness, while the orientation showed to have only a minor influence; moreover, an increase in the draw bead height leads to an increase in the value of the coefficient of friction,
- −
- in the SDT, the value of the coefficient of friction decreases as the contact pressure increases for both dry and lubricated conditions; the effectiveness of the reduction of the coefficient of friction by the lubricant clearly depended on the specimen orientation and surface roughness of the counter-samples.
Differences in the coefficient of friction obtained from various tribological tests indicate a strong dependence of the kinematic conditions of the process on parameters directly related to the characteristics of the friction process.
Funding
This research received no external funding.
Conflicts of Interest
The author declares no conflict of interest.
References
- Altan, T.; Tekkaya, A.E. Sheet Metal Forming Processes and Applications; ASM International: Materials Park, OH, USA, 2012. [Google Scholar]
- Nielsen, C.V.; Bay, N. Overview of friction modelling in metal forming processes. Procedia Eng. 2017, 207, 2257–2262. [Google Scholar] [CrossRef] [Green Version]
- Trzepieciński, T.; Bazan, A.; Lemu, H.G. Frictional characteristics of steel sheets used in automotive industry. Int. J. Automot. Technol. 2015, 16, 849–863. [Google Scholar] [CrossRef]
- Masters, L.G.; Williams, D.K.; Roy, R. Friction behaviour in strip draw test of pre-stretched high strength automotive aluminium alloys. Int. J. Mach. Tools Manuf. 2013, 73, 17–24. [Google Scholar] [CrossRef]
- Trzepieciński, T.; Lemu, H.G. Effect of computational parameters on springback prediction by numerical simulation. Metals 2017, 7, 380. [Google Scholar] [CrossRef]
- Trzepieciński, T. 3D elasto-plastic FEM analysis of the sheet drawing of anisotropic steel sheet. Arch. Civ. Mech. Eng. 2010, 10, 95–106. [Google Scholar] [CrossRef]
- Bay, N.; Olsson, D.D.; Andreasen, J.L. Lubricant test methods for sheet metal forming. Tribol. Int. 2008, 41, 844–853. [Google Scholar] [CrossRef]
- Menezes, P.L.; Kumar, K.; Kishore; Kailas, S.V. Influence of friction during forming processes—A study using a numerical simulation technique. Int. J. Adv. Manuf. Technol. 2009, 40, 1067–1076. [Google Scholar] [CrossRef]
- Evin, E.; Tomáš, M.; Výrostek, M. Verification the numerical simulation of the strip drawing test by its physical model. Acta Mech. Slovaca 2016, 20, 14–21. [Google Scholar] [CrossRef]
- Trzepieciński, T.; Lemu, H.G. Proposal for an experimental-numerical method for friction description in sheet metal forming. Stroj. Vestn. J. Mech. Eng. 2015, 61, 383–391. [Google Scholar] [CrossRef]
- Üstünyagiz, E.; Nielsen, C.V.; Christiansen, P.; Martins, P.A.F.; Bay, N. Continuous strip reduction test simulating tribological conditions in ironing. Procedia Eng. 2017, 207, 2286–2291. [Google Scholar] [CrossRef]
- Littlewood, M.; Wallace, J.F. The effect of surface finish and lubrication on the fictional variation involved in the sheet-metal-forming process. Sheet Met. Ind. 1964, 41, 925–1930. [Google Scholar]
- Zhang, S.; Hodgson, P.D.; Duncan, J.L.; Cardew-Hall, M.J.; Kalyanasundaram, S. Effect of membrane stress on surface roughness changes in sheet forming. Wear 2002, 253, 610–617. [Google Scholar] [CrossRef]
- Nine, H.D. Drawbead forces in sheet metal forming. In Mechanics of Sheet Metal Forming, 1st ed.; Koistinen, D.P., Wang, N.M., Eds.; Springer: Boston, MA, USA, 1978; pp. 179–211. [Google Scholar]
- Nanayakkara, N.K.B.M.P.; Kelly, G.L.; Hodgson, P.D. Determination of the coefficient of friction in partially penetrated draw beads. Steel Grips 2004, 2, 677–680. [Google Scholar]
- Ter Haar, R. Friction in Sheet Metal Forming, the Influence of (Local) Contact Conditions and Deformation. Ph.D. Thesis, Universiteit Twente, Enschede, Holland, 1996. [Google Scholar]
Figure 1.
Forces acting on an elementary section of the strip.

Figure 2.
Schematic diagram of the measuring device for bending under tension (BUT): 1—Frame; 2—Specimen; 3—Vertical load cell; 4—Horizontal load cell; 5—Working roller; 6—Blocked pin.
Figure 2.
Schematic diagram of the measuring device for bending under tension (BUT): 1—Frame; 2—Specimen; 3—Vertical load cell; 4—Horizontal load cell; 5—Working roller; 6—Blocked pin.

Figure 3.
The concept of determining friction: (a) Fixed rollers, (b) rotatable rollers, (c) geometrical parameters of draw bead.
Figure 3.
The concept of determining friction: (a) Fixed rollers, (b) rotatable rollers, (c) geometrical parameters of draw bead.

Figure 4.
Schematic representation of the measuring device for DBT: 1—Frame; 2—Specimen; 3—Vertical load cell; 4—Horizontal load cell; 5—Working rollers; 6—Blocked pin; 7—Supporting roller; 8—Nut.
Figure 4.
Schematic representation of the measuring device for DBT: 1—Frame; 2—Specimen; 3—Vertical load cell; 4—Horizontal load cell; 5—Working rollers; 6—Blocked pin; 7—Supporting roller; 8—Nut.
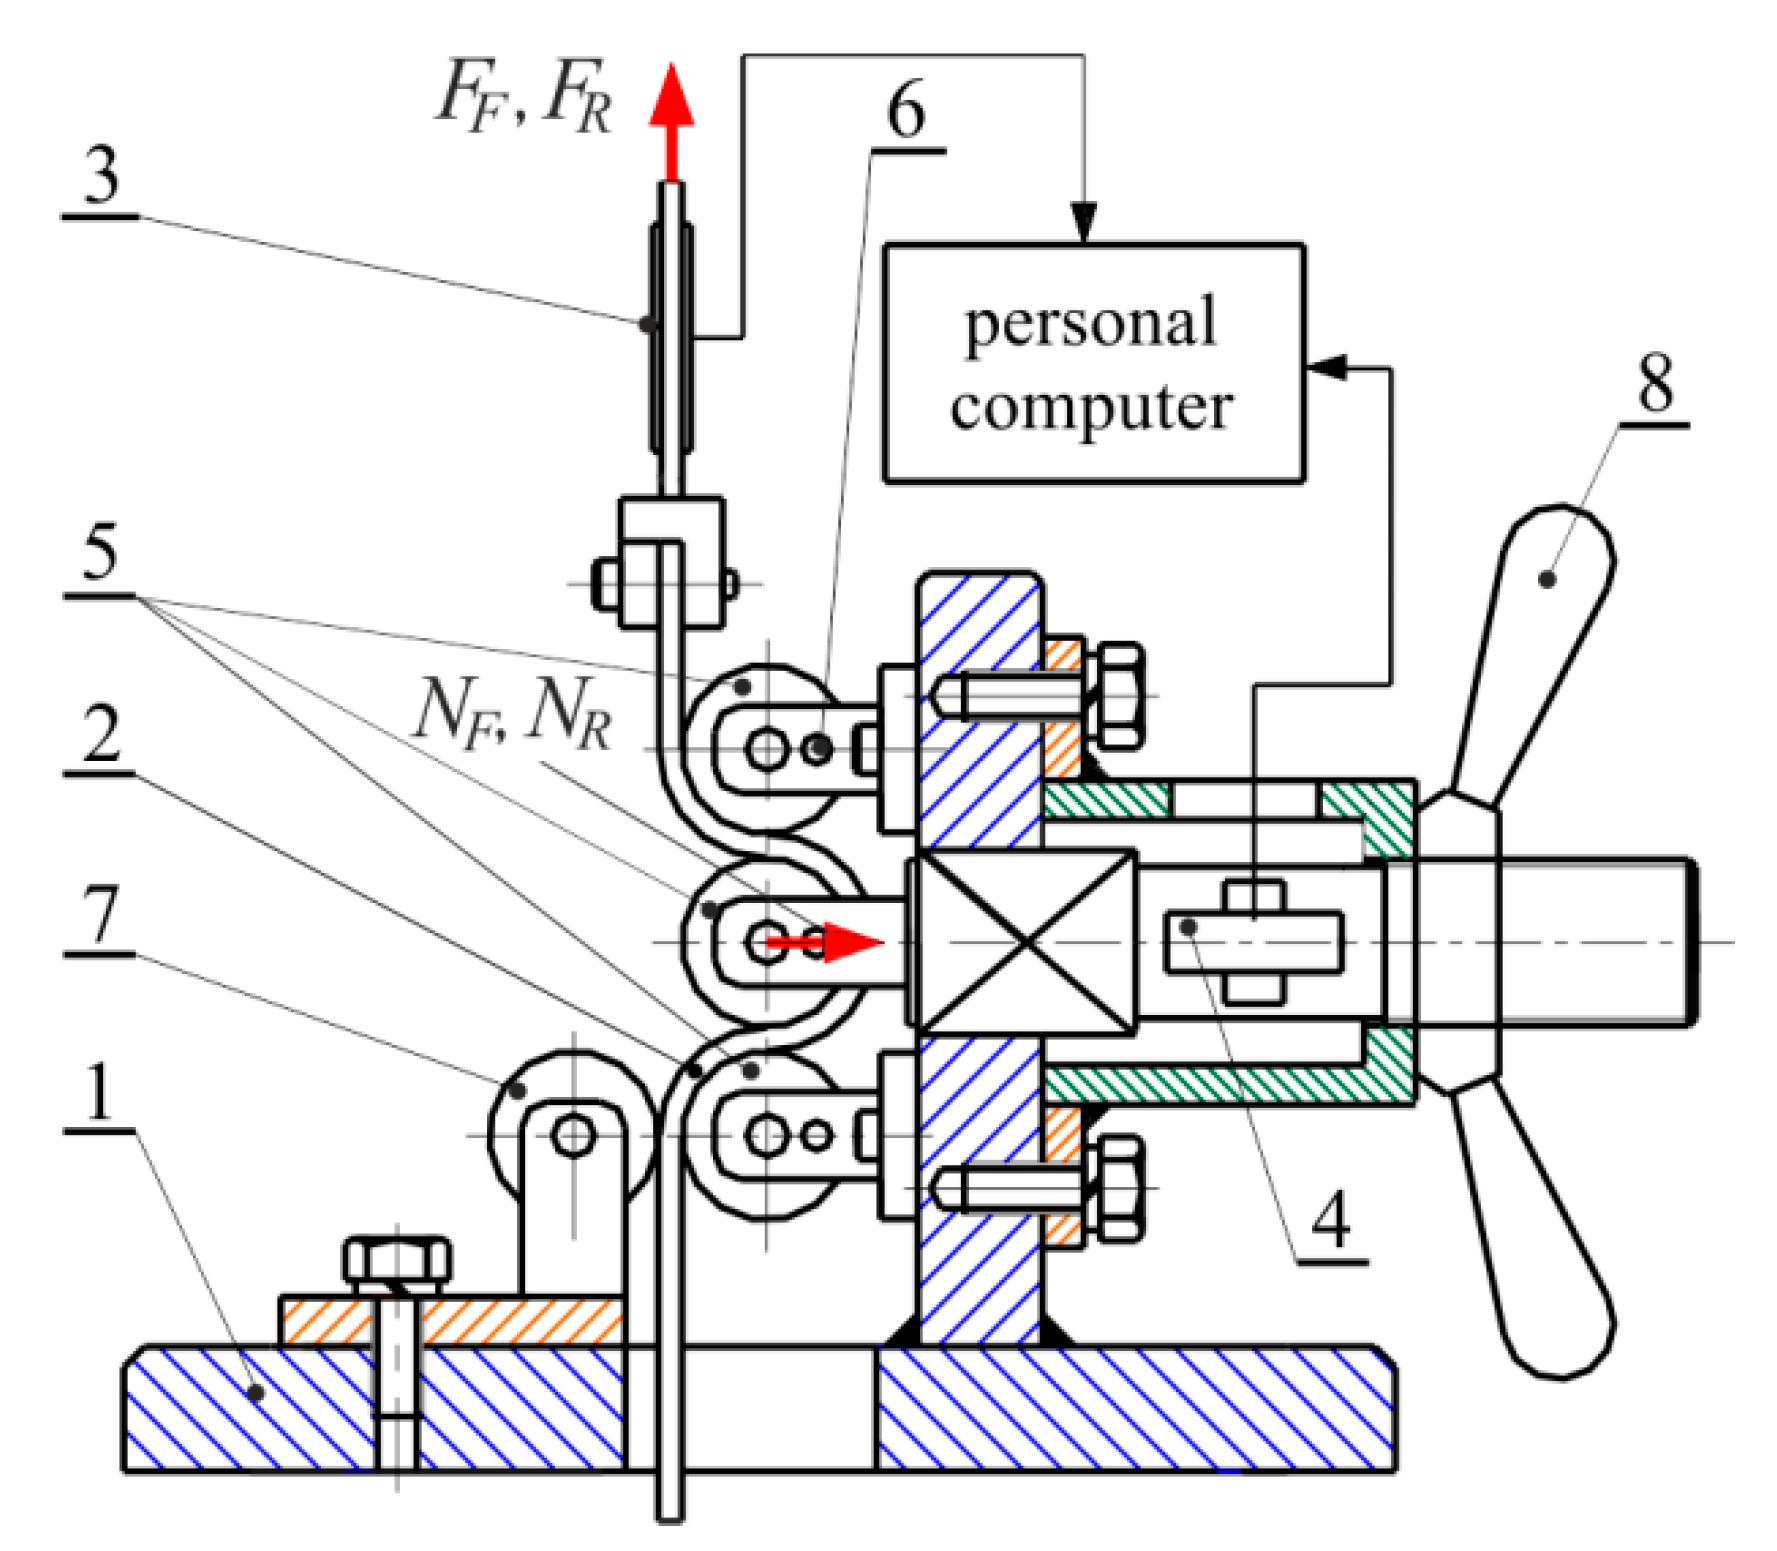
Figure 5.
Schematic representation of the measuring device for strip drawing test (SDT): 1—Frame; 2—Support table; 3—Specimen; 4—Vertical load cell; 5—Horizontal load cell; 6—Working rollers; 7—Blocked pins; 8—Set bolt.
Figure 5.
Schematic representation of the measuring device for strip drawing test (SDT): 1—Frame; 2—Support table; 3—Specimen; 4—Vertical load cell; 5—Horizontal load cell; 6—Working rollers; 7—Blocked pins; 8—Set bolt.

Figure 6.
Effect of the relative elongation εr on the coefficient of friction for (a) dry and (b) lubricated conditions.
Figure 6.
Effect of the relative elongation εr on the coefficient of friction for (a) dry and (b) lubricated conditions.

Figure 7.
Effect of the relative elongation εr on the effectiveness of lubrication.
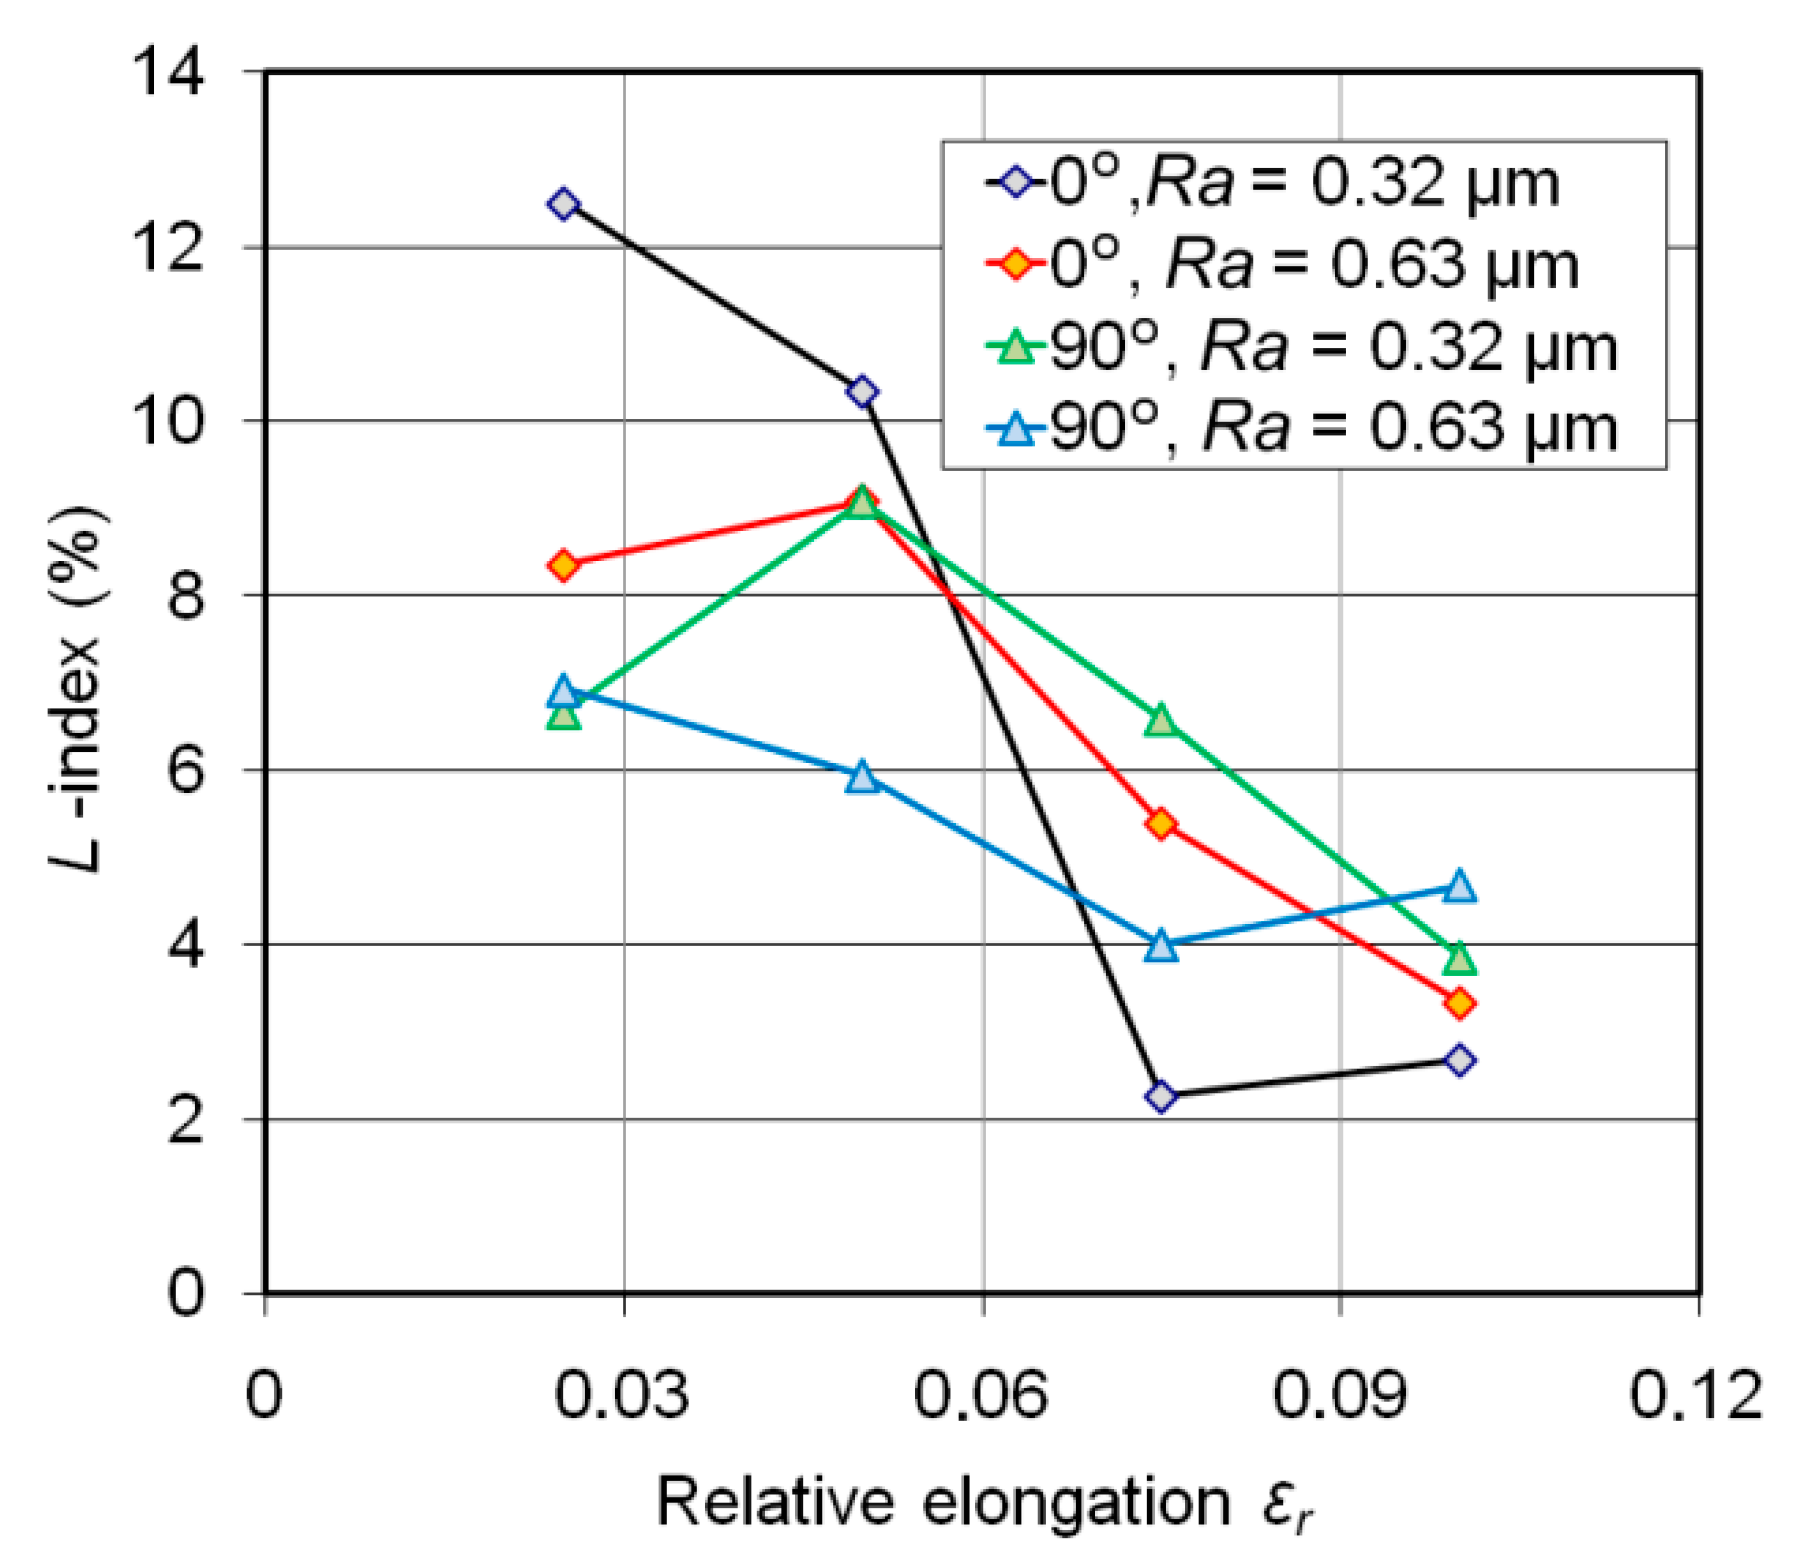
Figure 8.
Effect of the draw bead height z on the coefficient of friction for (a) dry and (b) lubricated conditions.
Figure 8.
Effect of the draw bead height z on the coefficient of friction for (a) dry and (b) lubricated conditions.

Figure 9.
Effect of the draw bead height on the effectiveness of lubrication.

Figure 10.
Effect of the contact pressure on the value of the coefficient of friction for (a) dry and (b) lubricated conditions.
Figure 10.
Effect of the contact pressure on the value of the coefficient of friction for (a) dry and (b) lubricated conditions.

Figure 11.
Effect of contact pressure on the value of the Le-index.


Table 1.
Mechanical properties of the deep-drawing quality (DDQ) steel sheet.
| Orientation | Rp0.2, MPa | Rm, MPa | K, MPa | n |
|---|---|---|---|---|
| 0° | 162 | 310 | 554 | 0.217 |
| 90° | 163 | 312 | 530 | 0.210 |
Table 2.
Basic surface roughness parameters of the DDQ steel sheet *.
| Sa (μm) | Sq (μm) | Sz (μm) | Sp (μm) | Sv (μm) | St (μm) |
|---|---|---|---|---|---|
| 1.31 | 1.53 | 9.41 | 4.41 | 6.98 | 11.39 |
* Sa—Average roughness, Sq—Root mean square roughness parameter, Sz—zero-point peak-valley surface roughness, Sp—Highest peak of the surface, Sv—Maximum pit depth, St—Total height.
© 2019 by the author. Licensee MDPI, Basel, Switzerland. This article is an open access article distributed under the terms and conditions of the Creative Commons Attribution (CC BY) license (http://creativecommons.org/licenses/by/4.0/).
Share and Cite
MDPI and ACS Style
Trzepiecinski, T. A Study of the Coefficient of Friction in Steel Sheets Forming. Metals 2019, 9, 988. https://doi.org/10.3390/met9090988
AMA Style
Trzepiecinski T. A Study of the Coefficient of Friction in Steel Sheets Forming. Metals. 2019; 9(9):988. https://doi.org/10.3390/met9090988
Chicago/Turabian StyleTrzepiecinski, Tomasz. 2019. "A Study of the Coefficient of Friction in Steel Sheets Forming" Metals 9, no. 9: 988. https://doi.org/10.3390/met9090988
Note that from the first issue of 2016, this journal uses article numbers instead of page numbers. See further details here.