Article

Optimization of Flow Field in Slab Continuous Casting Mold with Medium Width Using High Temperature Measurement and Numerical Simulation for Automobile Exposed Panel Production

1
State Key Laboratory of Advanced Special Steel, School of Materials Science and Engineering, Shanghai University, Shanghai 200444, China
2
Technology Center, Hunan Valin Lianyuan Iron & Steel Co., LTD, Hunan 417000, China
*
Author to whom correspondence should be addressed.
Metals 2020, 10(1), 9; https://doi.org/10.3390/met10010009
Submission received: 28 October 2019 / Revised: 14 December 2019 / Accepted: 17 December 2019 / Published: 20 December 2019

Abstract

:
In the present work, mathematical modeling combined with measurement of the velocities near mold surface with rod deflecting method at the high temperature was carried out to optimize the flow field of slab continuous casting mold with medium width of 1230 mm for the production of an automobile exposed panel. The results show that the measured results of the velocities near the mold surface are in good agreement with the calculated results. The velocities near the mold surface increase with increasing the casting speed and decreasing the argon gas flow rate. When the casting speed is increased from 1.0, to 1.3, 1.5, and 2.0 m/min, the flow pattern in the mold is changed from single-roll flow (SRF), to unstable flow (UF), and then to double-roll flow (DRF), the top surface level fluctuations has the smallest value at 1.5 m/min. When the argon gas flow rate is 1 and 4 L/min, the velocity near the mold surface has a moderate value, and the flow pattern in the mold is DRF and the top surface level fluctuation is small and symmetrical. When the submerged entry nozzle (SEN) submergence depth is increased to 200 mm, the velocities near the mold surface decrease, and the top surface level fluctuation becomes small. The optimized flow field in the mold can be judged to be favorable to the surface quality of the automobile exposed panel; if the velocities near the mold surface are relatively small, the flow pattern in the mold is DRF and the top surface level fluctuation is small and symmetrical.

1. Introduction

The production of automobile exposed panel covers different processes, including steelmaking processes, such as hot metal pretreatment, converter blowing, secondary refining, continuous casting, as well as processes after steelmaking, such as hot rolling, cold rolling, and hot-dip galvanizing. The surface defects of the automobile exposed panels caused by the steelmaking process usually can’t be detected until the final quality inspection process of the hot-dip galvanizing sheet. The defects caused by steelmaking are interwoven with the defects caused by the multiple processes after steelmaking, making them difficult to be identified, judged, and improved.
The surface defects of automobile exposed panels caused by steelmaking are mainly classified into inclusion defects [1,2,3], mold powder entrapment defects [3,4] and bubble defects [3,5], which are all mainly formed in the continuous casting molds. Therefore, the flow field in the mold has a great impact on the surface quality of automobile exposed panel.
It is now widely accepted by the steelmaking researchers that there are three flow patterns in the mold with bifurcated submerged entry nozzle (SEN). The first flow pattern is classic double-roll flow (DRF). The second flow pattern is single-roll flow (SRF) was firstly reported by Andrzejewski et al. [6] and Kohler et al. [7]. The last one is the unstable flow (UF), which is a kind of complex flow between DRF and SRF [8]. By comparison to DRF, many studies have shown that SRF and UF can increase the probability of forming surface defects on slabs [9,10,11,12,13].
The influence of continuous casting process parameters on the flow field has been extensively studied. Gupta et al. [14] studied the flow oscillation frequency for different mold dimensions, SEN positions and its configurations, and casting speeds using water modeling and found that an upward SEN port angle and increase of casting speed increase the frequency of flow oscillation significantly. Using particle image velocimetry (PIV) and mold flow control (MFC), Dauby et al. [15] reported that the incidence of surface defects on the slab under unstable flow is four times that of steady flow. Using numerical simulation, Kubo et al. [16] indicated that injection of argon gas from SEN reduces molten steel flow momentum at the nozzle exit and the surface velocity, and the direction of surface velocity changes at a large argon gas flow rate. Zhang et al. [12] found that the SRF is generated under the conditions of large gas injection, small SEN submergence depth, and low casting speed using water modeling. Using PIV, ultrasound velocimetry (UV) and computational fluid dynamics (CFD) simulation, Ramos et al. [17,18] demonstrated that shallow SEN submergence depth is beneficial to form SRF, which tends to induce unstable meniscus fluctuation. Asad et al. [19] showed that reduction of the casting speed leads to a decrease in the mean wave amplitude on the mold surface, and the presence of the SRF leads to the occurrence of large-scale standing waves by use of Unsteady Reynolds Average Navier–Stokes (URANS) modeling. Deng et al. [20] concluded that the casting speed/mold width ratio index (CMI) and argon injection rates are the dominant factors that determine the flow pattern in the slab mold.
About the measurement of the velocities near the mold surface at high temperature, Cho et al. [21,22,23] made use of the nail board dipping measurement method to validate the model calculation results of CFD and found that the surface level profile is the lowest with the highest stability at 1/4 width of mold, and surface flow mostly moves towards to the SEN, which means only the DRF was taken into consideration. However, based on the small and unstable height of the slope on the nail to deduce the velocity, the measurement accuracy is relatively low with the nail board dipping measurement of the velocities near the mold surface.
Although a great deal of investigation on flow field in the mold of continuous casting has been done, the top surface fluctuation features of mold associated with flow patterns have received much less attention, which are the direct causes of surface defects on the steel sheet product. Furthermore, it is urgently required to measure the velocities near the mold surface in the practical continuous casting process with much-elevated accuracy to help control the flow field in the mold and verify the numerical calculated results.
In the present work, for optimizing the flow field in the continuous casting mold of slab with medium width of 1230 mm for automobile exposed panel production, a rod deflecting method for directly measuring velocities near the mold surface at a high temperature was used to quantify the velocities near the mold surface, confirm the flow patterns, and verify the numerical simulation results. The influence of casting speeds, argon gas flow rates, and SEN submergence depths on the velocities near the mold surface, the flow pattern, and the top surface level profile in the mold were investigated using the verified mathematical model.

2. Rod Deflecting Method for Measuring Velocities near the Mold Surface

A rod deflecting method for measuring velocities near the mold surface is a new method for directly measuring the velocity near mold surface at the high temperature, which is composed of the velocity measuring rod, the deflection bearing, the deflection angle indicator, the deflection pointer, and the equilibrator. This method can measure the magnitudes and directions of velocities at the different positions on the mold surface, and then can determine the flow pattern of the molten steel in the mold according to the direction of the surface velocities. The details about the rod deflecting method for measuring velocities near mold surface can be referred to in our previous work [24]. In the present work, the velocities at two locations on the mold top surface are measured. One is 1/4 of the width of the mold and the other is 10 cm from the narrow wall both at the thickness centerline. The velocity measuring rod made of stainless steel can stay in the molten steel for about 30 s before it is melted, and about 10 pieces of data can be collected for each measuring rod. Under each experimental condition, three velocity measuring rods are used to measure the velocity of molten steel near the surface and over 30 pieces of data are consecutively collected for one heat to ensure the reliability of the measurement results.

3. Numerical Simulation

3.1. Fluid Flow Model

The flow of an incompressible fluid is described by mass balance (continuity) and momentum balance (Navier–Stokes) equations, which are expressed as follows:
ρ t + ( ρ u i ) x i = 0 ,
( ρ u i ) t + ( u i u j ) x j = p x i + x j [ ( μ l + μ t ) ( u i x j + u j x i ) ] + ρ g i + F i ,
μ t = ρ C μ k 2 ε ,
where ρ is the fluid-phase density; u is the fluid-phase average velocity; p is the pressure; μl is the dynamic viscosity of molten steel; μt is the turbulent viscosity; Fi in Equation (2) is the source term for momentum exchange with the bubbles, representing the drag force, the gravitational force, the buoyancy force, the lift force, the virtual mass force, and the pressure gravity force, respectively; k is the turbulent kinetic energy; ε is the turbulent kinetic energy dissipation rate; Cμ is a constant, 0.9.
The standard k-ε model is used to model turbulence [25], the following transport equations of k and ε are solved:
( ρ k ) t + ( ρ u i ) x i = x i [ ( μ l + μ t σ k ) k x j ] + G k ρ ε ,
( ρ ε ) t + ( ρ u i ε ) x i = x i [ ( μ l + μ t σ ε ) ε x j ] + C 1 ε k G k C 2 ρ ε 2 k ,
G k = μ t ( u i , j x j + u i , j x i ) u i , j x j .
In the above equations, σk, σε, C1, and C2 are constants, whose values are 1.0, 1.3, 1.44, and 1.92, respectively.

3.2. Lagrangian DPM Model

To calculate Fi for Equation (2), the Lagrangian discrete phase model (DPM) model solves a force balance on each argon bubble:
m A r d u A r d t = F d + F g + F b + F L + F v m + F P .
The terms on the right-hand side of Equation (7) are the drag force (Fd), the gravitational force (Fg), the buoyancy force (Fb), the lift force (FL), the virtual mass force (Fvm), and the pressure gravity force (Fp). The details about all forces can be referred to in our previous work [24].

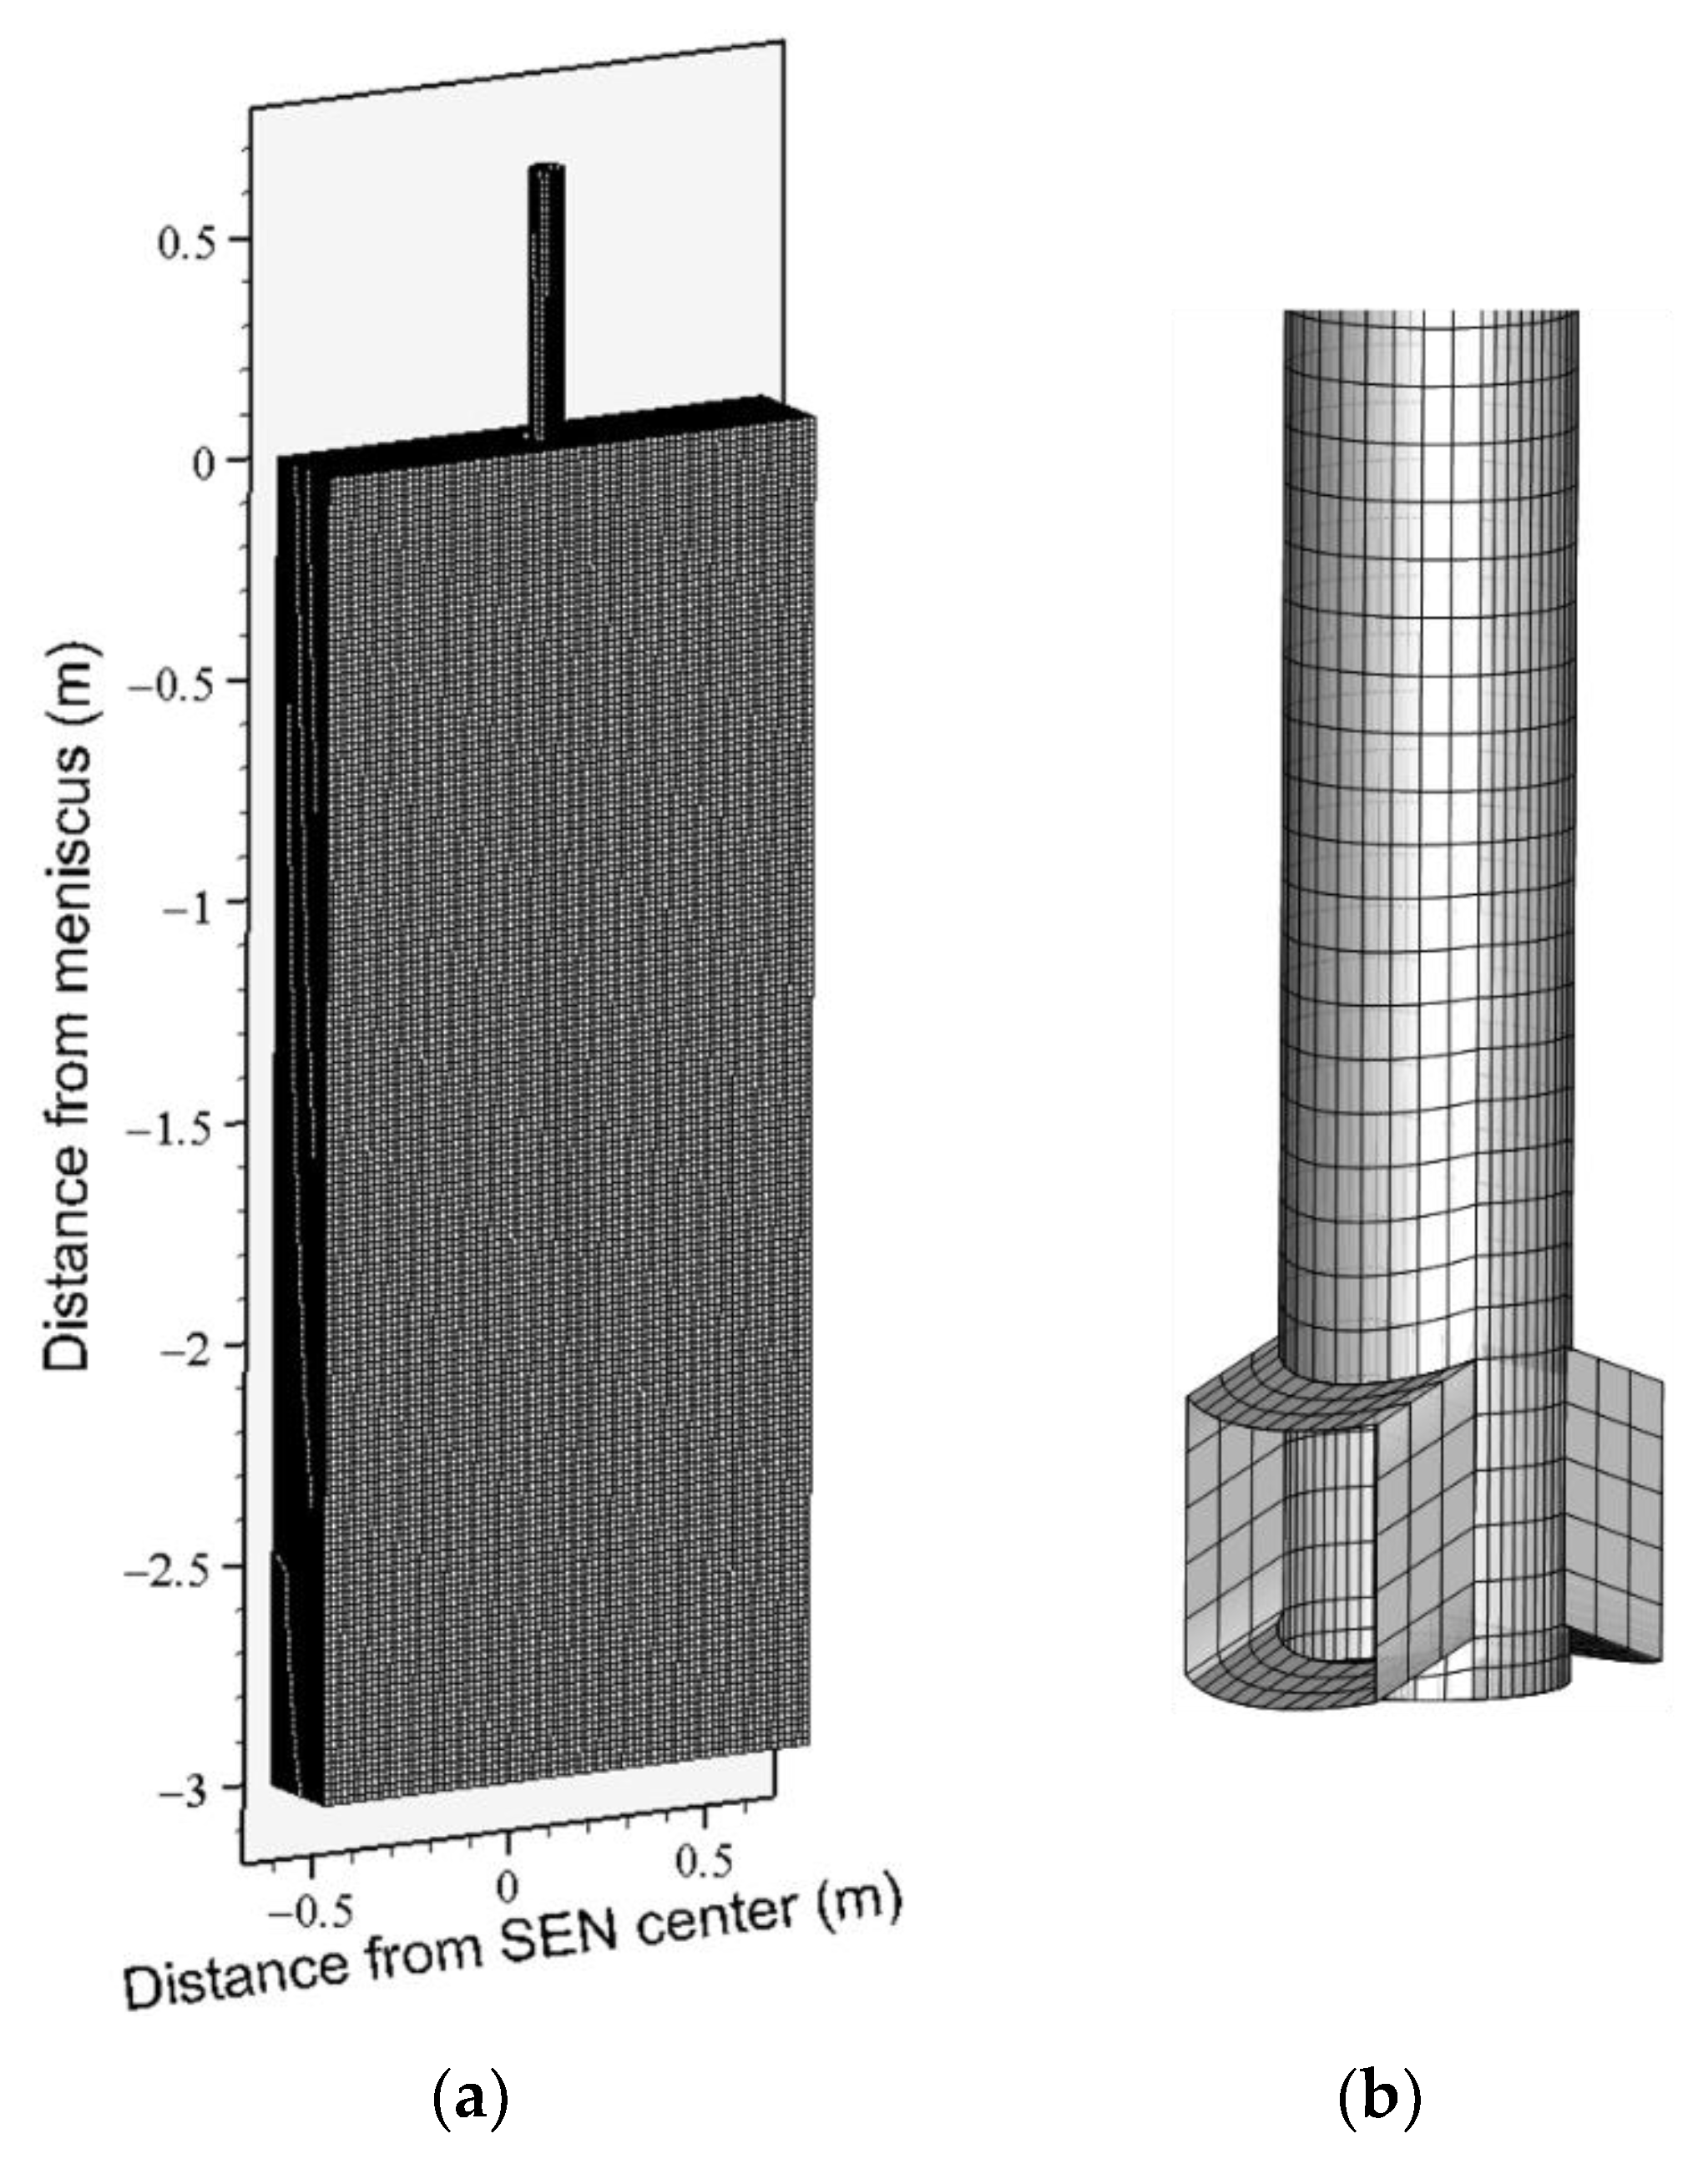
3.3. Simulation Details

The computational mold domain is a full real caster, including SEN and the top 3000 mm of liquid pool in the mold and strand as shown in Figure 1a. This domain consists of about 0.52 million hexahedral cells. The details of the SEN, the mold dimensions, and the process parameters are given in Table 1.
According to the molten steel flow rate and the surface area of inlet, constant velocity is fixed as the inlet condition at the top surface of SEN. Small values of the turbulent kinetic energy of 10−5 m2/s2 and the turbulent kinetic energy dissipation rate of 10−5 m2/s3 are fixed at the inlet. An outflow condition is chosen on the domain bottom at the mold exit. The top surface of the slab mold is assumed to have a fixed and free-slip condition. In addition, all the walls of the mold are assumed to be stationary and no-slip. The unsteady simulations are chosen to describe the movement of molten steel in the mold because of the time-varying flow field in the actual mold. For the present work, the time step for the simulation is 0.005 s, and the total time of calculation for casting process is 30 s since the flow field in the mold has reached a relatively stable state. Thus, the values for the simulated results after calculation for 30 s are presented in this paper.
For DPM mold calculation, the argon gas is injected through inlet with uniform bubble size of 2.5 mm [26,27,28,29]. An escape condition is adopted at the domain bottom exit and the top surface. A trap condition is employed at the walls of mold. Furthermore, a reflection condition was defined for the walls of SEN.

4. Results and Discussion

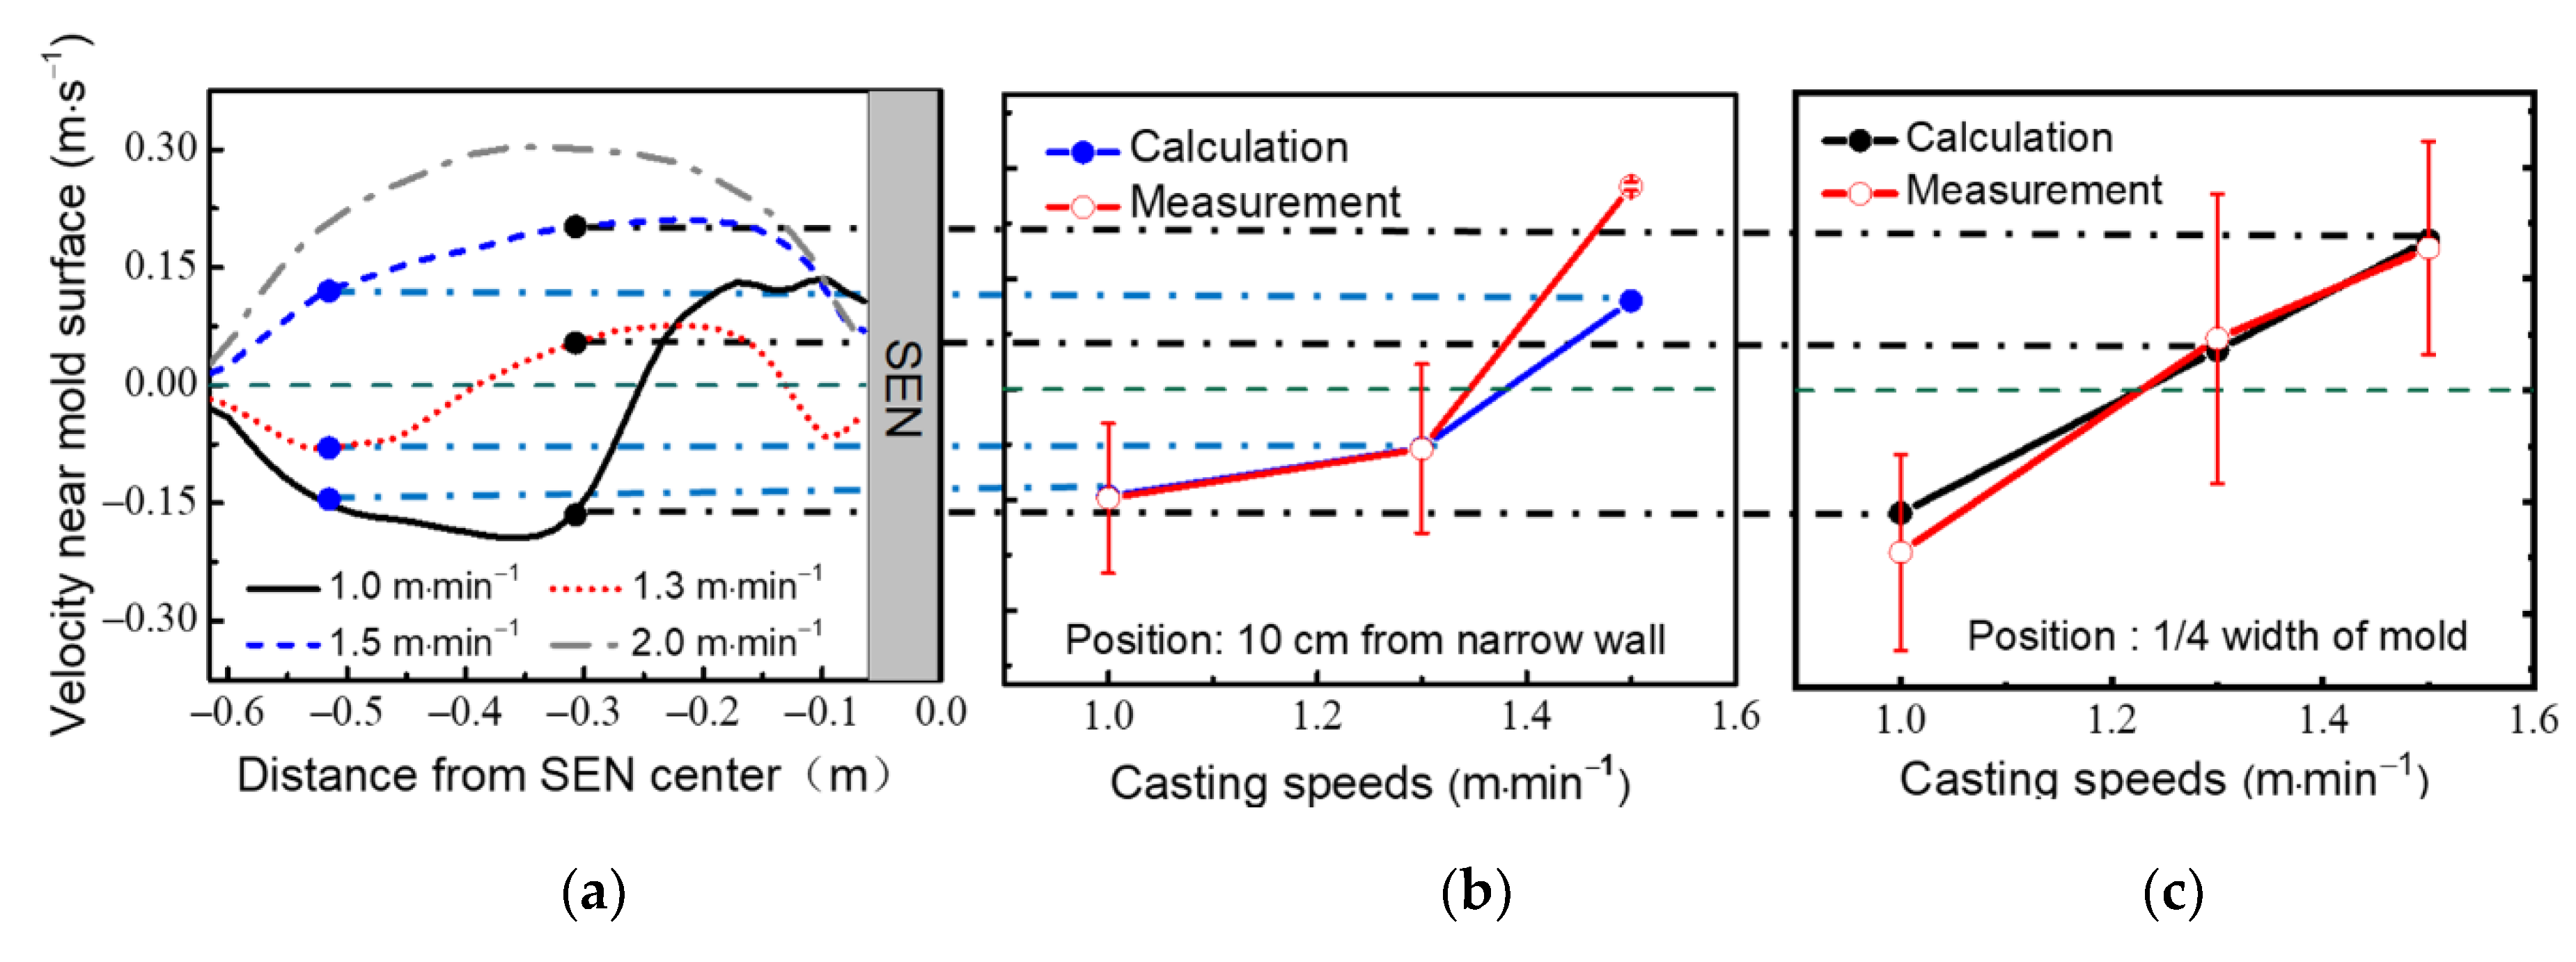
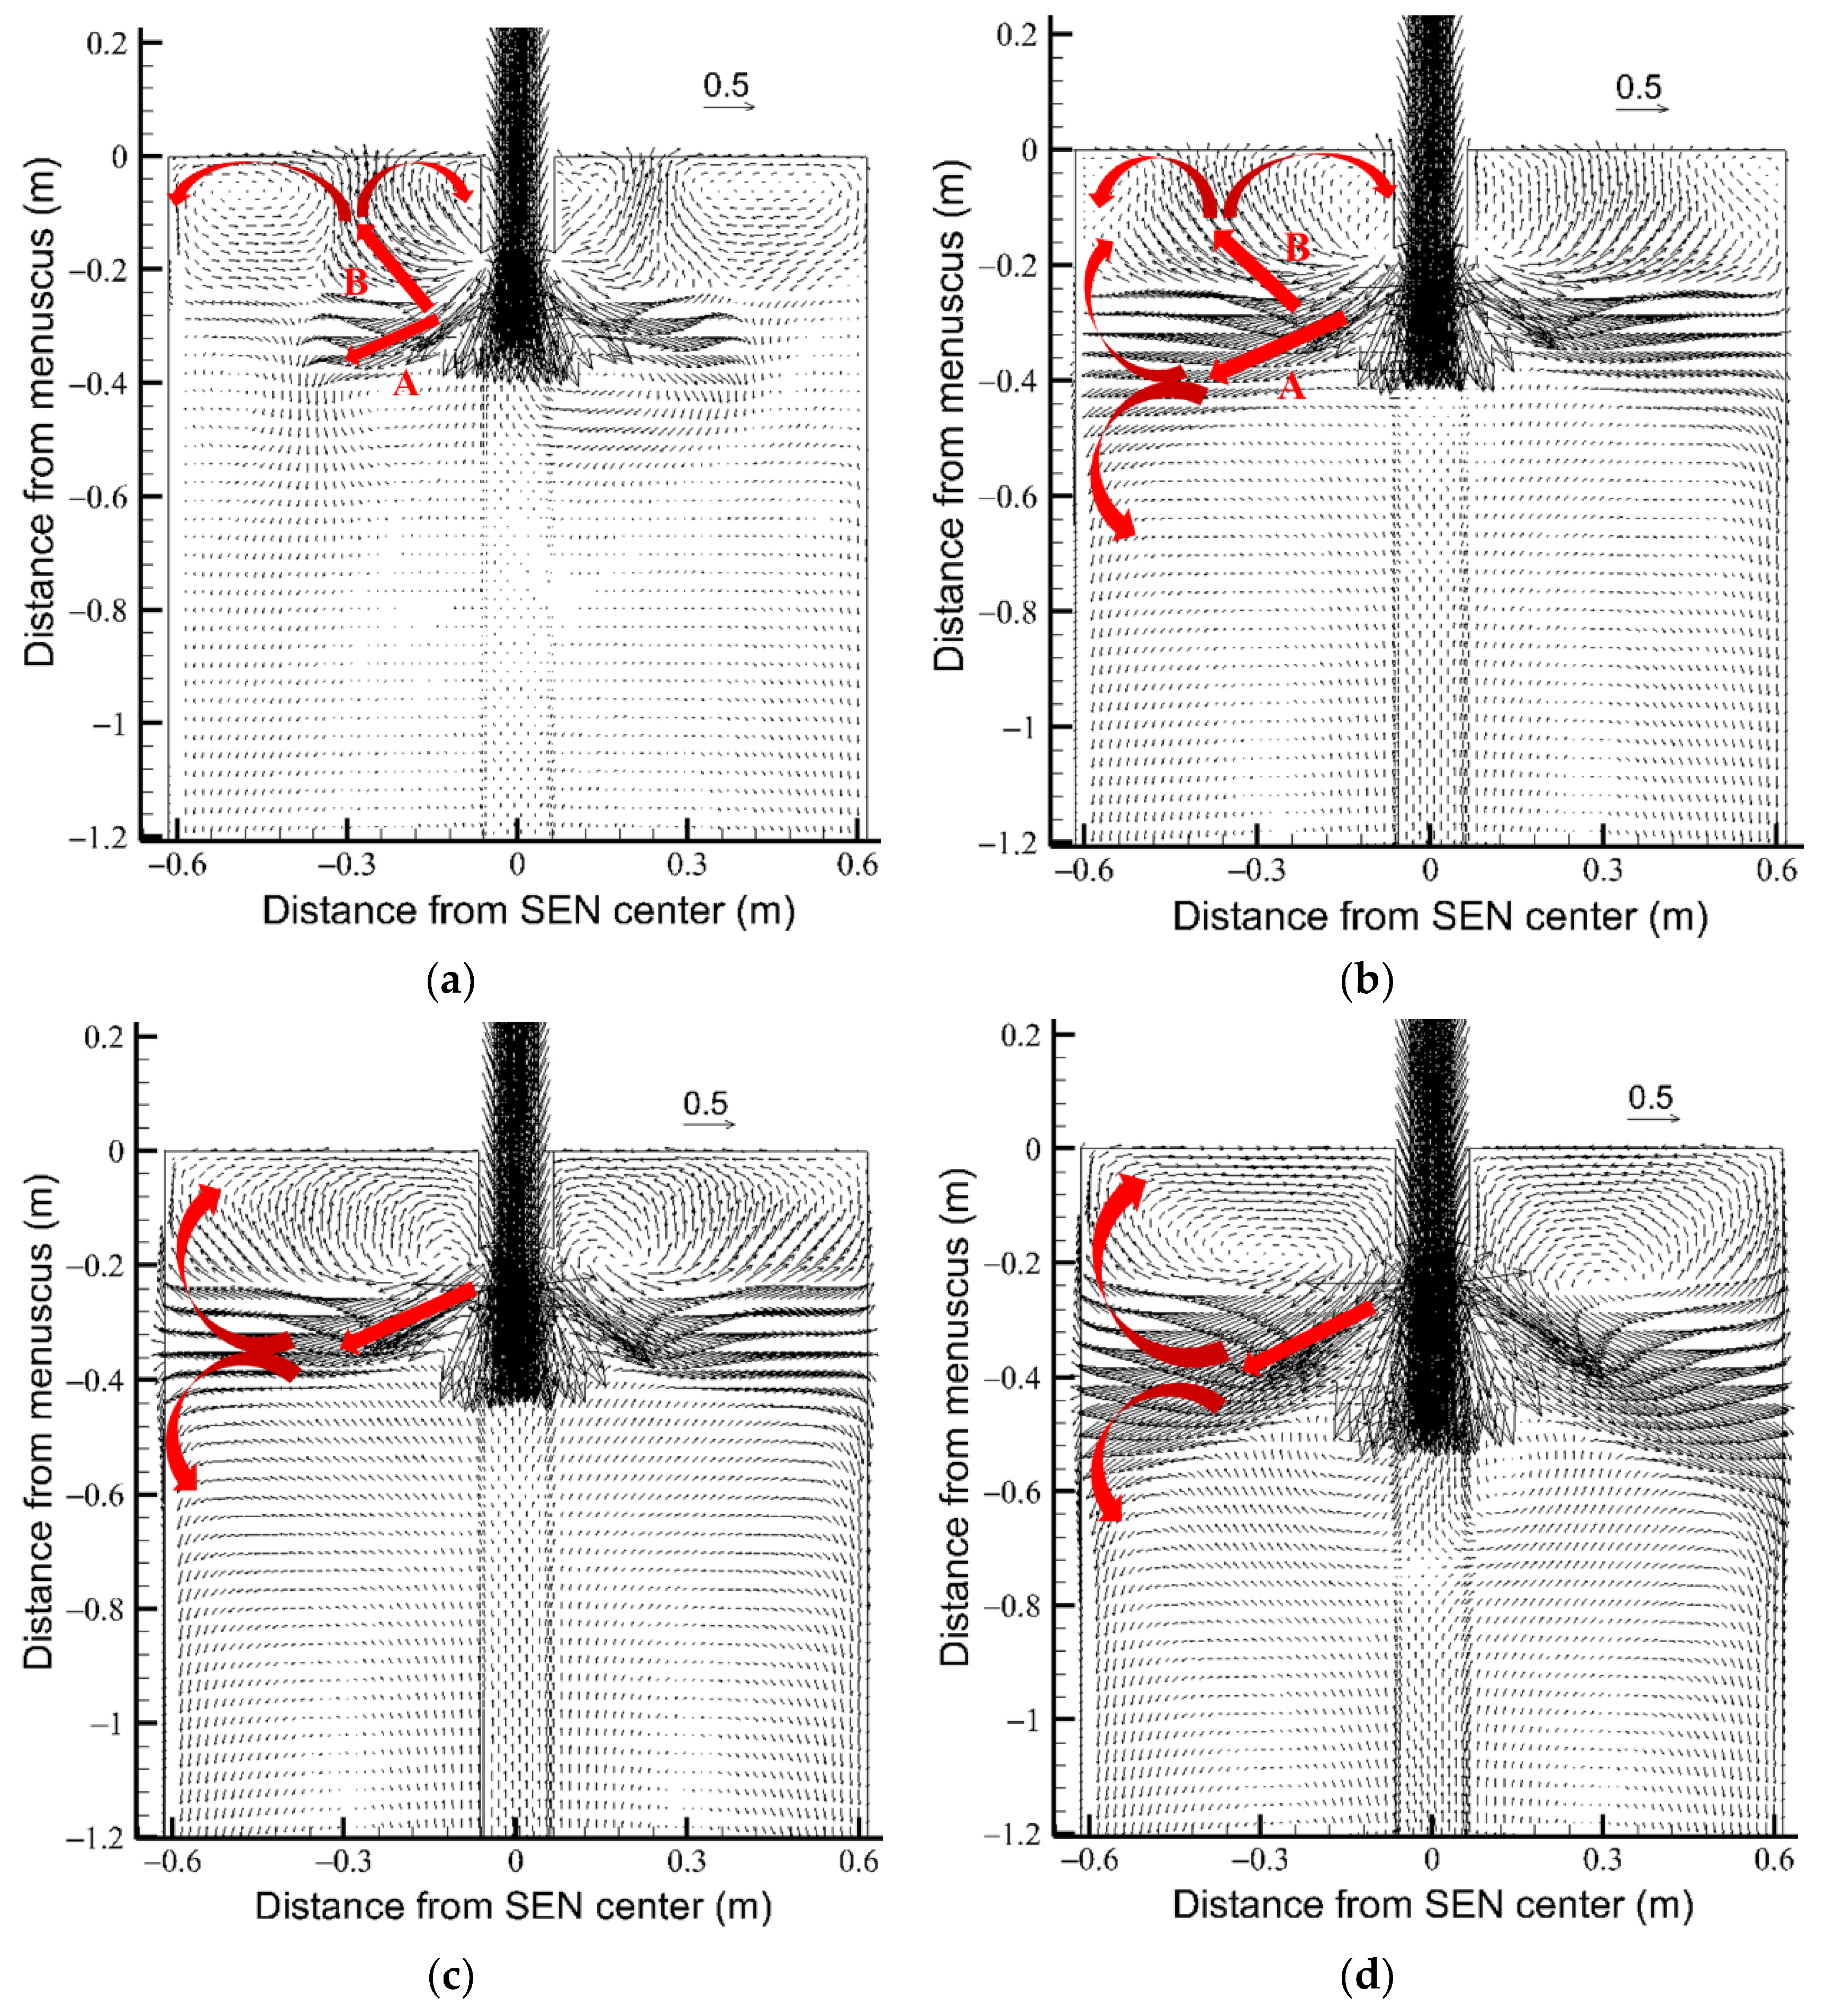
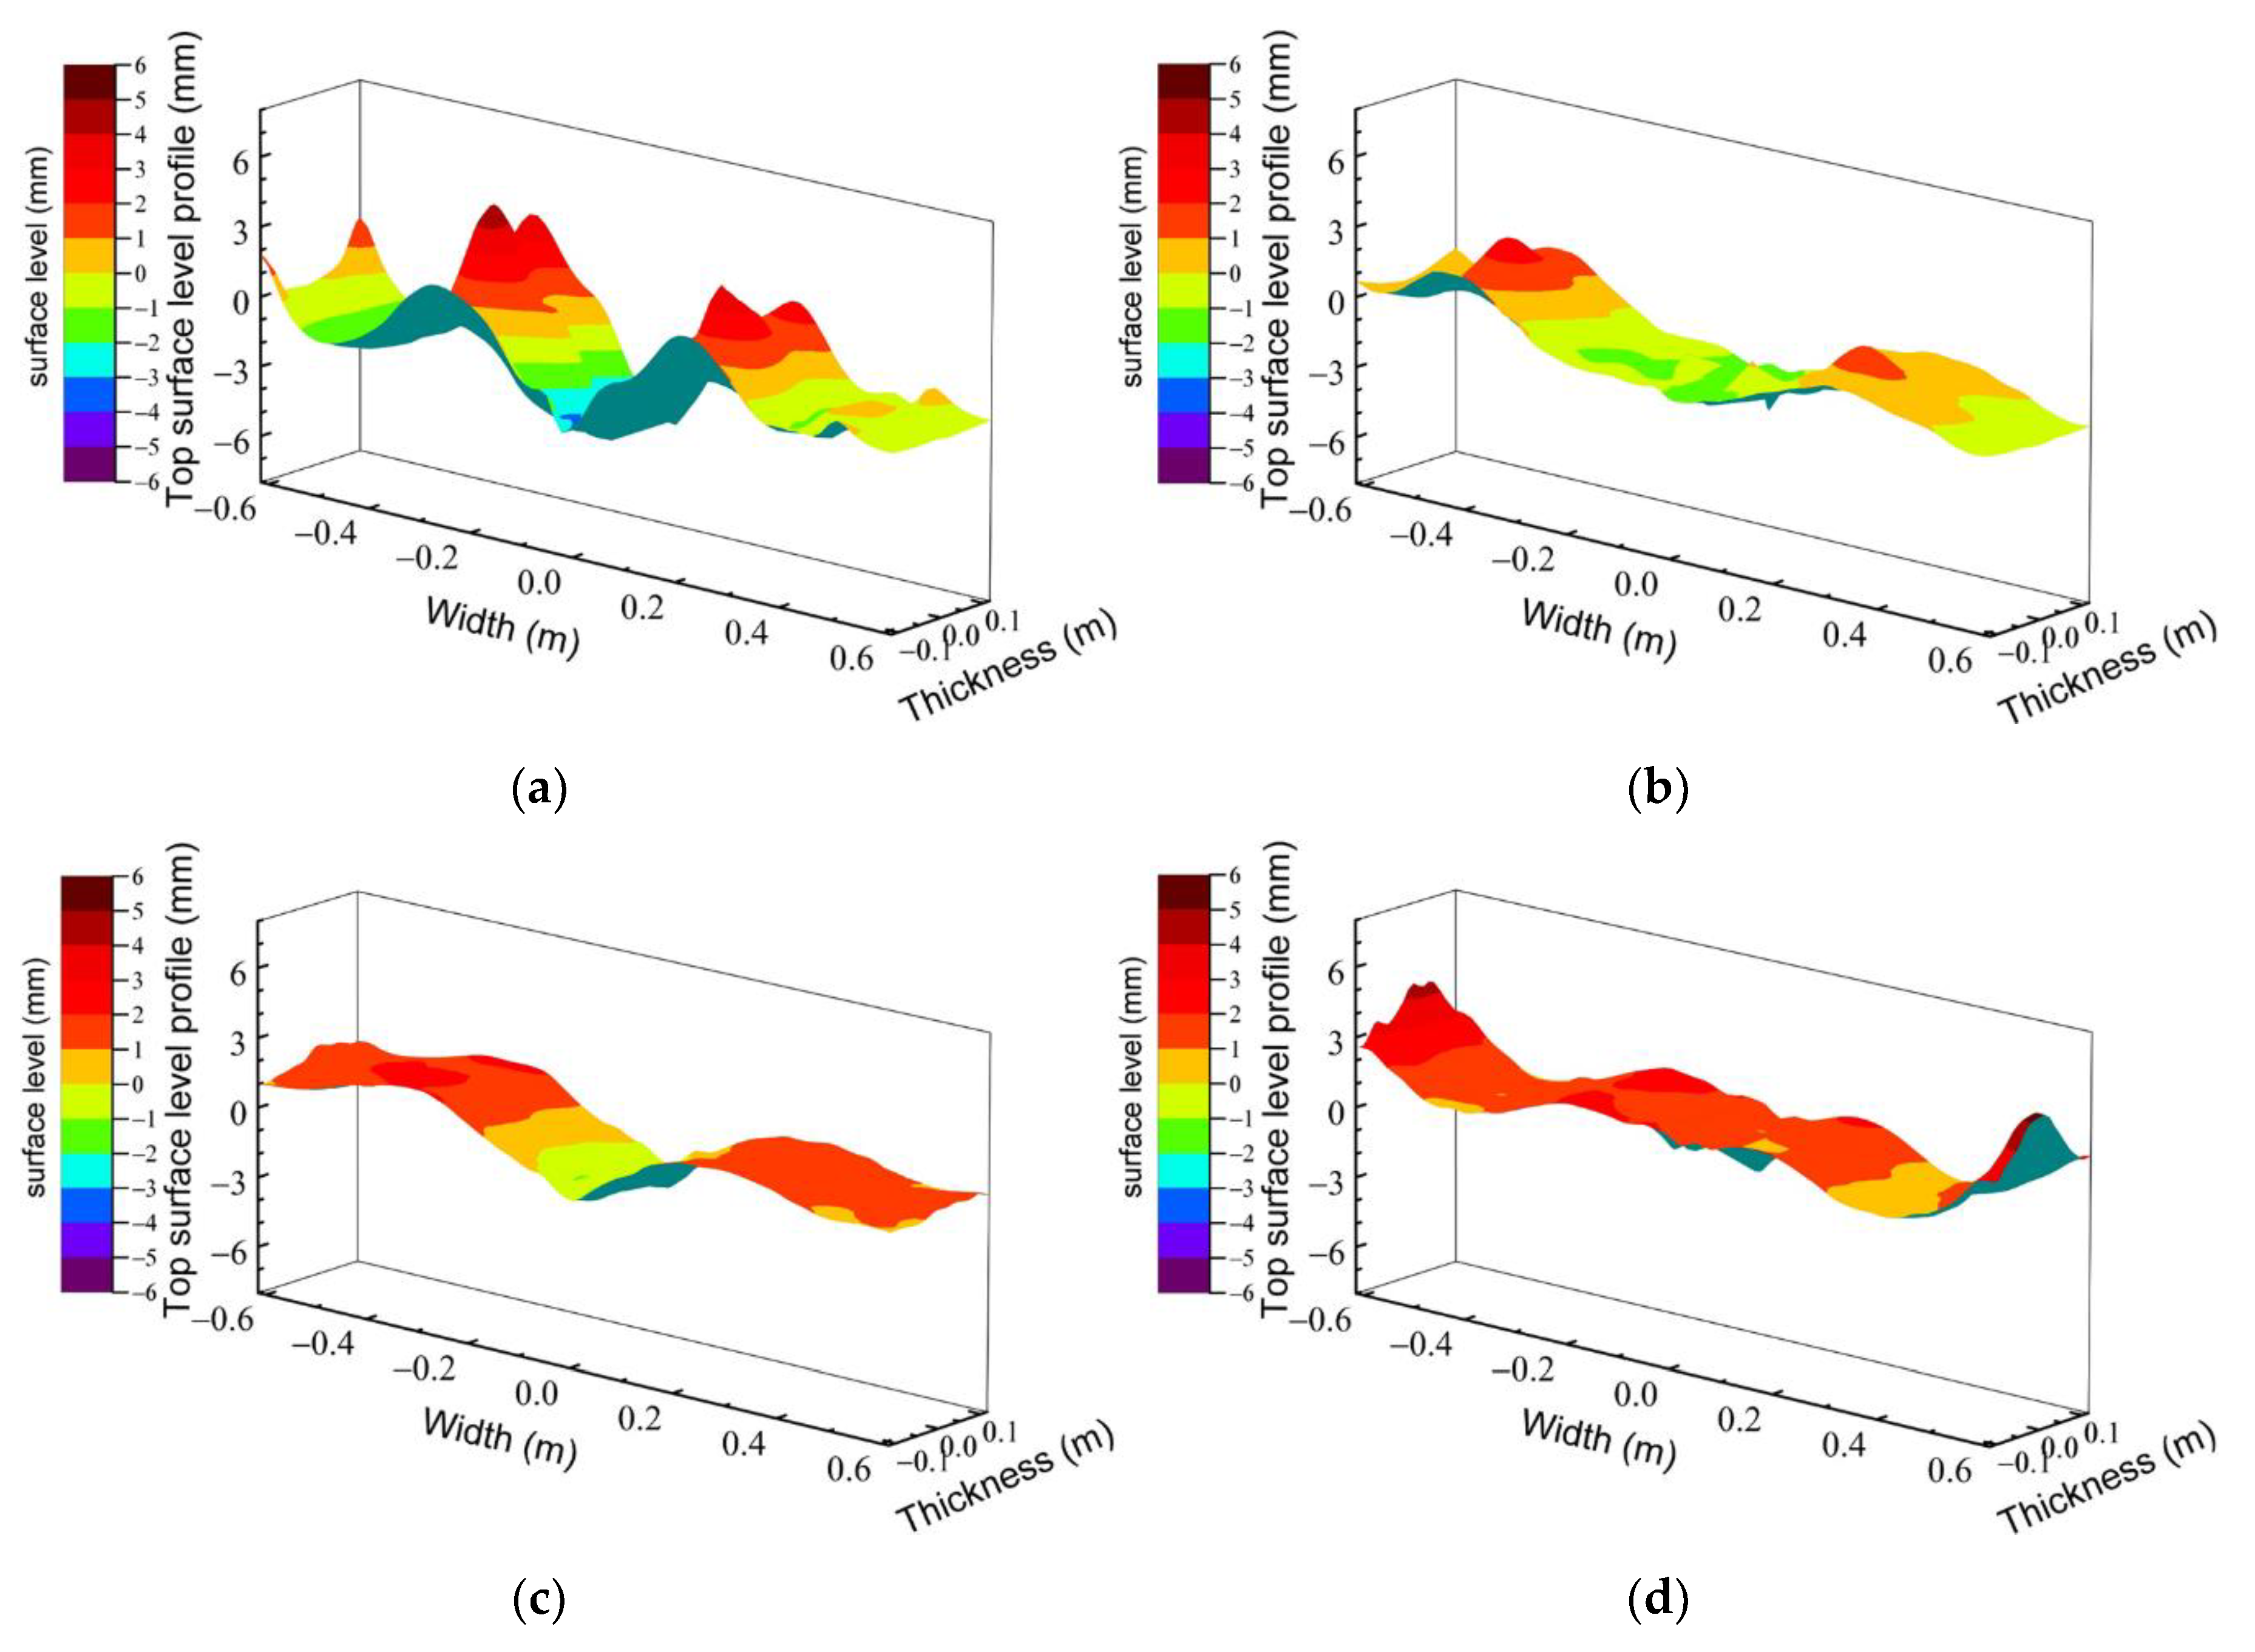
4.1. Effect of Casting Speeds

Figure 2 is the comparison of the calculated and measured surface velocities at different casting speeds under the fixed conditions that the mold width is 1230 mm, the argon gas flow rate is 4 L/min, the SEN submergence depth is 170 mm, and SEN port angle is −20°. Figure 2a shows the effect of the different casting speeds on the velocities of molten steel near mold surface along the mold thickness center plane. The results show that the velocities near mold surface increase with increasing casting speed because of increasing mean velocity of molten steel exiting SEN ports and lowering the argon gas volume fraction, which encourage higher surface velocities [28].
Under the same process parameters, the transient model of molten steel and argon gas using coupled the URANS model and Lagrangian DPM model was validated by comparing the predicted surface velocities with the measured values from the rod deflecting method for measuring velocities near the mold surface. The comparison of calculated and measured velocities near the mold surface with different casting speeds at 10 cm from a narrow wall is shown in Figure 2b, and the comparison at 1/4 width of mold is shown in Figure 2c. In the figure, the red symbols are the mean velocities from the rod deflecting method, and the error bars indicate the standard deviation. Because it is difficult to increase the casting speed to over 1.5 m/min in the actual field, the maximum casting speed in measurement is 1.5 m/min. The results show that a very good match is obtained between simulated surface velocities and the measured results from the rod deflecting method near the mold surface.
Figure 3 shows the flow patterns of simulated molten steel along the mold thickness center plane at the different casting speeds. When the casting speed is 1.0 m/min, an SRF can be seen in Figure 3a. Molten steel jet exiting from the SEN port is divided into two parts, A and B. Part A is so weak that it does not have enough energy to impact the narrow wall of the mold. Under the action of the bubble floatation, part B moves up to the meniscus where it splits into two parts. A recirculation region is found near the narrow wall, which is easy to entrap mold powder into the molten steel and forming serious surface defects if captured by the solidified shell.
The result in Figure 3b indicates that, when the casting speed is increased to 1.3 m/min, the flow pattern transforms from SRF to UF. Part A has enough energy to impact the narrow wall and splits into two parts. Part B moves to the meniscus, but the impact point is just close to 1/4 width of mold. In addition, the recirculation region at the corner of mold becomes small.
When the casting speed exceeds 1.3 m/min as shown in Figure 3c,d, the flow pattern l in the mold is the typical DRF under the present process parameters. There are some subtle differences in the flow field between 1.5 m/min and 2.0 m/min. For the slower speed of 1.5 m/min, the steel jet has a smaller inclination and the upper recirculation zone shrinks to a very small region near the nozzle. The flow pattern of molten steel in the mold tends to be stronger DRF with the higher casting speeds of 2.0 m/min.
The top surface level of mold is important because it can reflect the stability of the flow field in the mold and affect the ability of the molten mold powder to fill into the interfacial gap between the mold copper plate and solidified shell, which has a great influence on the surface quality of the final product. Figure 4 shows the top surface levels of mold obtained from the surface pressure results of the simulation. The top surface liquid displacement (h) was estimated from a simple potential energy balance [30]:
h = P i P m e a n ( ρ s t e e l ρ s l a g ) g ,
where Pi is the pressure at the top surface; Pmean is the mean value of the pressure across the entire top surface; ρsteel is the density of molten steel; ρslag is the density of top slag whose value is 3000 kg/m3 [31]; and g is the gravitational acceleration rate.
As indicated in Figure 4, when the casting speed is 1.0 m/min and 1.3 m/min, the flow patterns are SRF and UF, respectively. In addition, the fluctuation of the liquid level is large asymmetrically, especially at the position where the up flow molten steel jet impacts the meniscus. When the casting speed is 1.5 m/min with the flow pattern of DRF, the top surface level is flat symmetrically. However, when casting speed increases to 2.0 m/min with strong DRF, the top surface level near narrow walls is over 5 mm, which means that the liquid slag layer near the narrow surface tends to become thinner [8], so that hinders slag to enter the interfacial gap between the mold copper plate and solidified shell, thereby affecting the surface quality of the slab.
It is seen from Figure 2, Figure 3 and Figure 4 that, when the casting speed is 1.0 m/min, the velocity near the mold surface has a negative value both at 1/4 width of mold and at 10 cm from the narrow wall. This means that the velocity near the mold surface is from a narrow wall to the SEN. The flow pattern is SRF and the fluctuation of the liquid level is large asymmetrically. When the casting speed is 1.3 m/min, the velocity near the mold surface has a negative value at 10 cm from the narrow wall. The flow pattern is UF and the fluctuation of the liquid level is also large asymmetrically. At the casting speed of 1.5 m/min, the flow pattern is DRF and the top surface level is flat symmetrically. Therefore, this casting speed is favorable [13] to the good surface quality of automobile exposed panel under the conditions that the mold width is 1230 mm, the argon gas flow rate is 4 L/min, the SEN submergence depth is 170 mm, and SEN port angle is −20°.

4.2. Effect of Argon Flow Rates

Argon gas is injected into the mold by SEN, which prevents clogging of the SEN ports, homogenizes the temperature of the molten steel, and promotes the flotation of inclusions in the mold [32,33]. Meanwhile, argon gas also affects the flow pattern of molten steel in the mold. Figure 5 is a comparison of the calculated and measured surface velocities at the different argon gas flow rates under the conditions that the mold width is 1230 mm, the casting speed is 1.5 m/min, and the SEN submergence depth is 170 mm.
Figure 5a shows the simulated velocities near the surface with the different argon gas flow rate. The results show that the velocities of molten steel near the mold surface decrease with increasing the argon gas flow rate. When the argon gas flow rate was as large as 15 L/min, it was so large that the velocity measuring rod deflects greatly to adhere to the narrow wall of mold, and the top surface level fluctuation was also so large that the serious problems of slab surface quality might be arisen, so the surface velocities at 10 cm from the narrow wall was unable to be measured according to the requirement of the steel plant. The calculated results are in good agreement with the measured results as shown in Figure 5b,c.
When the argon gas flow rate is increased from 1 L/min to 4 L/min, the velocity near mold surface has changed inconspicuously. The reason is that the molten steel jet has larger inclination with the smaller argon gas flow rate as shown in Figure 6a, b, which means that the molten steel jet needs to travel a longer distance to reach the meniscus with more dynamic energy dissipation. When the argon gas flow rate is 10 L/min and 15 L/min, the velocities near the mold surface become negative values which mean the flow direction is from SEN to the narrow wall, and indicate that the flow pattern of molten steel in the mold is changed from DRF to SRF.
Figure 6 shows the simulated flow patterns of molten steel in the mold at the different argon gas flow rates. When the argon gas flow rate is 1 L/min and 4 L/min, the flow pattern in the mold is DRF. However, when the argon gas flow rate is increased to 10 L/min, a significant transformation from DRF to SRF is observed in the flow pattern as shown in Figure 6c. Figure 6d presents a stable SRF, when argon gas flow rate is further increased to 15 L/min. It is noted that a stronger SRF pushes the liquid slag towards the narrow walls and entraps slag droplets, which tend to bring about the sliver and blister defects in the final cold rolled product [6].
Figure 7 is the top surface level profile with the different argon gas flow rates. The top surface level fluctuation symmetrically increases with increasing the argon gas flow rate. The top surface level fluctuation is small and symmetrical when the argon gas flow rate is 1 L/min as shown in Figure 7a, but too small argon flow rate is disadvantageous for preventing nozzle clogging and the removal of the inclusions by bubble floatation. Figure 7c shows that, when argon gas flow rate is 10 L/min, the level fluctuation at the position of near the SEN and up flow molten steel jet impact point is over 5 mm. Figure 7d shows that, when the argon gas is 15 L/min, the liquid level fluctuation near SEN exceeds 8 mm, which not only causes the molten slag to be entrapped into the molten steel, but, more seriously, it may cause the secondary oxidization of the molten steel by opening the slag layer near the nozzle. The liquid level fluctuations on the left and right sides of the mold show severe asymmetry.
From Figure 5, Figure 6 and Figure 7, under the conditions that the mold width is 1230 mm, the casting speed is 1.5 m/min and the SEN submergence depth is 170 mm, when the argon gas flow rate is 1 L/min and 4 L/min, the velocity near the mold surface has a moderate value, and the flow pattern in the mold is DRF and the top surface level fluctuation is small and symmetrical, which is favorite to the good surface quality of automobile exposed panel [8,34,35,36,37].

4.3. Effect of SEN Submergence Depths

The SEN submergence depth is also an important parameter that influences the fluid flow patterns. Figure 8 is a comparison of the calculated and measured surface velocities at 1/4 width of mold with the different SEN submergence depths under the conditions that the mold width is 1230 mm, the casting speed is 1.5 m/min, and the argon gas flow rate is 4 L/min. Because it is easy to cause defects in the surface quality of the slab with the shallow submergence depths of SEN, the minimum submergence depth of SEN is 140 mm during the measurement according to steel plant requirements. In addition, there was not also enough time to measure the surface velocities at 10 cm from the narrow wall due to the production planning. The results show that the velocities near mold surface firstly increase and then decrease with increasing SEN submergence depth. The calculation results are in good agreement with the measurement results, both in trend and value.
Figure 8a shows the simulated velocities near mold surface with the different SEN submergence depths. The results show that the surface velocities firstly increase and then decrease with increasing SEN submergence depth from 110 mm to 200 mm. This can be argued that the higher velocities near mold surface are obtained when the SEN submergence depth is increased from 110 mm to 170 mm because of the incomplete development of the flow field in the upper circulation zone under the influence of bubble floatation at the shallower immersion depth [38]. However, when the SEN submergence depth is further increased from 170 mm to 200 mm, the velocities near the mold surface decrease. This is because, when the SEN submergence depth is over 170 mm, there is enough room for upward flow to fully develop a complete circulation zone.
As shown in Figure 9, DRF is obtained when the SEN submergence is 200 mm, 170 mm, and 140 mm, but the DRF is weak with the SEN submergence depth of 140 mm because the upper circulation zone and the velocities near mold surface are small. The flow pattern of molten steel in the mold transforms from DRF to UF when the SEN submergence depth is further decreased to 110 mm. The incomplete upper circulation zone not only reduces the velocities near the mold surface but also changes the flow pattern of molten steel in the mold.
The results in Figure 10 show that the top surface level fluctuation become flat and symmetrical with the SEN submergence depth increased to 200 mm. The SEN submergence depth should be reasonably controlled to form a stable DRF of the molten steel in the mold.
From Figure 8, Figure 9 and Figure 10, under the conditions that the mold width is 1230 mm, the casting speed is 1.5 m/min and the argon gas flow rate is 4 L/min, when the SEN submergence depth is 110 mm, the flow pattern is UF, which is not beneficial to the surface quality of automobile exposed panel [15]. When the SEN submergence depth is changed from 110 mm to 140 mm, the top surface level fluctuation becomes large. When the SEN submergence depth is changed from 140 mm to 170 mm, the top surface level fluctuation becomes larger, and the velocities near the mold surface increase. When the SEN submergence depth is increased to 200 mm, the velocities near the mold surface decrease, and the top surface level fluctuation become small, which is most likely to favor the surface quality of automobile exposed panel in the present conditions.

5. Conclusions

In the present paper, the effects of the casting speeds, the argon gas flow rates, and the submergence depths of the submerged entry nozzle (SEN) on the velocities near the mold surface, the flow patterns and the top surface level fluctuation in the mold with the medium width of 1230 mm were investigated with the mathematical modeling and high-temperature measurements of the velocities near the mold surface. The conclusions are summarized as follows:
(1)
The rod deflecting method for measuring velocities near the mold surface is a simple and effective method to investigate the velocities near the mold surface and the flow patterns of molten steel. The measured results of the velocities near the mold surface are in good agreement with the calculated results for the different casting speeds, argon gas flow rates, and submergence depths of the SEN.
(2)
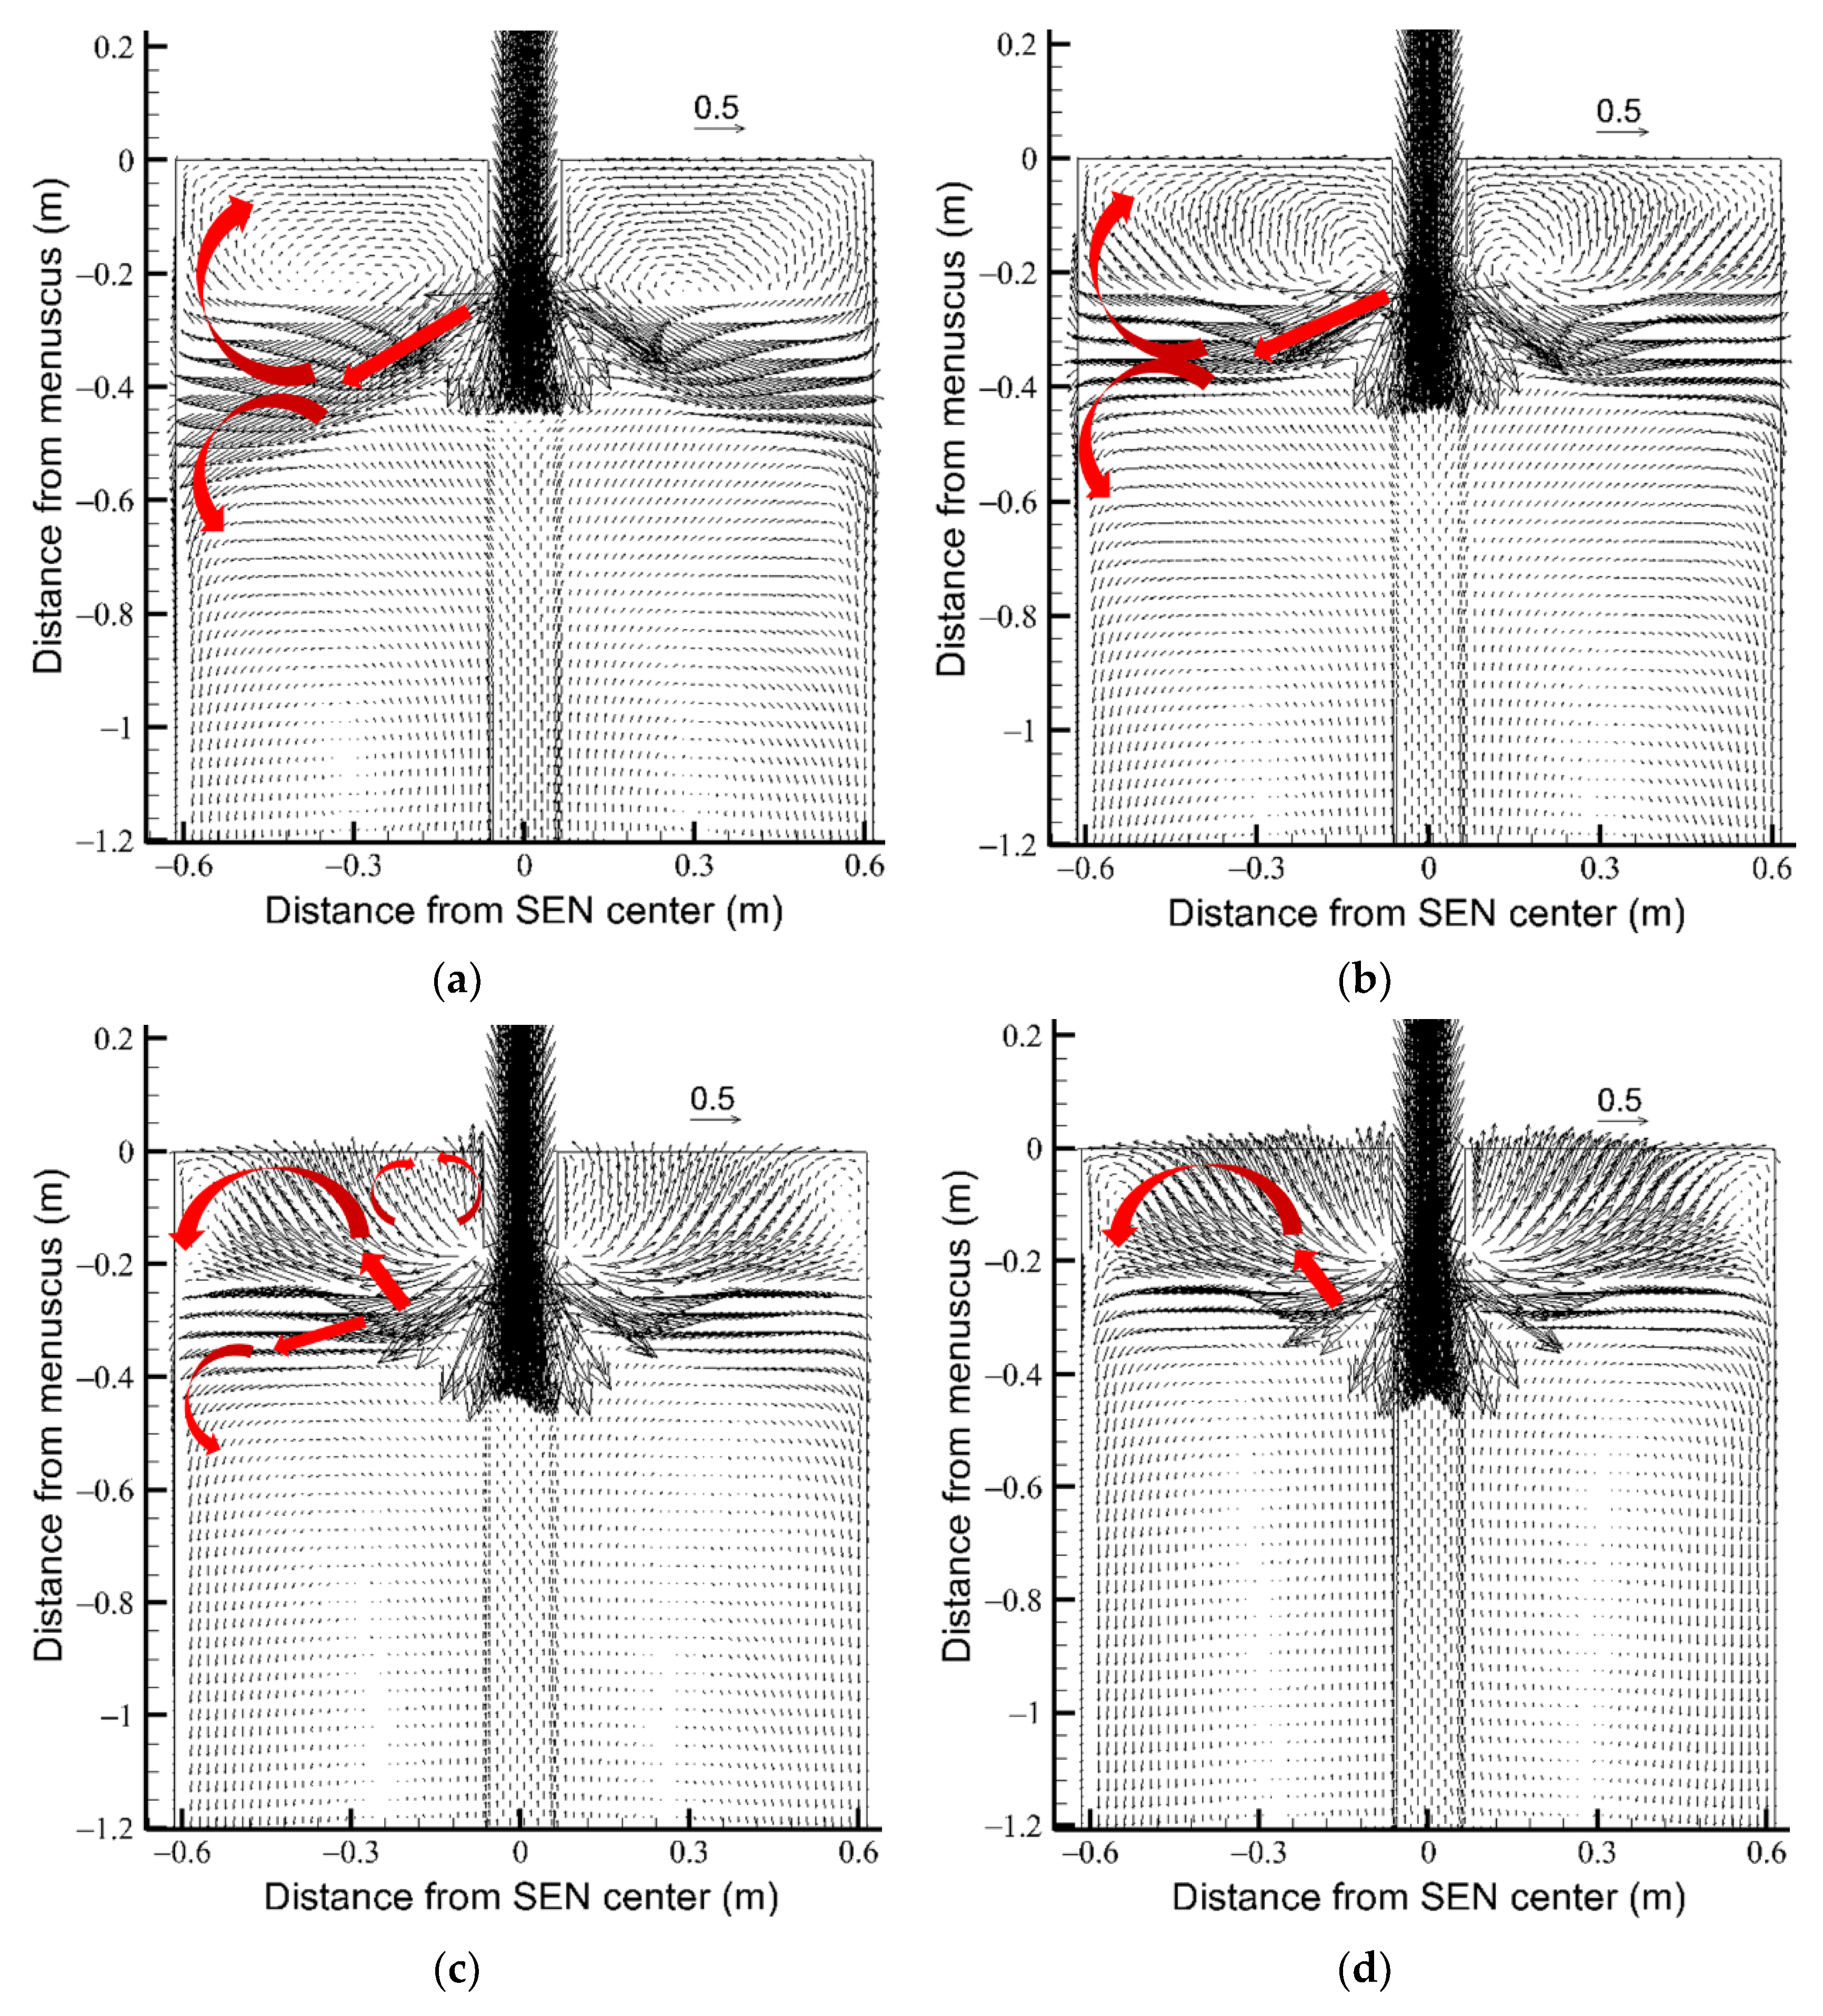
The velocities of molten steel near the mold surface increase with increasing the casting speeds. When the casting speed is 1.0 and 1.3 m/min, the flow pattern in the mold is single-roll flow (SRF) and unstable flow (UF), respectively, both with the large top surface level fluctuations. When the casting speed is 2.0 m/min, although the flow pattern in the mold is double-roll flow (DRF), there are large top surface level fluctuations near the narrow wall. At the casting speed of 1.5 m/min, the flow pattern is DRF and the top surface level is small and symmetrical.
(3)
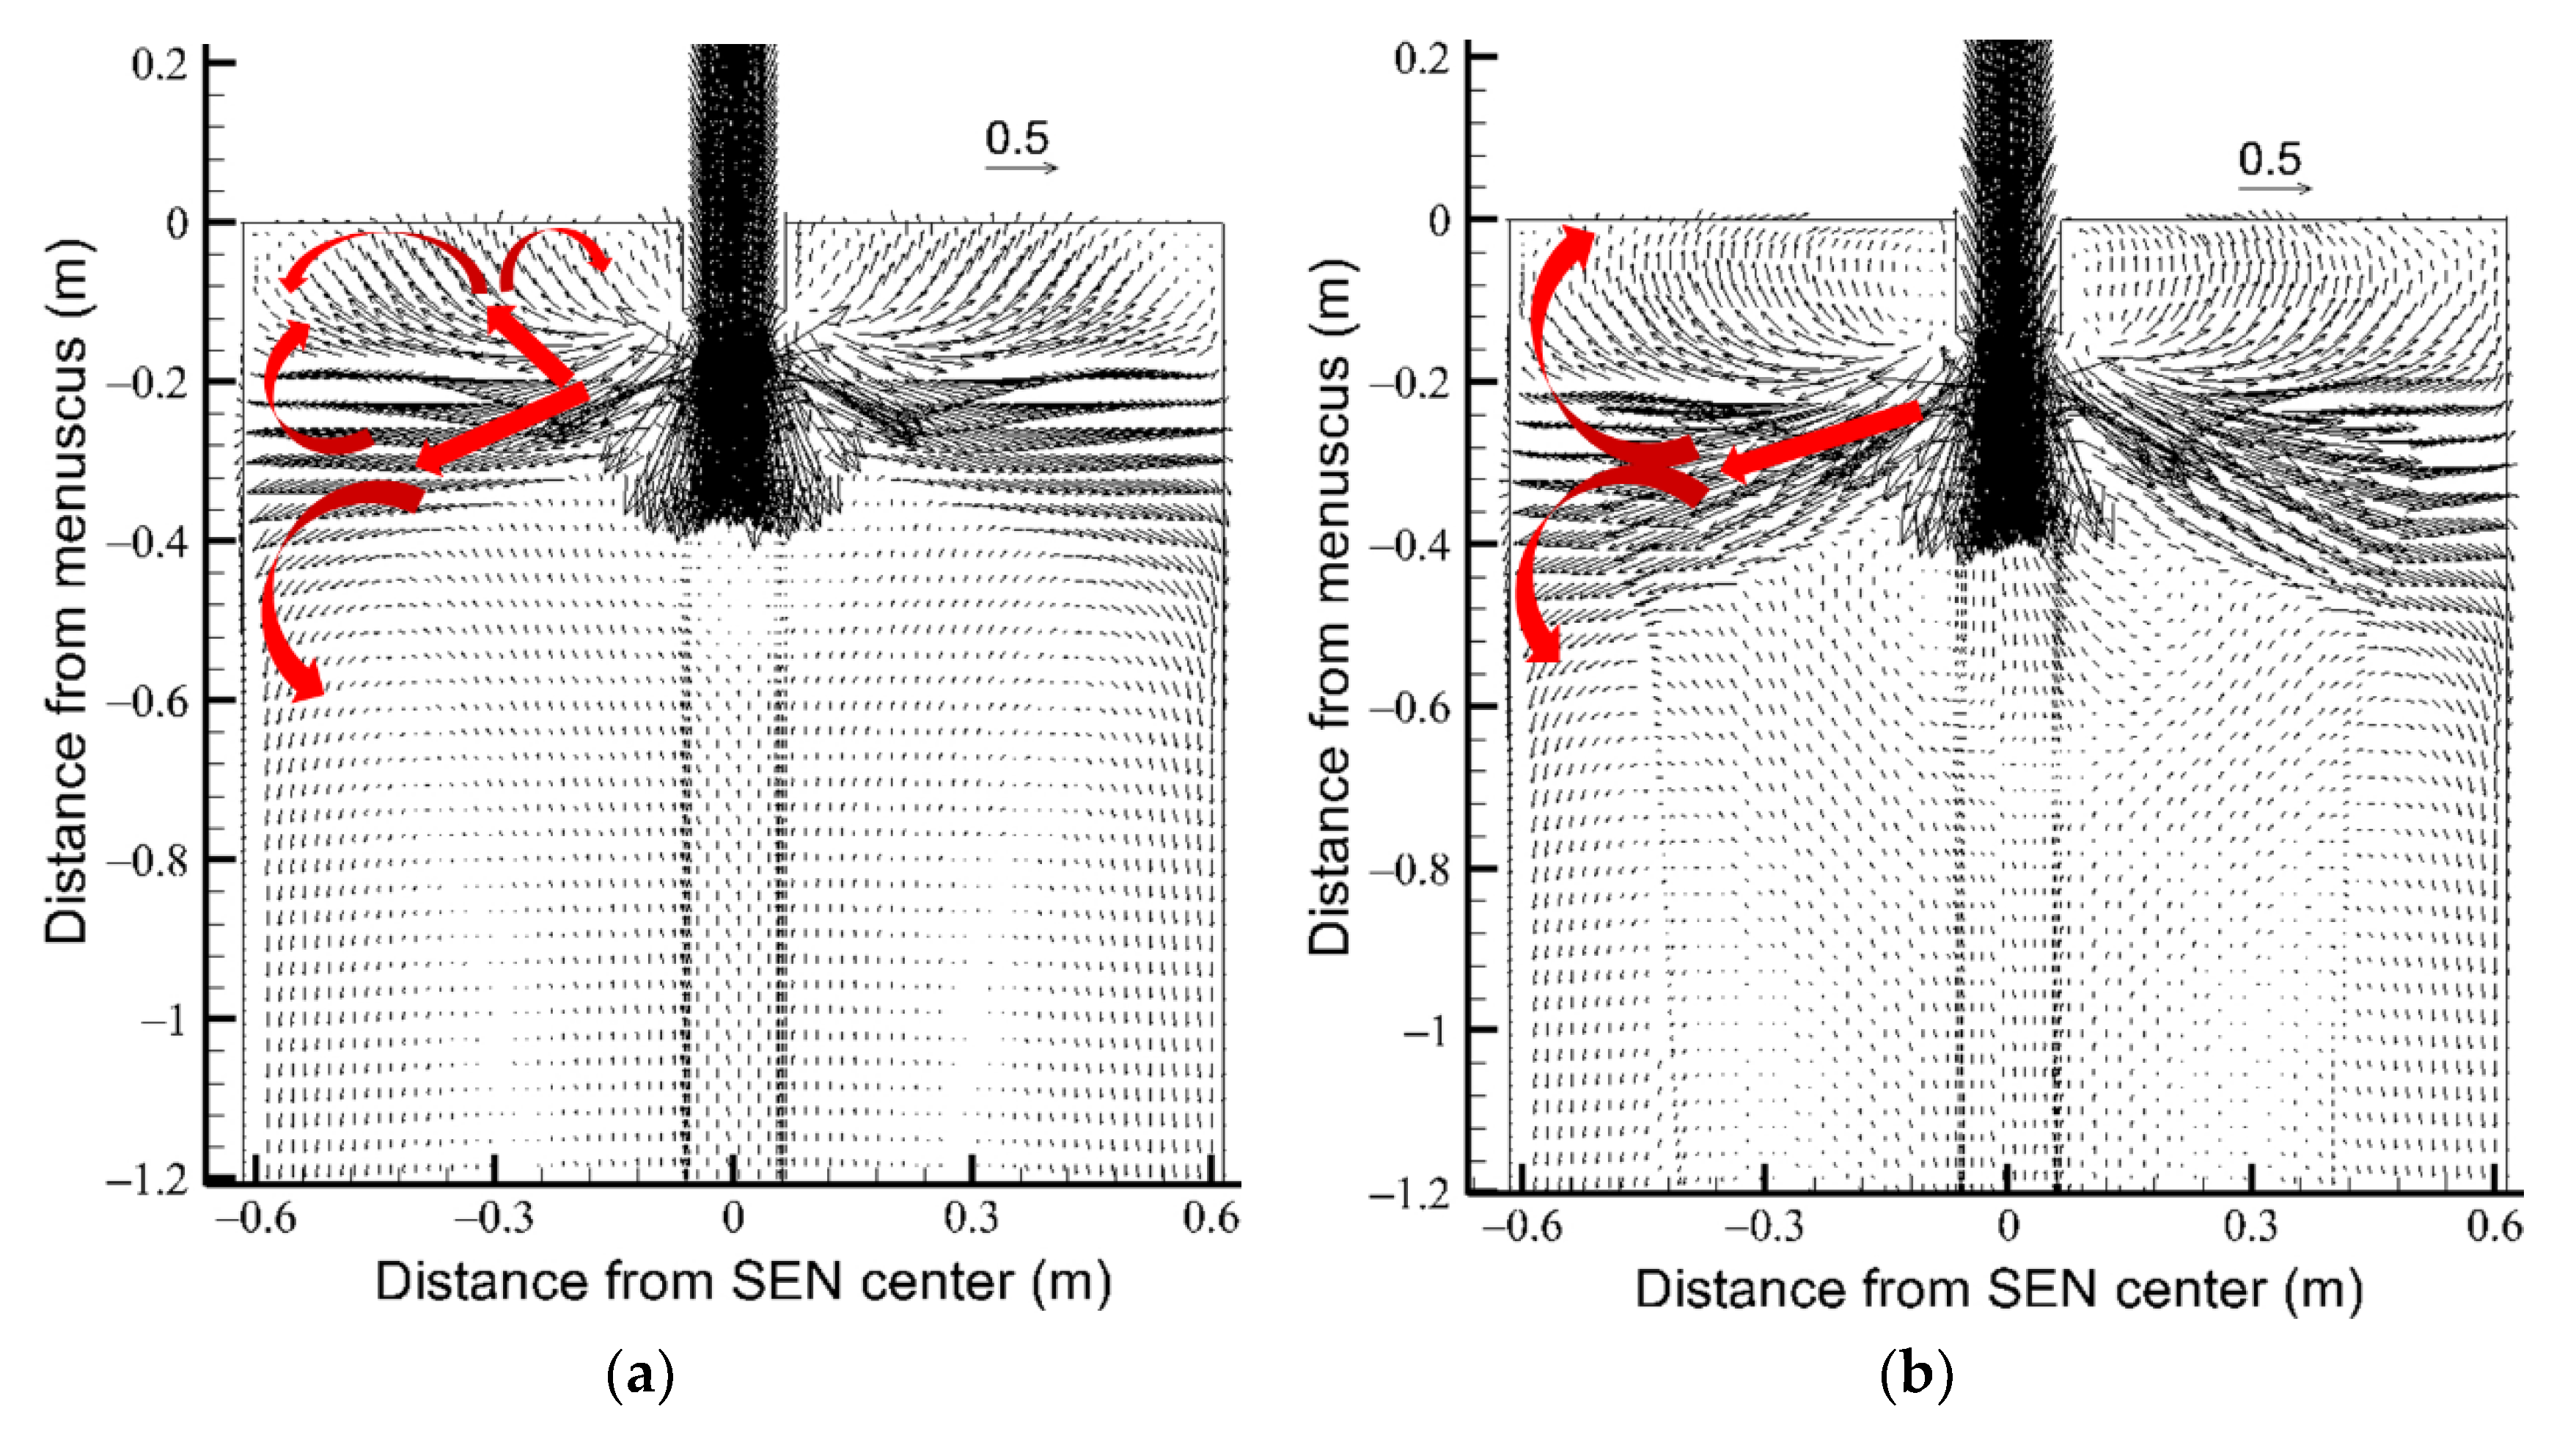
The velocities near the mold surface decrease with increasing the argon gas flow rates. When argon gas flow rate is 10 and 15 L/min, the flow patterns in the mold are both SRF with the large top surface level fluctuations near the SEN. When the argon gas flow rate is 1 and 4 L/min, the velocity near the mold surface has a moderate value, and the flow pattern in the mold is DRF and the top surface level fluctuation is small and symmetrical.
(4)
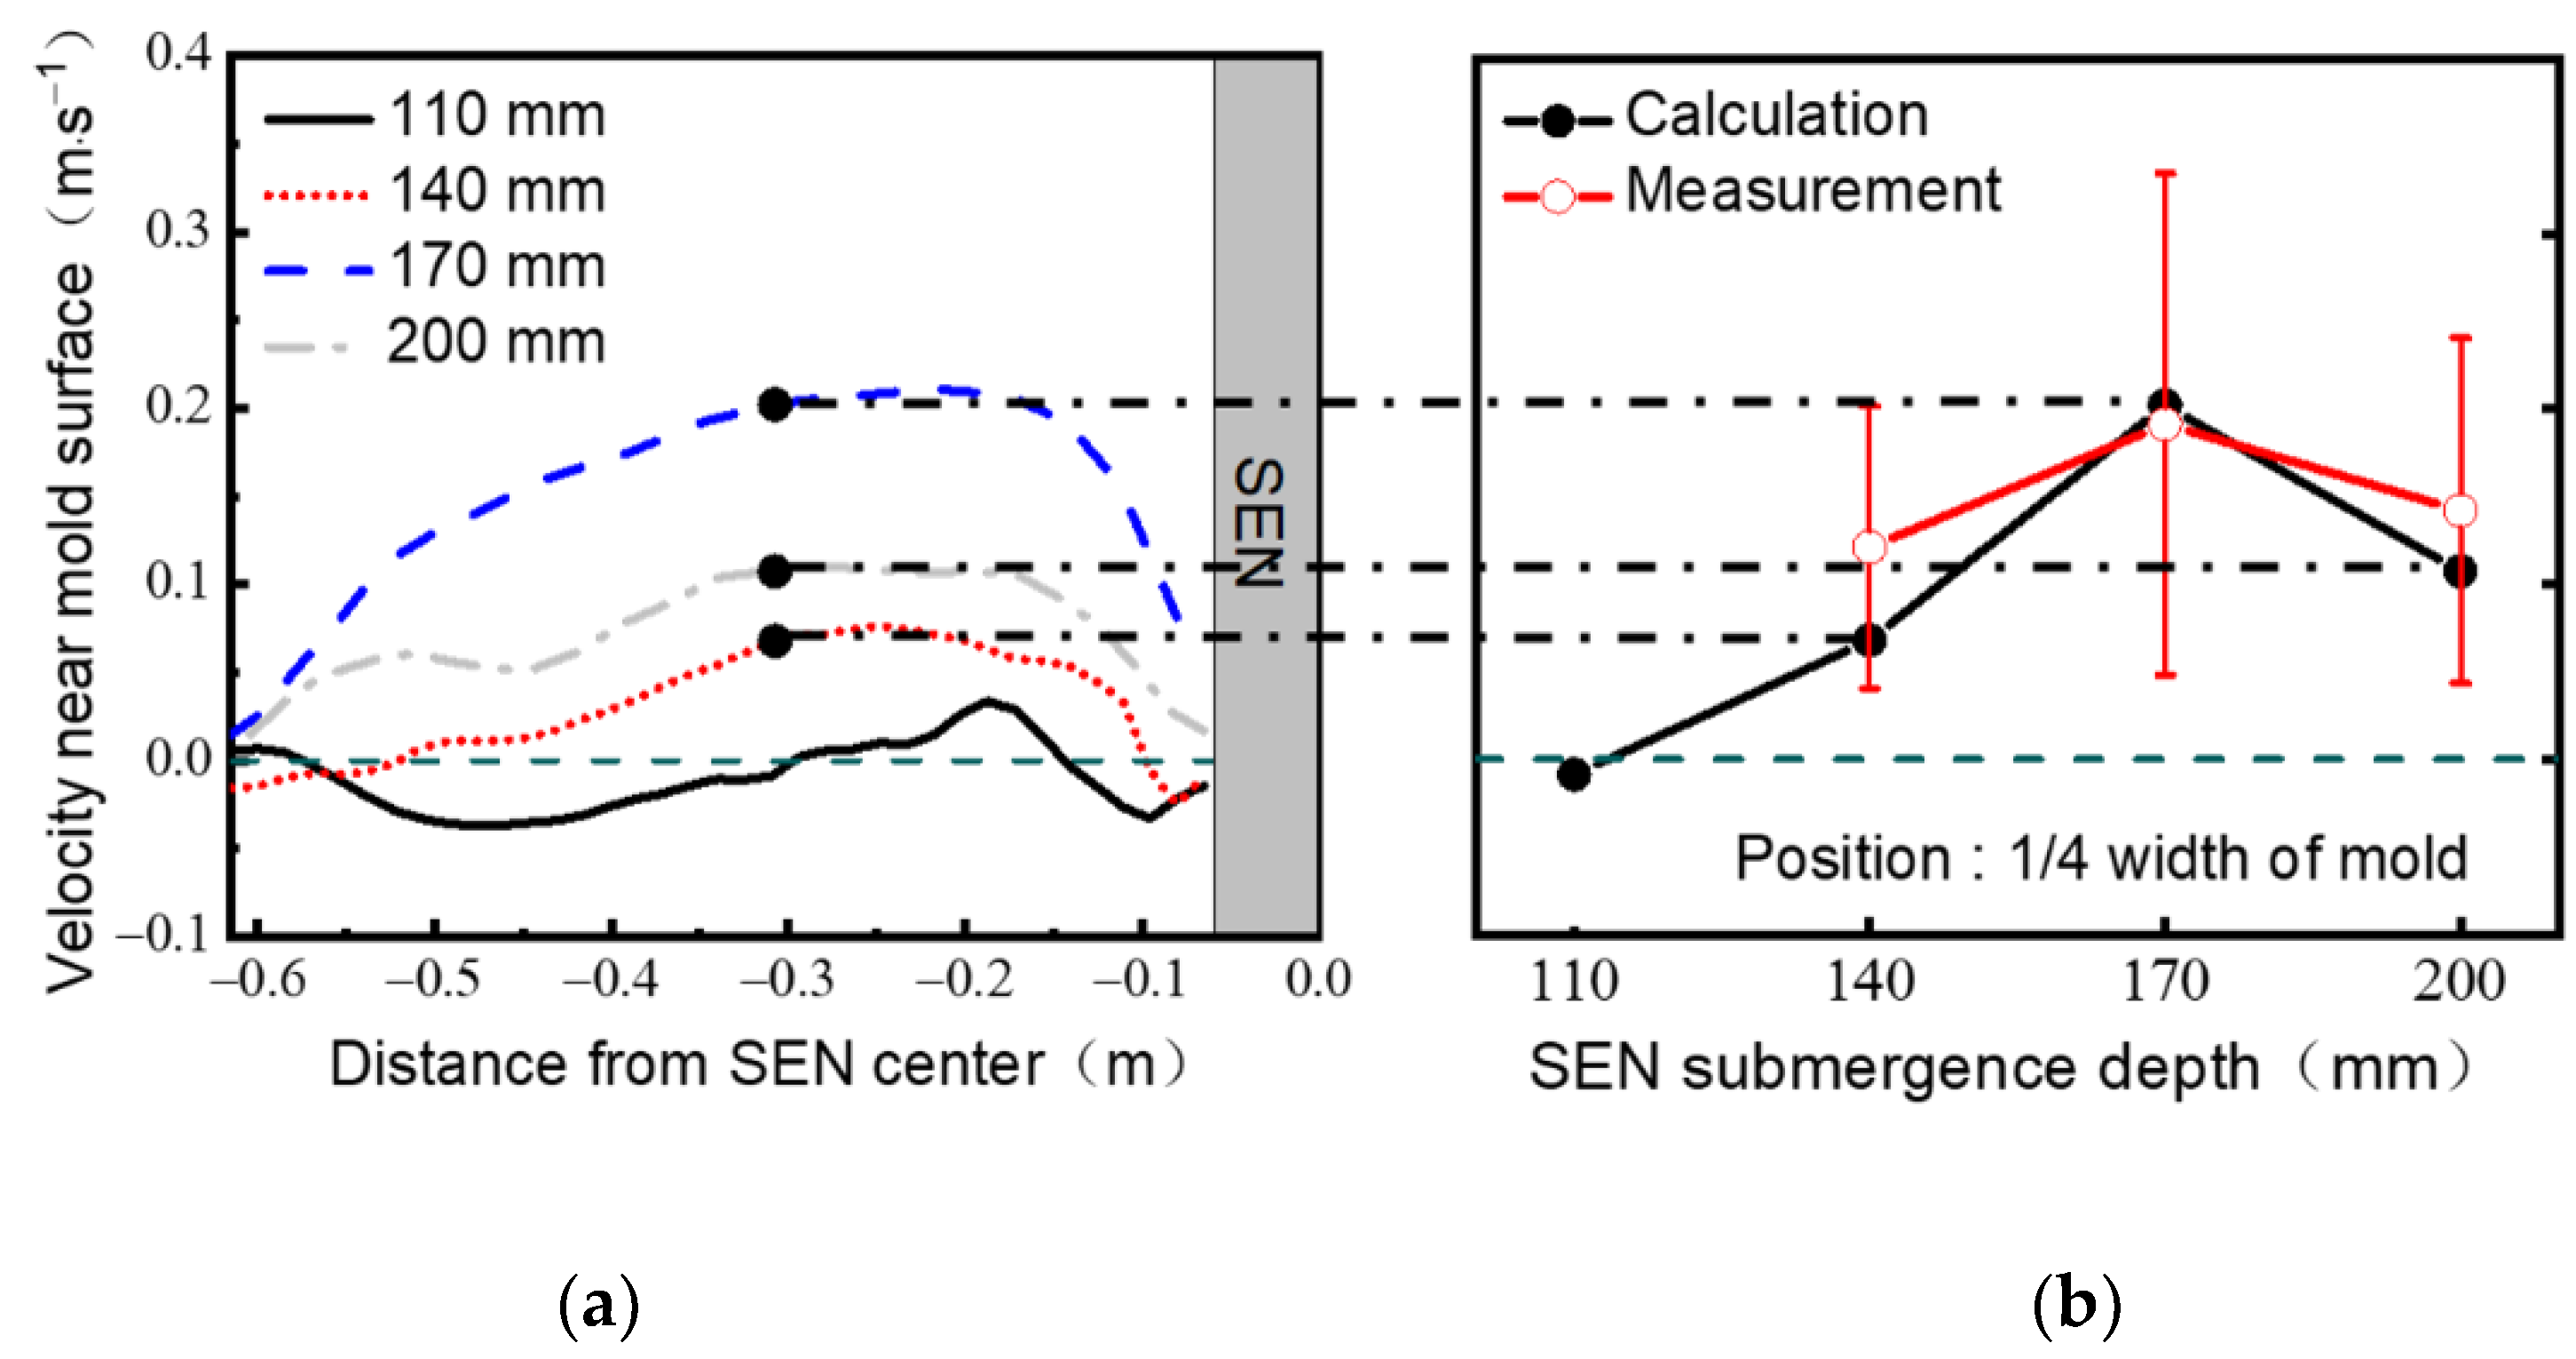
When the SEN submergence depth is 110 mm, the flow pattern is UF. When the SEN submergence depth is increased to 200 mm, the velocities near the mold surface decrease, and the top surface level fluctuation becomes small.
(5)
The optimized flow field in the mold can be judged to be favorable to the surface quality of the automobile exposed panel, if the velocities near the mold surface is relatively small, the flow pattern in the mold is DRF, and the top surface level fluctuation is small and symmetrical.

Author Contributions

P.J. and T.Z. reviewed the references and wrote the article. J.Y. as a corresponding author supervised the paper preparation. G.X., H.L., J.Z., and W.Q. assisted in the industrial measurement of velocities near the mold surface. All authors have read and agreed to the published version of the manuscript.

Funding

Support from the Hunan Valin Lianyuan Iron & Steel Co., Ltd.

Conflicts of Interest

The authors declare no conflict of interest.

References

  1. Cui, H.; Wu, H.; Yue, F.; Wu, W.; Wang, M.; Bao, Y.; Chen, B.; Ji, C. Surface defects of cold-rolled Ti-IF steel sheets due to non-metallic inclusions. J. Iron Steel Res. Int. 2011, 18, 335–340. [Google Scholar]
  2. Peng, Q.C.; Yang, J.L.; Peng, S.; Zhang, X.H.; Tang, S.P.; Tian, Y.S. Analysis of linear defects of cold-rolled galvanized sheet. Adv. Mater. Res. 2013, 652, 2034–2037. [Google Scholar] [CrossRef]
  3. Schmidt, K.D.; Friedel, F.; Imlau, K.P.; Jager, W.; Muller, K.T. Consequent improvement of surface quality by systematic analysis of slabs. Steel Res. Int. 2003, 74, 659–666. [Google Scholar] [CrossRef]
  4. Wu, G.R. Effect of mold powder on faint-sliver defect in if cold-rolled steel sheet. Adv. Mater. Res. 2011, 339, 134–139. [Google Scholar] [CrossRef]
  5. Wang, X. Possibility of producing high quality cold rolled coils with thin slab casting production route. Iron Steel 2004, 39, 18–25. [Google Scholar]
  6. Andrzejewski, P.; Köhler, K.U.; Pluschkell, W. Model investigations on the fluid flow in continuous casting moulds of wide dimensions. Steel Res. 1992, 63, 242–246. [Google Scholar] [CrossRef]
  7. Kohler, K.U.; Andrzejewski, P.; Julius, E. Steel flow velocity measurement and flow pattern monitoring in the mould. In Proceedings of the Steelmaking Conference, Warrendale, PA, USA; 1995; pp. 445–449. [Google Scholar]
  8. Kunstreich, S.; Dauby, P.H. Effect of molten steel flow pattern on slab quality and the need for dynamic electromagnetic control in the mould. Ironmak. Steelmak. 2005, 32, 80–86. [Google Scholar] [CrossRef]
  9. Thomas, B.G.; Huang, X.; Sussman, R.C. Simulation of argon gas flow effects in a continuous slab caster. Metall. Mater. Trans. B 1994, 25B, 527–547. [Google Scholar] [CrossRef]
  10. Honeyands, T.; Herbertson, J. Flow dynamics in thin slab caster moulds. Steel Res. 1995, 66, 287–293. [Google Scholar] [CrossRef]
  11. Assar, M.B.; Dauby, P.H.; Lawson, G.D. Opening the Black Box: PIV and MFC Measurements in a Continuous Caster Mold. In Proceedings of the 83rd Steelmaking Conference, Pittsburgh, PA, USA, 26–29 March 2000; Volume 83, pp. 397–411. [Google Scholar]
  12. Zhang, L.; Yang, S.; Cai, K.; Li, J.; Wan, X.; Thomas, B.G. Investigation of fluid flow and steel cleanliness in the continuous casting strand. Metall. Mater. Trans. B 2007, 38B, 63–83. [Google Scholar] [CrossRef]
  13. Dauby, P.H. Continuous Casting: Make Better Steel and More of It! Rev. de Métallurgie Int. J. Metall. 2012, 109, 113–136. [Google Scholar] [CrossRef]
  14. Gupta, D.; Chakraborty, S. Asymmetry and oscillation of the fluid flow pattern in a continuous casting mould: A water model study. ISIJ Int. 1997, 37, 654–658. [Google Scholar] [CrossRef]
  15. Dauby, P.H.; Assar, M.B.; Lawson, G.D. PIV and MFC measurements in a continuous caster mould. New tools to penetrate the caster black box. Int. J. Metall. 2001, 98, 353–366. [Google Scholar] [CrossRef]
  16. Kubo, N.; Ishii, T.; Kubota, J.; Aramaki, N. Two-phase flow numerical simulation of molten steel and argon gas in a continuous casting mold. ISIJ Int. 2002, 42, 1251–1258. [Google Scholar] [CrossRef] [Green Version]
  17. Ramos, I.C.; Morales, R.D.; Garcia-Hernandez, S.; Ceballos-Huerta, A. Effects of immersion depth on flow turbulence of liquid steel in a slab mold using a nozzle with upward angle rectangular ports. ISIJ Int. 2014, 54, 1797–1806. [Google Scholar] [CrossRef] [Green Version]
  18. Morales, R.D.; García-Hernández, S.; Calderón-Ramos, I.; Salazar-Campoy, M.; Barreto, J.D.J. Control of slag-dragging effects at the metal–slag interface through electromagnetic brake in a slab mold. J. Manuf. Sci. Prod. 2015, 15, 119–130. [Google Scholar] [CrossRef]
  19. Asad, A.; Kratzsch, C.; Schwarze, R. Numerical investigation of the free surface in a model mold. Steel Res. Int. 2016, 87, 181–190. [Google Scholar] [CrossRef]
  20. Deng, X.; Ji, C.; Cui, Y.; Li, L.; Yin, X.; Yang, Y.; McLean, A. Flow pattern control in continuous slab casting moulds: Physical modelling and plant trials. Ironmak. Steelmak. 2017, 44, 461–471. [Google Scholar] [CrossRef]
  21. Cho, S.M.; Kim, S.H.; Thomas, B.G. Transient fluid flow during steady continuous casting of steel slabs: Part I. Measurements and modeling of two-phase flow. ISIJ Int. 2014, 54, 845–854. [Google Scholar] [CrossRef] [Green Version]
  22. Cho, S.M.S.; Kim, H.; Thomas, B.G. Transient fluid flow during steady continuous casting of steel slabs: Part II. Effect of double-ruler electro-magnetic braking. ISIJ Int. 2014, 54, 855–864. [Google Scholar] [CrossRef]
  23. Cho, S.M.; Thomas, B.G.; Kim, S.H. Transient two-phase flow in slide-gate nozzle and mold of continuous steel slab casting with and without double-ruler electro-magnetic braking. Metall. Mater. Trans. B 2016, 47B, 3080–3098. [Google Scholar] [CrossRef]
  24. Zhang, T.; Yang, J.; Jiang, P. Measurement of molten steel velocity near the surface and modeling for transient fluid flow in the continuous casting mold. Metals 2019, 9, 36. [Google Scholar] [CrossRef] [Green Version]
  25. Jones, W.P.; Launder, B.E. The prediction of laminarization with a two-equation model of turbulence. Int. J. Heat Mass Transf. 1972, 15, 301–314. [Google Scholar] [CrossRef]
  26. Bai, H.; Thomas, B.G. Bubble formation during horizontal gas injection into downward-flowing liquid. Metall. Mater. Trans. B 2001, 32B, 1143–1159. [Google Scholar] [CrossRef]
  27. Lee, G.G.; Shin, H.J.; Thomas, B.G.; Kim, S.H. Asymmetric Multi-Phase Fluid Flow and Particle Entrapment in a Continuous Casting Mold. In Proceedings of the AISTech, Pittsburgh, PA, USA, 5–8 May 2008; pp. 1–12. [Google Scholar]
  28. Lee, G.G.; Thomas, B.G.; Kim, S.H. Effect of refractory properties on initial bubble formation in continuous-casting nozzles. Met. Mater. Int. 2010, 16, 501–506. [Google Scholar] [CrossRef]
  29. Liu, R.; Thomas, R.B.G.; Sengupta, J.; Chung, S.D.; Trinh, M. Measurements of molten steel surface velocity and effect of stopper-rod movement on transient multiphase fluid flow in continuous casting. ISIJ Int. 2014, 54, 2314–2323. [Google Scholar] [CrossRef] [Green Version]
  30. Zhang, L.; Wang, Y.; Zuo, X. Flow transport and inclusion motion in steel continuous-casting mold under submerged entry nozzle clogging condition. Metall. Mater. Trans. B 2008, 39B, 534–550. [Google Scholar] [CrossRef]
  31. Cho, S.M.; Thomas, B.G.; Kim, S.H. Effect of nozzle port angle on transient flow and surface slag behavior during continuous steel-slab casting. Metall. Mater. Trans. B 2019, 50B, 52–76. [Google Scholar] [CrossRef]
  32. Zhang, L.; Taniguchi, S. Fundamentals of inclusion removal from liquid steel by bubble flotation. Int. Mater. Rev. 2000, 45, 59–82. [Google Scholar] [CrossRef]
  33. Zhang, L.; Aoki, J.; Thomas, B.G. Inclusion removal by bubble flotation in a continuous casting mold. Metall. Mater. Trans. B 2006, 37B, 361–379. [Google Scholar] [CrossRef]
  34. Kubota, J.; Okimoto, K.; Shirayama, A.; Murakami, H. Meniscus Flow Control in the Mold by Traveling Magnetic Field for High Speed Slab Caster. In Proceedings of the 74th Steelmaking Conference, Washington, DC, USA, 14–17 April 1991; pp. 233–241. [Google Scholar]
  35. Herbertson, J.; He, Q.L.; Flint, P.J.; Mahapatra, R.B. Modeling of Metal Delivery to Continuous Casting Moulds. In Proceedings of the 74th Steelmaking Conference, Washington, DC, USA, 14–17 April 1991; pp. 171–185. [Google Scholar]
  36. Bommaraju, R.; Glennon, R.; Frazee, M. Analysis of the Cause and Prevention of Longitudinal Midface Cracks and Depressions on Continuously Cast Free-Machining Steel Blooms. In Proceedings of the 1st European Conference on Continuous Casting, Florence, Italy, 23–25 September 1991; pp. 307–318. [Google Scholar]
  37. Billany, T.J.H.; Normanton, A.S.; Mills, K.C.; Grieveson, P. Surface cracking in continuously cast products. Ironmak. Steelmak. 1991, 18, 403–410. [Google Scholar]
  38. Miranda, R.; Barron, M.A.; Barreto, J.; Hoyos, L.; Gonzalez, J. Experimental and numerical analysis of the free surface in a water model of a slab continuous casting mold. ISIJ Int. 2005, 45, 1626–1635. [Google Scholar] [CrossRef]
Figure 1. Computation domain for full mold simulation: (a) geometry and mesh for mold; (b) mesh for SEN.
Metals 10 00009 g001
Figure 2. (a) Simulated velocities near mold surface at different casting speeds; comparison of calculated and measured velocities near mold surface with the different casting speeds at (b) 10 cm from narrow wall and (c) 1/4 width of mold.
Metals 10 00009 g002
Figure 3. Flow patterns with the different casting speeds. (a) 1.0 m/min; (b) 1.3 m/min; (c) 1.5 m/min; (d) 2.0 m/min.
Metals 10 00009 g003
Figure 4. Top surface level profile with the different casting speeds (a) 1.0 m/min; (b) 1.3 m/min; (c) 1.5 m/min; (d) 2.0 m/min.
Metals 10 00009 g004
Figure 5. (a) Simulated velocities near mold surface at different argon gas flow rates; comparison of calculation and measured velocities near mold surface with different argon gas flow rates at (b) 10 cm from narrow wall and (c) 1/4 width of mold.
Metals 10 00009 g005
Figure 6. Flow patterns with the different argon flow rates (a) 1 L/min; (b) 4 L/min; (c) 10 L/min; (d) 15 L/min.
Metals 10 00009 g006
Figure 7. Top surface level profile with the different argon gas flow rates (a) 1 L/min; (b) 4 L/min; (c) 10 L/min; (d) 15 L/min.
Metals 10 00009 g007
Figure 8. (a) Simulated velocities near mold surface at different SEN submergence depths; (b) comparison of calculated and measured velocities near mold surface with different SEN submergence depths at 1/4 width of mold.
Metals 10 00009 g008
Figure 9. Flow patterns with the different SEN submergence depths (a) 110 mm; (b) 140 mm; (c) 170 mm; (d) 200 mm.
Metals 10 00009 g009aMetals 10 00009 g009b
Figure 10. Top surface level profile with different SEN submergence depths (a) 110 mm; (b) 140 mm; (c) 170 mm; (d) 200 mm.
Metals 10 00009 g010
Table 1. Continuous caster dimensions and process conditions.
ParametersValuesParametersValues
Mold width (mm)1230SEN inside diameter (mm)78
Mold thickness (mm)230Steel density (kg/m3)7020
SEN submergence depth (mm)110, 140, 170,200Steel dynamic viscosity (kg/(m∙s))0.0056
Casting speed (m/min)1.0, 1.3, 1.5, 2.0Argon gas flow rate (L/min)1, 4, 10, 15
SEN port angle−20°Argon gas density (kg/m3)0.27
SEN port area of width × height (mm × mm)75 × 75Argon bubble diameter (mm)2.5

