Article

Transient Softening at the Fusion Boundary of Resistance Spot Welds: A Phase Field Simulation and Experimental Investigations for Al–Si-coated 22MnB5

Institute of Materials and Joining Technology, Otto von Guericke University Magdeburg, 39106 Magdeburg, Germany
*
Author to whom correspondence should be addressed.
Metals 2020, 10(1), 10; https://doi.org/10.3390/met10010010
Submission received: 3 December 2019 / Revised: 12 December 2019 / Accepted: 16 December 2019 / Published: 20 December 2019
(This article belongs to the Special Issue Joining of Advanced High Strength Steels for the Automotive Industry)

Abstract

:
This work gives an insight into the transient softening at the fusion boundary of resistance spot welds on hot stamped steel. Metallographic investigations and hardness mapping were combined with finite phase–field modeling of phase evolution at the fusion boundary. Saturation of weld nugget growth in the welding process was observed. For industrially relevant, long welding times, the fusion boundary of a spot weld is therefore isothermally soaked between the peritectic and solidus temperatures. This leads to a carbon segregation to the liquid phase due to higher carbon solubility and possibly to δ-Fe formation at the fusion boundary. Both results in a local carbon depletion at the fusion boundary. This finding is in good agreement with carbon content measurements at the fusion boundary and the results of hardness measurements.

1. Introduction

Advanced and ultra-high strength steels (AHSS/UHSS) are used in the production of crash-relevant parts in the automotive industry. In the case of the hot stamped, Al–Si-coated 22MnB5 steels, the presence of surface coatings used for oxidation protection in the furnace constitutes a challenge for joining with resistance spot (RP) welding [1]. Phases with high electrical resistance on the material surface and the high strength of hot stamped material reduces the process window for RP welding [2]. However, industrial applications demand large process windows and high process stability. Several strategies exist to counteract the described negative effects by adjusting welding parameters. The most common production relevant strategies to increase the process window are welding with longer welding times and welding current modulation [2,3,4], resulting in welding times of up to several seconds, e.g., in the case of welding with production-related disturbances like gaps [3]. Opting for this solution not only causes a broader heat-affected zone (HAZ), but also can lead to softening at the fusion boundary, described for 22MnB5 with Al–Si [5,6,7,8] and Zn coatings [9]. This effect has also been reported for dual phase steels [10]. The presence of the fusion boundary softening for 22MnB5 is argued by Lu et al. [11], however their experimental approach was not optimal for detecting the softened region, as will be discussed further.
Several hypotheses exist to explain the softening at the fusion boundary. Li et al. [10] suggest carbon depletion due to its segregation to be responsible for the softening at the fusion boundary. Qiao et al. [5], as well as Sherepenko and Jüttner [7] suggest δ-Fe formation due to the isothermal soaking of material in a peritectic region is assumed to cause the described effect. Previous investigations by Sherepenko and Jüttner [7] have shown that no softening at the fusion boundary is present in the case of a short-time process (190 ms), but for longer welding times (630 and 750 ms) a pronounced softening was measured. Sommer et al. [12] also show growth of softened region with increasing welding time.
In the past decades, phase–field modeling has been widely used for the simulation of microstructure evolution in the solidification process [13] and for high-speed processes as RP-welding [14,15]. The progress of the phase evolution is dependent to minimizing the free energy functional. The considered phase–field equations are time-dependent. In the framework of our current investigation a phase field model will be used to describe solidification and phase evolution close to the fusion boundary of RP-welds to get a deeper insight into the softening mechanisms.

2. Materials and Methods

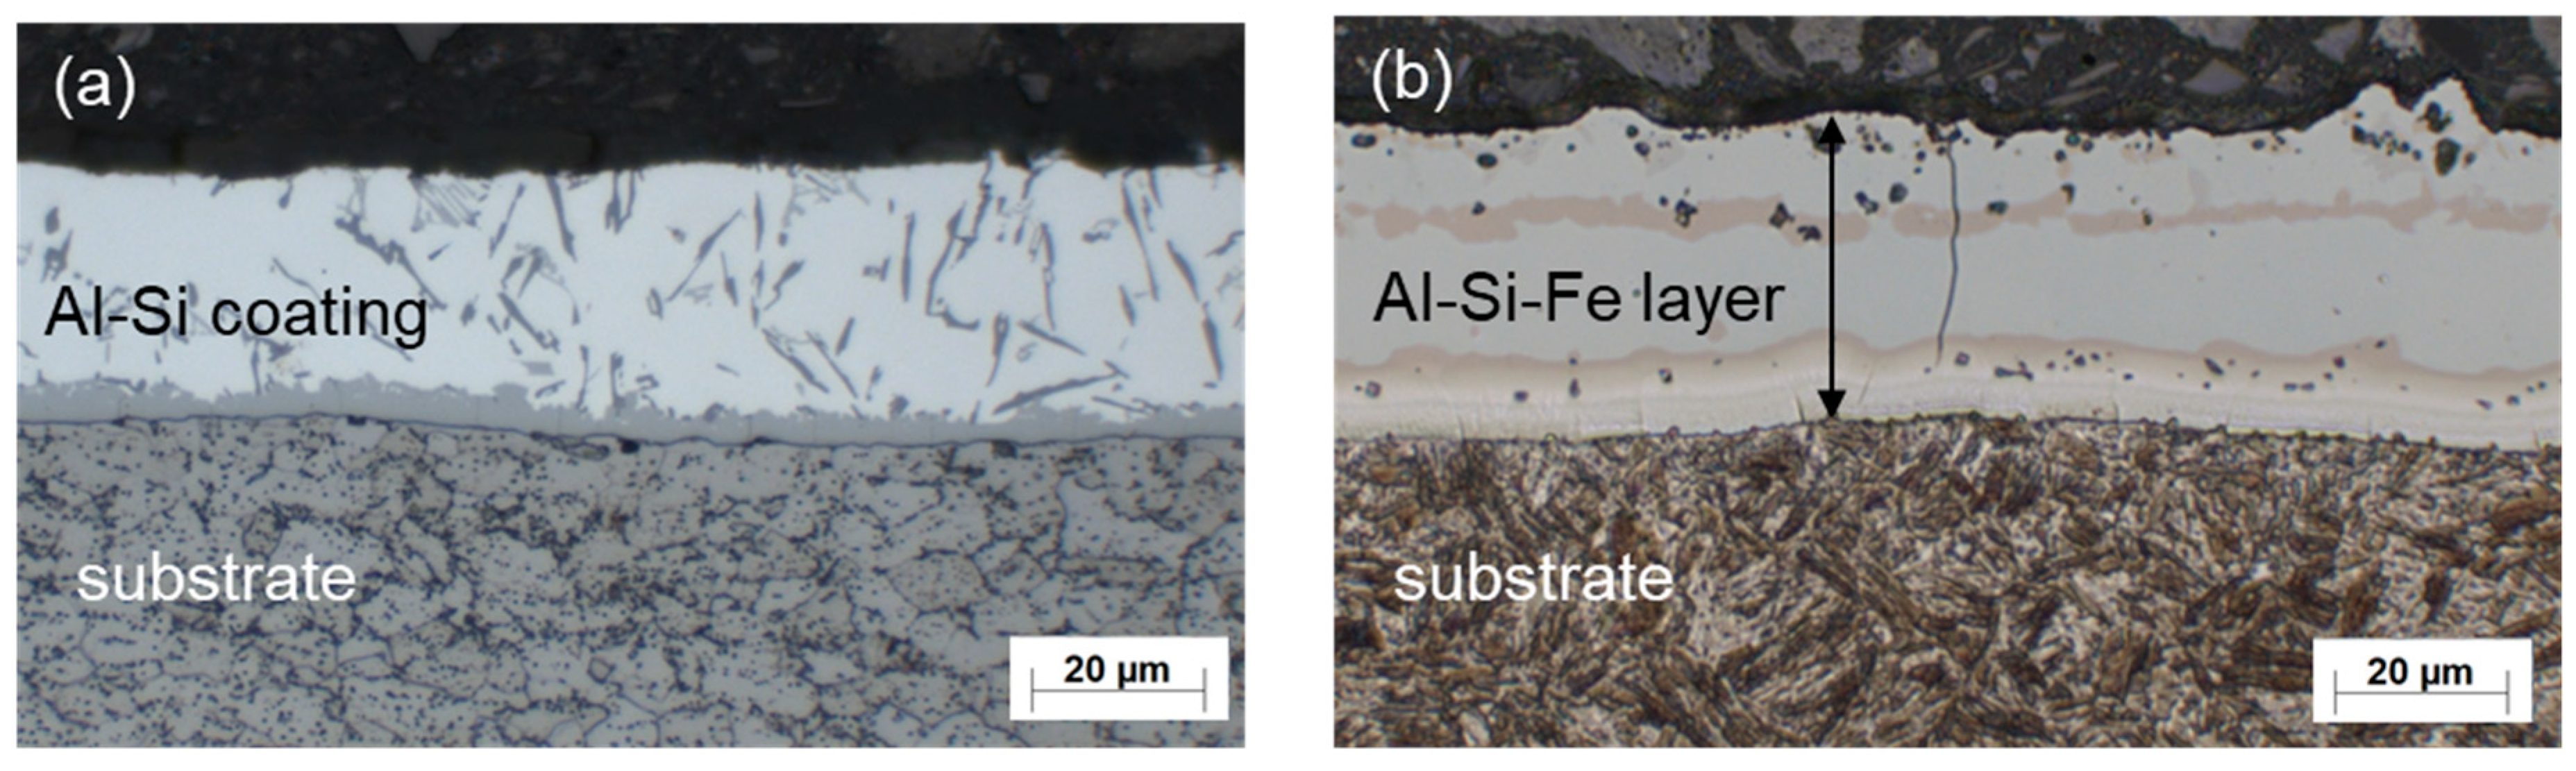
2.1. Test Material, Welding Procedure and Microstructure Characterization

Specimens from the 22MnB5 martensitic steel with a sheet thickness of 1.5 mm and a 150 g/m2 aluminum–silicon coating were investigated in their hot stamped condition. The procedure of hot stamping was conducted on sheets with dimensions of 300 × 500 mm2. Furnace temperature and time in the furnace were 930 °C and 6 min, respectively. Than the sheets were transported into a flat die and rapidly cooled, resulting in a martensitic microstructure of specimens. After hot stamping, welding specimens with the dimensions of 50 × 50 mm2 were cut with a solid-state laser TruDisk 3001 (TRUMPF GmbH + Co. KG, Ditzingen, Germany).
The microstructure of 22MnB5 and layer condition is shown in Figure 1. Prior to hot stamping, the material has a ferritic–pearlitic microstructure, and after hot stamping a martensitic microstructure is evident. Table 1 shows the chemical composition of the test material, and Table 2 shows its mechanical properties.
Resistance spot welding was performed using a stationary welding system in C-construction with a 1000 Hz medium frequency inverter (MFDC) (Harms & Wende GmbH & Co. KG, Hamburg, Germany). Welding parameters from investigations by Wink and Krätschmer [16], listed in Table 3, were used. Welding was conducted with CuCr1Zr electrode tips F1–16–20–8–15–6 according to DIN EN ISO 5821:2010-04. Squeeze time and holding time were 1000 ms. Welding current, voltage, electrode force and displacement were measured, using the WeldQuas monitoring system (HKS Prozeßtechnik GmbH, Halle (Saale), Germany).
To investigate the development of the weld nugget, the technique of the interrupted spot welds was used, explicitly described by Sherepenko and Jüttner [7] and Harlin et al. [17]. The welding process was interrupted in 100-ms steps. After that, cross sections of the welds were prepared (polished and etched with 5% nital), and subsequently nugget diameter and height were measured. For the specimen with a welding time of 630 ms, Klemm-I color etching was used to reveal the microstructure at the fusion boundary in the end of the welding process. Afterwards the specimen was polished and a Vickers microhardness mapping with a load of 0.4903 N (HV 0.05) and a step of 45 µm, consisting of 2150 individual hardness measurements, was carried out, using a microhardness tester Q60A+ (Qness GmbH, Golling, Austria). To reduce measurement time, only one quadrant of a weld joint cross section was subjected to hardness mapping. Additionally, a line-scan with HV0.1 was conducted, as presented in Figure 2.
Measurements of carbon content were made at the Fraunhofer Institute for Surface Engineering and Thin Films (Braunschweig, Germany), by secondary ion mass spectroscopy with Cs+ primary ions for a specimen with the welding time of 630 ms. The analyzed surface of 560 × 480 μm2 was milled with the ion beam (with beam diameter between 10 and 20 μm) to the depth of 500–600 nm and the carbon content was measured using the last 15 percent of the milled volume. To make a comparison of the measured and simulated carbon distribution, the carbon distribution from the simulation was averaged with the step of 10 µm, corresponding to the step of SIMS-measurements.
As Al is known to support ferrite formation [18], its presence in the surface layer and subsequent mixing with the molten nugget metal may lead to more active δ-Fe-formation at the fusion boundary. Energy-dispersive X-ray (EDX) measurements were conducted in the polished cross section of a test specimen to check the possible presence of Al at the fusion boundary and in the molten nugget using a DualBeam Scios electron microscope (Field Electron and Ion Company (FEI), Hillsboro, OR, USA) with an acceleration voltage of 20 kV.

2.2. Finite Element Simulation of the Welding Process

A commercially-available fixed effects (FE)-software SORPAS 2D 11.6 (SWANTEC Software and Engineering ApS, Lyngby, Denmark) was used to acquire temperature distribution in the welded joint. For that the welding process was simulated using an FE-model with 5000 elements, with welding parameters, listed in Table 3 and material parameters for the Al–Si layer and 22MnB5 (Usibor1500) from the software database. Figure 3 shows the meshed electrodes and sheets (a) as well as temperature distribution in the welded joint for the welding time of 630 ms (b,c). The FE-model was calibrated using a weld micrograph with the welding time of 630 ms, so that the measured and simulated nugget diameters are equal.
Temperature profile of the material close to the fusion boundary as marked in Figure 3c,d as well as temperature gradients across the fusion boundary close to the marked node were determined and used as input parameters for the phase field modeling.
For the calculation of temperature gradients, nodes on both sides of the fusion boundary (one in the molten and one in the solid region) were used. At the end of the welding process (welding time of 630 ms) the distance between the nodes and their temperatures were determined from the FE-simulation and used for the calculation of temperature gradients, as shown in Table 4. A temperature gradient of 9000 K/cm was used for the phase field modeling of phase transformations at the fusion boundary.

2.3. Simulation Model in Thermocalc and Micress

A multi-component phase-field model was developed within MICRESSTM software (version 6.3 ACCESS e.V., Aachen, Germany) with the aim of the ThermocalcTM thermodynamic database TCFe7 (Thermo-Calc Software, Solna, Sweden), which could be used to simulate rapid solidification during the welding process of the 22MnB5 steel.
For the investigation of solidification behavior, the thermodynamic data of the component including the phase diagram and phase interaction were derived from the ThermocalcTM database. The operational parameters i.e., thermal gradient within the domain and cooling rate, were derived from the FE simulation of the welding process as described previously.
The interface in currently used models is considered to be a diffuse interface, and is included in the solution with an order parameter which can vary between two phases [19]. The chemical free energy determines the driving force of the phase transition and includes both the temperature field and the concentration field [20]. The diffusion rate of the elements varies within the different phases, and it strongly influences the formation and distribution pattern of the phases during solidification.
The simulation domain was defined as 60 × 120 µm2, and all of the side walls were adjusted to periodic boundary conditions in order to enable us to expand the generated results to a bigger domain. In order to investigate the phase transition from the liquid to solid phases along with the temperature reduction, the nucleation procedure was considered in the simulations adopting the undercooling criteria. Checking the composition and temperature was applied for each grid cell at every time step in the aim of positioning the potential nuclei. The setup was regulated to check the stability of the generated nuclei within upcoming time steps and to vanish the non-stable ones. The mechanical interaction between phases would affect the phase boundary evolution and consequently the solidification pattern. The surface energy and mobility between different phases are applied from the thermodynamic database.
The initial composition was applied from experiments. Figure 4a shows the phase positioning at the beginning of the simulation. Figure 4b shows the applied temperature field at the beginning of the simulation process. The marked reactive oxygen intermediate (ROI) in the middle of the simulation domain (60 × 45 µm2) was used to examine phase evolution. Fraction of each phase was measured by image analysis with ImageJ.
Phase evolution pattern depends on the phase diagram and interaction between phases. A quasi-binary phase diagram considered in the simulations (Figure 5a) was calculated by ThermocalcTM v.015b (Thermo-Calc Software, Solna, Sweden) using the TCFe7 database for the simplified chemical composition of the test material (Table 5).
During the welding process some volume of the material surrounding the molten nugget is heated above the peritectic temperature (T2), but below the liquidus temperature (T3), so that it stays in a two-phase L + δ region till the end of the welding process, when rapid cooling starts after the welding current is turned off. A temperature profile was obtained from the FE welding process simulation to represent the temperature history of the described region. To implement the temperature profile into the phase field model, it was linearized as shown in Figure 5b. The temperature profile consists of rapid heating (A → B) from 1450 to 1504 °C with approximately 1,2 K/ms, followed by holding at 1504 °C for 170 ms (B → C) and subsequent cooling with 16 K/ms (C → D). In the phase field simulation, the temperature profile A’B’C’D’, calculated with the temperature gradient of 9000 °C/cm (Table 6), was applied to the bottom of the simulation domain, so that the center of the simulation domain had a thermal history, shown in Figure 4b.

3. Results and Discussion
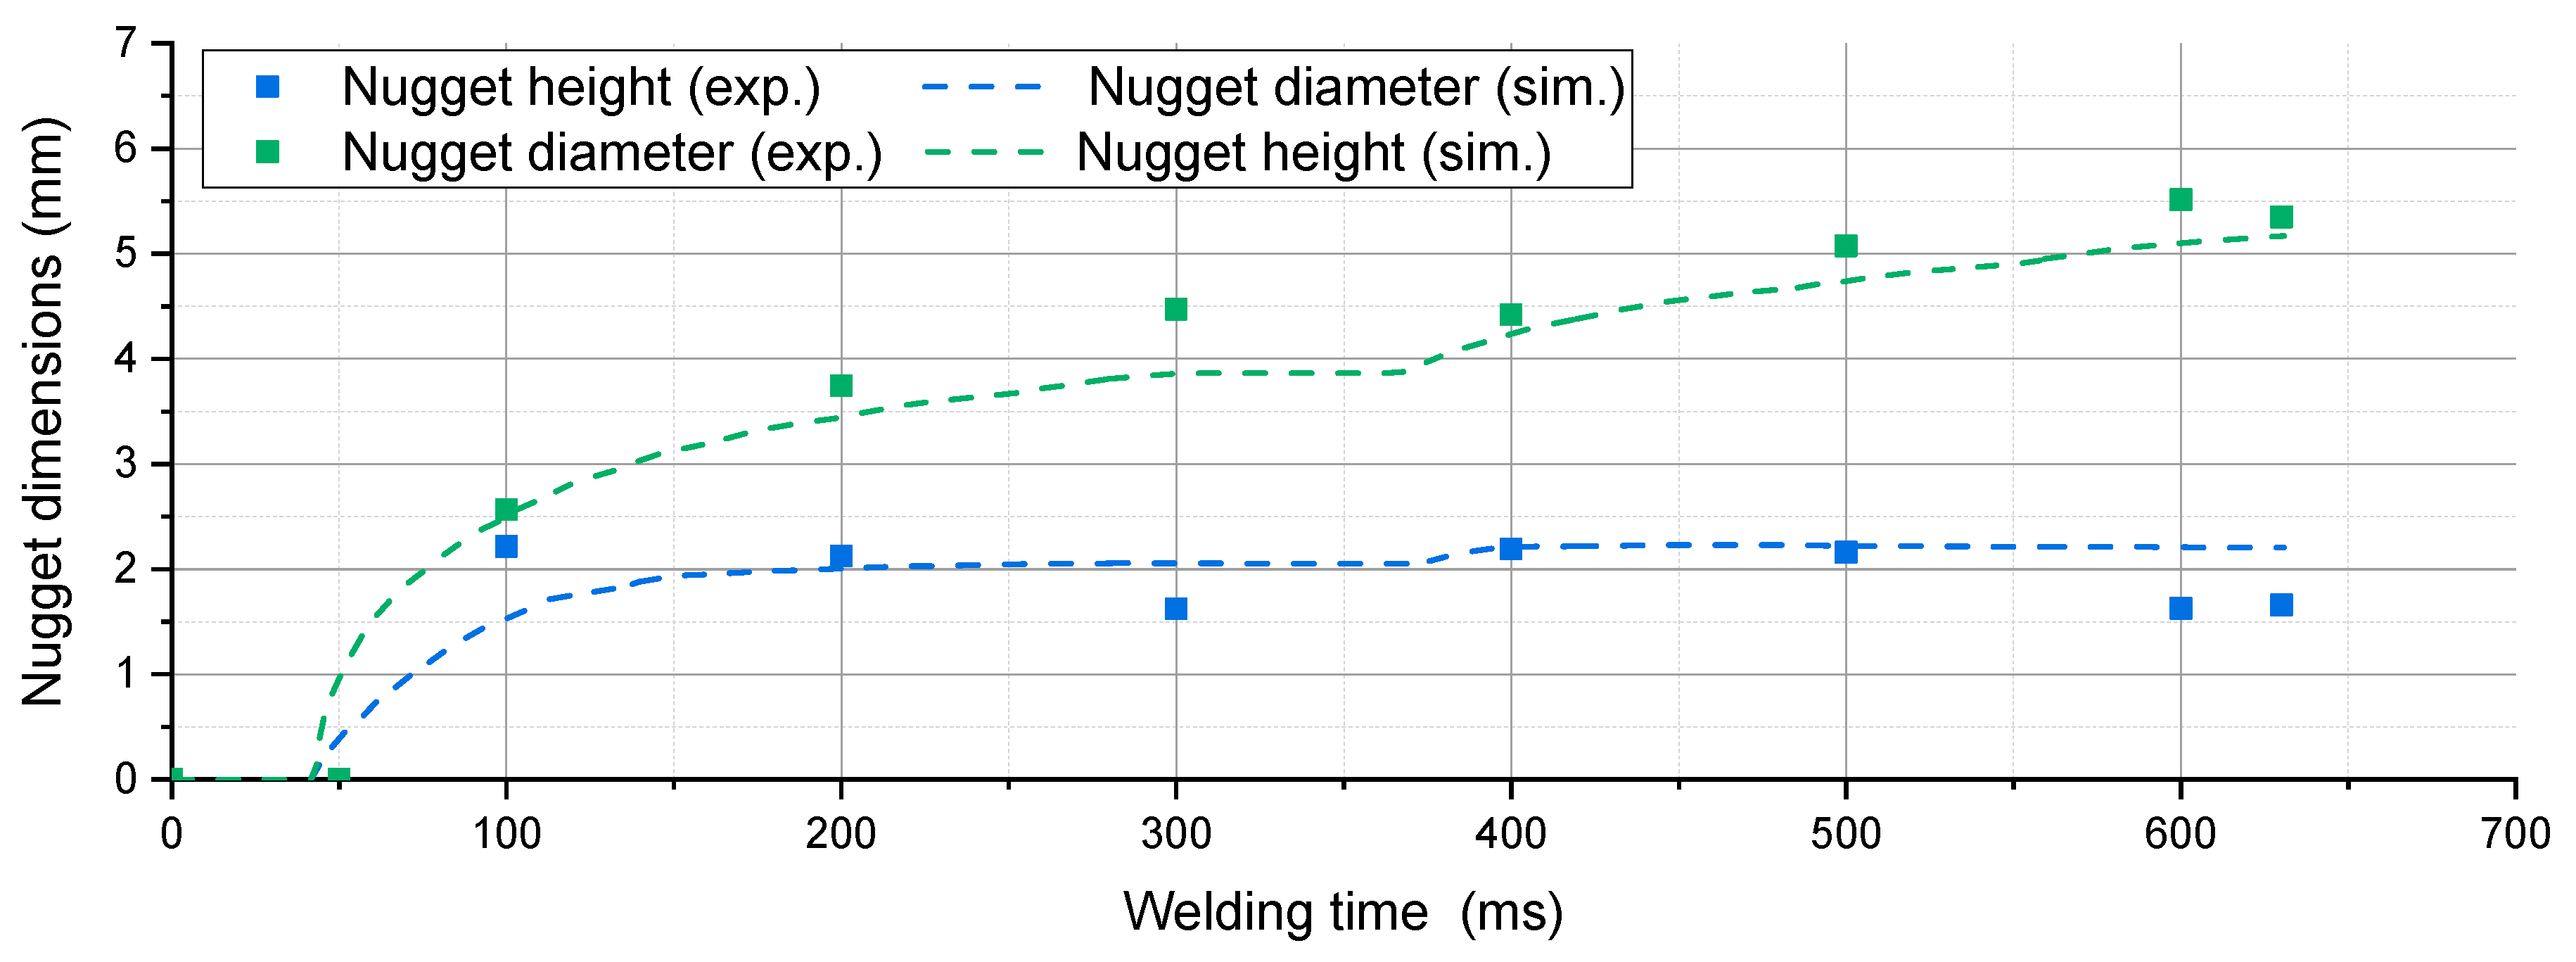
3.1. Nugget Growth

Nugget growth speed depends on the growth direction (Figure 6): the nugget grows in the vertical direction starts approximately 50 ms after the beginning of the welding process and reaches its maximal height after 100–150 ms. After that the nugget height under the electrode reduces due to intensive cooling and indentation of the electrode into the sheet. Nugget growth in a diametric direction proceeds until approx. 150 ms where it begins to saturate, while slower nugget growth is observed until 300 ms.
In the beginning of the second current pulse, the nugget growth slightly intensifies and saturates at 500 ms. These results are in good correspondence to the experimentally measured nugget dimensions and confirm the observations found in the literature [21].

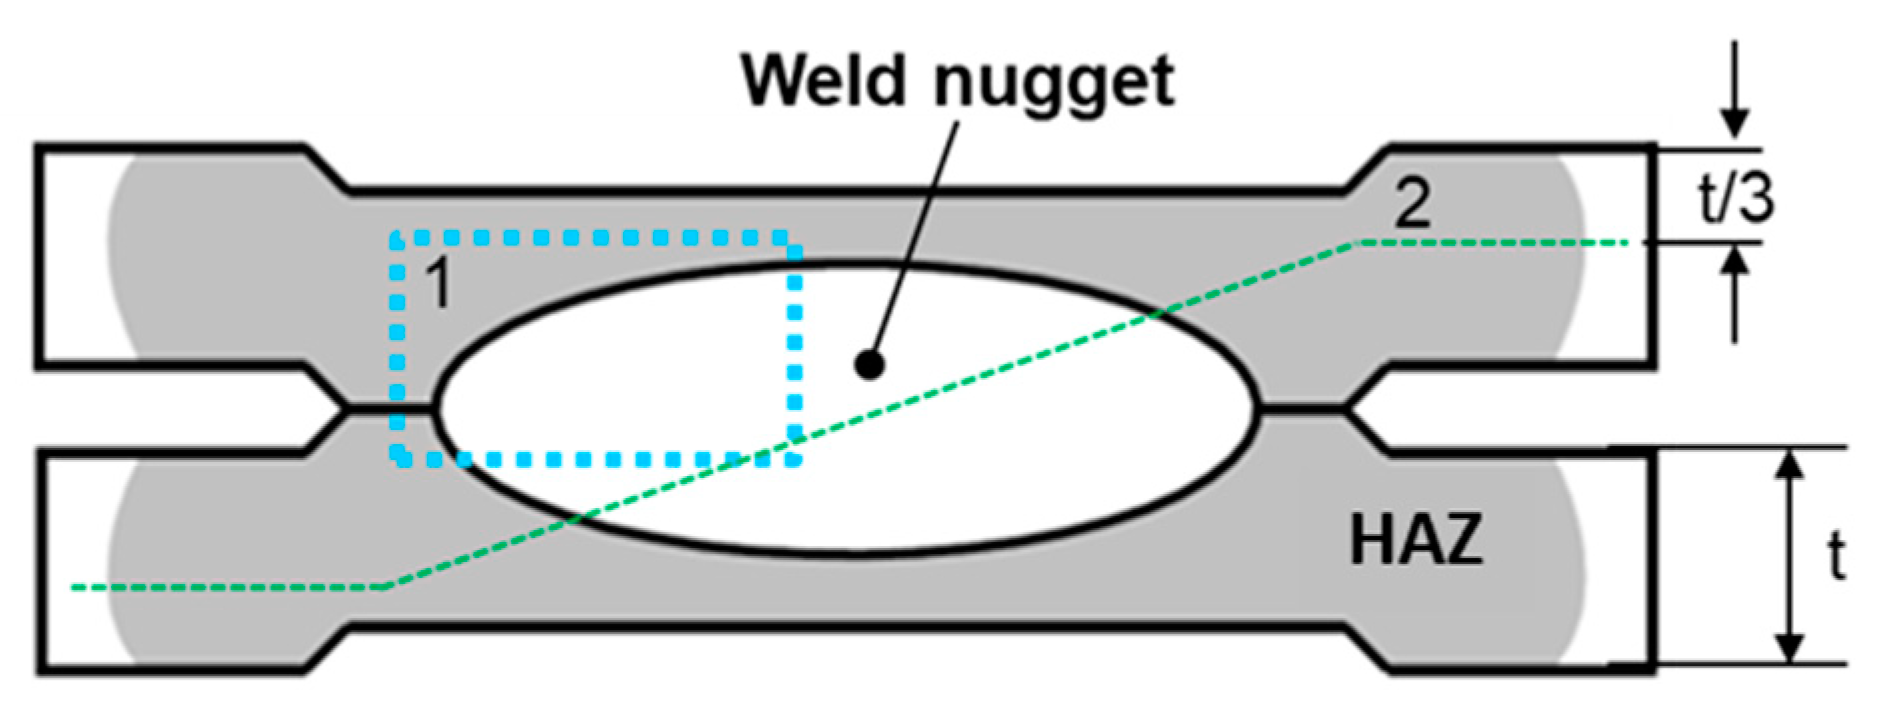
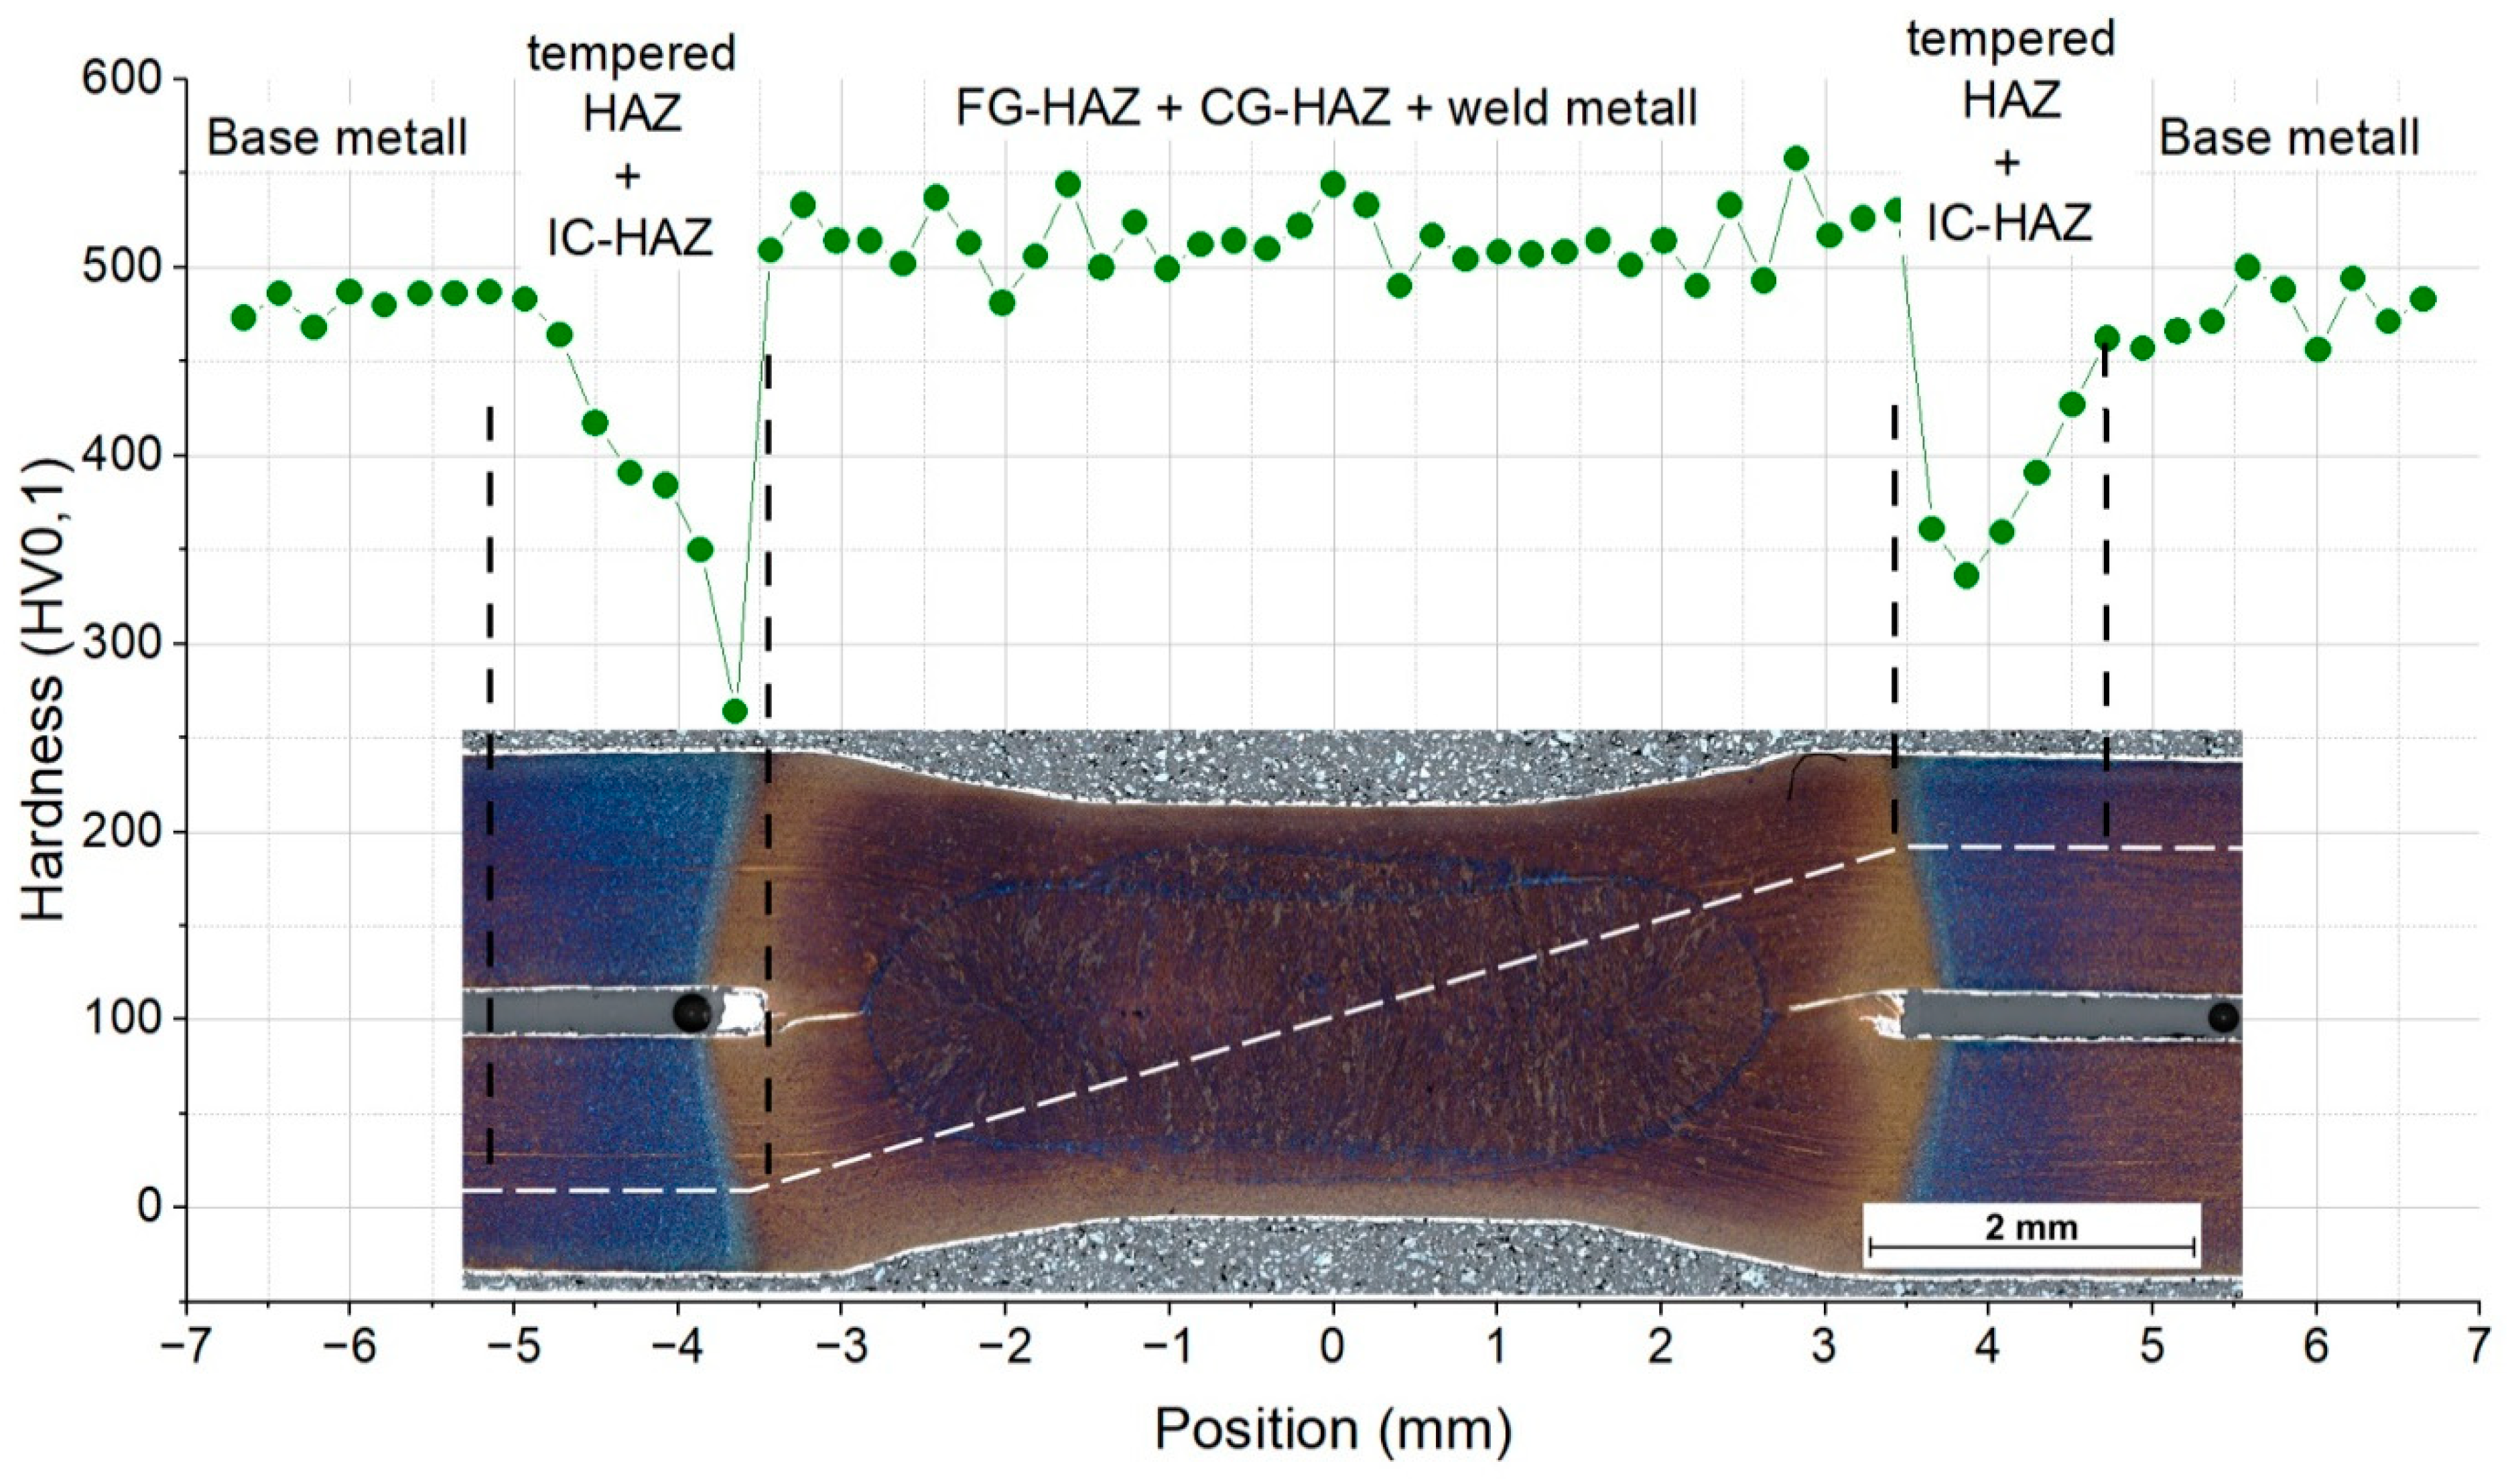
3.2. Metallographic Investigations and Hardness Measurements

The observed microstructure of the heat-affected zone (HAZ) matches the description of Jong et al. [22]. Metallographic investigation of a specimen after the color etching (Figure 7) shows a clear, blue–gray coloring of the HAZ between the inter-critical HAZ (IC-HAZ) and the tempered zone.
This correlates with hardness measurements where the hardness of the blue-etched region in the IC-HAZ and tempered HAZ, consisting of ferrite and tempered martensite, reached as low as 250 HV0.1, whereas martensitic fine grain (FG) and coarse grain (CG) HAZ, as well as the weld nugget and base material, etched I brown-gray, have the hardness between 480 and 550 HV0.1.
The region at the fusion boundary is also etched blue. However, Klemm I-etching, is sensitive to changes, not only in material microstructure, but also in its chemical composition, so that the color difference may be caused by both the presence of ferrite at the fusion boundary and local carbon depletion. Hardness mapping (Figure 8) reveals a softened region at the fusion boundary, where the position of the softened region corresponds to the position of the blue-etched halo, as can be seen in Figure 9a,b. According to the results of the present study, the softened region at the fusion boundary is not detected by a commonly used hardness traverse measurement (e.g., [11]) (Figure 7) due to the small size of the softened region compared to the step of the hardness measurement and under circumstances the size of the indentation. To detect the softened region at the fusion boundary, measurement with a low loading force and small distance between the indentations are required [6,7,10]. Microhardness mapping (Figure 8 and Figure 9) shows a clear evidence of the softened region. The softening under the electrode is more severe, compared to the softening in the diametric direction, which is in good agreement with differences in nugget growth. Nugget growth under the electrode saturates earlier, leading to longer isothermal soaking of material at the fusion boundary, therefore a more severe carbon depletion in this region can be expected.
It is still unclear if the observed softening is caused by the presence of delta-ferrite, as shown in the simulation, or the carbon-depleted martensite. Measured hardness values at the fusion boundary (430 HV0.1) correspond to the hardness of the carbon-depleted martensite with approximately 420 HV 20 at 0.12% C according to measurements of Grange et al. [23].
The conducted EBSD-measurements did not allow distinguishing between ferrite and martensite, and further investigations employing transition electron microscopy are necessary to check the presence of delta ferrite in the softened region. The conducted EDX measurements show no presence of Al at the fusion boundary or in the weld nugget. Therefore, it can be concluded that the presence of the Al–Si coating at the sheet interface does not contribute to the δ-Fe-formation in the region close to the fusion boundary. This can be explained by the fact that the Al–Si coating is pressed out of the weld nugget by the applied electrode force of the welding electrode at the early stage of the welding process, and the debris of this Al–Si coating are clearly seen between the welded sheets in Figure 9.

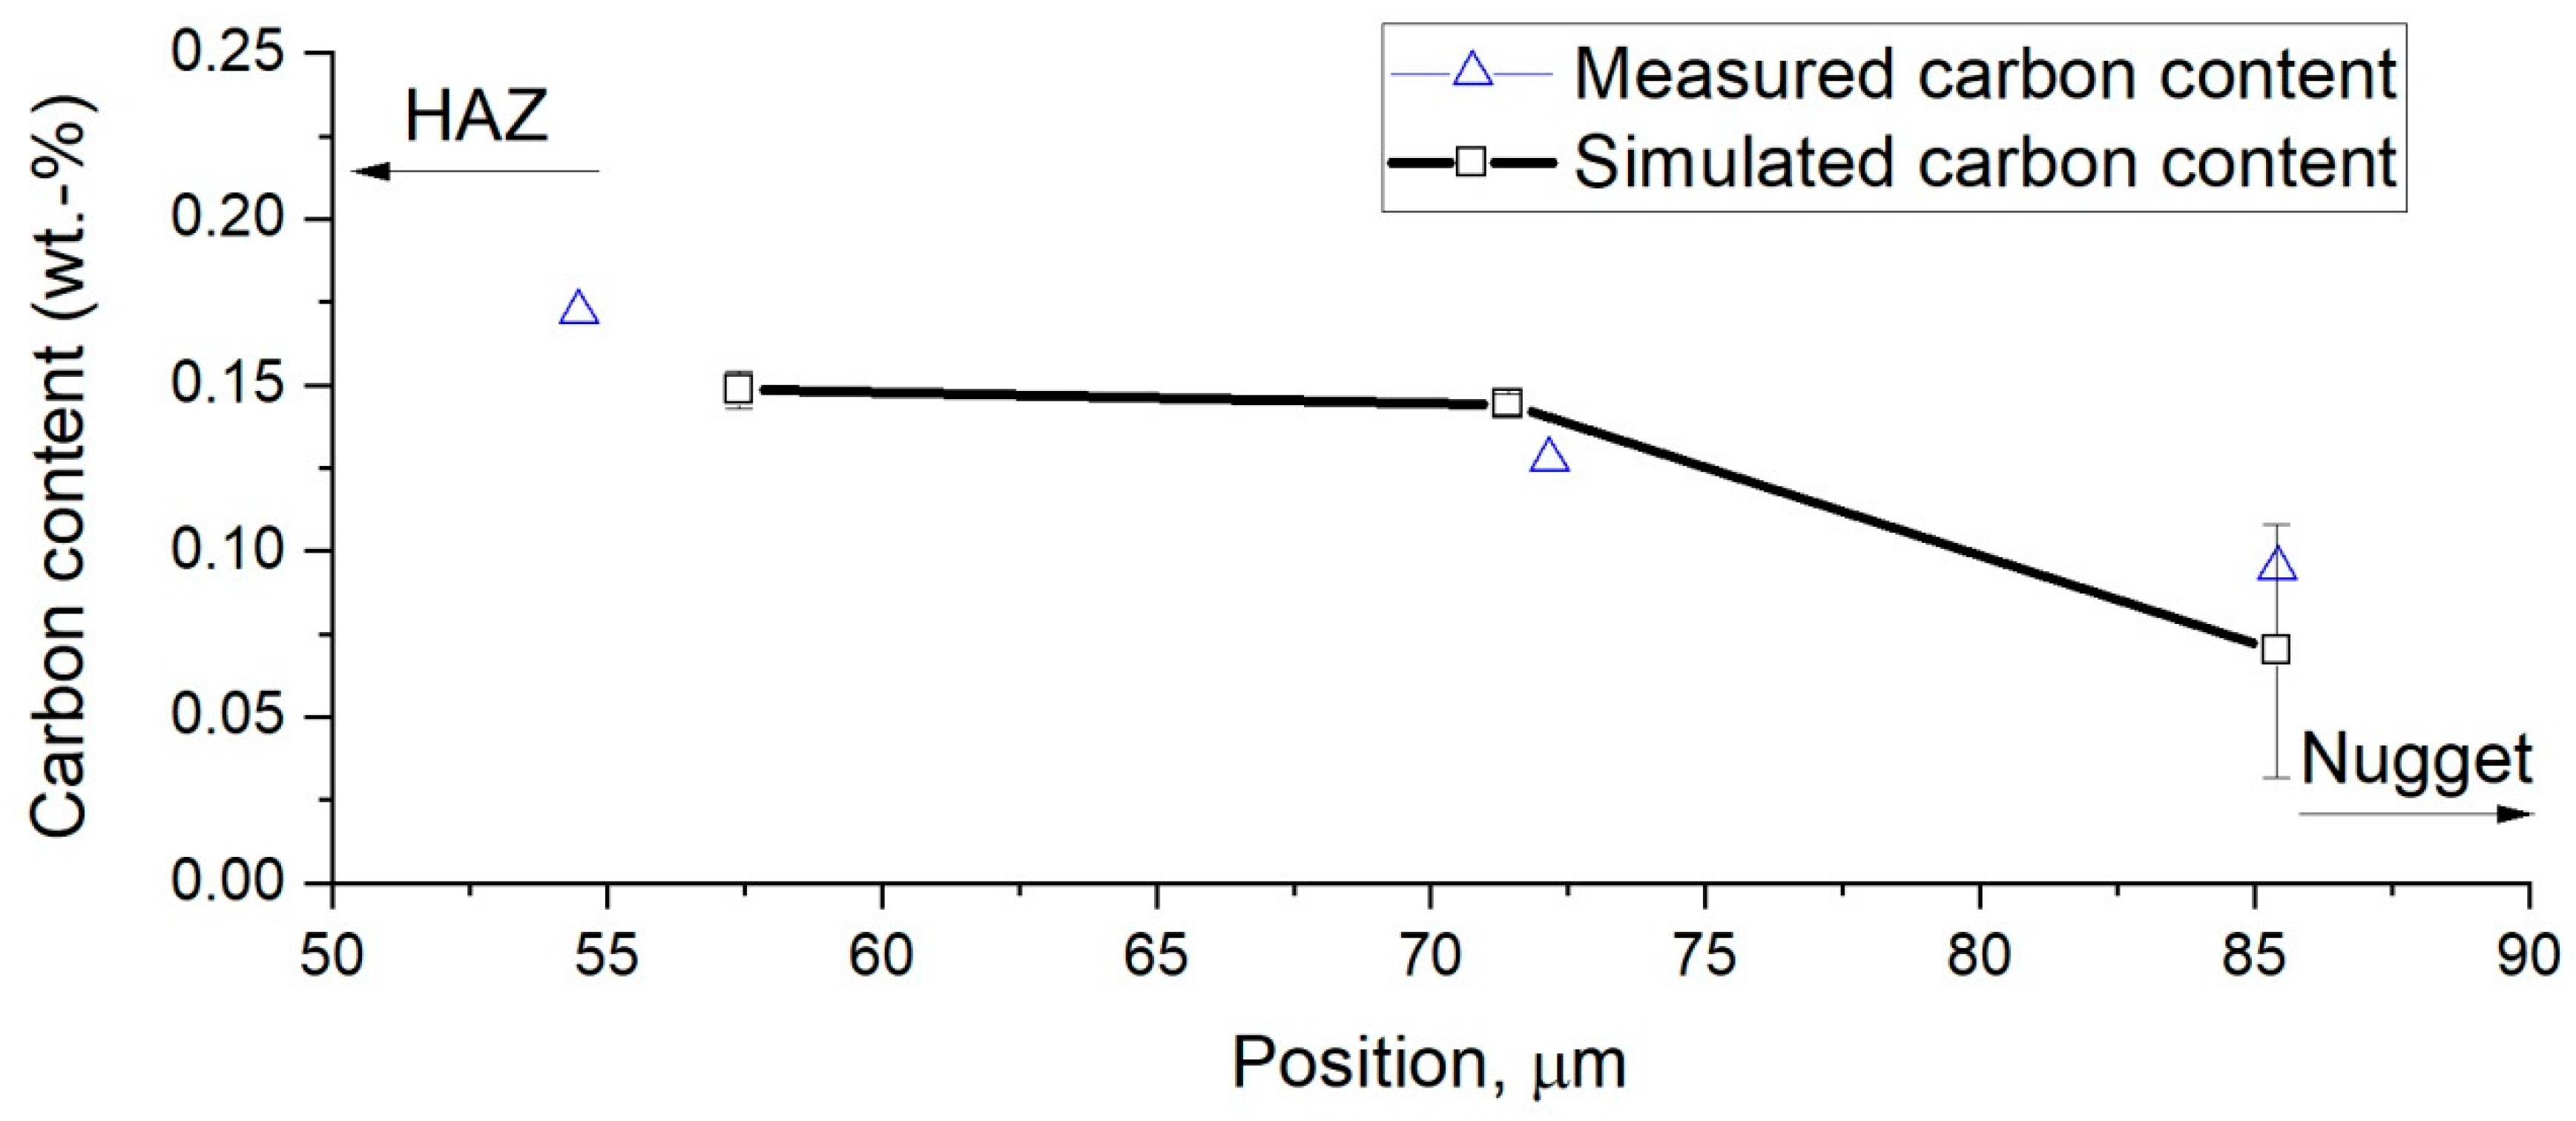
3.3. Final Carbon Distribution

The conducted SIMS-Measurements of carbon distribution at the fusion boundary of a weld with welding time of 630 ms show a carbon-depleted region with the drop of carbon content, as can be seen in Figure 10. The position of the carbon-depleted region corresponds to the position of the measured softened region between the HAZ and weld nugget. Simulated and measured carbon distribution, presented in Figure 8, show a good correspondence.

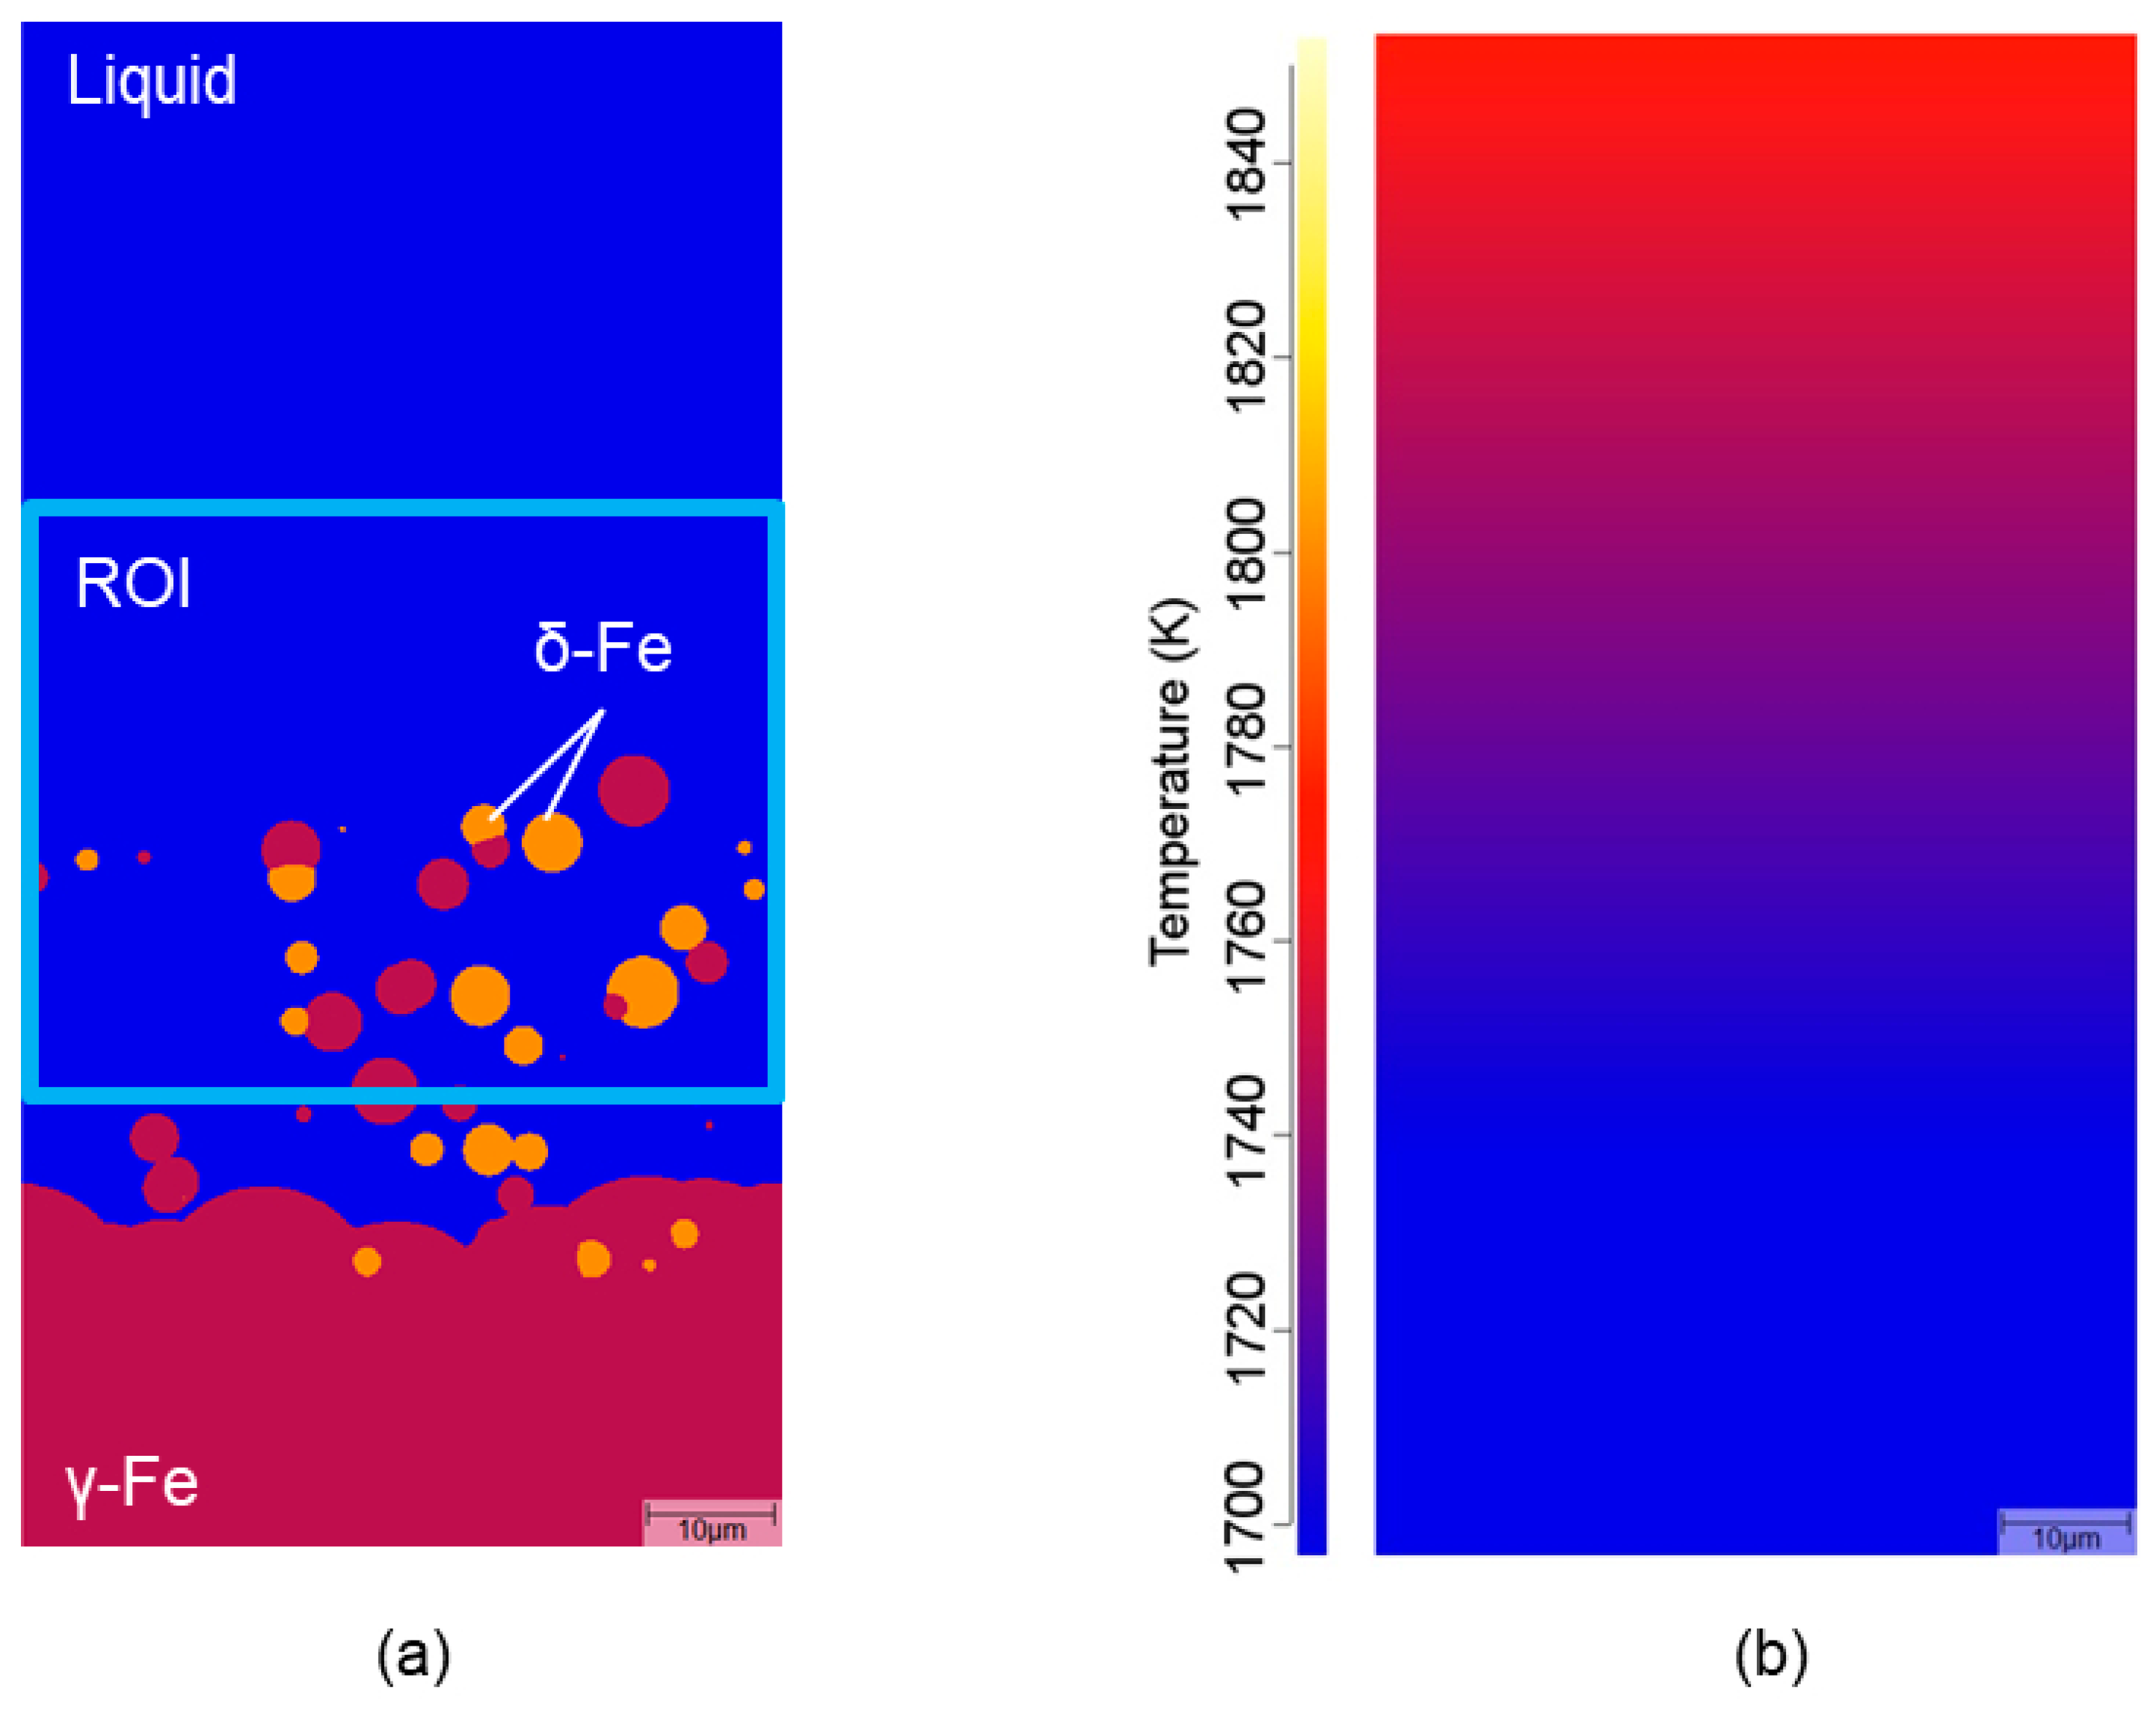
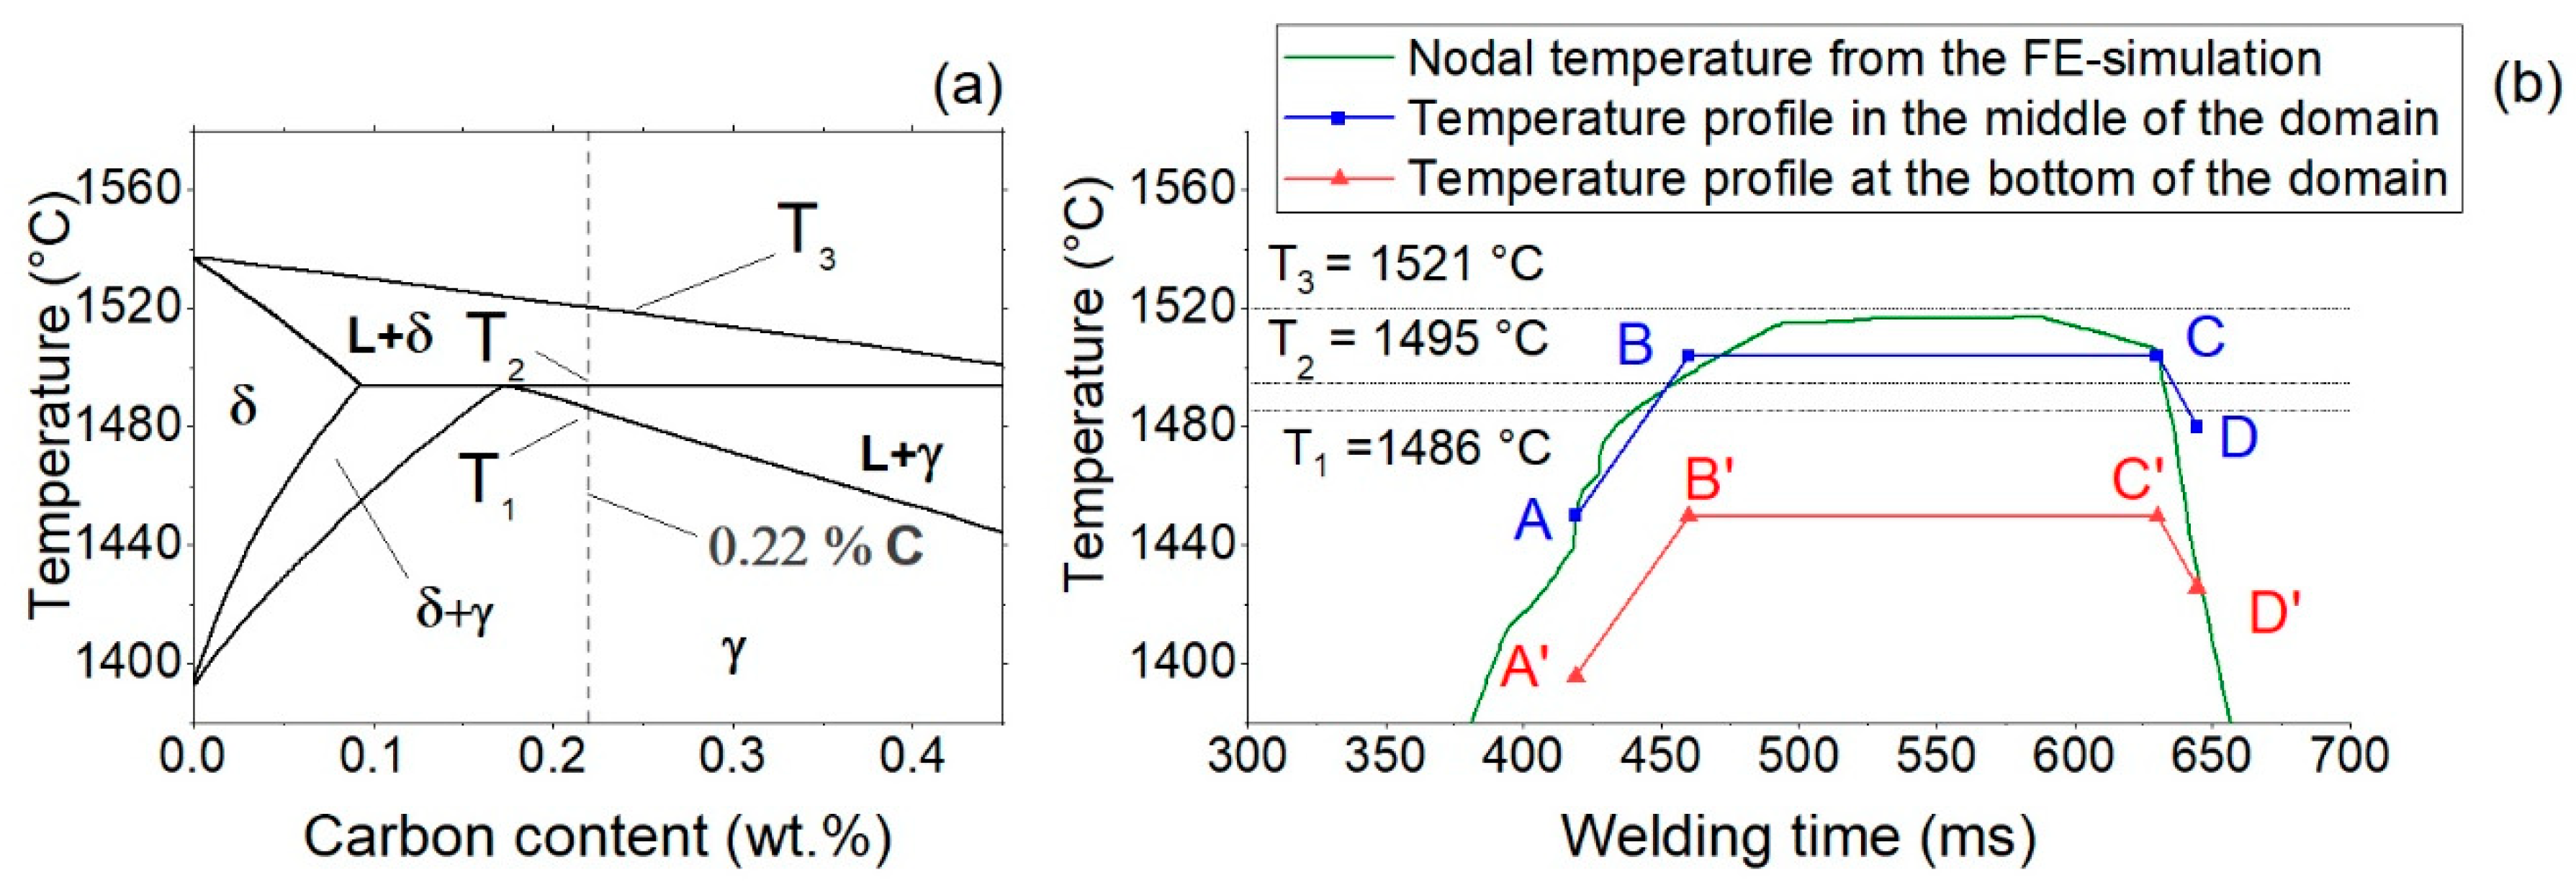
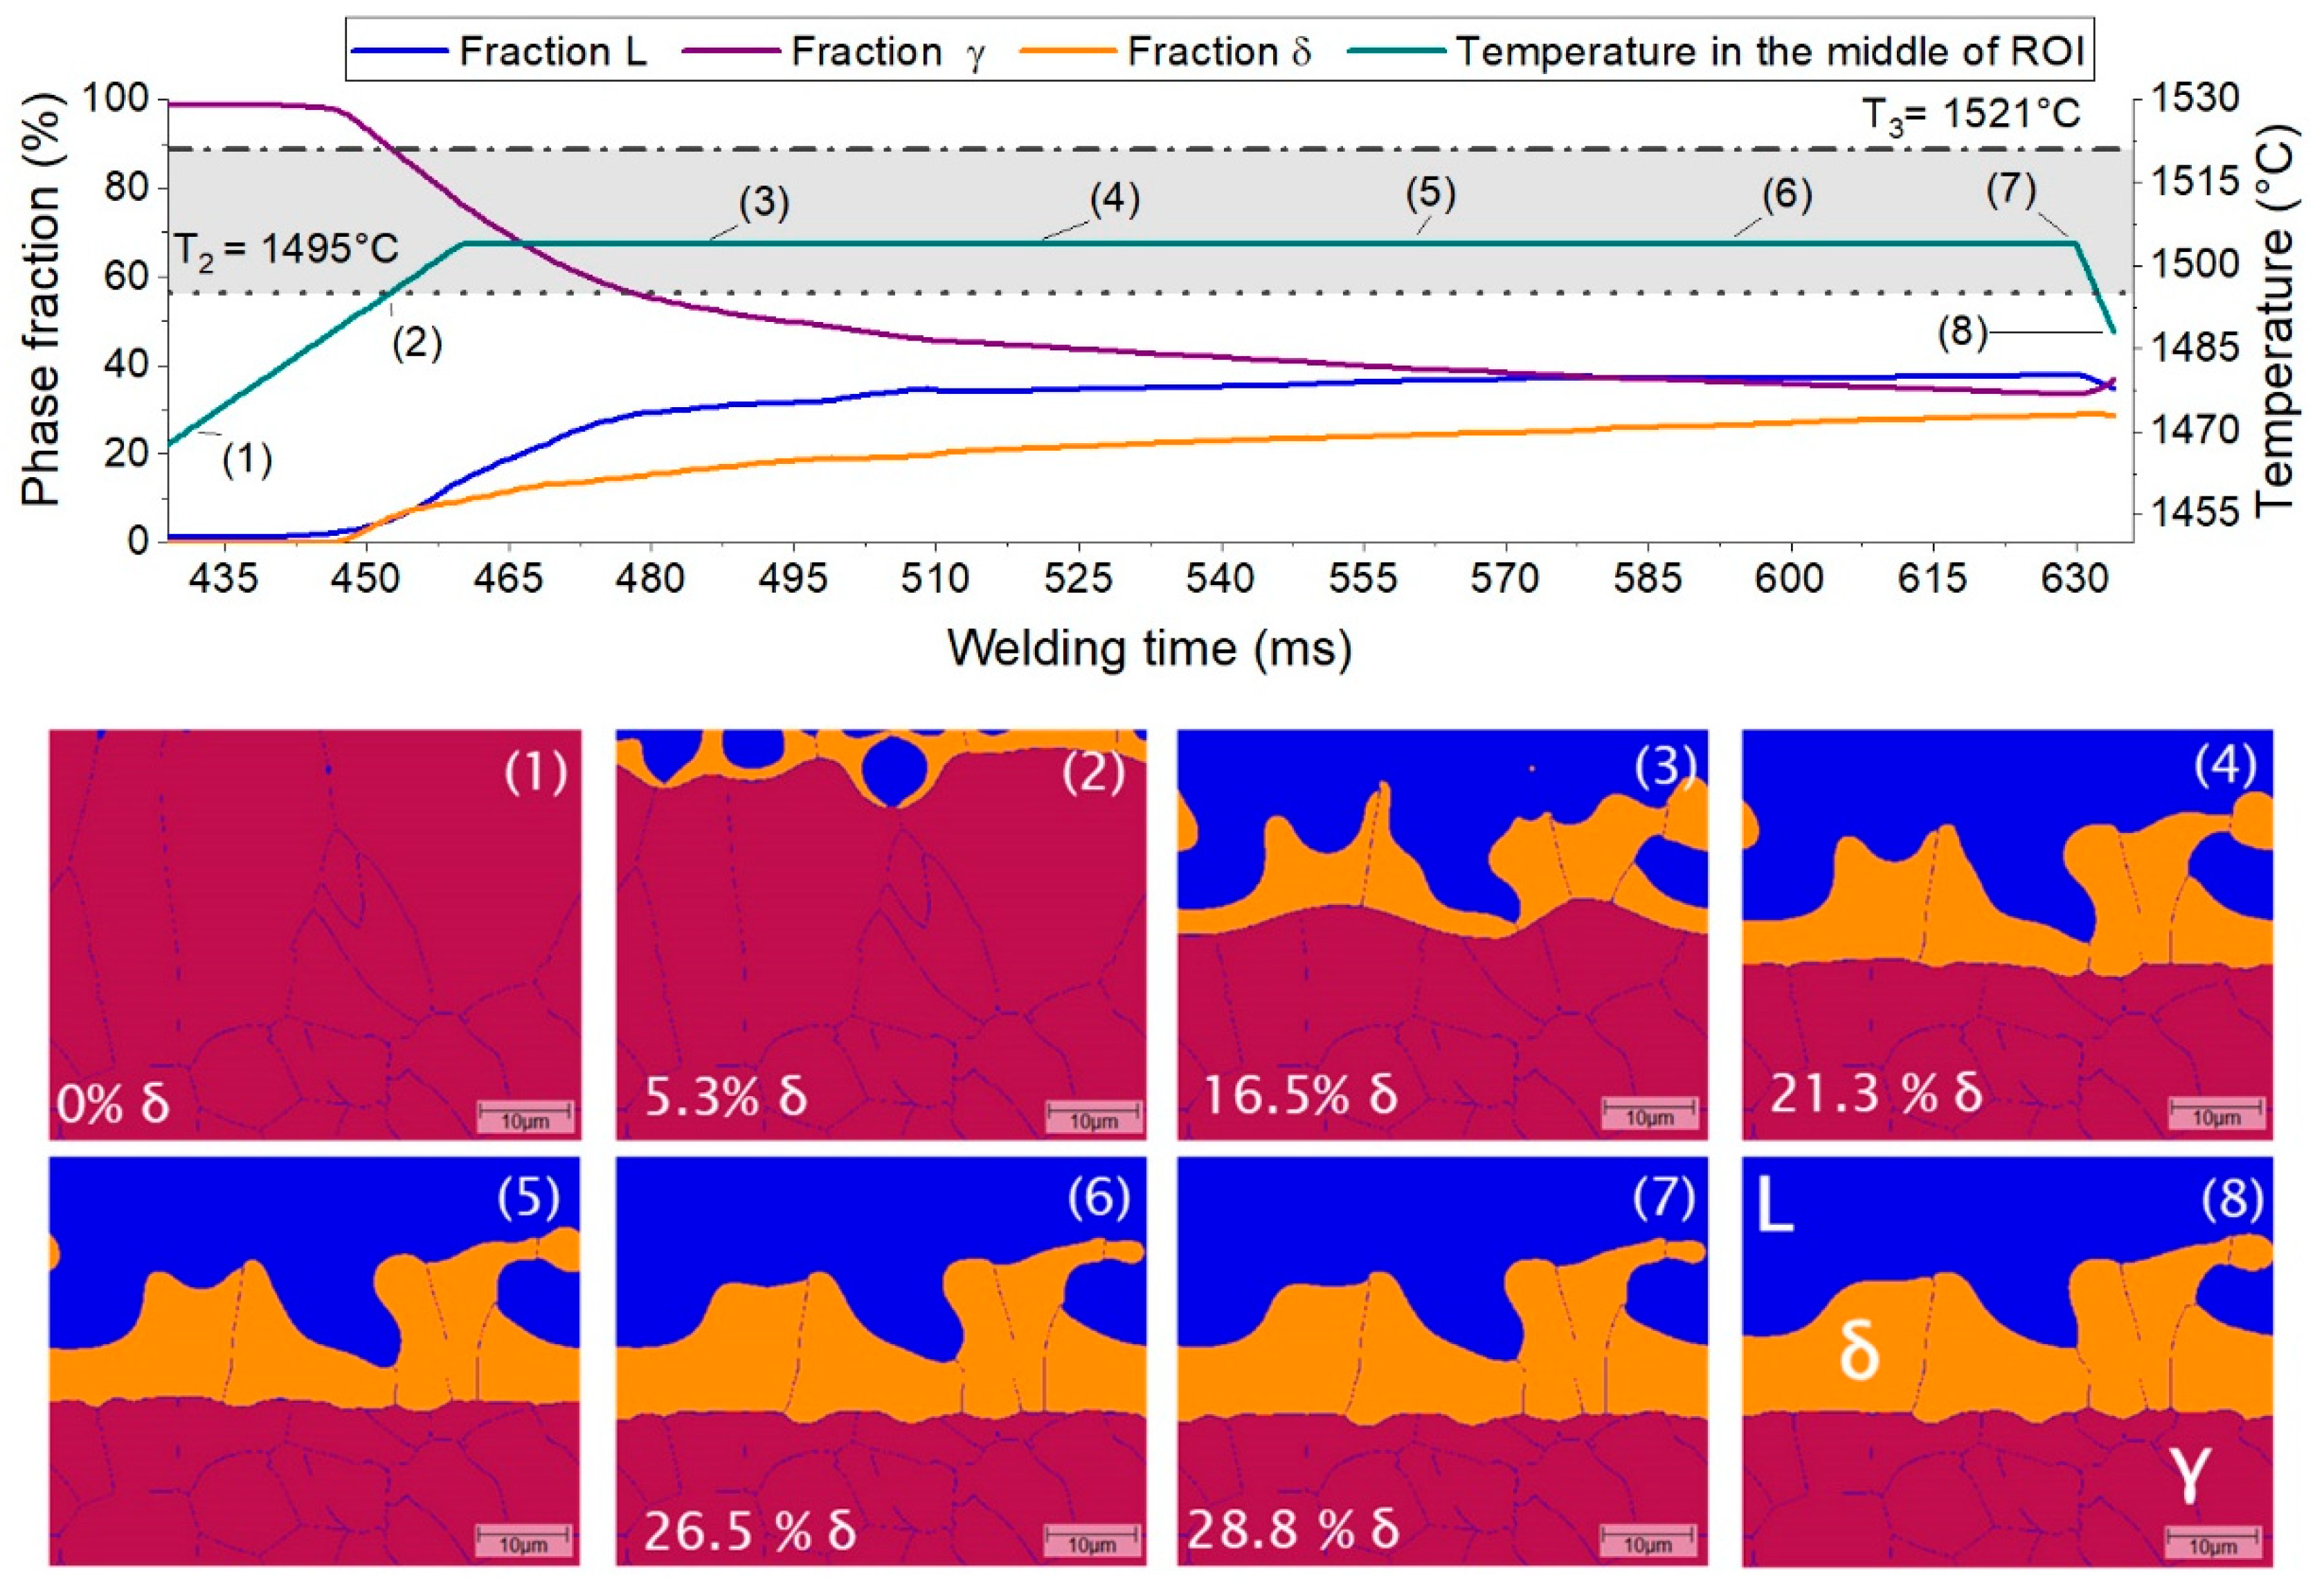
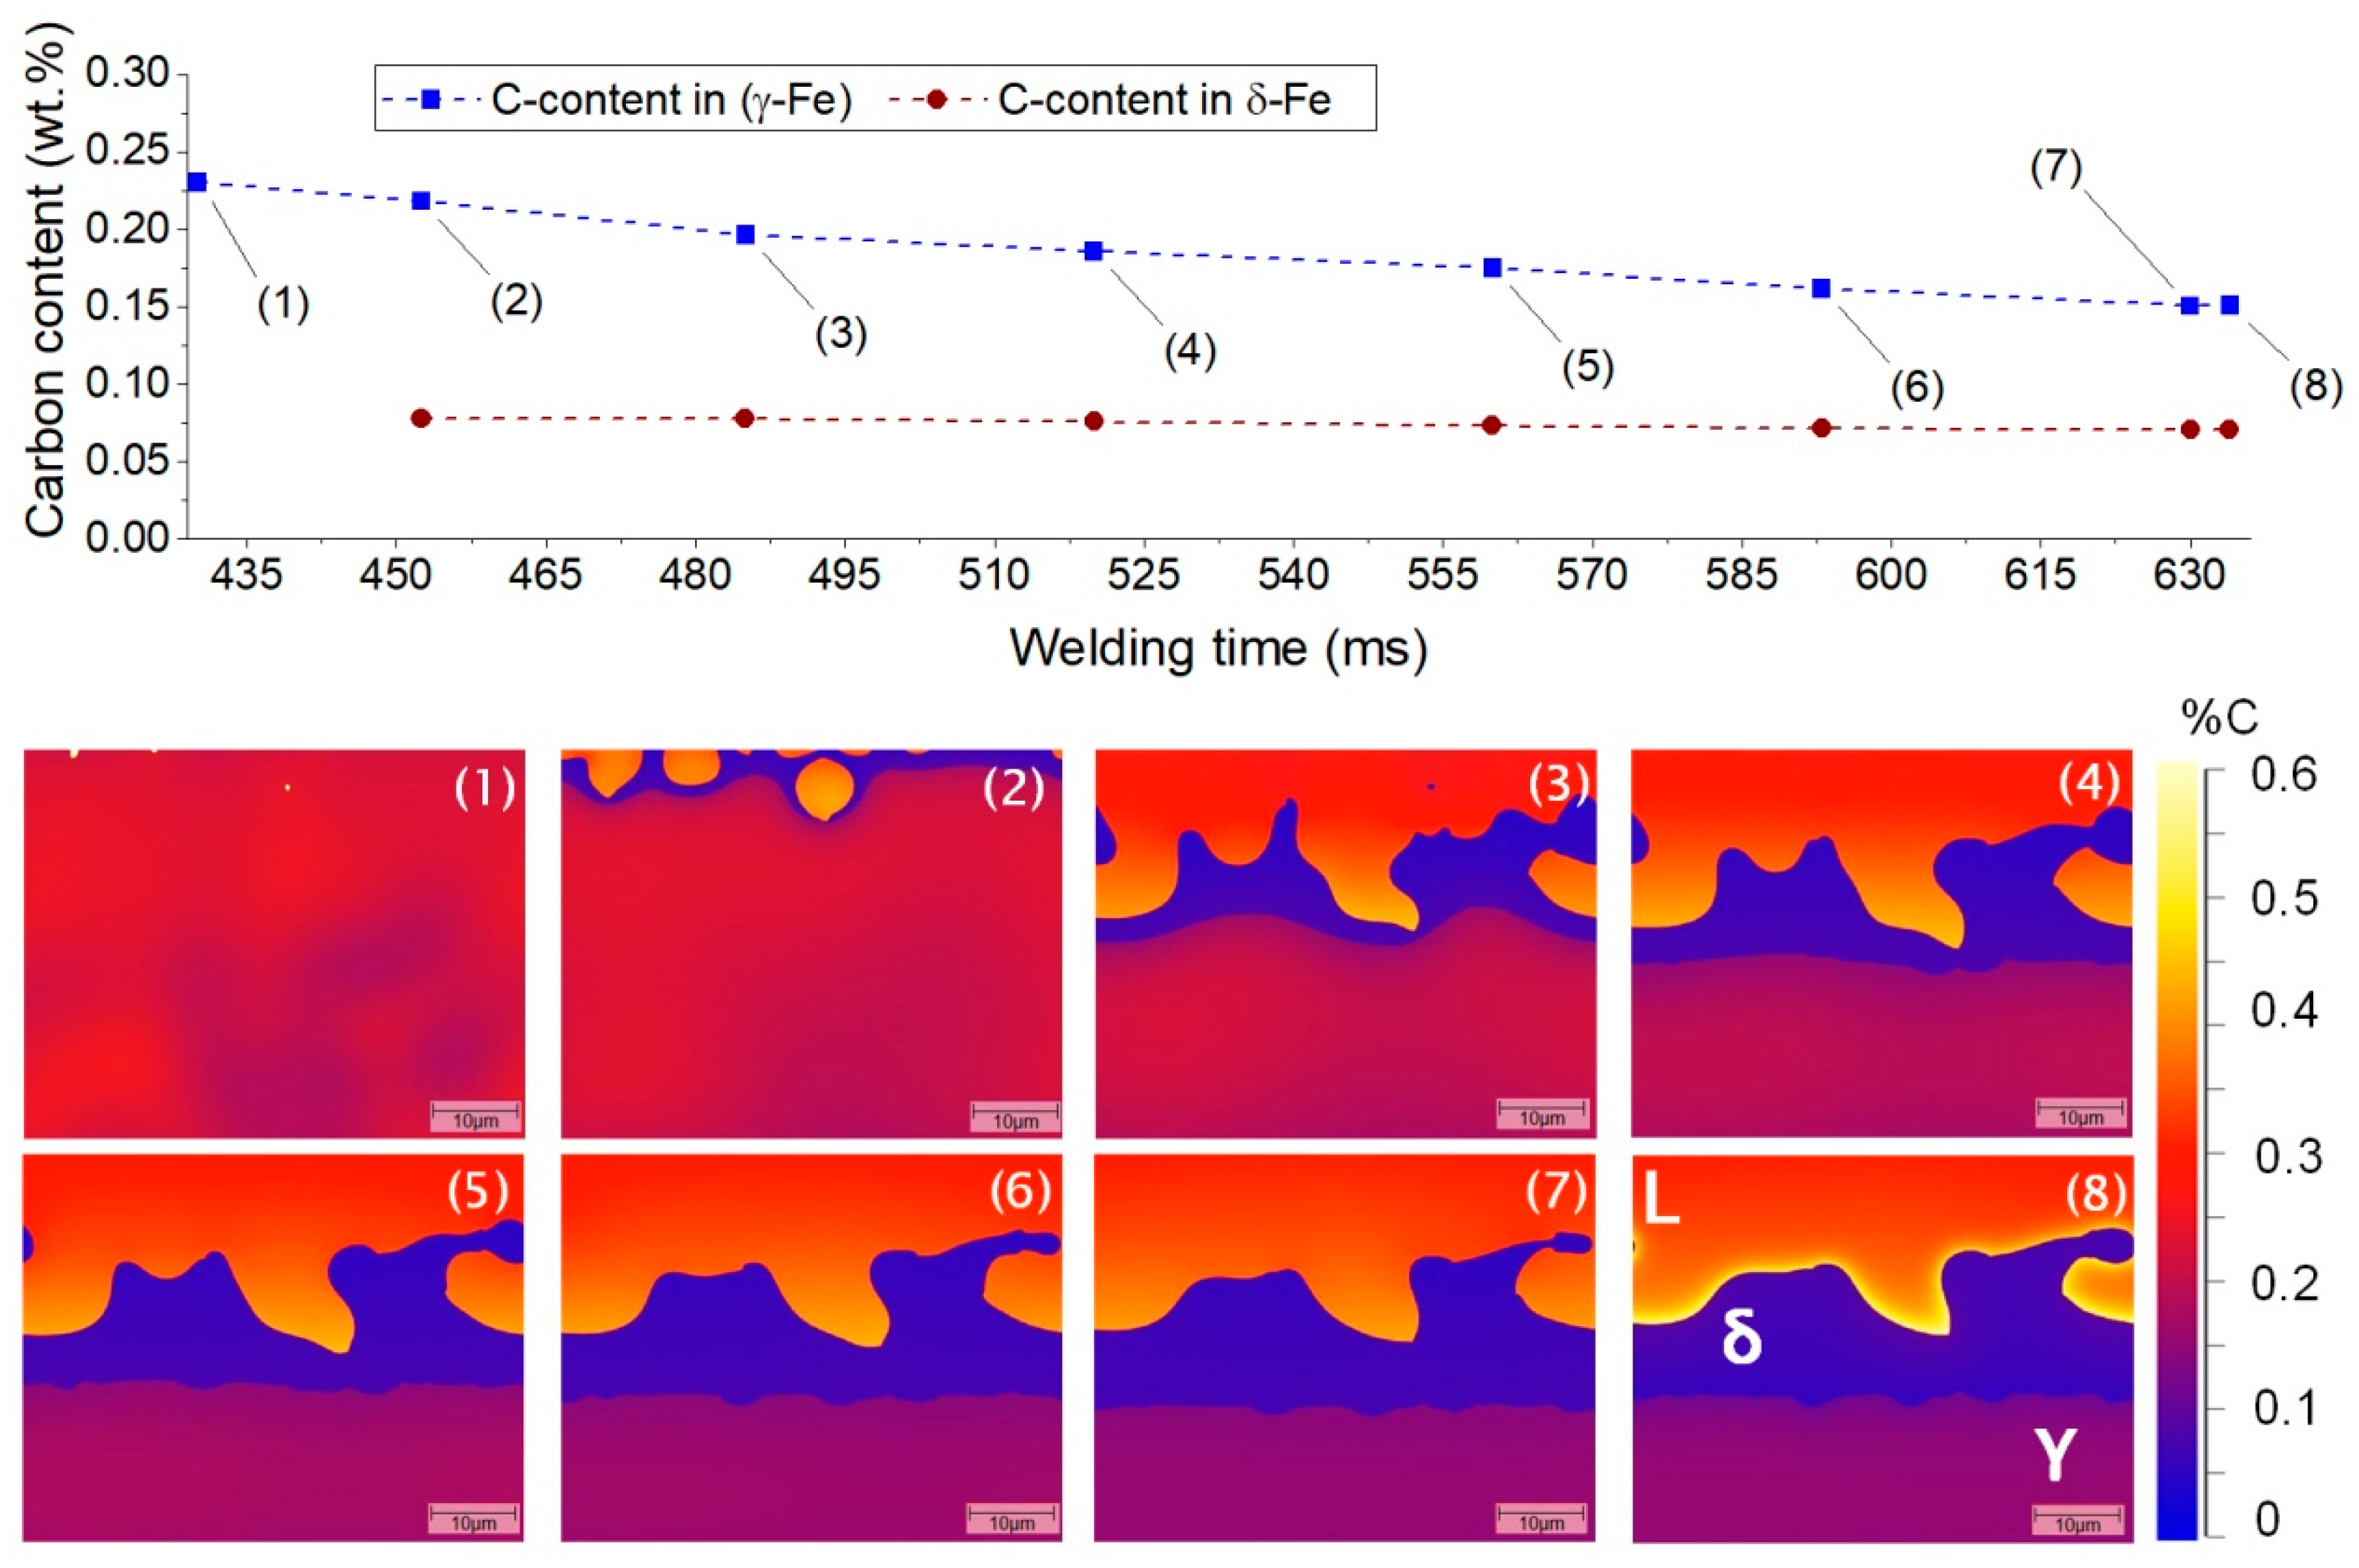
3.4. Simulated Phase Evolution at the Fusion Boundary

Obtaining the temperature profile from the FE-Simulation and using it in the phase field simulation allows understanding the phase evolution at the fusion boundary when the nugget growth is saturated and nearly no movement of the fusion boundary takes place.
As can be seen in Figure 11, the ROI is fully austenitic during the heating phase (1); as the temperature in the middle of the domain reaches the γ → δ transition temperature (2) no δ-Fe is still present in the domain-center, although about 5.3% δ-Fe is present at the top of the ROI. After the nugget growth saturates, the material at the fusion boundary is isothermally “soaked” in the L + δ–region slightly over the peritectic temperature T2. Due to differences in solubility between liquid and solid, chemically driven carbon diffusion takes place, leading to the formation of carbon-depleted regions. Decarburization leads to δ-Fe formation at the fusion boundary. The δ-Fe fraction increases from 16.5% (Figure 11(3)) to 28.8% (Figure 11(7)). δ-Fe is still present (28.6%) 15 °C below T2 (Figure 12(8)) due to the rapid cooling.
Figure 12 shows the carbon distribution in the ROI for the time steps, marked in Figure 11. It can be seen, that δ-Fe is clearly carbon depleted. The carbon content of δ-Fe shows nearly no changes with welding time (variates between 0.0704 and 0.077 wt %). For γ–Fe close to the fusion boundary (at the bottom of the ROI), decrease of carbon content with proceeding welding time was observed, as shown in Figure 12. It decreases from 0.2305 wt % at welding time of 433 ms (1) to 0.151 wt % 630 ms (7). Such behavior can be explained by carbon segregation to the liquid phase due to the higher carbon solubility compared to solid phases, which is in good agreement with the suggestions of [10]. However, it is important to notice that the current model does not take the movement of liquid in the weld nugget into account, and thus underestimates the contribution of this mechanism to the carbon redistribution at the fusion boundary.
After the welding current is turned off, the weld is rapidly cooled (16 K/ms). Cooling to 1480 °C (15 °C below the peritectic temperature) did not result in carbon redistribution in the solid phase. Although it cannot be excluded, that minor carbon redistribution will take place during the further cooling, and considering high carbon diffusivity, it can be neglected because of high cooling rates.

4. Conclusions

This study examined the softening, observed the fusion boundary of resistance spot welds on a press hardening steel 22MnB5, using phase field modeling and experimental observations. It was found, that:
  • During resistance spot welding with long welding times (630 ms), saturation in nugget growth occurs, leading to isothermal holding between peritectic and liquidus temperatures at the fusion boundary.
  • Phase field modeling conducted to examine the material behavior during this isothermal holding has shown that carbon content in austenite reduces from 0.22 wt % to 0.151 wt %, confirming the hypothesis suggesting that carbon redistribution at the fusion boundary is caused by the combination of segregation due to the solubility differences between solid and liquid and the delta-ferrite formation in the peritectic region. The nucleation of δ-Fe with low carbon content (approximately 0.07 wt %) at the fusion boundary and its growth was observed with the proceeding of time.
  • Carbon redistribution at the fusion boundary, obtained from the simulation, is in good agreement with the experimentally measured carbon content.
  • Microhardness mapping gives a clear evidence of a softened region at the fusion boundary, but metallographic investigations and hardness measurements do not allow us to clearly distinguish between δ-Fe and martensite, and therefore further experiments using transmission electron microscopy are necessary to experimentally verify this hypothesis.
  • No presence of aluminum could be detected by EDX measurements in the nugget or at the fusion boundary. Therefore, it does not play any role in the δ-Fe formation at the fusion boundary of Al–Si-coated steel.

Author Contributions

Conceptualization, O.S., O.K., T.H. and S.J.; Investigation, O.S., O.K., P.R. and M.W.; Methodology, O.S., O.K., P.R., M.W. and T.H.; Supervision, T.H. and S.J.; Validation, O.S., P.R. and M.W.; Writing—original draft, O.S. and O.K.; Writing—review & editing, P.R., M.W., T.H. and S.J. All authors have read and agreed to the published version of the manuscript.

Funding

This research was funded by the Research Association on Welding and Allied Processes of the DVS, part of the program to support cooperative industrial research (IGF) by the Federal Ministry for Economic Affairs and Energy, grant number IGF-Nr.:18.939B (DVS-Nr.: 04.060) and National Science Foundation (DFG) in the framework of the Graduate School (No. 1554) ‘Micro-Macro-Interactions in Structured Media and Particle Systems.’.

Acknowledgments

The authors would like to thank AiF for funding the IGF-Project IGF-Nr.:18.939B (DVS-Nr.: 04.060) of the Research Association on Welding and Allied Processes of the DVS, which was part of the program to support cooperative industrial research (IGF) by the Federal Ministry for Economic Affairs and Energy, following a decision of the German Bundestag. An equal thank goes to National Science Foundation (DFG) in the framework of the Graduate School (No. 1554) ‘Micro-Macro-Interactions in Structured Media and Particle Systems.’ The authors also thank to all companies, colleagues, and students who have contributed their support, knowledge and effort to the project. Special thanks for valuable discussions goes to Elliot Biro and Volodymyr Bolbut.

Conflicts of Interest

The authors declare no conflict of interest.

References

  1. Kuhlmann, M.; Mitzschke, N.; Wohner, M.; Jüttner, S. Einfluss von prozessbedingungen beim formhärten auf die verbindungseigenschaften gefügter bauteile. In Proceedings of the 12. Erlanger Workshop Warmblechumformung, Erlangen, Germany, 23 November 2017; Merklein, M., Ed.; Erlanger Workshop Warmblechumformung: Erlanger, Germany, 2017; pp. 129–148. [Google Scholar]
  2. Laurenz, R.; Ohse, P. Einfluss der Ofenverweilzeit von metallisch überzogenem Warmumformstahl auf die Eignung zum Widerstandspunkt-, Buckel- und Lichtbogenbolzenschweißen. Schweißen Schneid. 2012, 64, 654–661. [Google Scholar]
  3. Baryliszyn, P. Widerstandspunktschweißen für Große Bauteiltoleranzen; Dresdner Fügetechnische Berichte; TUDpress: Dresden, Germany, 2015; Volume 30. [Google Scholar]
  4. Sherepenko, O.; Holtschke, N.; Jüttner, S. Microstructural Imperfections in the HAZ of Resistance Spot Welded Ultra High Strength Steel 22MnB5 and Their Impact on Joint Fracture. In Proceedings of the 5th International Conference on Steels in Cars and Trucks Steels in Cars and Trucks, Amsterdam, The Netherlands, 18–22 June 2017. [Google Scholar]
  5. Qiao, Z.; Li, H.; Li, L.; Ran, X.; Feng, L. Microstructure and properties of spot welded joints of hot-stamped ultra-high strength steel used for automotive body structures. Metals 2019, 9, 285. [Google Scholar] [CrossRef] [Green Version]
  6. Schuster, L.; Sommer, S. Characterization and modelling of soft zones around spot welds in high strength steels. In Proceedings of the 5th International Conference on Steels in Cars and Trucks Steels in Cars and Trucks, Amsterdam, The Netherlands, 18–22 June 2017. [Google Scholar]
  7. Sherepenko, O.; Jüttner, S. Transient softening at the fusion boundary in resistance spot welded ultra-high strengths steel 22MnB5 and its impact on fracture processes. Weld. World 2019, 63, 151–159. [Google Scholar] [CrossRef]
  8. Sierlinger, R.; Ritsche, S. Optimierung der Gebrauchseigenschaften von punktgeschweißten verbindungen an Multiphasenstählen. In Proceedings of the Treffpunkt Widerstandsschweißen: Vorträge der gleichnamigen Sondertagung, Duisburg, Germany, 26–27 May 2004; DVS e.V.: Düsseldorf, Germany, 2004. [Google Scholar]
  9. Raath, N.D.; Norman, D.; McGregor, I.; Dashwood, R.; Hughes, D.J. Effect of weld schedule on the residual stress distribution of boron steel spot welds. Metall Mat. Trans. A 2017, 48, 2900–2914. [Google Scholar] [CrossRef] [Green Version]
  10. Li, Y.B.; Li, D.L.; David, S.A.; Lim, Y.C.; Feng, Z. Microstructures of magnetically assisted dual-phase steel resistance spot welds. Sci. Technol. Weld. Join. 2016, 21, 555–563. [Google Scholar] [CrossRef]
  11. Lu, Y.; Peer, A.; Abke, T.; Kimchi, M.; Zhang, W. Subcritical heat affected zone softening in hot-stamped boron steel during resistance spot welding. Mater. Des. 2018, 155, 170–184. [Google Scholar] [CrossRef]
  12. Sommer, S.; Schuster, L.; Schreyer, F.; Tümkaya, G.; Hein, D. Charakterisierung und Modellierung der Beeinflussung des Bauteilverhaltens durch Erweichungszonen an Schweißpunkten Höchst- und Ultrahochfester Stähle unter Crashbelastung; FOSTA: Düsseldorf, Germany, 2017. [Google Scholar]
  13. Wang, L.; Wei, Y.; Zhan, X.; Yu, F. A phase field investigation of dendrite morphology and solute distributions under transient conditions in an Al–Cu welding molten pool. Sci. Technol. Weld. Join. 2016, 21, 446–451. [Google Scholar] [CrossRef]
  14. Amirthalingam, M.; Van Der Aa, E.M.; Kwakernaak, C.; Hermans, M.J.M.; Richardson, I.M. Elemental segregation during resistance spot welding of boron containing advanced high strength steels. Weld. World. 2015. [Google Scholar] [CrossRef] [Green Version]
  15. Amirthalingam, M.; van der Aa, E.M.; Den Uijl, N.; Hermans, M.J.M.; Richardson, I.M. Phosphorous and boron segregation during resistance spot welding of advanced high strength steels. In Proceedings of the 9th International Conference on Trends in Welding Research, Chicago, IL, USA, 4–8 June 2012; DebRoy, T., David, S.A., DuPont, J.N., Koseki, T., Bhadeshia, H.K.D.H., Eds.; ASM International: Cleveland, OH, USA, 2013; pp. 217–226. [Google Scholar]
  16. Wink, H.-J.; Krätschmer, M. Charakterisierung und Modellierung des Bruchverhaltens von Punktschweißverbindungen in pressgehärteten Stählen: Teil II—Simulation des Schweißens. In Proceedings of the 11. LS-DYNA Forum, Ulm, Germany, 10 October 2012. [Google Scholar]
  17. Harlin, N.; Jones, T.B.; Parker, J.D. Weld growth mechanisms during resistance spot welding of two and three thickness lap joints. Sci. Tech. Weld. Join. 2002, 7, 35–41. [Google Scholar] [CrossRef]
  18. Heydt, J.v.d.; Both, C.; Keßler, M. Trends in der Fügetechnik zur Herstellung von Hotform Blanks. In Proceedings of the 12. Erlanger Workshop Warmblechumformung: Tagungsband zum 12. Erlanger Workshop Warmblechumformung, Erlangen, Germany, 23 November 2017; Merklein, M., Ed.; Erlanger Workshop Warmblechumformung: Erlanger, Germany, 2017; pp. 113–126. [Google Scholar]
  19. Provatas, N.; Elder, K. Phase-Field Methods in Materials Science and Engineering; Wiley-VCH: Weinheim, Germany, 2010. [Google Scholar]
  20. Kundin, J.; Mushongera, L.; Emmerich, H. Phase-field modeling of microstructure formation during rapid solidification in Inconel 718 superalloy. Acta Mater. 2015, 95, 343–356. [Google Scholar] [CrossRef]
  21. Ma, N.; Murakawa, H. Numerical and experimental study on nugget formation in resistance spot welding for three pieces of high strength steel sheets. J. Mater. Process. Technol. 2010, 210, 2045–2052. [Google Scholar] [CrossRef]
  22. Jong, Y.-S.; Lee, Y.-K.; Kim, D.-C.; Kang, M.J.; Hwang, I.S.; Lee, W.B. Microstructural evolution and mechanical properties of resistance spot welded ultra high strength steel containing boron. Mater. Trans. 2011, 52, 1330–1333. [Google Scholar] [CrossRef] [Green Version]
  23. Grange, R.A.; Hribal, C.R.; Porter, L.F. Hardness of tempered martensite in carbon and low-alloy steels. Metall. Trans. A. 1977, 8, 1775–1785. [Google Scholar] [CrossRef]
Figure 1. Micrograph of 22MnB5 with a 150 g/m2 aluminum–silicon coating. (a) prior to hot stamping; (b) hot stamped at 930 °C with the furnace time of 6 min.
Metals 10 00010 g001
Figure 2. Microhardness measurements in the cross section of a specimen: 1—Microhardness mapping (HV0.05) and 2—Microhardness line-scan with HV0.1.
Metals 10 00010 g002
Figure 3. A model in SORPAS, used to obtain temperature history: (a) meshed electrodes and specimens; (b,c) temperature distribution for the welding time of 630 ms; (d) temperature history of the marked region at the fusion boundary.
Metals 10 00010 g003
Figure 4. Phase distribution (a) and temperature gradient (b) in the simulation domain.
Metals 10 00010 g004
Figure 5. (a) Pseudo-binary Fe–C diagram for 22MnB5 with marked critical temperatures; (b) Temperature profile of a node, close to the fusion boundary from the fixed effects (FE)-simulation and linearized temperature profile used for the phase-field simulation.
Metals 10 00010 g005
Figure 6. Nugget diameter and height, measured in the cross section of the specimen.
Metals 10 00010 g006
Figure 7. Microhardness line scan in a cross-section of a weld joint (welding time of 630 ms) with heat affected zone (HAZ) regions according to [22].
Metals 10 00010 g007
Figure 8. (a) Hardness mapping of the specimen with a welding time of 630 ms; (b) hardness line-scan across the fusion boundary (point A to B).
Metals 10 00010 g008
Figure 9. (a) Cross-section of a specimen with a total welding time of 630 ms after a Klemm I–etching; (b) overlaid hardness mapping; (c) magnified view of the fusion boundary.
Metals 10 00010 g009
Figure 10. Comparison of measured carbon content for a specimen with welding time of 630 ms with results of simulated carbon content.
Metals 10 00010 g010
Figure 11. Simulated phase evolution in the reactive oxygen intermediate (ROI) at the fusion boundary for different welding times. Phase composition of ROI for time steps 1 through 8 from the upper graph is represented in Figure 1, Figure 2, Figure 3, Figure 4, Figure 5, Figure 6, Figure 7 and Figure 8.
Metals 10 00010 g011
Figure 12. Carbon redistribution and carbon content of individual phases in the ROI for different welding times. Carbon distribution in the ROI for time steps 1 through 8 from the upper graph is represented in Figure 1, Figure 2, Figure 3, Figure 4, Figure 5, Figure 6, Figure 7 and Figure 8.
Metals 10 00010 g012
Table 1. Chemical composition of 22MnB5 in weight percent.
CMnPSSiAlTiB
0.221.180.01090.0020.2590.030.040.0034
Table 2. Tensile strength and hardness of the test material 22MnB5 in as-delivered and hot stamped condition.
As-DeliveredHot Stamped
Tensile Strength Rm (MPa)Hardness (HV0.1)Tensile Strength Rm (MPa)Hardness (HV0.1)
565 ± 8175 ± 111457 ± 18489 ± 15
Table 3. Welding parameters.
Welding Time 1Welding Current 1Cool TimeWelding Time 2Welding Current 2Electrode ForceWeld Diameter
tw1 (ms)Iw1 (kA)tp (ms)tw2 (ms)Iw2 (kA)F (kN)dw (mm)
3004.5303005.53.55.8
Table 4. Determination of temperature gradient at the fusion boundary.
Node PhaseNode Temperature at
tw = 630 ms (°C)
Distance between Nodes
(µm)
Temperature Gradient
(°C/cm)
Liquid15732529059
Solid1344
Table 5. Chemical composition of material in the phase field model in wt %.
CMnAl
0.221.20.03
Table 6. Characteristic points of the linearized temperature profile.
ParameterPoint
AA’BB’CC’DD’
Temperature (°C)14501396150414501504145014801426
Welding time (ms)419460630644.5
Simulation time (ms)041211215

