Through-Thickness Microstructure and Strain Distribution in Steel Sheets Rolled in a Large-Diameter Rolling Process


Research Center for Structural Materials, National Institute for Materials Science, 1-2-1, Sengen, Tsukuba 305-0047, Japan
*
Author to whom correspondence should be addressed.
Metals 2020, 10(1), 91; https://doi.org/10.3390/met10010091
Submission received: 17 December 2019
/
Revised: 28 December 2019
/
Accepted: 3 January 2020
/
Published: 5 January 2020
(This article belongs to the Special Issue Researches and Simulations in Steel Rolling)
Abstract
:The rolling condition for fabricating a low-carbon niobium-microalloyed steel sheet with an ultrafine-grained (UFG) structure was examined through rolling experiments and finite element analysis. A large-diameter rolling process was proposed to create a UFG structure. The rolling was conducted near the transformation point, Ar3, from austenite to ferrite. The Ar3 was measured at the surface and the center of the sheet. First, the through-thickness microstructure and equivalent strain distribution in a 1-pass rolled sheet 2.0 mm thick were examined. In the rolling experiments, the embedded pin method was employed to understand through-thickness deformation. The magnitude of the equivalent strain to obtain a UFG structure was estimated to be 2.0. Based on these results, the fabrication of a 2 mm UFG steel sheet by 3-pass rolling for an initial thickness of 14.5 mm was attempted by the proposed large-diameter rolling process.
1. Introduction
Research on metallic materials with an ultrafine-grained (UFG) structure (below ~2 μm) is constantly being conducted all over the world, because they have improved mechanical and physical properties without the addition of alloying elements [1,2,3,4,5,6,7,8]. The grain size depends on processing parameters such as the deformation temperature, strain, strain rate, and cooling rate [9,10,11]. Of these, the strain introduced in materials by plastic deformation is as important a factor as the deformation temperature for creating UFG structures. Generally, since a large strain is needed for creating grain refinement, severe plastic deformation (SPD) techniques have been proposed [3], and the mechanical properties and microstructures of UFG materials fabricated through these techniques have been studied in detail. However, most SPD techniques use batch processes, and a large strain is achieved by repeating the plastic deformation. Hence, these SPD techniques do not directly lead to the production of bulk UFG materials on a commercial level.
Rolling is a superior plastic deformation process in the mass production of metallic sheets. Attempts have been made to create UFG steel sheets by a rolling process. A simple method of creating UFG steel sheets is to conduct multi-pass rolling at a warm temperature [4,5,6,7,8]. In this case, since the microstructure has a strong texture that depends on the rolling process, the mechanical properties, especially toughness, are strongly related not only to grain size but also to texture [4,6,7,8,12,13]. Furthermore, this method is the same as SPD techniques, and it is not efficient in the deformation process. Etou et al. [14] reported that UFG steel sheets 1.2 mm thick with random texture were successfully fabricated by 40% to 50% reduction 3-pass continuous rolling at the final-pass interval of 0.17 s, at a temperature around Ae3. The rolling was conducted using a ɸ 200 mm two-high tandem mill with a high speed of 6–12 m/s. The size of the equiaxed ferrite grain was 0.9 μm at the surface layer and 1.4 μm at mid-thickness. Shen et al. [15] showed that a micro-alloyed steel plate 20 mm thick with UFG ferrite of 1–3 μm at the surface layer and ferrite of 7.8 μm at mid-thickness was fabricated by a rolling coupling water-cooling control process. The 6-pass rolling was conducted at above Ae3 by a ɸ 450 mm two-high reversible mill with a rolling speed of 1.3 m/s, and the total reduction was 76%.
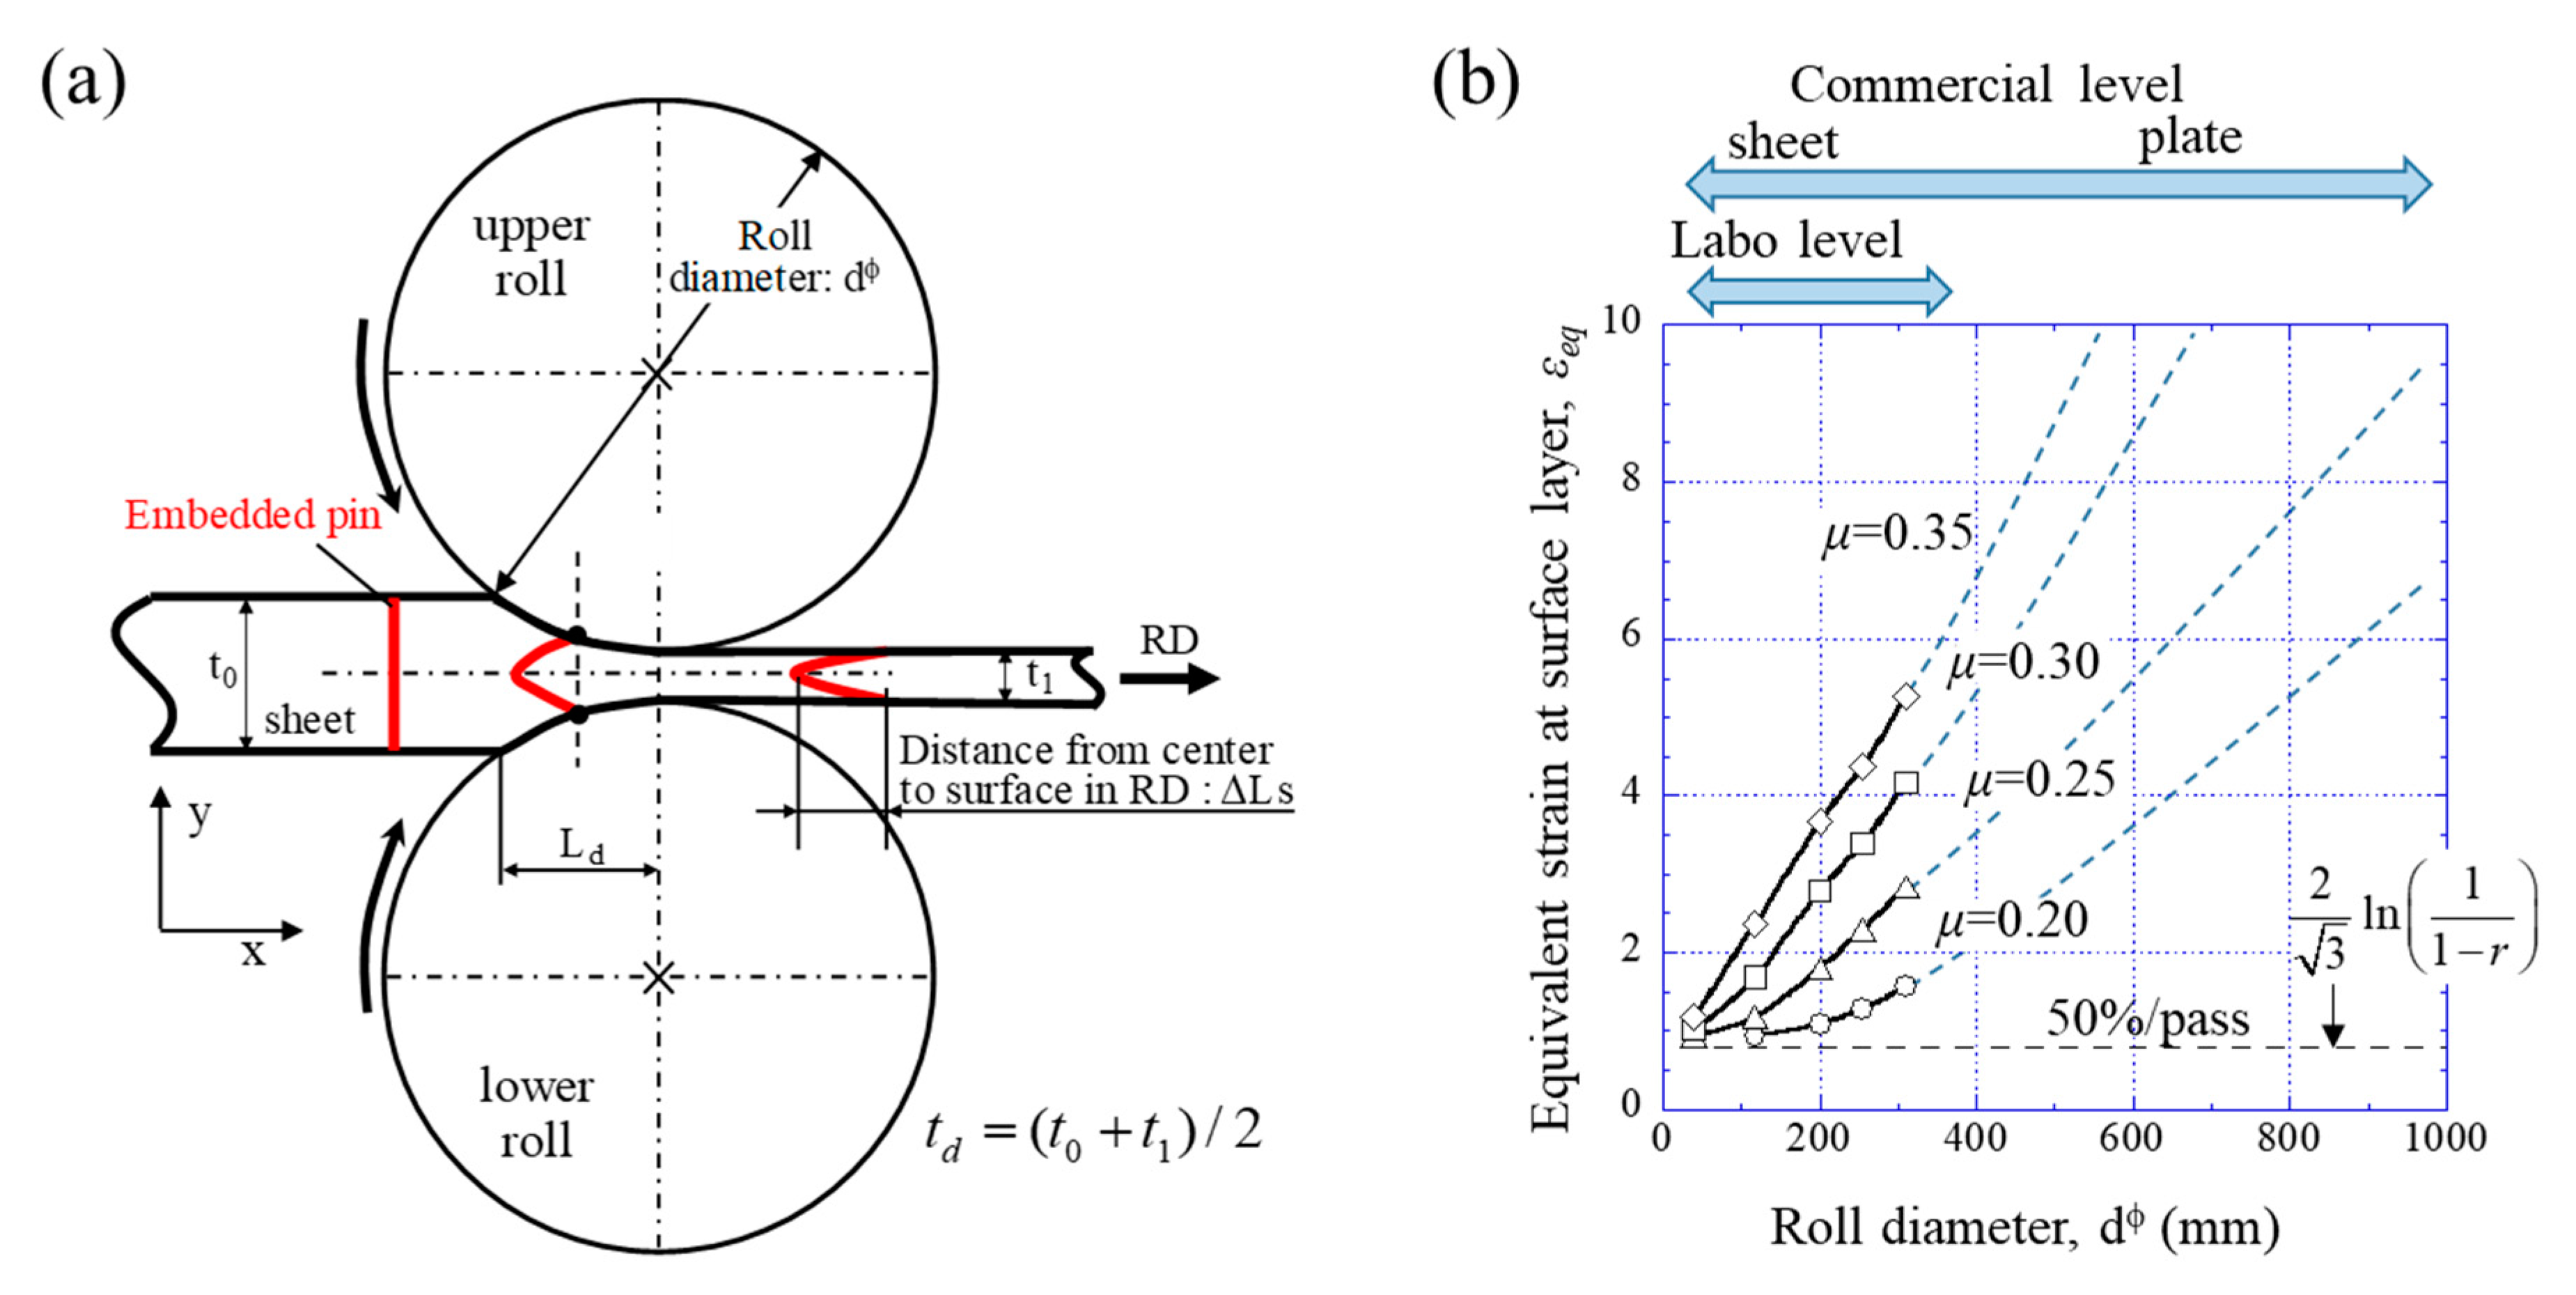
The microstructure of a sheet processed by rolling changes depending on the thickness location of the sheet [16,17,18]. It seems that these changes are mainly caused by the strain distribution through-thickness rather than the cooling rate and temperature. The strain imposed by rolling is determined by not only the friction between the rolls and the sheet surface but also the roll bite geometry, Ld/td [3]. Here, Ld denotes the projected length of the contact arc to the horizontal plane, and td is the average sheet thickness, as shown in Figure 1a. The Ld/td is expressed as follows:
here, r is the reduction, dɸ denotes the roll diameter, and t0 is the initial thickness. As can be seen from this equation, the Ld/td increases with increasing dɸ or r and with decreasing t0. Hence, a very large strain can be introduced near the surface layer with a large roll diameter, high reduction, and thin sheet thickness. Figure 1b shows the relation between dɸ and the equivalent strain εeq at the sheet’s surface for a friction coefficient, μ, of a 50% (2t→1t mm) rolled pure Al sheet [3]. The εeq at the sheet’s surface becomes larger with dɸ, and this is more effective under high friction. Generally, dɸ below 400 mm, as a rolling simulator, is used in the laboratory setting. On the other hand, in a commercial setting, a small dɸ under a rolled sheet and a large dɸ under a rolled plate are employed. That is, the dɸ in the rolling mill becomes smaller with decreasing steel thickness because of the reduction of the rolling load. From the viewpoint of large strain introduction, a UFG steel sheet may be fabricated by a hot rolling process with a large-diameter roll.
This study aims to determine a rolling condition for fabricating UFG steel sheets through a combination of rolling experiments and finite element analysis (FEA), which is a powerful tool for understanding deformation behaviors during the plastic deformation process. In order to introduce a large strain, a rolling mill with a large roll diameter of 624 mm was used in steel sheet hot rolling without a lubricant.
2. Experimental Procedure
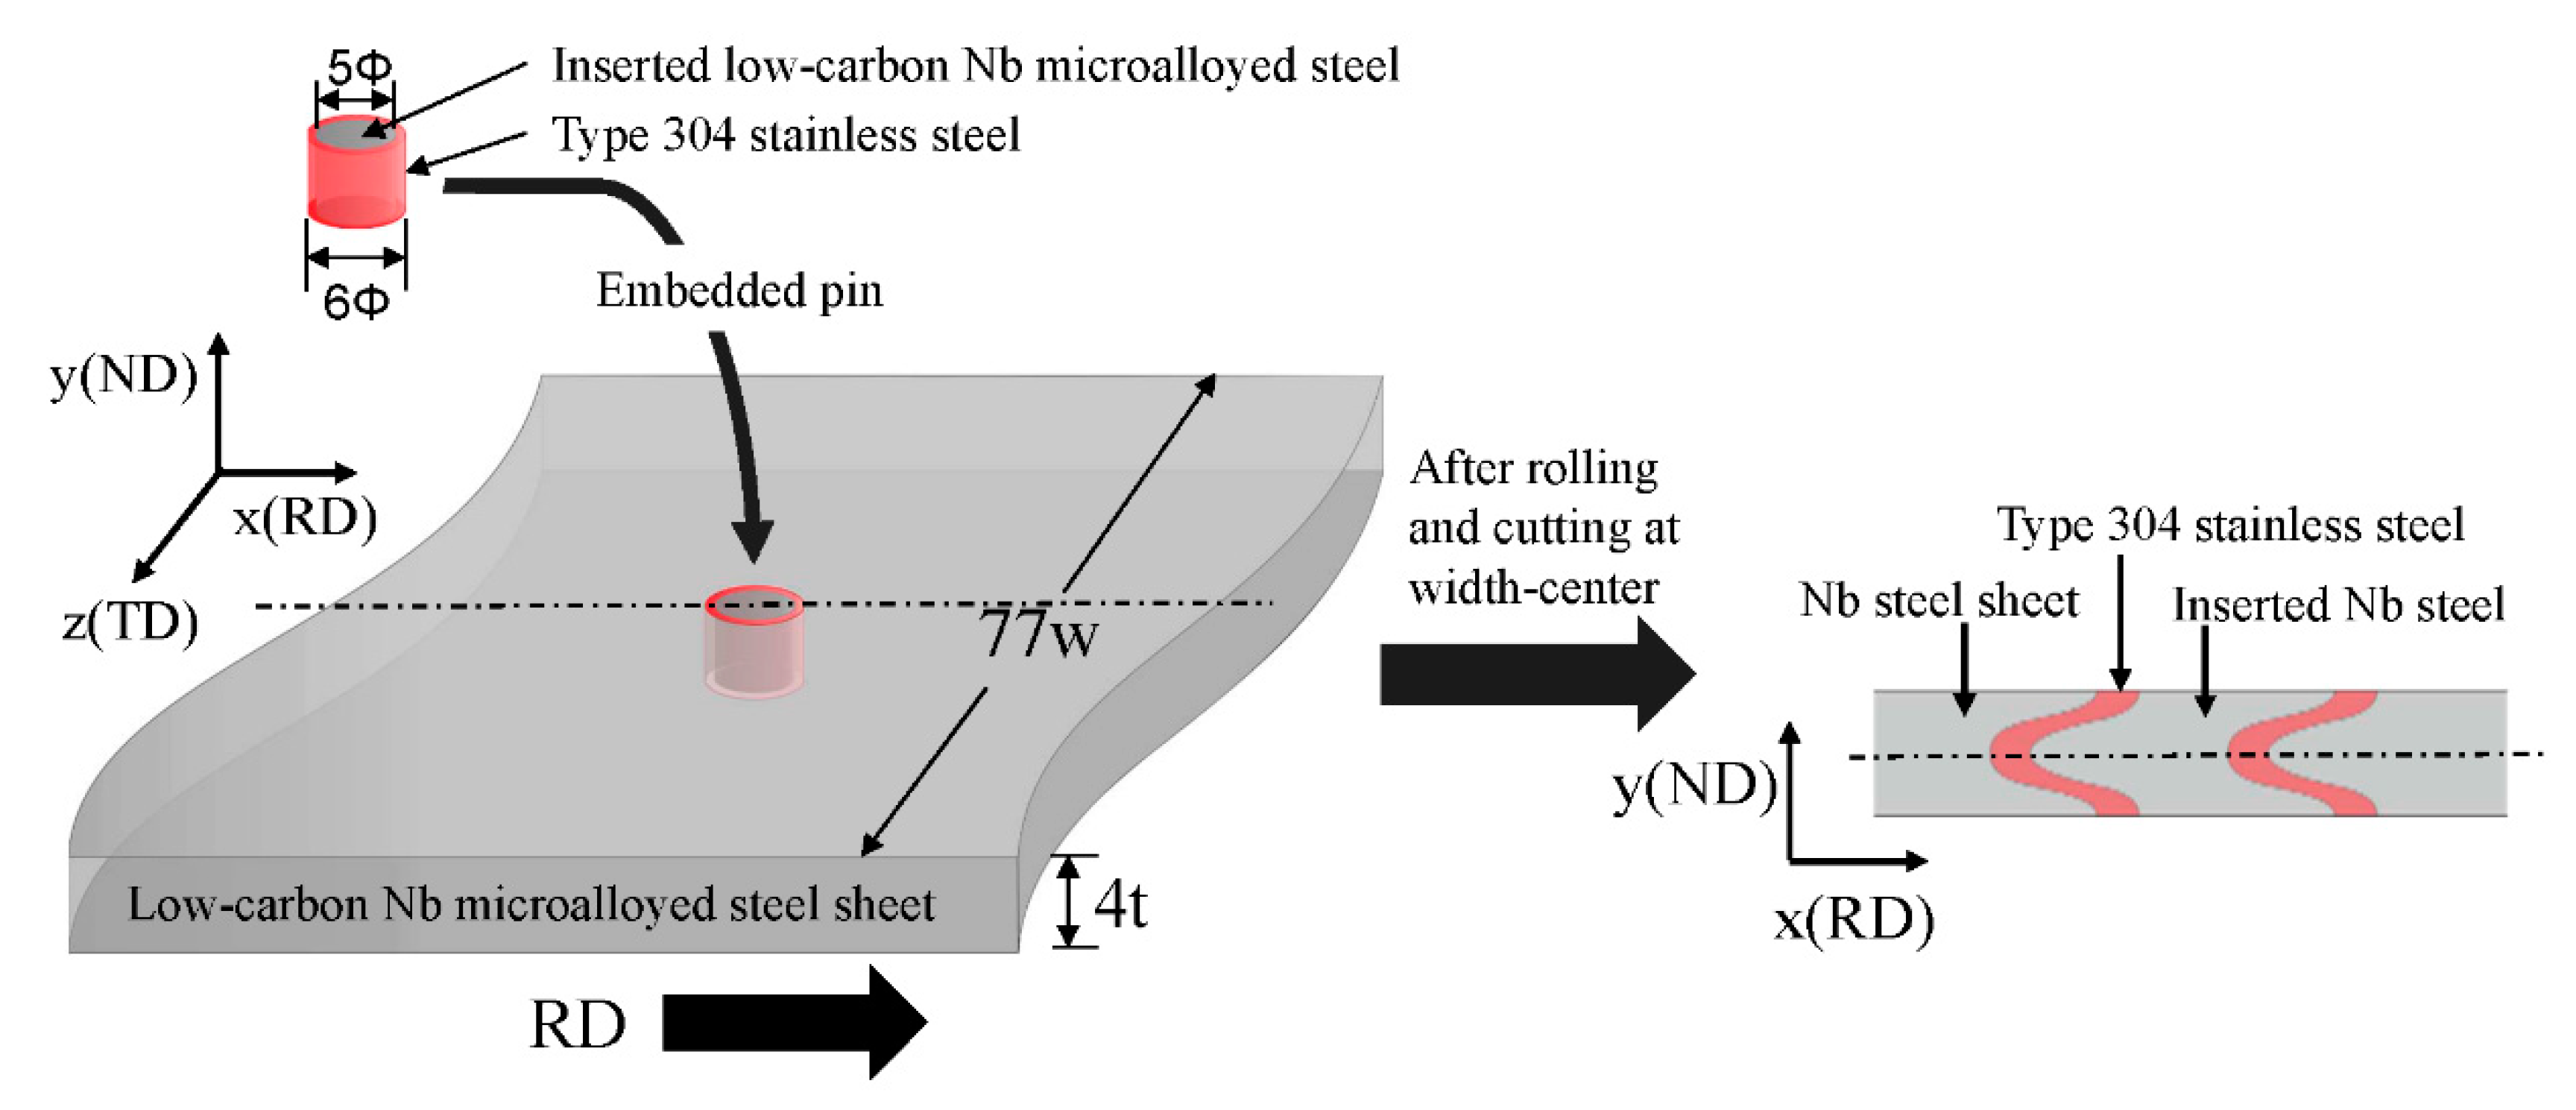
A low-carbon niobium (Nb)-microalloyed steel with a chemical composition of 0.16 C, 0.2 Si, 1.4 Mn, 0.03 Nb, and the balance Fe (all in mass %) was used in this study in order to utilize the pinning effect of austenite with a high accumulated dislocation density before transformation. A 170 kg ingot was prepared by vacuum induction melting and casting, homogenized at 1200 °C, hot forged to a 90 mm thickness, and then hot rolled into a plate 48 mm thick. A block, 45t × 140w × 300L mm3, was cut out of the plate, homogenized at 1200 °C, and then hot rolled to a thickness of 10 mm. The 10 mm thick plate was solution treated at 1200 °C for 1 h, followed by water quenching. Steel sheets 4 mm thick, 77 mm wide, and 500 mm long were machined from the plate. In order to obtain accurate through-thickness deformation after rolling, a pin composed of low-carbon Nb-microalloyed steel and type 304 stainless steel was embedded at mid-width for the sheet, as shown in Figure 2. The low-carbon Nb steel bar with a diameter of 5 mm was machined from the 10 mm thick plate. The pin was made by inserting the bar in a hollow type 304 stainless steel, having an outer diameter of 6 mm and an inner diameter of 5 mm.
The rolling schedules are shown in Figure 3. The sheets were first heated to 900 °C and held for 1800 s. At this time, the austenite grain size was about 20 μm. Here, since the grain size of ferrite transformed from deformed austenite becomes finer with a decrease in the initial austenite grain size [19], a relatively small austenite grain size of 20 μm for the purpose of producing a sheet with UFG structure was selected. Subsequently, the sheets were air-cooled and rolled near the Ar3. A rolling mill of the reverse type with a roll diameter of 624 mm was used, and the rolling was conducted without a lubricant at a rolling speed of 1 m/s. The roughness at the roll’s surface was 0.25–0.30 μm. The temperatures immediately before rolling and after water cooling were measured at the sheet’s surface by a surface thermometer with a gold-coated cavity, MBST-102 (Kawaso Electric Industrial Co., Ltd., Osaka-shi, Japan). The exact rolling reduction was calculated by measuring the sheet thickness after rolling. After rolling, the sheets were cooled immediately to 500–550 °C by rapid water cooling, and then they were air-cooled to ambient temperature. The equilibrium transformation point, Ae3, of the present steel is about 820 °C [20]. However, since the transformation point from austenite (γ) to ferrite (α) depends on the cooling rate and prior γ grain size, the accurate Ar3 in the sheets was measured. Figure 4 shows variations in temperature at the surface and center of a sheet with time after being taken out of the heating furnace. Here, the temperature at the sheet’s surface was measured by a surface thermometer, and that at mid-thickness was measured by inserting a thermocouple from the end of the sheet’s width to the width center. The Ar3 was about 680 °C at the surface and about 720 °C at mid-thickness. The deformation of the pin in the rolled sheets was observed through a digital microscope, VHX-900 (KEYENCE, Osaka-shi, Japan). The microstructures at mid-width in the rolled sheets were observed using the electron back-scattered diffraction (EBSD) method in a SEM (Carl Zeiss, Jena, Germany) equipped with a field emission gun.
3. Numerical Procedure
The FE code ABAQUS/Explicit was employed for numerical analysis. A 4-node linear element in a plane strain model, element type CPE4R, was used for a sheet of 4 mm in initial thickness, and the rolls were regarded as the rigid body. No remeshing was carried out in the analysis because the mesh deformed by rolling is related to the flection of the pin in the embedded pin method. The Coulomb condition was used as the frictional condition between the rolls and the sheet, τf = μ p, where τf denotes the shear stress, p is the contact pressure, and μ is the friction coefficient. The roll diameter and the rolling speed are the same—624 mm and 1 m/s, respectively—as in the experiments. The appropriate mesh division in the FEA must be examined because the magnitude of strain near the surface with a very large shear deformation certainly depends on the mesh size. Suitable meshes were determined based on previous results [17]. The finite element mesh in the sheet 4 mm thick with dimensions of 2t × 30L mm2 is shown in Figure 5. The sheet thickness was divided into 40 elements, i.e., tel = 0.05 mm was used throughout the sheet. On the other hand, the minimum Lel is 0.025 mm at mid-length (center element), and Lel gradually increases toward the front and back. The stress–strain relationships, depending on the strain rate employed in the analysis, were measured experimentally by the compression test of a cylindrical specimen. The relationships were measured experimentally until the true strain of 0.4, and subsequent relationships were extrapolated by assuming Hollomon’s equation. As shown in Figure 4, since the Ar3 varies with the cooling rate after the austenite temperature, the cylindrical specimen was controlled at 6 K/s by gas cooling after 900 °C and, subsequently, was compressed at 700 °C at strain rates of 1/s, 10/s, and 50/s. The 700 °C corresponds to the average temperature of the Ar3 at the surface and center of the sheet measured experimentally, and the rolling temperature in the FEA was conducted at 700 °C. A Young’s modulus of 140 GPa and a Poisson’s ratio of 0.35 were used as the elastic modulus. The rolling reduction used in the FEA was determined based on the experimental results.
4. Results and Discussion
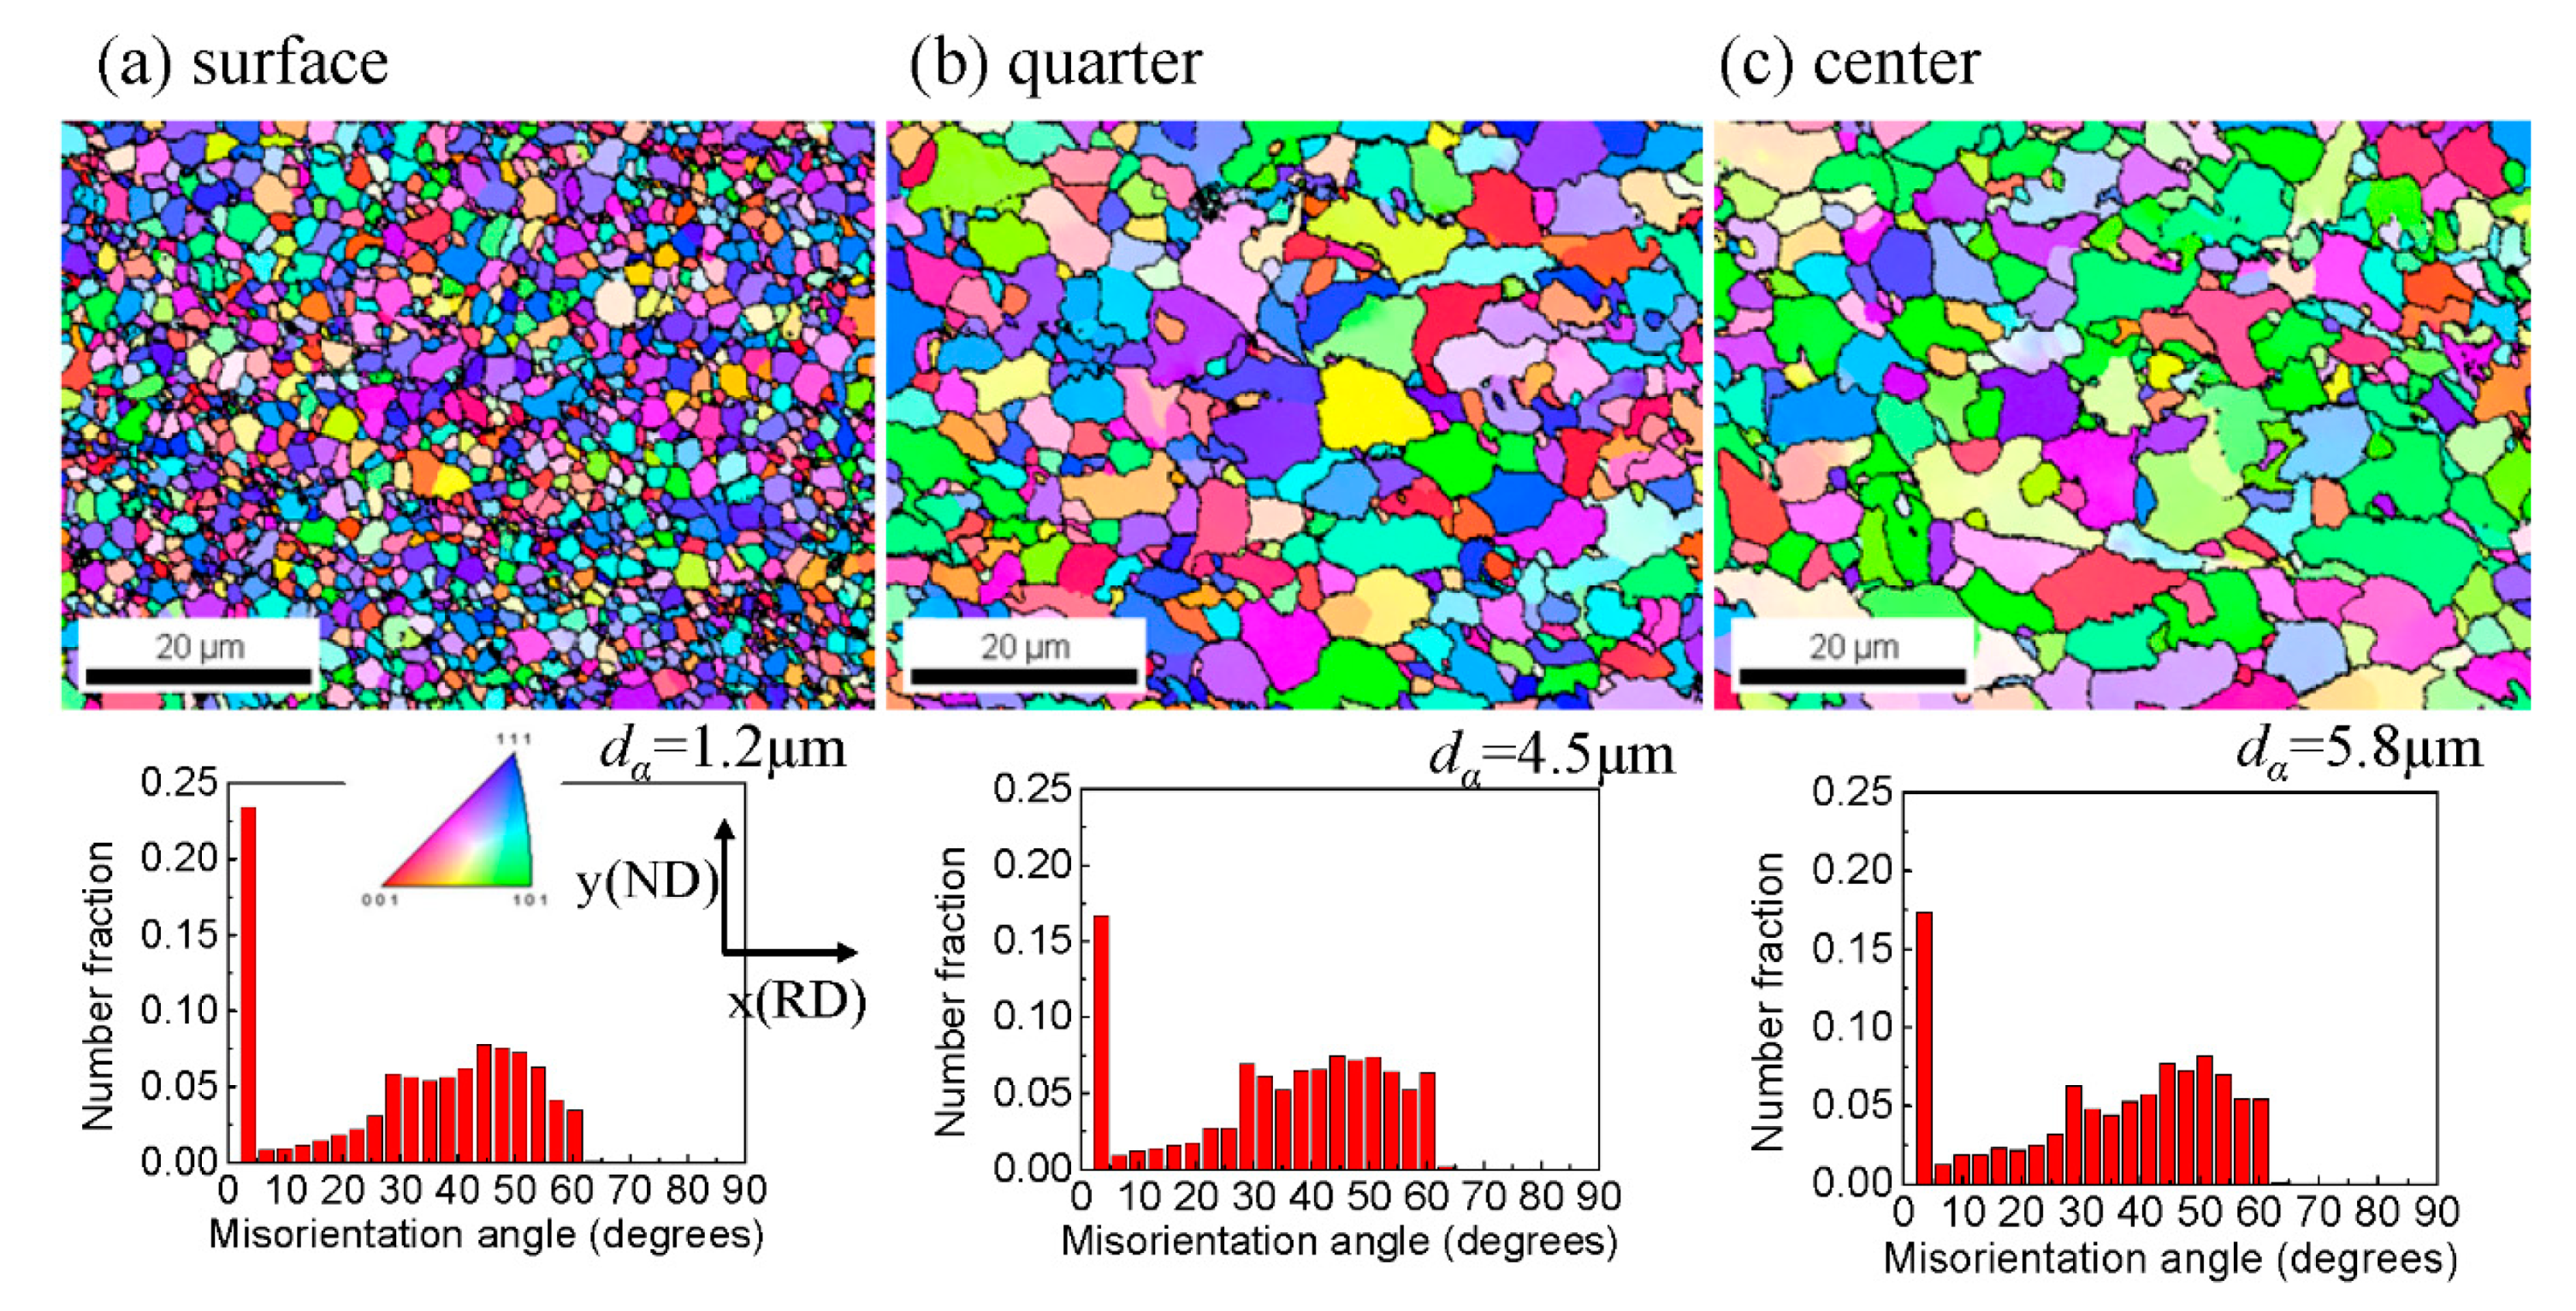
Figure 6 shows the SEM microstructure at the surface, quarter, and center of the rolled sheet. When the rolling conditions are r = 40% and Ts = 773 °C, the size of the α grain is almost the same (Figure 6a–c) throughout the thickness. This is because the rolling temperature is about 50 °C higher than the Ar3, and the microstructure is insensitive to the strain distribution in the sheet thickness. On the other hand, in Figure 6d–f, when rolling was conducted at Ts = 690 °C just above the Ar3 (680 °C) at the surface under r = 50%, the grain size changes depending on the thickness location of the sheet. In particular, an ultrafine-grained structure is formed at the sheet’s surface. Figure 7 shows the orientation maps along the normal direction (ND) at each site’s through-thickness that were obtained by EBSD analysis for the rolled sheet of r = 50% and Ts = 690 °C, and the misorientation distributions. The average grain sizes, dα, with misorientation angles of more than 15° were 1.2 μm at the surface, 4.5 μm at the quarter, and 5.8 μm at the center. Namely, the dα becomes smaller toward the surface. Although the temperature at the sheet’s center, from Figure 4, is estimated to be 708 °C lower than the Ar3 (720 °C) at the center, the microstructures have random orientation throughout the thickness. This seems to be caused by heat generation due to plastic deformation during high reduction at a large roll diameter. The difference in the grain size depending on the thickness location mainly occurs by strain distribution. The strain distribution in the rolled sheet was quantified through FEA and the rolling experiments with the embedded pin method.
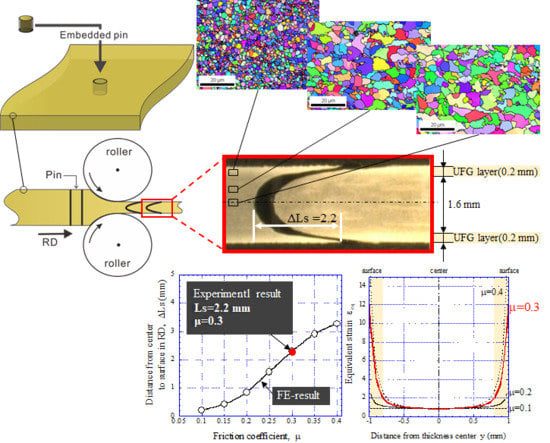
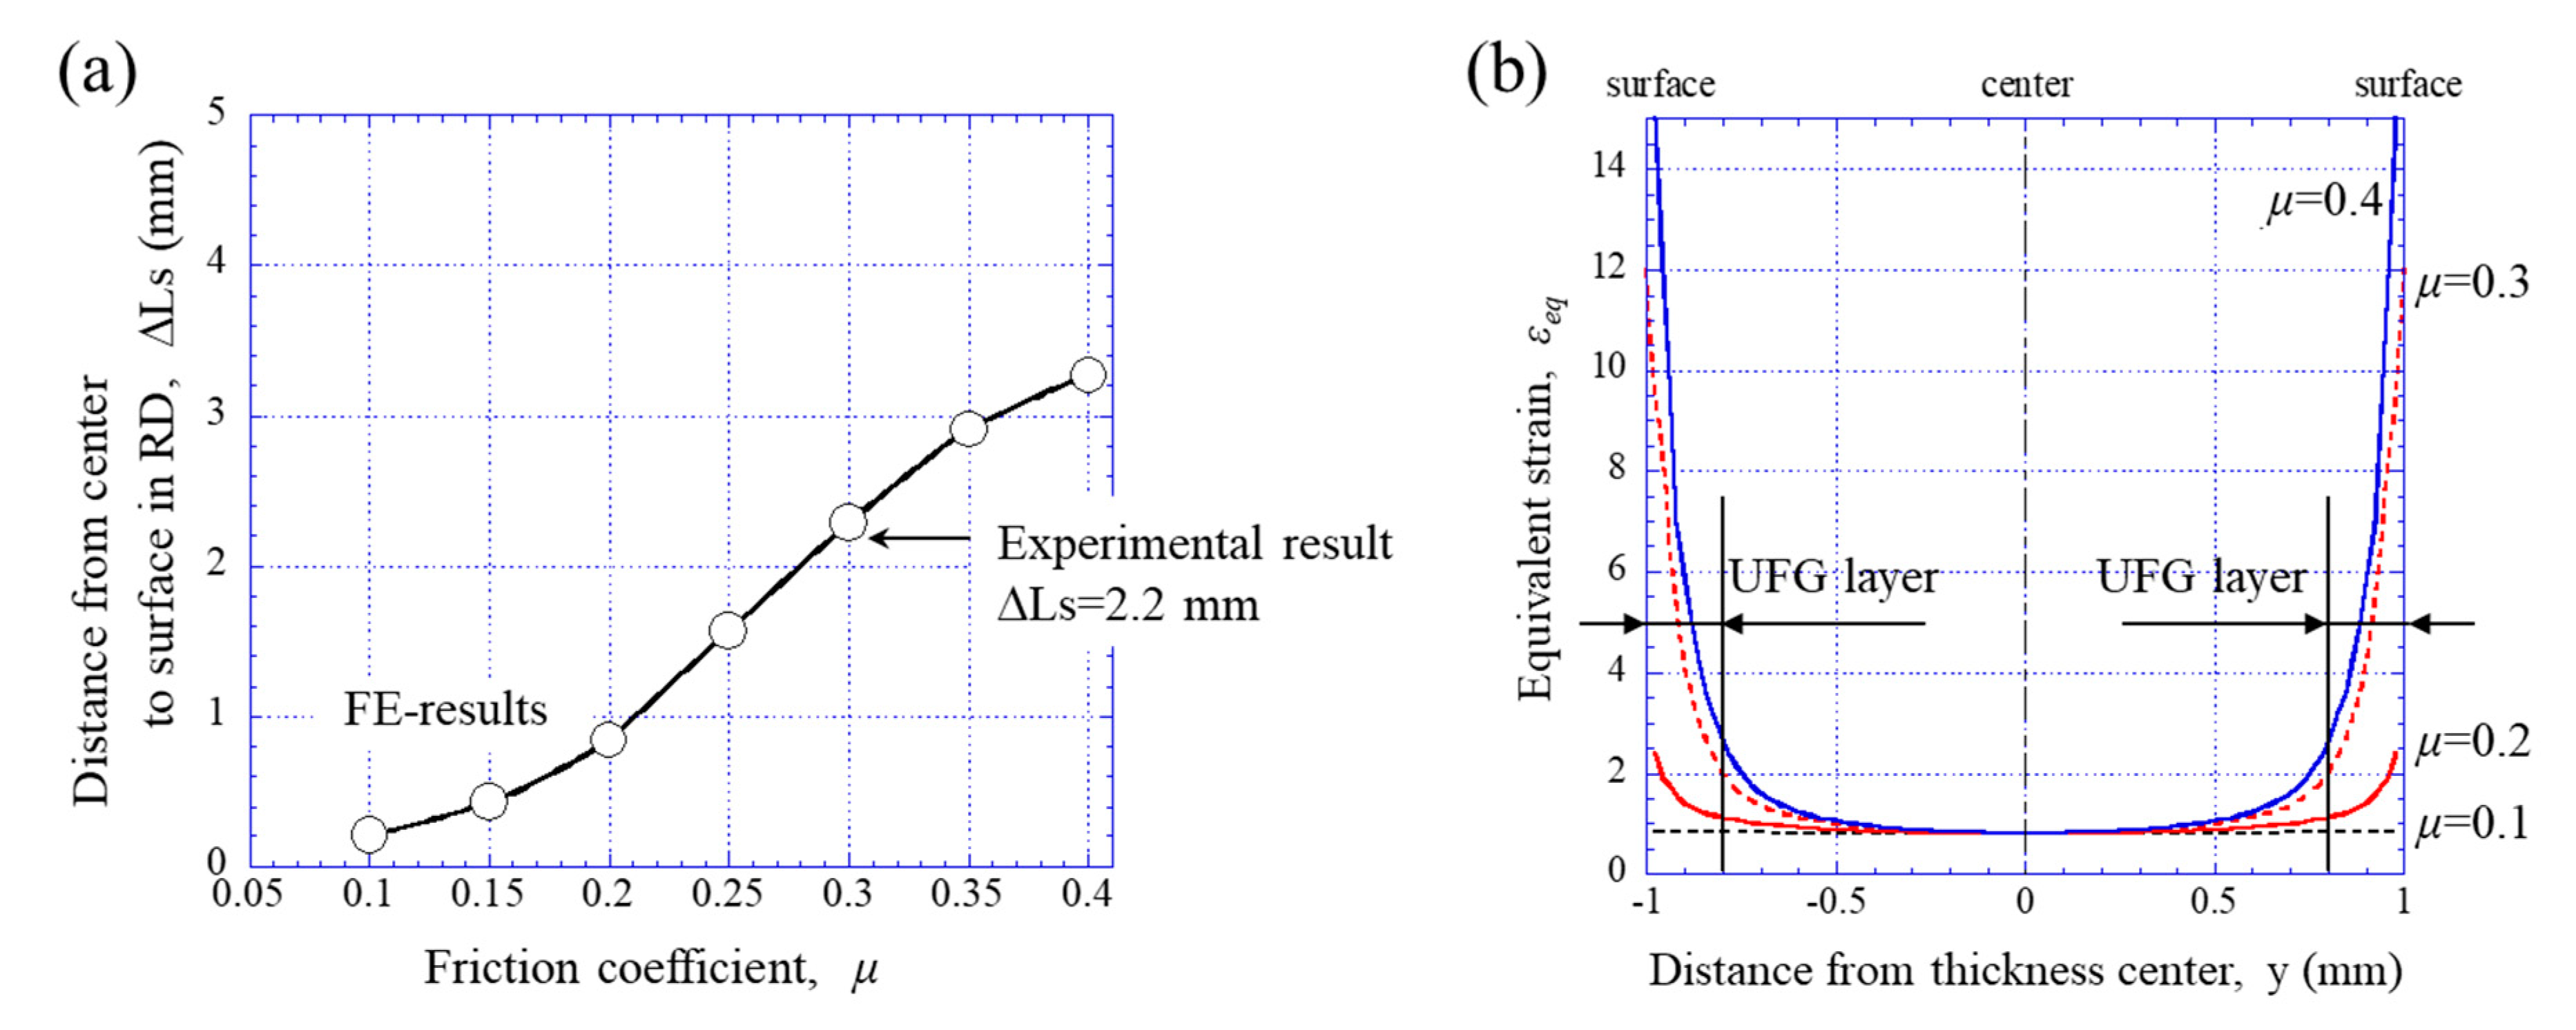
The flection of the pin embedded before rolling is exhibited in Figure 8, including SEM microstructures at the surface, quarter, and center. The ΔLs, which denotes the distance from the center to the surface in the rolling direction (RD), measured using the embedded pin method, was 2.2 mm. It can be seen that the contrast at the surface layer of 0.2 mm varies within the 2 mm thickness. The UFG structure was formed in the surface layer. Such a contrast difference in optical micrographs has been reported in the literature [15,16,21]. Figure 9 shows deformed meshes of a center part of the FE mesh (center mesh in Figure 5) with μ = 0.1, 0.2, 0.3, and 0.4. The flection through the thickness, i.e., the ΔLs, becomes larger with increasing μ. This feature is consistent with the experimental results [3,18], in which the flection of the embedded pin is larger in a sheet rolled without lubricant than that with lubricant. Figure 10 shows variations of ΔLs against μ obtained from FEA and a distribution of the equivalent strain, εeq, throughout the thickness. From Figure 10a, the μ is estimated to be approximately 0.3 in the present experiments (ΔLs = 2.2 mm). The εeq for over μ = 0.2 gradually increases toward the surface from the center and shows a distribution with the maximum at the surface, because a shear strain is imposed at a location other than the thickness center. The εeq at the center is constant regardless of μ, and its magnitude indicates 0.8. This agrees with the value 1.15 ln{1/(1−r)} calculated simply from a 50% reduction in thickness.
It is well known [9,15,22,23,24,25] that the grain size of α transformed from deformed γ becomes finer with an increase in the εeq induced in the γ. Thus, it is difficult to produce a uniformly UFG structure throughout the thickness because the εeq has a distribution in a hot rolled strip as shown in Figure 10b. In previous papers [9,24], we reported that the α grain size becomes constant at a strain range of εeq ≥ εeq (cri.) regardless of the temperature. If a plastic strain more than the critical strain, εeq (cri.), can be introduced to the γ region, fine ferrite grains of the same size may be created uniformly throughout the rolled sheet thickness. From Figure 10b, when the μ is 0.3, the εeq represents a maximum value of about 12 at the surface. Additionally, the εeq at 0.2 mm from the surface corresponding to the layer of the UFG structure indicates just 2.0. This indicates that the εcri. for creating a UFG structure in hot rolling is 2.0 in the present steel. This critical value corresponds to a high reduction of r = 83% under a plane strain condition such as sheet rolling. However, since this is impossible with a 1-pass rolling process, 3-pass rolling was attempted with a total reduction of more than 83%.
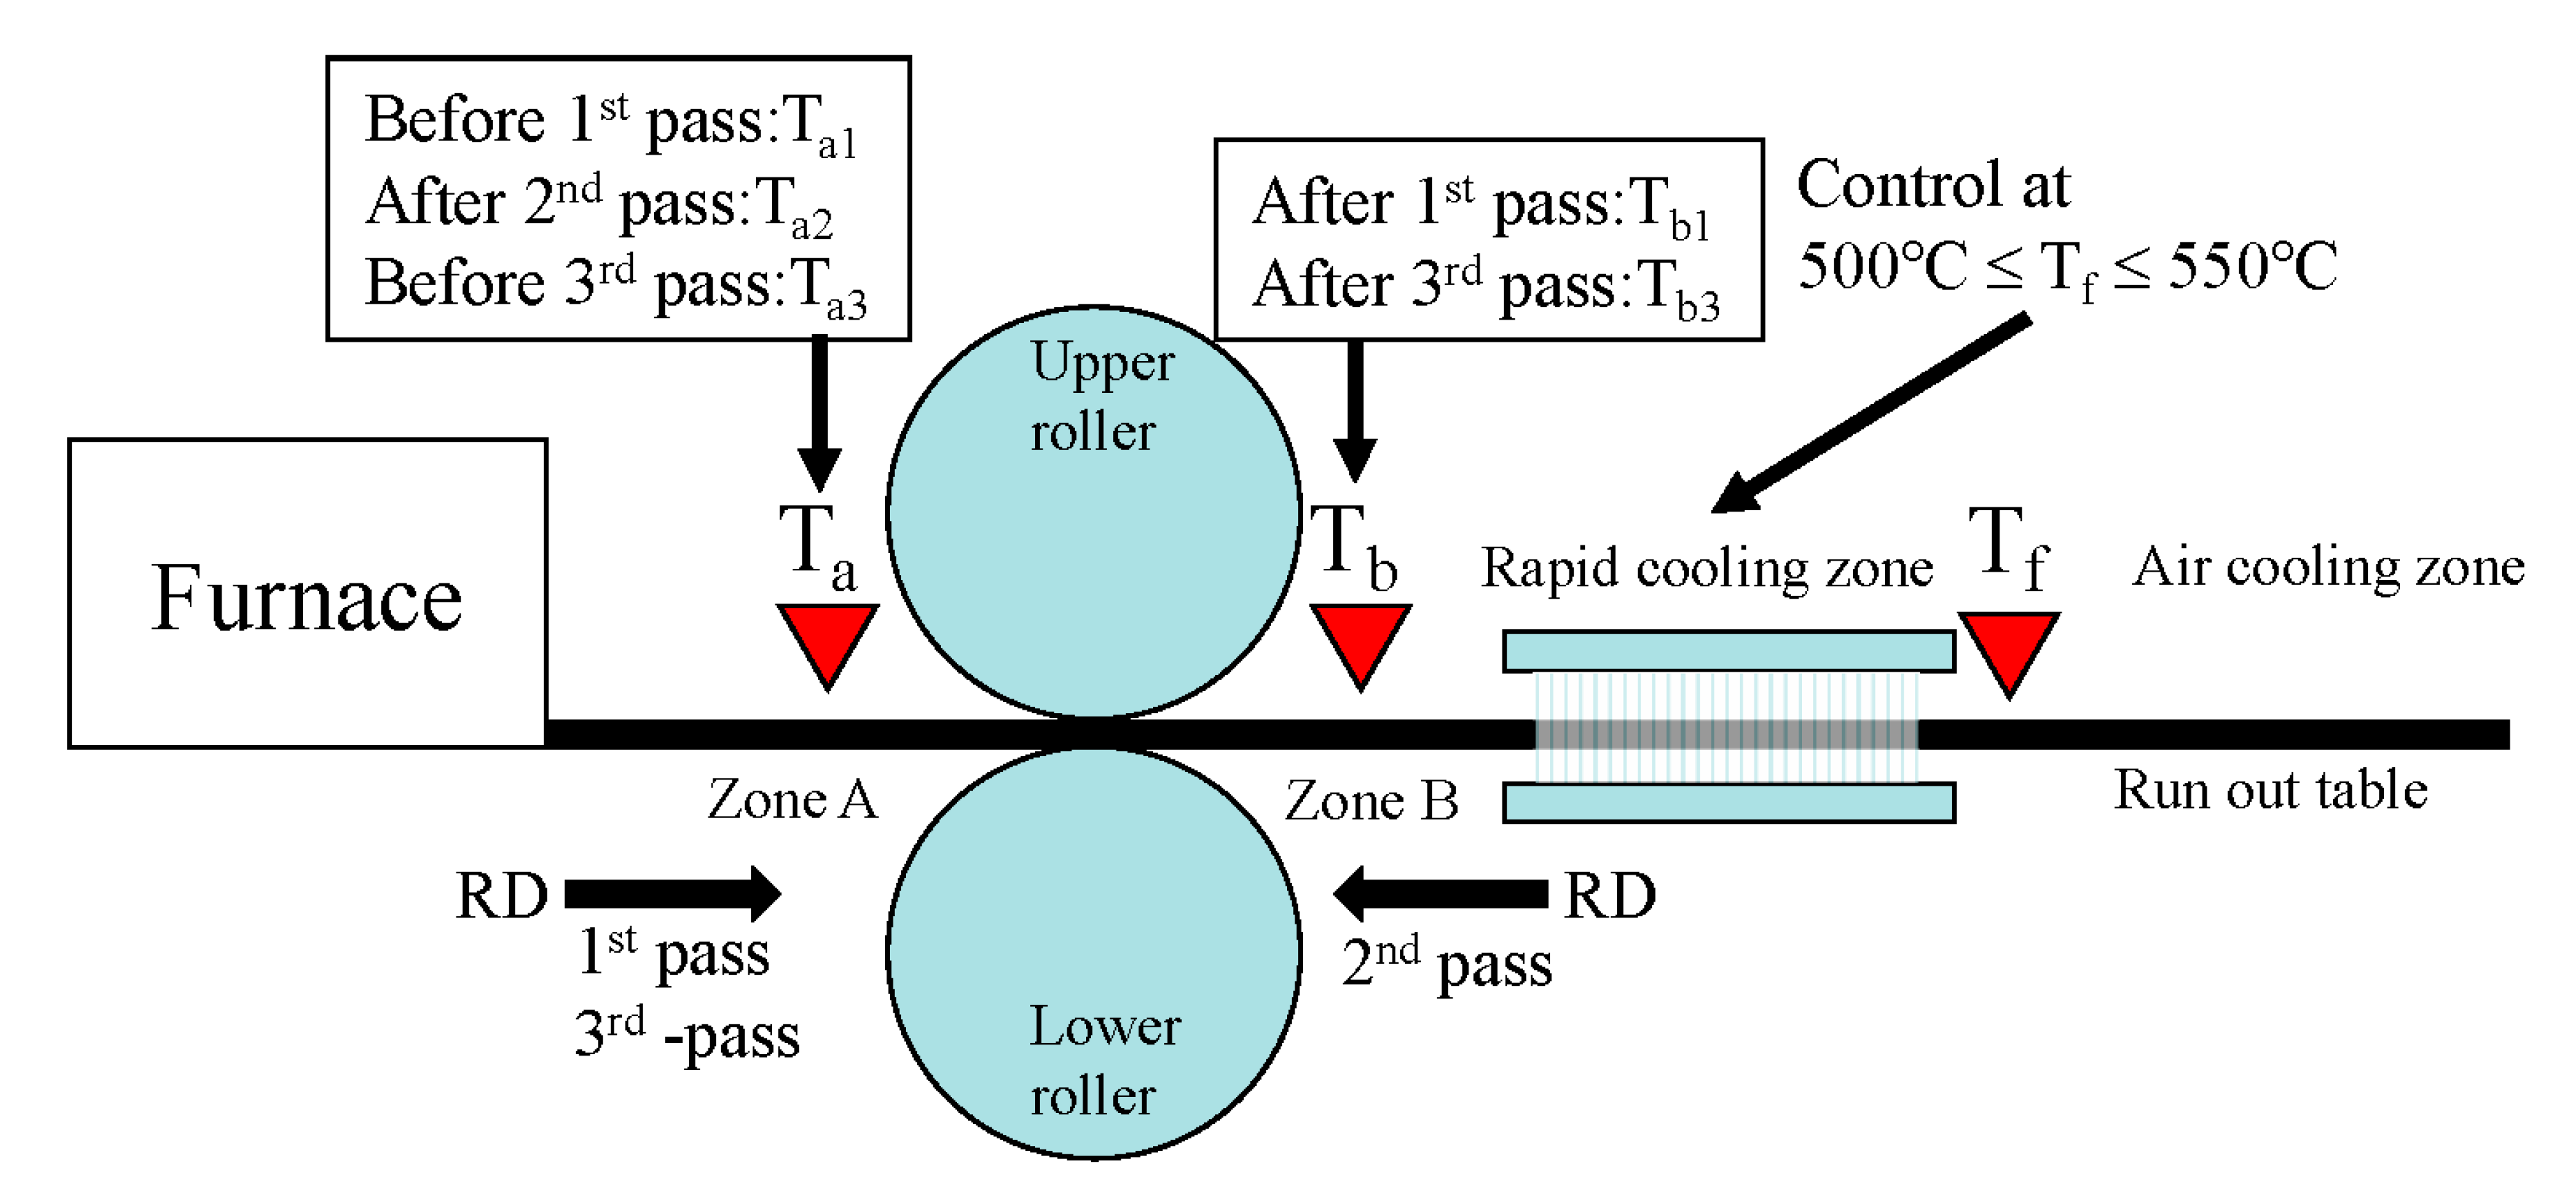
First, a steel plate, 14.5t × 70w × 500L mm3, was prepared. The Ar3, measured in the same way as for the single-pass tests, was about 710 °C at the surface and about 720 °C at the center. Figure 11 shows a schematic diagram of the 3-pass rolling. In Zone A, the temperatures Ta1 and Ta3, immediately before the first pass and the third pass, respectively, and the temperature Ta2, immediately after the second pass during rolling, were measured using a surface thermometer, MBST-102. On the other hand, in Zone B, the temperatures Tb1 and Tb3, immediately after the first pass and the third pass, respectively, were measured using infrared thermography, Avio InfRec R300 (NEC, Tokyo, Japan). The time between passes was about 6 to 7 s. The roll gap was set at 8.5 mm for the first pass, 4.0 mm for the second pass, and 0.1 mm for the third pass. The temperatures at the sheet surface measured using a surface thermometer were Ta1 = 711 °C, Ta2 = 718 °C, Ta3 = 694 °C, and Tf = 546 °C. The maximum temperatures on the sheet surface, measured using infrared thermography, were estimated as Tb1 = 751 °C and Tb3 = 720 °C. Here, the emissivity of the infrared thermography used was set to 0.77, and its value was determined by comparing with the results of the contact thermometer.
Figure 12 shows the SEM microstructure at the surface, quarter, and center in the sheet 3-pass rolled to 2.1 mm thick, the orientation maps along the ND obtained by EBSD analysis, misorientation distributions, and the inverse pole figures (IPFs) for the RD and ND. Eventually, a total reduction of 86% was achieved with 3-pass rolling. The fine-grained α of an average size of 3.4–3.6 μm and pearlite (P) were formed from the quarter to the center, and the ultrafine-grained α of an average size of 1.2 μm was formed at the surface. The typical rolling texture, γ-fiber (ND//{111}) and α-fiber (RD//<110>), for bcc was observed only at the center. The rolling texture decreased toward the surface, and the microstructure became random at the surface. The microstructure at the center is composed of equiaxed α, deformed α, and P. Although we cannot know an accurate history of the temperature inside the sheet during rolling, from Figure 12f, it seems that deformed α and deformed γ were formed by the deformation in the α (high volume fraction) + γ (low volume fraction) dual phase region during rolling, and equiaxed α and relatively elongated P were formed by transformation from the deformed γ. On the other hand, from Figure 12d, at the surface with a very large shear deformation related to a large-diameter roll and high friction, the microstructure is dominated by ultrafine-grained α without texture. Relatively large α grains of 2.0–3.0 μm with ND//{111} and ultrafine-grained α of submicron size were partly observed. The transformation of nuclei into deformed γ was dramatically introduced by a very large shear deformation in the surface layer, and the ultrafine α grains were formed by the subsequent rapid cooling. From the temperatures at the sheet’s surface measured during rolling, the surface layer during rolling is considered to have been deformed at a temperature just above the Ar3 by heat generation related to the very large shear deformation and by internal heat from inside the sheet between passes. If the rolling speed can be increased to a commercial level or the rolling can be conducted by a rolling mill of the tandem type, which has a short inter-pass time, the α grain structure of the mid-thickness can also be transformed from the deformed γ, and it may be possible to fabricate an ultrafine-grained steel sheet without texture.
5. Conclusions
A rolling process with a large roll diameter of 624 mm for fabricating ultrafine-grained (UFG) steel sheets was proposed. The through-thickness microstructure and strain distribution were investigated for 0.16 C/0.2 Si/1.4 Mn/0.03 Nb steel. The magnitude of the equivalent strain to obtain a UFG structure was quantified through a combination of FEA and 1-pass rolling experiments with the embedded pin method, and the fabrication of a 2 mm UFG steel sheet was attempted by 3-pass rolling. The results are summarized as follows:
- Ultrafine ferrite grains of 1.2 μm size at the surface layer of 0.2 mm at 2.0 mm sheet thickness were obtained by the large-diameter rolling process of 50% reduction. The rolling was conducted at 690 °C, just above the Ar3, as measured using a surface thermometer.
- The friction coefficient is 0.3 under the present hot rolling, and the magnitude of the equivalent strain to obtain a UFG structure was estimated to be 2.0.
- Ultrafine ferrite grains of 1.2 μm size at the surface and fine grains of 3.4 μm size at the quarter in sheets 2.1 mm thick were obtained by 3-pass rolling with a total reduction of 86% over the equivalent strain of 2.0. However, at the center, ferrite grain structures of 3.6 μm size were formed with γ-fiber and α-fiber texture.
Author Contributions
Conceptualization, T.I.; Investigation, T.I., H.Q. and R.U.; Formal analysis, T.I. and H.Q.; writing—original draft preparation, T.I.; writing—review and editing, T.I., H.Q. and R.U. All authors have read and agreed to the published version of the manuscript.
Funding
This study was partly supported by JSPS KAKENHI, grant numbers JP2210205 and JP26249107. The grants are gratefully appreciated.
Acknowledgments
We thank Tsutomu Kanno for sample preparation of rolled samples including pins, and Yukie Yasuda and Yuko Kashihara for their experimental assistance in the microstructural observations and illustrations.
Conflicts of Interest
The authors declare no conflict of interest.
References
- Nugmanov, D.; Mazilkin, A.; Hahn, H.; Ivanisenko, Y. Structure and tensile strength of pure Cu after high pressure torsion extrusion. Metals 2019, 179, 107864. [Google Scholar] [CrossRef] [Green Version]
- Segal, V.; Reznikov, S.V.; Murching, N.; Hammond, V.H.; Kecskes, L.J. Semi-continuous equal-channel angular extrusion and rolling of AA5083 and AZ31 alloys. Metals 2015, 85, 342–348. [Google Scholar] [CrossRef] [Green Version]
- Inoue, T. Strain variations on rolling condition in accumulative roll-bonding by finite element analysis. In Finite Element Analysis; Moratal, D., Ed.; InTech: Rijeka, Croatia, 2010; pp. 589–610. [Google Scholar] [CrossRef] [Green Version]
- Hohenwarter, A.; Kammerhofer, C.; Pippan, R. The ductile to brittle transition of ultrafine-grained Armco iron: An experimental study. J. Mater. Sci. 2010, 45, 4805–4812. [Google Scholar] [CrossRef]
- Inoue, T.; Yin, F.; Kimura, Y.; Tsuzaki, K.; Ochiai, S. Delamination effect on impact properties of ultrafine-grained low-carbon steel processed by warm caliber rolling. Metall. Mater. Trans. A 2010, 41, 341–355. [Google Scholar] [CrossRef]
- Bourell, D.L. Cleavage delamination in impact tested warm-rolled steel. Metall. Mater. Trans. A 1983, 14, 2487–2496. [Google Scholar] [CrossRef]
- Ohmori, A.; Torizuka, S.; Nagai, K. Properties of warm-rolled steel plates with ultrafine-grained ferrite and cementite structures. Tetsu-to-Hagane 2003, 89, 765–772. [Google Scholar] [CrossRef] [Green Version]
- Kimura, Y.; Inoue, T.; Yin, F.; Tsuzaki, K. Inverse temperature dependence of toughness in an ultrafine grain-structure steel. Science 2008, 320, 1057–1060. [Google Scholar] [CrossRef]
- Inoue, T.; Torizuka, S.; Nagai, K.; Tsuzaki, K.; Ohashi, T. Effect of plastic strain on grain size of ferrite transformed from deformed austenite in Si-Mn steel. Mater. Sci Technol. 2001, 17, 1580–1588. [Google Scholar] [CrossRef]
- Patra, S.; Roy, S.; Kumar, V.; Haldar, A.; Chakrabarti, D. Ferrite grain size distributions in ultra-fine-grained high-strength low-alloy steel after controlled thermomechanical deformation. Metall. Mater. Trans. A 2011, 42, 2575–2590. [Google Scholar] [CrossRef]
- Inoue, T.; Yin, F.; Kimura, Y. Strain distribution and microstructural evolution in multi-pass warm caliber rolling. Mater. Sci. Eng. A 2007, 466, 114–122. [Google Scholar] [CrossRef]
- Inoue, T. Chapter 5 Toughening of Low-Alloy Steel by Ultrafine-Grained Structure (Development of Fracture Control from Microstructure Design). In Fracture Mechanics—Properties, Patterns and Behaviours; Alves, L., Ed.; INTECH: Rijeka, Croatia, 2016; pp. 103–120. [Google Scholar] [CrossRef] [Green Version]
- Inoue, T.; Yin, F.; Kimura, Y. Crystallographic texture of warm caliber-rolled low carbon steel. Mater. Trans. 2007, 48, 2028–2035. [Google Scholar] [CrossRef] [Green Version]
- Etou, M.; Fukushima, S.; Sasaki, T.; Haraguchi, Y.; Miyata, K.; Wakita, M.; Tomida, T.; Imai, N.; Yoshida, M.; Okada, Y. Super short interval multi-pass rolling process for ultrafine-grained hot strip. ISIJ Int. 2008, 48, 1142–1147. [Google Scholar] [CrossRef]
- Shen, X.J.; Tang, S.; Chen, J.; Liu, Z.Y.; Misra, R.D.K.; Wang, G.D. Grain refinement in surface layers through deformation-induced ferrite transformation in microalloyed steel plate. Mater. Des. 2017, 113, 137–141. [Google Scholar] [CrossRef]
- Gan, W.; Babu, S.S.; Kapustka, N.; Wagoner, R.H. Microstructural effects on the springback of advanced high-strength steel. Metall. Mater. Trans. 2006, 37, 3221–3231. [Google Scholar] [CrossRef]
- Inoue, T.; Tsuji, N. Quantification of strain in accumulative roll-bonding under unlubricated condition by finite element analysis. Comput. Mater. Sci. 2009, 46, 261–266. [Google Scholar] [CrossRef]
- Utsunomiya, H.; Tanda, K.; Saito, Y.; Sakai, T.; Tsuji, N. Effects of lubrication on accumulative roll-bonding (ARB) of aluminum. J. Jpn. Soc. Technol. Plast. 1999, 40, 1187–1191. [Google Scholar]
- Kozasu, I.; Ouchi, C.; Sampei, T.; Okita, T. Hot rolling as a high-temperature in thermo-mechanical process. In Proceedings of the Microalloying 75; Union Carbide Corp.: New York, NY, USA, 1977; pp. 120–135. [Google Scholar]
- Yanagimoto, J.; Sugiyama, S.; Kawando, S.; Yanagida, A. Interrupt shearing test for evaluating effect of large shear deformation on evolution of microstructure into ultrafine grains. Mater. Trans. 2012, 53, 2–7. [Google Scholar] [CrossRef]
- Ishikawa, T.; Mabuchi, H.; Hasegawa, T.; Nomiyama, Y.; Yoshie, A. High crack arrestability-endowed steel plate with surface-layer of ultra fine grain microstructure. Tetsu-to-Hagane 1999, 85, 544–551. [Google Scholar] [CrossRef] [Green Version]
- Matsubara, Y.; Nakata, N.; Hiruta, T. Effect of accumulative bending conditions on grain refinement on hot-rolled sheet. Tetsu-to-Hagane 2012, 98, 19–24. [Google Scholar] [CrossRef] [Green Version]
- Inoue, T.; Torizuka, S.; Nagai, K. Effect of shear deformation on refinement of crystal grains. Mater. Sci. Technol. 2002, 18, 1007–1015. [Google Scholar] [CrossRef]
- Inoue, T.; Torizuka, S.; Nagai, K. Formation of uniformly fine grained ferrite structure through multidirectional deformation. Mater. Sci. Technol. 2001, 17, 1329–1338. [Google Scholar] [CrossRef]
- Cho, J.Y.; Inoue, T.; Yin, F.; Nagai, K. Effect of shear deformation on microstructural evolution of Ni-30Fe alloy during hot deformation. Mater. Trans. 2004, 45, 2966–2973. [Google Scholar] [CrossRef] [Green Version]
Figure 1.
(a) Schematic illustration showing the geometry of the rolling process. (b) Equivalent strain, εeq, at the surface layer of a 50% rolled Al sheet against roll diameter, dɸ, under different friction coefficients, μ. Here, solid lines represent results obtained by finite element analysis and dashed lines are expected ones. r denotes reduction.

Figure 2.
Image drawing of the embedded pin method. Here, the embedded pin is composed of low-carbon steel and type 304 stainless steel.
Figure 2.
Image drawing of the embedded pin method. Here, the embedded pin is composed of low-carbon steel and type 304 stainless steel.

Figure 3.
Schedules of the rolling process. Here, a rolling mill with a roll diameter of 624 mm was used under a rolling velocity of 1.0 m/s. Here, Ts denotes rolling temperature at the sheet surface, and Tf denotes temperature at the sheet surface after rapid water cooling. The temperatures were measured by a contact thermometer.

Figure 4.
Variations in temperature with time at the surface and center in a 4 mm thickness sheet after being taken out from a heating furnace of 900 °C. Here, the temperature at the surface was measured by a contact thermometer and that at the center was measured by a thermocouple inserted inside the sheet.

Figure 5.
Initial finite element mesh used for a 4 mm thickness sheet. Here, Lel and tel denote the mesh length in the rolling direction (RD) and thickness direction, respectively.
Figure 5.
Initial finite element mesh used for a 4 mm thickness sheet. Here, Lel and tel denote the mesh length in the rolling direction (RD) and thickness direction, respectively.

Figure 6.
SEM images at (a,d) surface, (b,e) quarter and (c,f) center of the sheets after rolling. Here, t1 represents the value of sheet thickness measured after rolling, and Ts and Tf are shown in Figure 3.
Figure 6.
SEM images at (a,d) surface, (b,e) quarter and (c,f) center of the sheets after rolling. Here, t1 represents the value of sheet thickness measured after rolling, and Ts and Tf are shown in Figure 3.

Figure 7.
Orientation maps along the normal direction (ND), and misorientation distributions at (a) surface, (b) quarter and (c) center of the sheet after 50% rolling.
Figure 7.
Orientation maps along the normal direction (ND), and misorientation distributions at (a) surface, (b) quarter and (c) center of the sheet after 50% rolling.

Figure 8.
Flection of the pin embedded in the sheet after rolling.

Figure 9.
Initial mesh and deformed mesh after rolling with various friction coefficients, μ, under 50% reduction (4t→2t mm). Here, ΔLs denotes the distance from the center to the surface in the rolling direction (RD) illustrated in Figure 1.
Figure 9.
Initial mesh and deformed mesh after rolling with various friction coefficients, μ, under 50% reduction (4t→2t mm). Here, ΔLs denotes the distance from the center to the surface in the rolling direction (RD) illustrated in Figure 1.

Figure 10.
(a) Relation between μ and ΔLs after rolling obtained by FEA. Here, the experimental result denotes the measured value obtained by the embedded pin method shown in Figure 8. (b) Distributions of equivalent strain, εeq, through the sheet thickness for various friction coefficients, μ.
Figure 10.
(a) Relation between μ and ΔLs after rolling obtained by FEA. Here, the experimental result denotes the measured value obtained by the embedded pin method shown in Figure 8. (b) Distributions of equivalent strain, εeq, through the sheet thickness for various friction coefficients, μ.

Figure 11.
Schematic diagram of 3-pass rolling.

Figure 12.
(a–c) SEM images and (d–f) orientation maps along the ND, inverse pole figures (IPFs) for the RD and ND, and misorientation distributions at each site’s through-thickness after 3-pass rolling.
Figure 12.
(a–c) SEM images and (d–f) orientation maps along the ND, inverse pole figures (IPFs) for the RD and ND, and misorientation distributions at each site’s through-thickness after 3-pass rolling.

© 2020 by the authors. Licensee MDPI, Basel, Switzerland. This article is an open access article distributed under the terms and conditions of the Creative Commons Attribution (CC BY) license (http://creativecommons.org/licenses/by/4.0/).
Share and Cite
MDPI and ACS Style
Inoue, T.; Qiu, H.; Ueji, R. Through-Thickness Microstructure and Strain Distribution in Steel Sheets Rolled in a Large-Diameter Rolling Process. Metals 2020, 10, 91. https://doi.org/10.3390/met10010091
AMA Style
Inoue T, Qiu H, Ueji R. Through-Thickness Microstructure and Strain Distribution in Steel Sheets Rolled in a Large-Diameter Rolling Process. Metals. 2020; 10(1):91. https://doi.org/10.3390/met10010091
Chicago/Turabian StyleInoue, Tadanobu, Hai Qiu, and Rintaro Ueji. 2020. "Through-Thickness Microstructure and Strain Distribution in Steel Sheets Rolled in a Large-Diameter Rolling Process" Metals 10, no. 1: 91. https://doi.org/10.3390/met10010091
Note that from the first issue of 2016, this journal uses article numbers instead of page numbers. See further details here.