Article

Experimental Analysis and Behaviour Modelling of the Deformation Mechanisms of a Ti-6242S Alloy under Hot and Superplastic Forming Conditions

1
Institut Clément Ader (ICA), Université de Toulouse, CNRS, IMT Mines Albi, UPS, INSA, ISAE-SUPAERO, Campus Jarlard, 81013 Albi CT CEDEX 09, France
2
Department of Advanced Materials Science, Faculty of Engineering, Kagawa University, 2217-20 Hayashi-cho, Takamatsu, Kagawa 761-0396, Japan
*
Author to whom correspondence should be addressed.
Metals 2020, 10(12), 1599; https://doi.org/10.3390/met10121599
Submission received: 28 October 2020 / Revised: 18 November 2020 / Accepted: 25 November 2020 / Published: 29 November 2020
(This article belongs to the Special Issue Superplasticity and Superplastic Forming)

Abstract

:
In this work, the hot deformation characteristics of a near- α Ti-Al-2SnZr-2Mo alloy (Ti6242 alloy) with a Fine-Grained (FG) microstructure ( d α = 2.86 μ m) were investigated at two levels of temperature, T = 730 C and T = 840 C. The initial microstructure consists of equiaxed nodules of the α phase as well as some α lamellae sparsely distributed and separated by thin layers of the BCC β phase. For both temperatures, three strain rates ( 10 4 , 10 3 , 10 2 s 1 ) were analysed during loading. Moreover, the microstructural evolution ( α size and morphology) was also evaluated by conducting interrupted tensile tests. The different tensile testing conditions greatly influence the stress-strain response of the material as well as the microstructure evolution. Indeed, various phenomena can take place such as elongation of the grain structure, globularization, dynamic recrystallization and grain growth of the equiaxed areas depending on the temperature, the strain rate and the strain level. The FG Ti6242 alloy exhibits interesting superplastic ductility at T = 840 C. At this temperature either a very gradual flow softening (at higher strain rate) or flow hardening (at lower strain rate) can be observed and are related respectively to one or more of the following mechanisms: lamellae globularization, DRX and grain growth. At the intermediate strain rate, both mechanisms, strain hardening and softening, coexist. At T = 730 C, the onset of the α lamellae globularization was only promoted at low strain rate. A mechanical behavior model was developed in the temperature range of 730–840 C, which was able to take into account all the observed phenomena: viscosity, softened behavior and strain hardening. Constitutive equations were calibrated from the stress-strain responses and microstructural observations, and the computed results were in good agreement with the experiments.

1. Introduction

Titanium alloys, namely Ti-6Al-4V or Ti-6AL-2Sn-4Zr-2Mo alloys are widely used in the aircraft industry. They are typically used in sheet form to manufacture pylon or engine parts by utilising SuperPlastic Forming process (SPF) which is presently the most common process used. It allows to produce complex shapes (e.g., deep drawn) in one step avoiding many assembling operations weakening the part. The sheets are gas-pressure formed and for a Ti-6Al-2Sn-4Zr-2Mo titanium alloy, the forming temperature is about 900 C with very long pressure cycles (several hours) equivalent to strain rates from about 10 4 s 1 to 10 3 s 1 . These test conditions confer to the alloy properties known as superplastic that is characterized by grain boundary sliding mechanisms at the microscopic scale. However, this process remains expensive and the aircraft industry wants to decrease both the forming temperature and the cycles times. To increase the manufacturing rates, researchers explored new processes (such as hot forming and stamping) which provide lower operating temperatures and faster pressure cycles. But also research has been focused on developing more knowledge on the thermo-mechanical processing which has allowed to further refine microstructures and control better the superplastic mechanisms across a broader temperature range [1,2].
In such context, the present investigation deals with the elongation capabilities of a FG Ti-6AL-2Sn-4Zr-2Mo alloy where new forming conditions are evaluated. Indeed, compared to conventional ones, the strain rate and temperature have been adjusted to increase the manufacturing rates. In more detail the strain rate has been increased from 10 3 s 1 –10 4 s 1 down to 10 2 s 1 whilst the operating temperature reduced from 900 C down to 730 C and 840 C with a view to efficiently reducing the production costs by increasing the pressure cycles time and decreasing the forming temperature. Interrupted tensile tests were performed under these conditions, they are coupled with SEM microscopy to understand better the microstructural evolution and its impact on the macroscopic stress-strain response. Following that the constitutive equations were defined to simulate the microstructural evolution and the global stress-strain response.

2. Mechanical Behaviour at T = 730 C and T = 840 C

2.1. Experimental Procedure

A MTS servo-hydraulic machine is used for conducting the mechanical tests at high temperature, the device is equipped with a three zones furnace able to maintain a constant temperature during large deformation conditions [1,3]. Each zone is controlled by several K-thermocouples welded on the specimen along the loading axis. The samples with a gauge of 8 mm wide and 15 mm long, are extracted from 4 mm thickness plates. Moreover, each test is performed along the rolling direction, it consists of the heating phase with a heating rate of 10 C/min followed by the isothermal holding time of 15 min at the desired temperature prior the mechanical test conducted at a given strain rate.
In this study, two temperature levels (T = 730 C and T = 840 C) below the usual industrial superplastic forming conditions (around 900 C) are considered. The aim is to evaluate the deformation mechanisms of the material at low temperatures so as to avoid strain hardening occurring at and above 900 C [4] and for several strain rate conditions from 10 4 s 1 to 10 2 s 1 . For both temperatures and each strain rate, test until failure are conducted as well as interrupted tensile tests, performed in the same conditions, to investigate both the mechanical behavior and the microstructural evolution induced for several elongations. The discrepancies in the results provided from all the tests performed in the present work varies from 5% at T = 730 C to 12% at T = 840 C. They could be influenced by the material exhibiting an heterogeneous initial microstructure and mostly by the test conditions in terms of temperature and strain rate. Indeed, at high temperature and low strain rate, the very important ductility of the alloy associated with a very low value in the flow stress increase the measurement uncertainties.

2.2. Stress-Strain Responses

Figure 1 and Figure 2 illustrate the stress-plastic strain curves for each condition of strain rate, elongation and temperature. Except for the condition with the highest temperature (840 C) and the lowest strain rate 10 4 s 1 , which shows a continuous slight hardening, the stress-strain curves are characterized by three steps: (i) an initial work hardening until a critical strain (peak stress) followed by (ii) a regime of near steady-state flow, flow hardening or flow softening.
The mechanical properties can be evaluated through the values given in Table 1. It provides the evolution of the maximal stress and the associated plastic deformation for each test condition. For both temperatures, a decrease of the strain rate involves a decrease in flow stress and an increase of the plastic deformation and leads to an enhancement of the mechanical properties. This fact reveals the importance of the viscoplastic behaviour. Moreover, the results show very close values of flow stress at (730 C, 10 4 s 1 ) and at (840 C, 10 2 s 1 ) but a plastic deformation twice higher at 730 C which means that a low speed forming process at 730 C should be promoted compared to a higher speed forming process at 840 C.
At 730 C (Figure 1), on the one hand, the tensile tests performed until the failure reveal a viscoplastic behaviour with hardening. Thus, a flow stress decrease and an elongation increase is observed with the strain rate decrease. On the other hand, while the pictures of the samples of the interrupted tensile tests do not exhibit necking initiation, a flow softening is observed for the last interrupted strain level regardless of the strain rate. This softening cannot be attributed to the only necking phenomenon not sufficient to explain the trend of the stress-strain curves and it suggests that supplementary deformation mechanisms seem to contribute to this stress decrease. The ductile behaviour is obtained as illustrated by the in-plane curvature of the specimen profiles along gauge length for the tests conducted until failure (see Figure 1 and Figure 2). Finally, from higher elongations to the final failure of the sample, necking initiation can play a significant role in the stress decrease.
At 840 C, similar observations can be done (Figure 2). The viscoplastic behaviour increases with the decrease of hardening. At the end of the tensile test, necking greatly contributes to the drastic stress decrease. However, as shown by the interrupted tensile tests and the associated specimen pictures (Figure 2), the stress decrease also occurs prior to the necking initiation and this phenomenon becomes increasingly important compared to 730 C. Microstructural investigations are required in order to better understand the mechanisms responsible for the stress decrease prior to necking. Indeed, the occurrence of flow softening in titanium alloys can be related to many mechanisms such as dynamic recovery (DRV by annihilation of dislocation) followed by dynamic recrystallization (DRX), dynamic globularization of lamellar α , deformation heating (locally rising of the temperature), loss of Hall-Petch strengthening at α / β lamellae interfaces as well as texture evolution [5,6].

3. Microstructural Charaterization

3.1. Methodology and Material

For microstructural analyses, the initial and the deformed specimens were sectioned parallel and perpendicular to the tensile axis (RD/TD and RD/ND surfaces with RD, TD and ND that respectively mean Rolling, Transverse and Normal Directions). The microstructure was characterized by scanning electron microscopy (SEM) in the back-scattered electron (BSE) mode and by electron backscattered diffraction analysis (Oxford –HKL EBSD detector). Note that SEM-BSE images were obtained either on a Hitachi TM3030Plus Tabletop SEM or a FEI Nova NanoSEM 450 FEGSEM. Grains size (of the α nodules) as well as the α phase fraction f α were obtained by image analysis (using Image J and/or Aphelion ® softwares). Note that the phase fraction f β at 730 C and 840 C was obtained on some specimens heat treated for two hours at these two temperatures followed by a water quenching. The specimens for SEM observations and EBSD were mechanically polished using standard metallographic procedure (more details in [2]).
The material investigated in this study is a Ti6242 titanium alloy in the shape of 4 mm thick sheet with a chemical composition (in wt%) of 6.02Al, 2.0Sn, 4.1Zr, 2.01Mo, 0.09Si, 0.1O, 0.02N, and balance Ti. The transus beta is T β = 995 C.
The initial microstructure consists of mainly equiaxed nodules of the hexagonal α phase, with a mean diameter of approximately 2.7 μ m, separated by a thin layer of the bcc β phase. It is important to notice that in addition to these nodules, some areas are characterized by elongated α lamellae as shown on Figure 3 revealing that the initial microstructure is heterogeneous with two morphologies of α . These mixture of partially equiaxed α and elongated α grains with a network of intergranular β can be referred in the literature as a “complex microstructure” [7]. It reveals an incomplete globularization of the lamellar α during the previous thermo-mechanical processing steps.
The β phase fraction at room temperature, 730 C and 840 C is approximately respectively f β = 11%, f β 730 = 13% and f β 840 = 19%. These values can be considered as the equilibrium values of the phase fraction at these three temperatures.

3.2. Microstructural Evolution during Tensile Deformation at 730 C and 840 C

At 730 C and for the highest strain rate, by increasing the applied strain (Figure 4), while the α lamellar areas tend to gradually become thinner and more elongated along the tensile direction, the equiaxed α nodules do not significantly evolve (in terms of size and local misorientations). This suggests that the deformation is heterogenous as it seems that the lamellar zones undertake a proportion of deformation higher than in the ”equiaxed” zones which is consistent with results reported during isothermal compression [8].
It can be noticed the formation of few cavities at higher strain rate ( 10 2 s 1 and 10 3 s 1 ) which might also affect the mechanical behaviour by contributing to the flow softening and the lower ductility.
At 730 C and by decreasing the strain rate, the elongated α area tends to intensify their deformation along RD but their volume fraction tends also to slightly decrease suggesting that the globularization process has the time to initiate at lower strain rate. Moreover, particularly at the lowest strain rate, the initial long elongated β phase seems to have been “fragmented” leading to short α and β laths (Figure 4). In parallel, in the equiaxed areas, EBSD measurements done at intermediate stages of deformation (plastic deformation of 0.469 at 10 3 s 1 and 0.591 at 10 4 s 1 ), show some small α nodules revealing that dynamic recrystallization (DRX) also initiates locally (Figure 5). Moreover at 10 4 s 1 , a growth of few α nodules are also noticed evidencing a dispersion of the grains size in the “equiaxed” zones at low strain rate and for high strain. Figure 6 confirmed that a slight grain growth associated to a dispersion of the α nodules occur mainly at low strain rate at 730 C. So by decreasing the strain rate at 730 C, diffusion-controlled mechanisms as dynamic recovery, globularization (in lamellar areas) and DRX (in equiaxed areas) start to be promoted particularly at larger strains. Nevertheless, the final microstructure after tensile test still appears heterogeneous.
At higher temperature (840 C), these softening mechanisms that can counteract the initial strain hardening (due to increase of entangled dislocations), occur at a lower critical strain. Note that this critical strain also decreases with decreasing the strain rate.
Indeed, at low strain rate ( 10 4 s 1 ), the microstructure exhibits less fraction of lamellar areas: as shown on Figure 7 the globularization starts from the first level of strain. A slight coarsening of few α nodules can be also noticed as confirmed also by the Figure 6. Further deformation lead to a fully equiaxed and homogeneous microstructure consisting of equiaxed α nodules separated by the β phase. By increasing the strain rate, the dynamic globularization of the lamellae is slightly restrained and initiates at higher strain level. Thus, while at 10 3 s 1 , the microstructure exhibits, before necking, almost only equiaxed areas, at 10 2 s 1 some elongated but also “fragmented” lamellae are still evidenced (as observed at 730 C for the lower stain rate).
So higher temperature and lower strain rate, both promote an increase of the dynamic globularization rate into the lamellar areas. Note also that the beta phase fraction slightly increases at 840 C.

3.3. Discussion

During tensile deformation of the Ti6242 alloy at 730 C and 840 C, the stress-strain curves exhibit different flow behavior characterized by all an initial strain hardening followed by, depending on the tests conditions, a steady state flow, a flow softening and/or hardening.
Based on the literature data dealing with plasticity of titanium alloys at high temperature (as [6]), the initial and “sharp” strain hardening is most likely due to the rapid generation and multiplication of dislocations that can not be overcome, at earlier strain level, by dynamic recovery (DRV) mechanisms. Nevertheless, from a critical strain, a balance between strain hardening and DRV with the annihilation of dislocations could be promoted as dislocations motion is facilitated at high temperature (by cross slip and/or climb). Then with further deformation, different microstructural evolution can occur depending on the temperature and the strain rate. As shown previously, the studied Ti6242 alloy is initially characterized by equiaxed as well as lamellar areas that can respectively undergo DRX and globularization. High strain rate and low temperatures decrease the time of deformation and may limit diffusion-controlled mechanisms and dislocations mobility. Thus at 730 C, it seems that the lamellar areas undertake a more important part of the deformation by increasing their elongation along the tensile direction leading to thinner lamellae. Moreover, lower strain rate promote the initiation of the globularization mechanisms into the lamellar areas as well as DRX into the “equiaxed” areas. It should be remind also that at this low temperature (730 C), few cavities were noticed at 10 2 s 1 and 10 3 s 1 revealing some co-deformation incompatibilities between the “soft” layer of β and the “harder” α phases.
The decrease of the flow stress at 840 C can be linked to a higher mobility of dislocation which favour their annihilation and so the DRV at earlier strain level. Lower strain rate provides also longer time for the mobility of the dislocations (and so to DRV) as well as the boundaries migration (and so DRX and grain growth). Moreover, the fact that the flow softening becomes increasingly important at 840 C compared to 730 C could be, directly related to a more effective globularization rate of the lamellar areas evidenced at 840 C from the microstructural analysis. An homogeneous equiaxed microstructure is obtained at earlier strain level promoting, in association with a higher β phase fraction, the superplastic deformation mechanisms by grain boundary sliding accommodated by climb/glide of dislocations and/or diffusion mechanisms.
So a high temperature, a low strain rate as well as a slight increase of the β phase fraction might promote the globularization efficiency as well as the growth of both globularized and dynamically recrystallized α grains.
It is important to notice that, in comparison with a Ti-6Al-4V alloy having a similar initial heterogeneous microstructure [3], the globularization process in this near-alpha Ti6242 alloys is clearly less effective at comparable deformation conditions. Indeed, it is reported in [3] that a fully equiaxed microstructure was obtained during a tensile deformation at 750 C and with a strain rate of 10 2 s 1 . Indeed, since the “globularization” is the diffusion-controlled process that involved the penetration of the β phase (by wedging) along substructures inside α lamellae and as the Mo solute has a lowest diffusivity than V in the β matrix it could explain the decrease of the globularization rate in the Ti6242 alloy.

4. Behaviour Modelling

This section firstly presents the model formulation and the identification procedure. Then, the prediction given by the model are illustrated and discussed.

4.1. Constitutive Equations

The model formulation aims to both describe microstructural and phenomenological phenomena revealed by the SEM observations and the mechanical tests at 730 C and 840 C. The frame is similar as many formulations found in the literature [1,9,10] corresponding to a macroscopic approach with microstructural considerations. Classical von Mises yield function f is used to define the transition between elastic and inelastic behaviour (Equation (1)).
f = σ e q R σ 0
where σ e q is the equivalent von Mises stress, R is the isotropic hardening variable and σ 0 the elasticity limit of the material.
If an uniaxial form is considered, σ e q is reduced to the axial loading stress σ . In this case, strain rate partitioning and Hooke’s law allow to formulate Equation (2).
ε ˙ = σ ˙ / E + ε ˙ p
The flow behaviour derives from a dissipation potential Ω depending on f (Equation (3)).
Ω ( f ) = α 1 α 2 c o s h < α 2 f > and ε ˙ p = Ω ( f ) | σ | σ = α 1 s i n h < α 2 f > | σ | σ
where α 1 and α 2 are material and temperature dependent parameters, < . > defines the Macauley brackets.
The evolution of a normalized dislocation density ρ associated to work hardening R is given by Equation (4). These equations are closed to those formulated in [10,11,12].
R = B ρ γ ; ρ ˙ = ( 1 β 1 ρ ) | ε ˙ p | β 2 ρ δ
where B, γ , δ and β i are temperature dependent model parameters. This equation includes both dynamic and recovery terms able to fairly describe the dislocation motion.
Modelling the grain growth evolutions can easily been introduced in the constitutive equations [9,13]. Three main contribution are classically considered, static grain growth d s t a , plastic strain induced grain growth d d y n and grain refinement due to recrystallization process d D R X (See Equation (5)).
d ˙ = d ˙ s t a + d ˙ d y n + d ˙ D R X
In the sequel, as explained in the previous section, the flow softening can be due to a succession of mechanisms as the dislocations substructure evolution and annihilation (dynamic recovery), the dynamic recrystallisation process in α -nodular areas as well as locally the globularization of the α -lamellae areas [12] or adiabatic shearing behavior of these areas involving a local temperature increase [14]. Note that DRX is sometimes, considered as one of the globularization mechanism [15,16].
Thus, the evolution equation related to the DRX process d ˙ D R X is not well suitable in the present context as the grain size refinement, if exists, is a very local phenomenon (either in lamellar or nodular areas) and cannot be easily observed and taken into account from a macroscopic model formulation. Moreover, as additional SEM observations [4] (not presented here) do not exhibit significant static grain growth, the evolution equation related to this effect d ˙ s t a also vanishes.
Finally, Equation (5) is reduced to Equation (6) only considering the plastic strain induced grain growth clearly observed in the present study, namely at 840 C and ε ˙ = 10 4 s 1
d ˙ = d ˙ d y n = A d m | ε ˙ p | n
where A, m and n are temperature dependent model parameters. Note that the initial condition of this differential equation is denoted d 0 corresponding to the initial grain size.
As explained in the previous section, α -lamellae areas of the initial microstructure are the sites of softening mechanisms [12]. An internal variable S is then introduced to describe this phenomenon. The formulation is given in Equation (7), it is similar to those considered in many other investigations [10,11,13] intended to describe either dynamic recrystallization, globularization or adiabatic shearing behavior.
S ˙ = η ε ˙ p η 1 < ε p ε c > η 2 ( S m a x S ) η 3
where η and η i are material and temperature dependent parameters. S describes the volume fraction of the softened microstructure, it is initiated when the inelastic strain ε p exceeds a critical value ε c and tends towards an asymptotic value defined by S m a x .
Initially, these softened zones correspond to the initial lamellar microstructure areas which evolve towards an equi-axe microstructure under the temperature effect and mechanical loading.
Regardless of the test temperature, the soften behaviour is more important for the higher strain rates [11,17]. Moreover, grain growth is dominant for the lower strain rates and can involve strain hardening effect. In order to take into account both phenomena, Equation (3) is modified as described in Equation (8):
ε ˙ p = α 1 s i n h < α 2 f > | σ | σ 1 1 S α 3 d d 0 α 4
The constitutive equations set can be summarized as follows (Equation (9)):
f = σ e q R σ 0 ε ˙ = σ ˙ / E + ε ˙ p R = B ρ γ ; ρ ˙ = ( 1 β 1 ρ ) | ε ˙ p | β 2 ρ δ d ˙ = d ˙ d y n = A d m | ε ˙ p | n S ˙ = η ε ˙ p η 1 < ε p ε c > η 2 ( S m a x S ) η 3 ε ˙ p = α 1 s i n h < α 2 f > | σ | σ 1 1 S α 3 d d 0 α 4
For each model parameter p, the temperature dependence can be expressed in the form of an Arrhenius relation (see Equation (10)).
p = p 0 e Q p R g T
where T is the temperature in Kelvin and R g = 8.31 J·mol 1 · K 1 the universal gas constant. In the present study, note that these relations are only valid in the temperature range of 730 C–840 C. Indeed, their extension to a broader range of temperature would require further investigations.
In the next paragraph, the identification procedure of the model parameters and the results obtained are presented.

4.2. Model Prediction

Runge-Kutta numerical integration schemes are used to solve the non linear constitutive equations illustrated by Equation (9). Several calibration stages are firstly performed to estimate the values of model parameters such as the elastic properties or the viscous flow. The coefficients of the differential equation describing the dynamic grain growth effect (see Equation (6)) are also evaluated using an analytical form provided by the theory of Lifshitz-Slyozov-Wagner and applied on Ti6242Si or Ti-6Al-4V alloys by Semiatin [14].
The identification procedure of the model parameters requires the use of an optimisation loop and the definition of an objective function F combining 2 sub-objective functions ( F i ) i = 1 , 2 for a given temperature. They are based on experimental results given in Section 2 and Section 3, and concern respectively the grain size d e x p and the stress σ e x p evolutions for several conditions of temperature and strain rates (See Equation (11)).
F = 1 N F 1 + F 2 F 1 = k = 1 N d | | d d e x p | | | | d e x p | | k F 2 = k = 1 N σ | | σ σ e x p | | | | σ e x p | | k
where N d and N σ denote the number of experimental curves, in the present study, N d = N σ = 3 corresponding to the studied strain rate conditions and N = N d + N σ .
| | . | | is the Euclidean norm defined as | | x | | = j = 1 N p t x i 2 1 2 with N p t the number of data points considered in each experiment corresponding the time outputs that are strictly the same with those from the simulated files.
Hence, a constraint optimization method based on Genetic Algorithm is used to determine the parameters set by minimizing the objective function defined in Equation (11) with respect the constraints defined in the calibration stages. The Genetic algorithm uses a population size of 200 and a number of generations of 3000. At the end, the experimental curve related to the grain size evolution at the higher strain rate ( 10 2 s 1 ) is not included in the objective function formulation reducing the number of experiments to N d = 2 .
The predictions of the grain size evolution according to the strain rate are illustrated in Figure 8 at 730 C (left) and 840 C (right). The model faithfully describes the experiments except for the higher strain rate as mentioned previously. Of course, the average grain size measured at failure cannot be predicted, because it concerns high heterogeneous strain field close to the necking area and therefore cannot be described by the present model formulation.
Figure 9 gives the comparison of the experimental and simulated stress-strain responses for all the studied test conditions. The identification procedure uses the tests carried out up to the rupture of the sample. But, each test is truncated to a maximum elongation level below which damage initiation is negligible and no necking process has occurred.
Table 2 refers to the values of all the model parameters.

5. Discussion

The dynamic grain growth effect increases with the temperature and it is also influenced by the strain rate. Indeed, it is observed for the lower strain rates ( 10 3 s 1 and 10 4 s 1 ) whereas it is not activated at 10 2 s 1 . In this case, a slight average grain size decrease seems to occur, but this effect is hard to quantify because it only concerns the microstructural evolution of localized areas belonging mainly to the prior lamellar microstructure and where a softening phenomenon is induced during the deformation process. Therefore, this effect can not be explicitly taken into account at a macroscopic scale through a specific internal variable. However, it can explain the stress decrease occurring at high strain rates ( 10 2 s 1 and 10 3 s 1 ) and for both temperatures studied. Therefore, the softening phenomenon (Equation (7)) is introduced through the S variable and coupled with the viscous flow rule (Equation (8)). On other hands, at lower strain rates, grain growth involves a strain hardening effect which can be described by the introduction of the internal variable d (Equation (6)) in the viscous flow rule (Equation (8)). At intermediate strain rate ( 10 3 s 1 ), both mechanisms coexist.
Figure 10 illustrates the evolution of the softening mechanisms according to the deformation given by the model for each test condition. The softening kinetic and the stress decrease are strongly connected. For instance, at the strain rate of 10 2 s 1 , the softening mechanism is active in the deformation range of 0.2–0.4 at T = 730 C and 0.4–0.75 at T = 840 C which corresponds to the ranges where the stress decrease is active (Figure 9). The same conclusions can be done for the other strain rates even if this phenomenon clearly decreases with the strain rates.
The origins of these mechanisms leading to a flow softening behavior are complex to analyze. Several assumptions can be done. Deformation heating could influence the softening behavior, but it is usually dominant for the very high strain rates (e.g., ε ˙ 0.1 s 1 ) [18]. It could also be due to the development, locally, of substructure then subgrains into the α lamellar leading, from a sufficient strain to dynamic transformation and the occurrence of a globularized microstructure with fine grains. Indeed it is widely admitted that flow softening in equiaxed microstructure is much less than that in lamellar microstructure [5] as more sources of softening could be involved during the globularization process. Nevertheless, Figure 11 gives the evolution of the coefficient m according to the deformation. m describes the strain rate sensitivity through the well known relationship σ = K ε ˙ p m . The slight decrease of this coefficient during the deformation process regardless of the test temperature does not allow to valid this last assumption. If the process of lamellar fragmentation is effective, the flow softening could be also attributed to the loss of strengthening effect at the α / β interfaces in the lamellar areas [5,19]. Nevertheless, in our study, this fragmentation mechanism which leads to a globularized microstructure, is mainly promoted at high temperature (T = 840 C) and low strain rate. These observations are not consistent with the evolution, on Figure 11, of the variable S that show an important contribution of softening mechanism at high strain rate. So, at least for high strain rate, it seems obvious that additional softening sources are included into the variable S. In particular, the micro-cavities observed at low temperature and high strain rate could contribute, to some extent, to the softening. Note that another softening reason can be related to the texture evolution with the rotation of the α phase in a more softer orientation. This phenomenon was not evaluated in this study. It appears that further investigations are needed to understand more precisely the dynamic transformation accounting for the flow softening. Finally, the variable S considered in the model formulation remains a phenomenological internal variable which can include several mechanisms leading to the flow softening illustrated in the stress-strain curves. As mentioned previously, each mechanism can act simultaneously or sequentially depending on the elongation range. The implementation of a multi scale approach could be used to take into account the effects of all contributions separately, but this would require further investigations in order to determine them accurately.

6. Conclusions

Forming Ti6242 parts outside of conventional process parameters (T ∼ 900 C and ε ˙ 10 3 s 1 ) considered in the aircraft industry is a challenging work in order to reduce the production costs. In this investigation, the alloy is characterized in a temperature range T = 730 C–840 C and with a maximal strain rate up to 10 2 s 1 . These new conditions require the development of a mechanical behaviour model which constitutes an essential preliminary step before the simulation by Finite Elements of the forming of an industrial part [20]. The following conclusions can be drawn from this work:
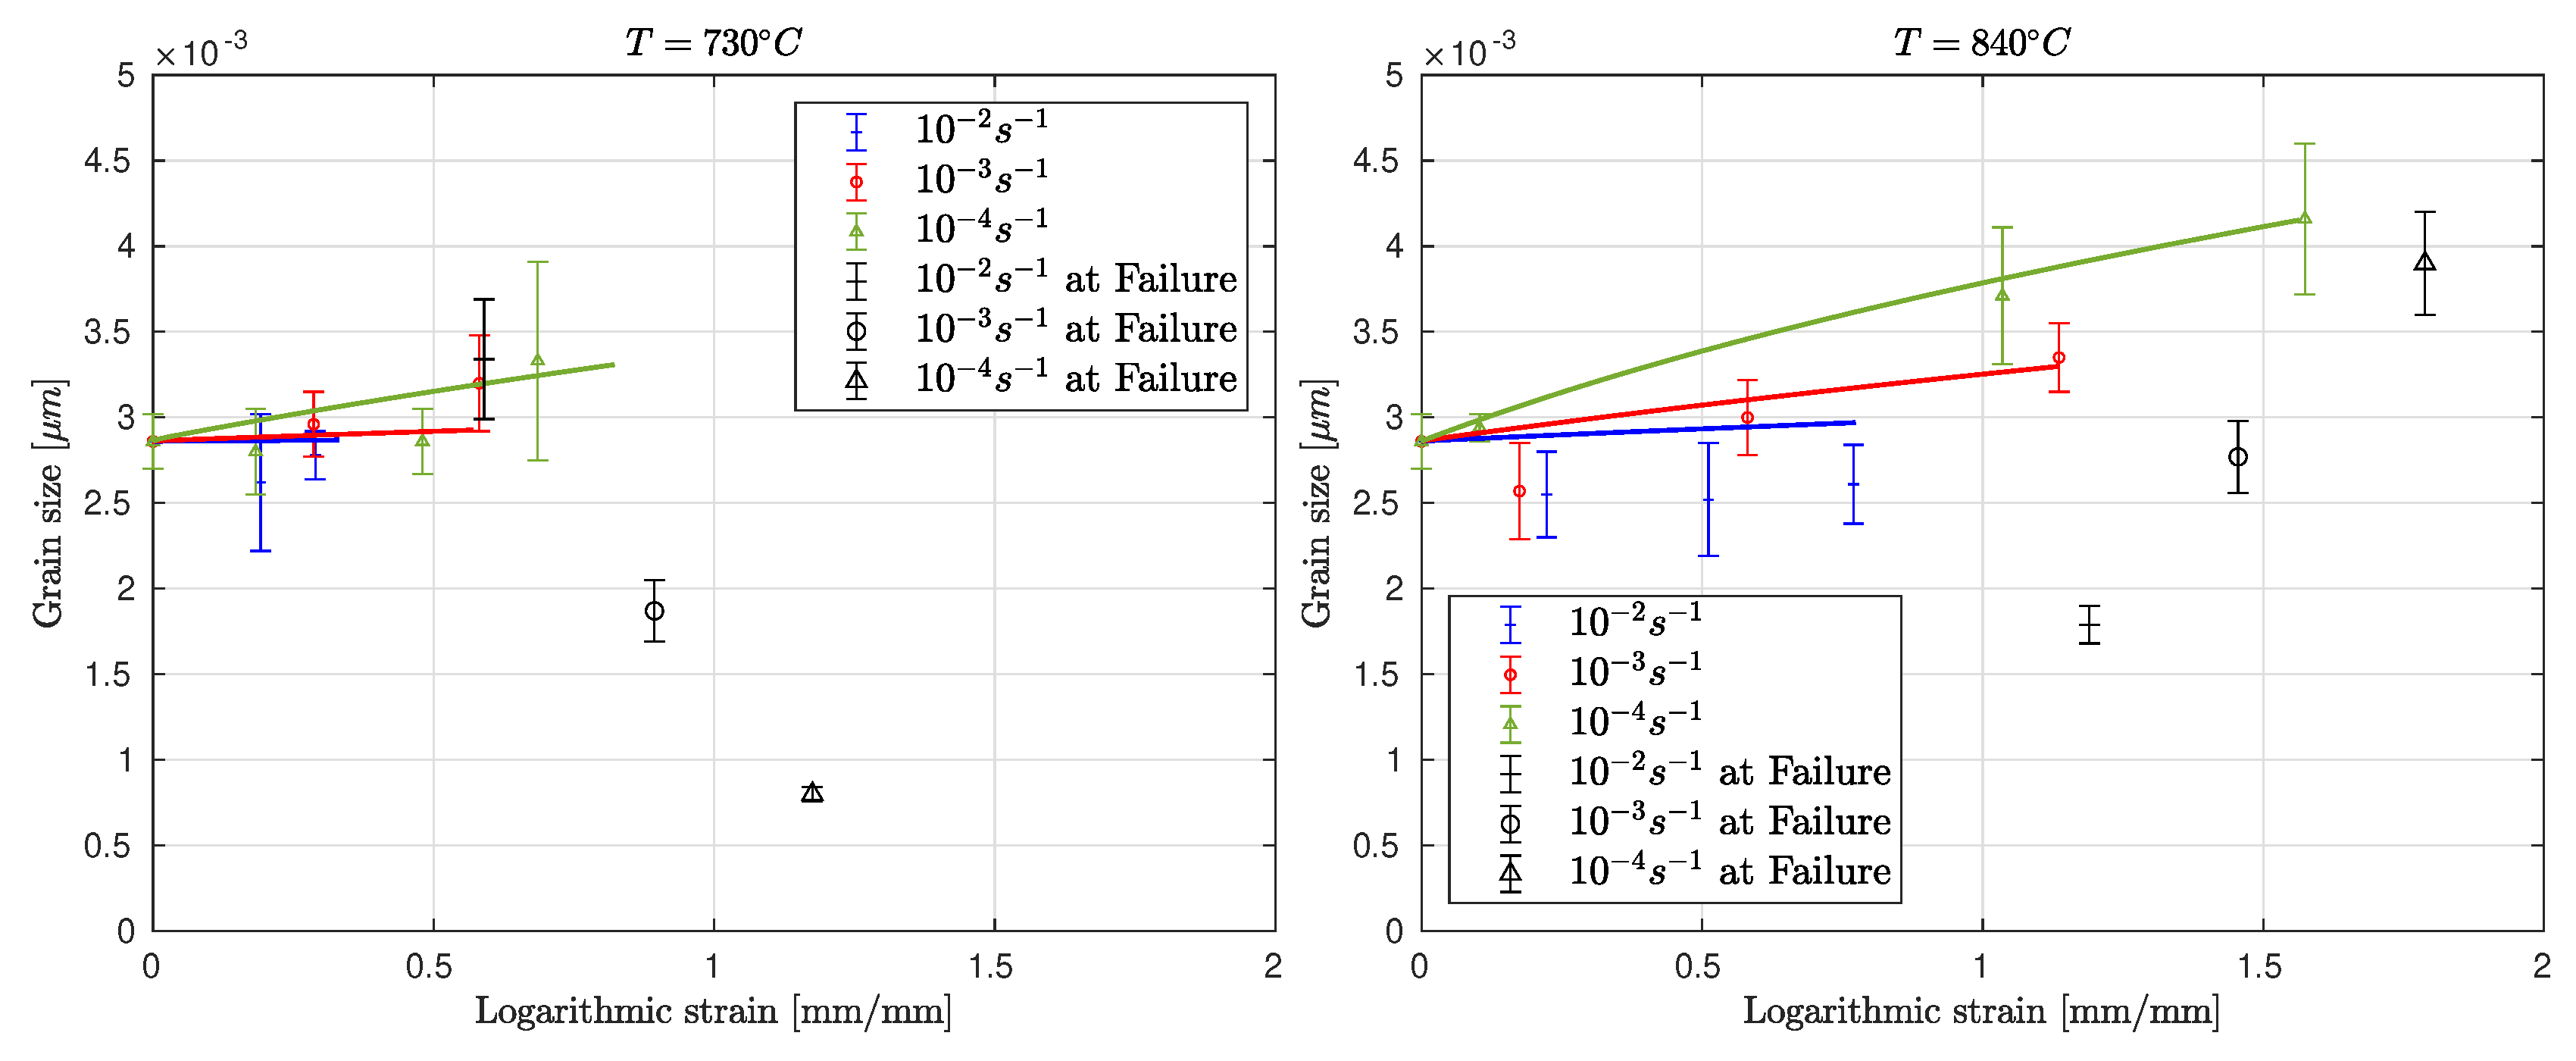
  • Isothermal tensile tests were carried out on a FG Ti6242 alloy allowing to exhibit the effects of the temperature, the strain rate on the microstructural evolution, initially characterized by both nodular and lamellar areas. Grain growth is activated at the lowest strain rates ( ε ˙ 10 3 s 1 ). Interrupted tensile tests confirm a softening mechanism increasing with the strain rate and which cannot be related to necking phenomenon.
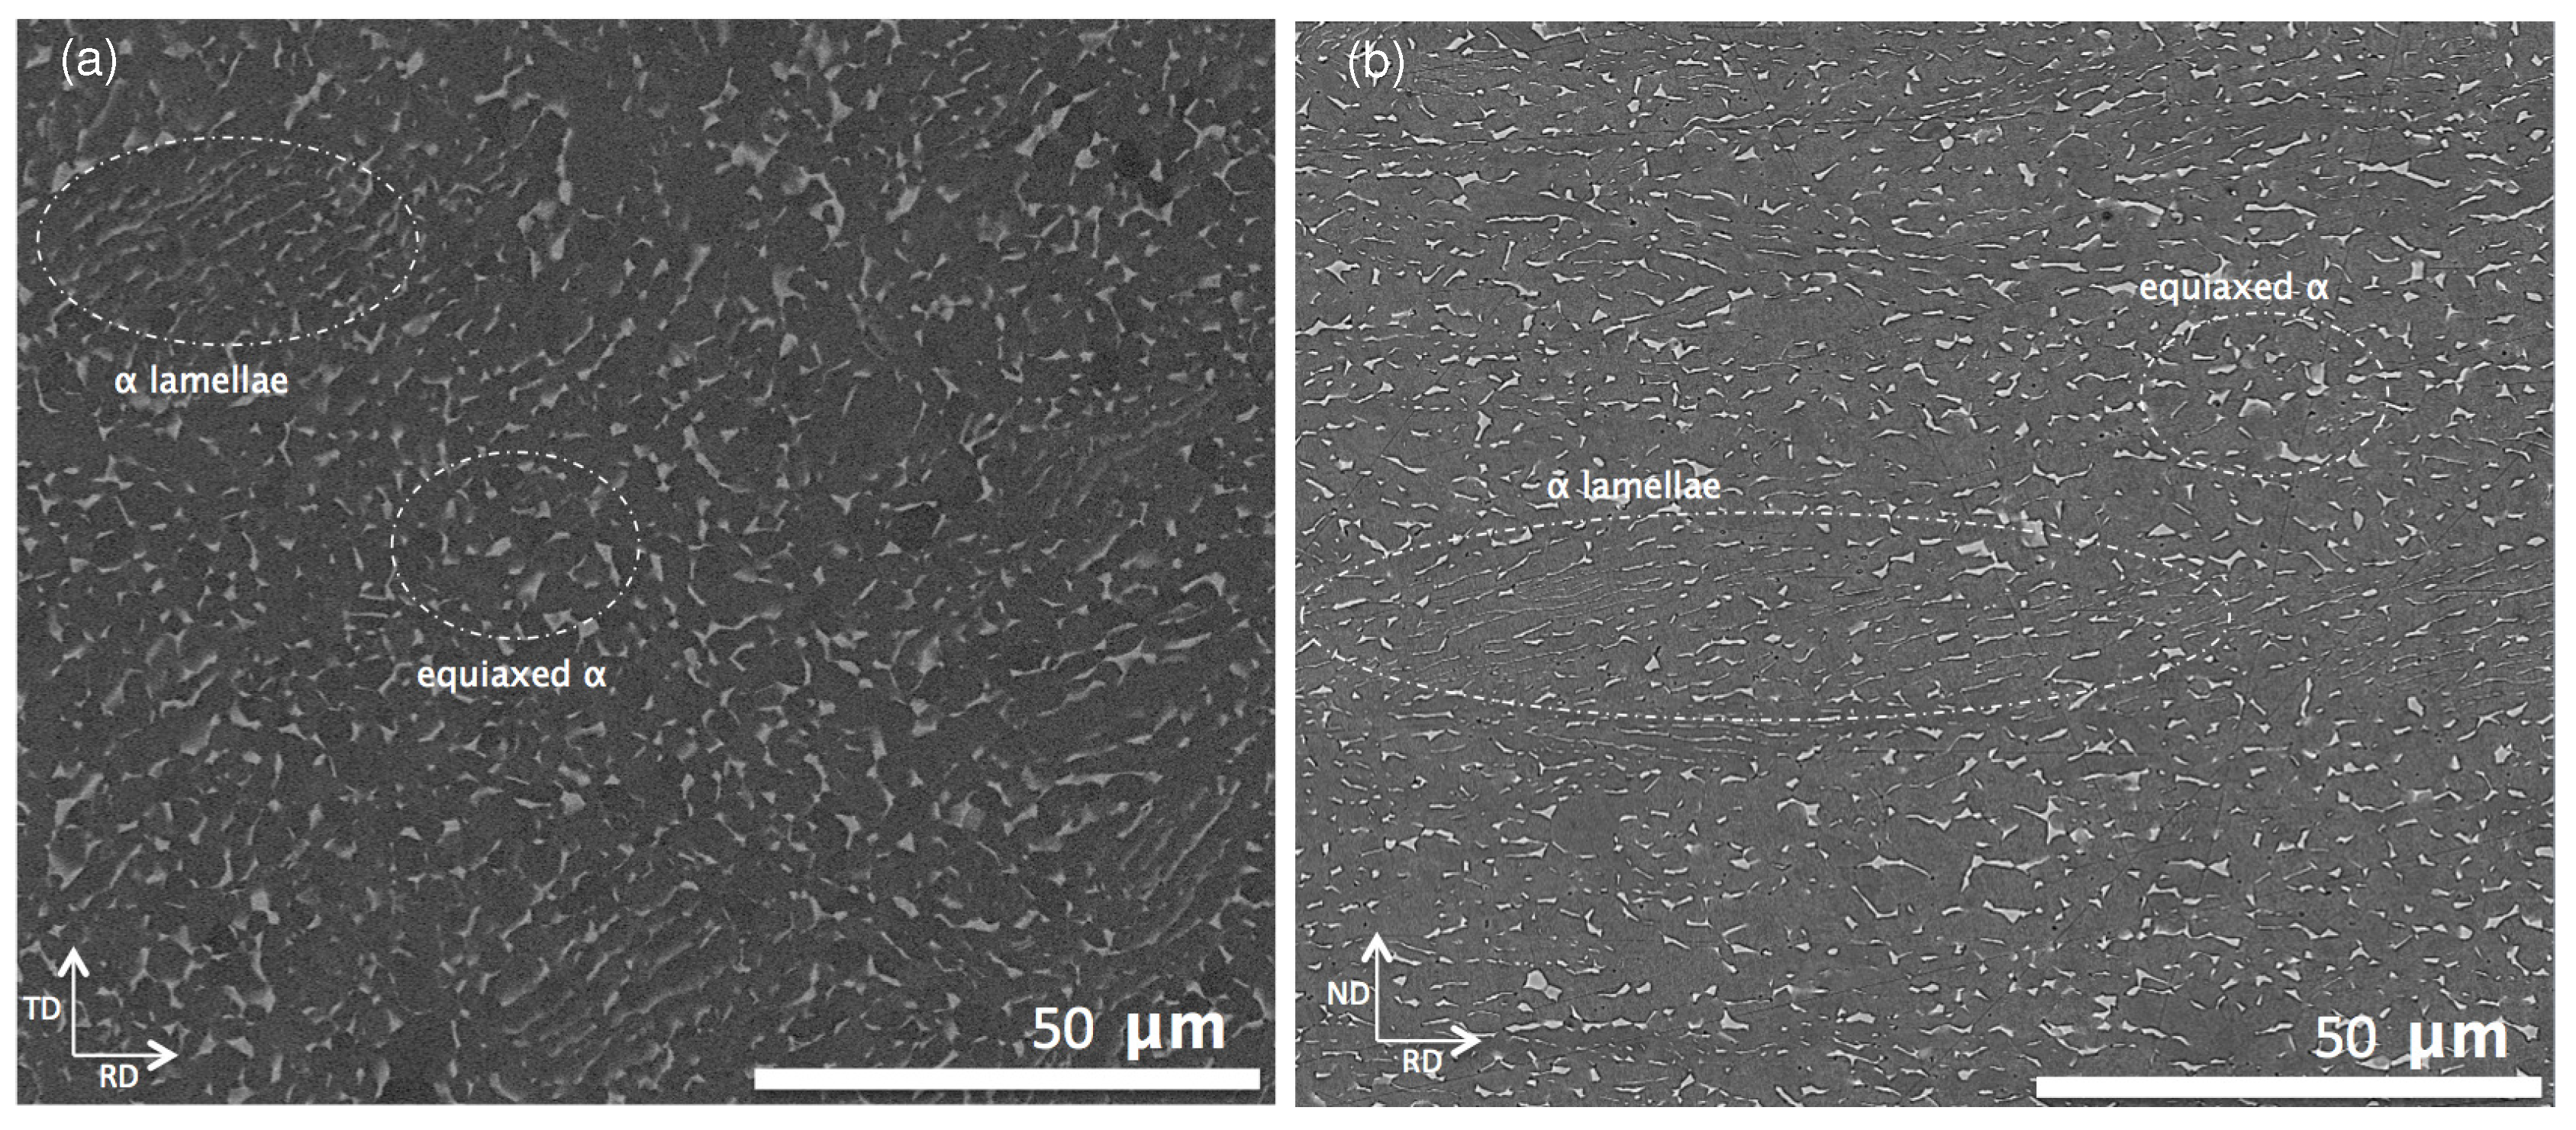
  • At T = 840 C, the FG Ti6242 alloy exhibits an interesting superplastic behavior ( m 0.3 ) that is attributable to a slight higher β phase fraction and to an effective globularization process that transforms the lamellar areas into an homogenous equiaxed microstructure which might promote grain boundary sliding and associated accommodation mechanisms.
  • At T = 730 C a lower ductility is obtained. By increasing the strain, the α lamellae mainly elongate along the tensile direction while the equiaxed α grains evolve slightly (mainly at lower strain rate). The strain rate sensitivity value ( m 0.3 ) associated to the microstructural evolution revealed that the deformation is mainly controlled by dislocation glide/climb mechanisms.
  • Phenomenological constitutive equations with microstructural considerations have been developed to predict the mechanical behavior under such conditions of temperatures and strain rates. Particular attention is paid to the prediction of the flow softening through a specific internal model variable whose effect increases with the strain rate. On other hand, the model is also able to predict the effect of grain growth observed for the lowest strain rates and leading to slight strain hardening.
  • In addition to classical recovery mechanisms, a part of the the flow softening was attributed to the initiation and ongoing of the dynamic globularization of the lamellar areas. Nevertheless additional mechanisms related to dynamic transformation during straining (as micro-cavities, texture evolution, evolution into the β phase, DRX in the nodular areas...) are most probably also contributing.

Author Contributions

Conceptualization, V.V. (Vincent Velay), H.M. and V.V. (Vanessa Vidal); methodology, L.S., L.D., A.I. and H.O.; investigation, L.S., L.D., A.I. and H.O.; writing—original draft preparation, V.V. (Vincent Velay), H.M. and V.V. (Vanessa Vidal); writing—review and editing, V.V. (Vincent Velay), H.M. and V.V. (Vanessa Vidal). All authors have read and agreed to the published version of the manuscript.

Funding

This research received no external funding.

Acknowledgments

The authors gratefully acknowledge T. Papaïx for his help in performing the mechanical tests.

Conflicts of Interest

The authors declare no conflict of interest.

References

  1. Velay, V.; Matsumoto, H.; Vidal, V.; Chiba, A. Behavior modeling and microstructural evolutions of Ti–6Al–4V alloy under hot forming conditions. Int. J. Mech. Sci. 2016, 108–109, 1–13. [Google Scholar] [CrossRef] [Green Version]
  2. Imai, H.; Yamane, G.; Matsumoto, H.; Vidal, V.; Velay, V. Superplasticity of metastable ultrafine-grained Ti-6242S alloy: Mechanical flow behavior and microstructural evolution. Mater. Sci. Eng. A 2019, 754, 569–580. [Google Scholar] [CrossRef] [Green Version]
  3. Despax, L.; Vidal, V.; Delagnes, D.; Dehmas, M.; Matsumoto, H.; Velay, V. Influence of strain rate and temperature on the deformation mechanisms of a fine-grained Ti-6Al-4V alloy. Mater. Sci. Eng. A 2020, 790, 139718. [Google Scholar] [CrossRef]
  4. Yamane, G.; Velay, V.; Vidal, V.; Matsumoto, H. Mechanical behavior of Ti-6Al-2Sn-4Zr-2Mo titanium alloy under hot and superplastic forming conditions: Experiment and modeling. Defect Diffus. Forum 2018, 385, 413–418. [Google Scholar] [CrossRef] [Green Version]
  5. Gao, P.; Fu, M.; Zhan, M.; Lei, Z.; Li, Y. Deformation behavior and microstructure evolution of titanium alloys with lamellar microstructure in hot working porcess: A review. J. Mater. Sci. Technol. 2020, 39, 56–73. [Google Scholar] [CrossRef]
  6. Semiatin, S. An Overview of the Thermomechanical Processing of α/β Titanium Alloys: Current Status and Future Research Opportunities. Metall. Mater. Trans. A 2020, 51, 2593–2625. [Google Scholar] [CrossRef] [Green Version]
  7. Bodunrin, M.O.; Chown, L.H.; van der Merwe, J.W.; Alaneme, K.K. Microstructural evolution during hot forming of Ti-6Al-4V alloy with complex initial microstructure. Int. J. Adv. Manuf. Technol. 2019, 104, 3017–3026. [Google Scholar] [CrossRef]
  8. Zhou, D.; Zeng, W.; Xu, J.; Wang, S.; Chen, W. Evolution of equiaxed and lamellar α during hot compression in a near alpha titanium alloy with bimodal microstructure. Mater. Charact. 2019, 151, 103–111. [Google Scholar] [CrossRef]
  9. Alabort, E.; Putman, D.; Reed, R. Superplasticity in Ti–6Al–4V: Characterisation, modelling and applications. Acta Mater. 2015, 95, 428–442. [Google Scholar] [CrossRef] [Green Version]
  10. Yang, L.; Li, N.; Wang, B.; Lin, J.; Zhao, H.; Ma, W. Unified constitutive modelling for two-phase lamellar titanium alloys at hot forming conditions. Manuf. Rev. 2016, 3, 14. [Google Scholar] [CrossRef] [Green Version]
  11. Yasmeen, T.; Shao, Z.; Zhao, L.; Gao, P.; Lin, J.; Jiang, J. Constitutive modeling for the simulation of the superplastic forming of TA15 titanium alloy. Int. J. Mech. Sci. 2019, 164, 105178. [Google Scholar] [CrossRef]
  12. Gao, P.; Yang, H.; Fan, X.; Zhu, S. Unified modeling of flow softening and globularization for hot working of two-phase titanium alloy with a lamellar colony microstructure. J. Alloy. Compd. 2014, 600, 78–83. [Google Scholar] [CrossRef]
  13. Lin, J.; Liu, Y.; Farrugia, D.C.J.; Zhou, M. Development of dislocation-based unified material model for simulating microstructure evolution in multipass hot rolling. Philos. Mag. 2005, 85, 1967–1987. [Google Scholar] [CrossRef]
  14. Park, C.H.; Lee, B.; Semiatin, S.; Lee, C.S. Low-temperature superplasticity and coarsening behavior of Ti–6Al–2Sn–4Zr–2Mo–0.1Si. Mater. Sci. Eng. A 2010, 527, 5203–5211. [Google Scholar] [CrossRef]
  15. Shell, E.B.; Semiatin, S.L. Effect of initial microstructure on plastic flow and dynamic globularization during hot working of Ti-6Al-4V. Metall. Mater. Trans. A 1999, 30, 3219–3229. [Google Scholar] [CrossRef]
  16. Semiatin, S.; Seetharaman, V.; Ghosh, A.; Shell, E.; Simon, M.; Fagin, P. Cavitation during hot tension testing of Ti–6Al–4V. Mater. Sci. Eng. A 1998, 256, 92–110. [Google Scholar] [CrossRef]
  17. Zhao, H.; Wang, B.; Ju, D.; Chen, G. Hot tensile deformation behavior and globularization mechanism of bimodal microstructured Ti-6Al-2Zr-1Mo-1V alloy. Trans. Nonferrous Met. Soc. China 2018, 28, 2449–2459. [Google Scholar] [CrossRef]
  18. Semiatin, S.; Seetharaman, V.; Weiss, I. Flow behavior and globularization kinetics during hot working of Ti–6Al–4V with a colony alpha microstructure. Mater. Sci. Eng. A 1999, 263, 257–271. [Google Scholar] [CrossRef]
  19. Semiatin, S.L.; Bieler, T.R. The effect of alpha platelet thickness on plastic flow during hot working of TI–6Al–4V with a transformed microstructure. Acta Mater. 2001, 49, 3565–3573. [Google Scholar] [CrossRef]
  20. Mosleh, A.; Mikhaylovskaya, A.; Kotov, A.; Kwame, J. Experimental, modelling and simulation of an approach for optimizing the superplastic forming of Ti-6. J. Manuf. Process. 2019, 45, 262–272. [Google Scholar] [CrossRef]
Figure 1. Plastic Stress-Strain curves performed at 730 C for several strain rate conditions and elongations.
Metals 10 01599 g001
Figure 2. Plastic Stress-Strain curves performed at 840 C for several strain rate conditions and elongations.
Metals 10 01599 g002
Figure 3. SEM images of the initial microstructure revealing co-existence of equiaxed α nodules and elongated α lamellae (a) RD-TD surface and (b) RD-ND surface.the dark phase is α and the lighter phase is β .
Metals 10 01599 g003
Figure 4. SEM-BSE images showing the evolution of the microstructure of the Ti6242 alloy during deformation at 730 C for several elongations and strain rates: 10 2 s 1 (a,b); 10 3 s 1 (c,d); 10 4 s 1 (e,f).
Metals 10 01599 g004
Figure 5. Image Quality maps in an equiaxed area of the Ti6242 alloy (a) prior to deformation and after deformation at 730 C with a plastic deformation of (b) 0.469 at 10 3 s 1 and (c) 0.591 at 10 4 s 1 . In (b,c) the red color remains to the β phase and circled areas are example of recrystallized zones.
Metals 10 01599 g005
Figure 6. Grain size evolution at 730 C and 840 C for several strain rate conditions for several elongation levels and at the failure.
Metals 10 01599 g006
Figure 7. SEM images showing the evolution of the microstructure of the Ti6242 alloy during deformation at 840 C for several elongations and strain rates: 10 2 s 1 (ac); 10 3 s 1 (df); 10 4 s 1 (gi).
Metals 10 01599 g007
Figure 8. Grain size evolution at 730 C and 840 C for several strain rate conditions (Model predictions: lines; Experiment: Symbols).
Metals 10 01599 g008
Figure 9. Comparison between experimental and computed stress-strain curves at 730 C and 840 C for several strain rate conditions (Model predictions: lines; Experiment: Symbols).
Metals 10 01599 g009
Figure 10. Normalised softening mechanism estimated from variable S at T = 730 C (a) and T = 840 C (b).
Metals 10 01599 g010
Figure 11. Dependence on the strain rate sensitivity (m value) on strain at T = 730 C and T = 840 C.
Metals 10 01599 g011
Table 1. Maximal stresses σ m a x achieved for the deformation ε p as a function of the strain rate ε ˙ and the temperature T.
T [°C] ε ˙ [s−1]T [°C] ε ˙ [s−1]
730 10 4 10 3 10 2 840 10 4 10 3 10 2
σ m a x [ MPa ] 180310444 σ m a x [ MPa ] 4796190
ε p 0.40.2580.145 ε p 0.50.4150.17
Table 2. Model parameters in conjunction with Equations (9) and (10), Temperature-dependent parameters (left) and constant parameters (right).
Parameter pCoefficient p 0 Coefficient Q p (J·mol 1 )Parameter pValue
E 1.0 8.9 × 10 4
σ 0 1.1 × 10 1 4.7 × 10 4
B 20.0 2.7 × 10 4 γ 2.9
β 1 1.35 × 10 3 6.3 × 10 4 δ 10.0
β 2 4.6 × 10 5 1.3 × 10 5
A 4.2 × 10 2 2.654 × 10 5 m 2.0
n 3.1 × 10 2 5.9 × 10 4
η 5.75 × 10 4 1.1 × 10 4
η 2 2.6 × 10 3 5.85 × 10 4
η 3 1.9 × 10 5 1 × 10 5 η 1 2.2
ε c 3.23 × 10 10 2.36 × 10 5
S m a x 3.0 2.2 × 10 4
α 1 1.365 × 10 6 2.013 × 10 5
α 2 3.05 4.445 × 10 4
α 3 300.0 3.1 × 10 4
α 4 100.0 3.65 × 10 4
Publisher’s Note: MDPI stays neutral with regard to jurisdictional claims in published maps and institutional affiliations.

