Evaluation of the DOS by DL−EPR of UNSM Processed Inconel 718


National Center for Education and Research on Corrosion and Materials Performance, NCERCAMP-UA, Dept. Chemical, Biomolecular, and Corrosion Engineering, The University of Akron, 302 E Buchtel Ave, Akron, OH 44325-3906, USA
*
Author to whom correspondence should be addressed.
Metals 2020, 10(2), 204; https://doi.org/10.3390/met10020204
Submission received: 31 December 2019
/
Revised: 22 January 2020
/
Accepted: 29 January 2020
/
Published: 1 February 2020
(This article belongs to the Special Issue Corrosion and Protection of Metals)
Abstract
:In this work, influence of ultrasonic nanocrystal surface modification (UNSM) on the degree of sensitization (DOS) in Inconel 718 has been studied and correlated with the resulting microstructure. The UNSM processed samples decreased their grain size from 11.9 µm to 7.75 µm, increasing the surface of grain boundaries, and thus enhancing the area where δ phase and niobium carbides precipitate. The effect of the UNSM process on the DOS of Inconel 718 was studied by the double loop electrochemical potentiokinetic reactivation (DL−EPR) test. The DL−EPR showed that for UNSM processed samples with no thermal treatment, the DOS increased up to 59.6%, while for UNSM treated samples that were post-annealed at 1000 °C for 10 min and water quenched the DOS decreased down to 40.9%. The increase of grain boundaries surface area and triple junctions after the UNSM process enables the formation of twice the amount of δ phase compared to the as-received Inconel 718 bulk sample. The area fraction of the grain boundary covered by δ phase was of 9.87% in the UNSM region while in the bulk the area fraction was 4.09%. In summary, it was found that after UNSM process, the annealing at 1000 °C for 10 min and water quenching promoted the transformation of γ″ to form δ phase on the grain boundaries, which reduces the intergranular corrosion susceptibility.
1. Introduction
Inconel 718 is a Ni-Fe-Cr superalloy widely used in the aerospace and nuclear industries due to its enhanced corrosion properties within extreme environment conditions [1,2,3]. Its mechanical and corrosion properties are maintained at temperatures as high as 700 °C, making the Inconel 718 alloy suitable for demanding working conditions [1,4,5,6]. Among the high strength, fatigue, creep and wear resistance properties, Inconel 718 also has favorable weldability [7,8,9,10]. The outstanding mechanical and corrosion properties of Inconel 718 are attributed to its microstructure, which is mainly constituted of austenite, γ phase. The composition of Inconel 718 presents a Ni equivalent value (Nieq) high enough to promote a single-phase microstructure (γ phase) as seen in the Schaeffler diagram [11]. Besides the γ phase, Inconel 718 precipitates other phases, the most common are: γ′ being a face centered cubic (FCC), with a Ni3(Al, Ti) composition; γ″ being a body centered tetragonal (BCT) with a Ni3Nb composition, and δ phase with an orthorhombic crystal structure having a Ni3Nb composition [4,12,13,14]. The γ″ phase confers most of the hardening to the Inconel 718 γ-phase matrix; however, it is a metastable phase the more stable form of which is the δ phase. The increased amount of δ phase is at an expense of depleting the γ″ phase concentration in the γ-phase matrix; leading to the worsening of the mechanical properties, mainly the hardness. Nevertheless, δ phase can control the limiting grain growth during solution treatment when present in small amounts [4,15]. Moreover, the δ phase enhances the corrosion resistance as it is a more stable phase [16].
Although Inconel 718 excels with its mechanical properties at elevated temperatures, the depletion of the γ″ phase in exchange of the δ phase, promotes early failure by fatigue and creep [1]. Thus, further improvement of the mechanical properties of Inconel 718 can be achieved through the combination of mechanical and thermal treatments. Mechanical treatments like laser shock peening, shot peening or ultrasonic nanocrystal surface modification (UNSM) are among the most common surface modification treatments used to improve the tribological performance, wear and friction resistance, of Inconel 718 [17,18,19]. However, the improvement of the mechanical properties may produce some decrease in the corrosion performance. The UNSM process causes the grains on the surface and at the nearest surroundings layers to be crushed and hence the grain boundaries increase, enlarging the available surface coverage for the chromium and niobium carbides to precipitate which will raise the degree of sensitization (DOS) and therefore the intergranular corrosion susceptibility. This corrosion issue has not been considered in previous studies regarding the UNSM surface processing of Inconel and only few works mention it [17,20]. Previous works assert that the corrosion properties are improved after UNSM processing, showing micrographs of the top surface and its deformation by using TEM (transmission electron microscopy). However, there is a lack of electrochemical tests to prove the hypothesis based on the microstructure studies previously mentioned. A combined study of the mechanical performance, the microstructure and the electrochemistry should be carried out to better understand the tradeoff between the mechanical and the corrosion resistance properties.
In order to characterize the effect of thermal treatments on the DOS, previous researchers have used the double loop electrochemical potentiokinetic reactivation (DL−EPR) test. The DL−EPR enables a straightforward comparison between current peaks in the forward scan, activation scan; and backward scan, reactivation scan [21,22,23]. This method has been shown to produce reliable data from different thermal treatments to sensitized steels [21,24,25,26,27,28,29]. The DL−EPR has a higher reproducibility among results than the single loop EPR [30]. Previous studies on the Inconel family—mainly the 600 series—have provided promising results on the characterization of the DOS by the DL−EPR method. The Cr depleted areas due to thermal treatments or working conditions can be detected by the DL−EPR, due to the ability of the method to selectively attack the grain boundaries. Studies by DL−EPR on Inconel 600 have shown the enhancement of the susceptibility to intergranular corrosion due to the Cr depleted grain boundaries [31,32]. More recently, studies on grain boundary engineering on Inconel 600 have also been tested with the DL−EPR. They have shown the improvement on Inconel 600 by thermo-mechanical treatments on the protection against intergranular corrosion [33,34,35]. In addition to the thermal treatments, mechanical processing such as cold work also use DL−EPR to assess the degree of sensitization of steels [36,37,38].
This work studies the effect of thermo-mechanical processing, UNSM plus annealing, has on the intergranular corrosion susceptibility of Inconel 718. The grain size reduction induces larger grain boundary areas, which then are thermally activated promoting the growth of precipitates, mainly δ phase and Nb carbides. The effect of the UNSM on the DOS in Inconel 718 is studied by means of the DL−EPR. In addition to the electrochemical tests, a microstructural characterization was performed by optical, scanning electron microscopy (SEM) and X-ray diffraction (XRD) to support the DOS results.
2. Materials and Methods
2.1. Materials and Thermo-Mechanical Processing
The material used for this study was Inconel 718, the chemical composition of which is shown in Table 1. Samples were cut into squared sheets of 15 mm length size with a thickness of 3 mm. Before any thermo-mechanical treatment, the samples were polished up to grade 1200 with SiC sandpapers. The different samples studied can be identified in Table 2, where each sample abbreviation corresponds with its thermal and/or mechanical treatment. Four different thermo-mechanically treated samples were studied: Sample I1 was thermally treated in the furnace for 2 h at 675 °C and then water quenched; sample I2 was thermally treated in the furnace at 1000 °C for 10 min and then water quenched, this process was repeated three times; sample I3 was mechanically processed with the UNSM treatment three times; and sample I4 was mechanically processed with the UNSM, annealed at 1000 °C for 10 min and then water quenched. This thermo-mechanical process was repeated three times.
The processing parameters used for the UNSM treatment were a tungsten carbide ball with 2.4 mm tip diameter, a static load of 20 N, a scanning speed of 1000 mm/min, an amplitude of 16 µm and a spacing of 10 µm [39].
2.2. Electrochemical Characterization
Cyclic potentiodynamic polarization (CPP) tests were done for each sample in 3.5 wt.% NaCl solution (VWR Chemicals, LLC, Solon, OH, USA) at room temperature (25 °C). All electrochemical tests were conducted using a potentiostat/galvanostat Gamry Reference 600 (Gamry Instruments Inc., Warminster, PA, USA). A three-electrodes configuration cell setup was used, with a saturated calomel electrode (SCE) as the reference electrode (RE), a graphite rod as the counter electrode (CE) and the Inconel 718 samples as the working electrode (WE). The area exposed for the WE was 1 cm2. The polarization scan was ±1.0 VOCP at a scan rate of 1.667 mV/s for both, forward and backward scans. An open circuit potential (OCP) of 3 h was monitored prior to performing each CPP test.
The DOS of the sensitized samples was obtained by means of the DL−EPR test. A 0.1 M H2SO4 + 0.01 M KSCN (VWR Chemicals, LLC, Solon, OH, USA) test solution was used at room temperature [22,23,40]. All the samples were polished with sandpaper up to 1200 grit and rinsed with water and ethanol and dried with air. The electrochemical cell set up for the DL−EPR test was the same that for the three-electrodes configuration cell from the CPP. This system avoided the intrusion of air and separated the solution from the sample until the chamber was completely deaerated, avoiding the premature contact of the acid solution and the metal, which could attack the surface. The cell was deaerated with nitrogen for 30 min, then the solution was pumped into the electrochemical cell. Continuous N2 bubbling was kept for the entire test to keep the air from entering the system. The OCP was monitored for 30 min from the moment the solution covered the sample until a stable potential was reached. After recording the OCP, a potentiostatic hold of −1.0 VOCP was applied for 1 min with an imposed current limit of 100 mA/cm2. Then, the samples were polarized from −500 mVOCP to +500 mVOCP, and subsequently reversed for a complete DL−EPR test [22]. The scan rate for the potentiokinetic scans was 0.2 mV/s. The DOS was calculated with the ratio between the current density peak in the activation process (forward scan) (ia) and the current density peak in the reactivation process (backward scan) (ir) (see Equation (1)). The DL−EPR tests were done in triplicate for each of the different thermo-mechanically treated samples.
2.3. Microstructural Characterization
The microstructural study was conducted at the cross-section of the Inconel 718 samples. The samples were cut in half, mounted in epoxy resin and polished with 0.05 µm diamond powder. To reveal the microstructure, an etchant solution containing 17 mL HCl and 1 mL H2O2 (VWR Chemicals, LLC, Solon, OH, USA) was used. The optical images were taken with a metallographic microscope Nikon eclipse MA 100 (Nikon Corp., Tokyo, Japan), and a Hitachi TM3030 (Hitachi High-Tech. America Inc., Schaumburg, IL, USA) was used to perform the micrographs analysis with the scanning electron microscopy (SEM) technique, as well as energy dispersed X-ray (EDX). The grain size was calculated based on the optical microscopy images from the metallographic microscope at ×100 magnifications following ASTM E112–13 [41]. The amount of precipitates coverage for each sample was measured with the ImageJ software v.1.8.0_112 (National Institutes of Health, Bethesda, MD, USA).
X-ray diffraction (XRD) analysis was performed using a Rigaku SmartLab 3kW X-ray diffractometer (Rigaku Corp., Tokyo, Japan), with a Cu target (Kα = 1.5406 Å). The scan speed was 2°/min over the 2θ range of 40°–95°. The γ, γ″, δ and NiFe2O4 phases were elucidated in the XRD patterns.
3. Results and Discussion
3.1. Cyclic Potentiodynamic Polarization (CPP)
The CPP curves for each sample are showed in Figure 1. Sample I3 has the lowest corrosion potential (Ecorr) from all the samples, having a value of −625 mVSCE. However, its corrosion current density (icorr) is the lowest with a value of 2.37 μA/cm2. The icorr remains in the μA/cm2 range for all the thermo-mechanical treatments; I2 has an icorr of 3.83 μA/cm2, while I4 and I1 4.54 μA /cm2 and 5.51 μA/cm2, respectively. All the values of the Ecorr and icorr are presented in Table 3. The most passive sample is I2 with an Ecorr of −484 mVSCE. Samples I2 and I4 present a peak in the anodic branch around the same current density of 0.36 mA/cm2; this peak is associated with the dissolution of the δ phase and NbC [42]. During the anodic polarization of Sample I2, after the dissolution of the δ phase, the sample shows greater repassivation than was observed in Sample I4. Sample I4 shows higher icorr value and, thus is more active compared to Sample I2, despite having the same thermal treatment.
3.2. Double Loop Electrochemical Potentiokinetic Eeactivation (DL−EPR)
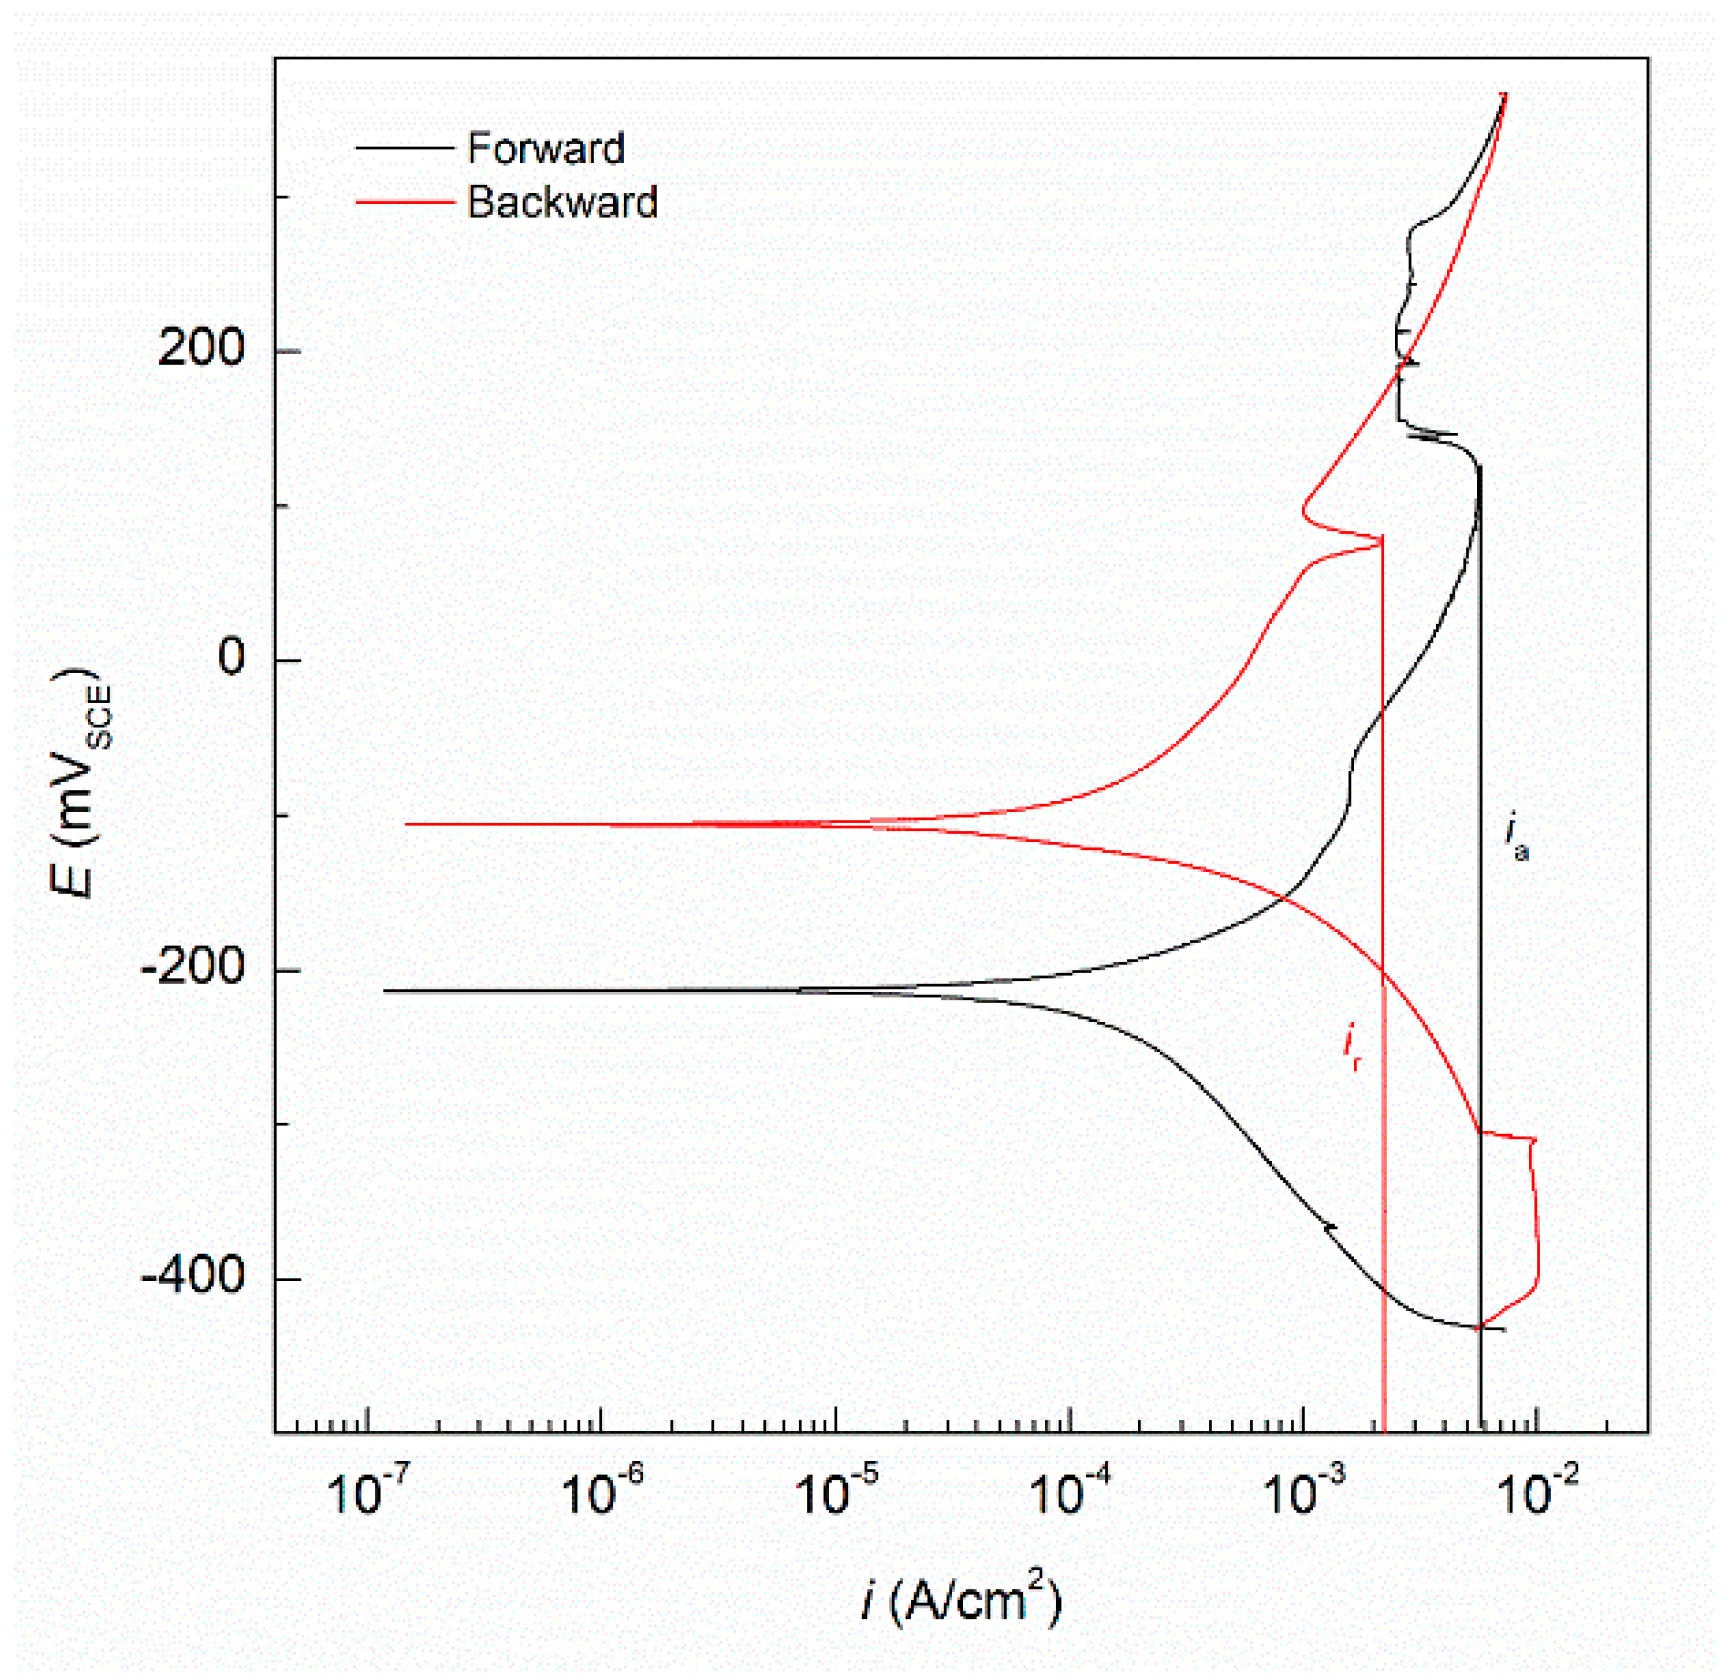
The effect on the intergranular corrosion susceptibility of the thermo-mechanical process for each of the four Inconel 718 samples was tested with the DL−EPR method. The DL−EPR plot for Sample I1 presents three branches in the backward scan while in the forward resulted in only one; this is because during the backward scan there are three different states (see Figure 2). The upper state is the passive state; here the acid has not broken the passive film that protects the substrate. The second state is the transient state; in this unstable state the passive film is becoming depleted and the acid initiates the surface attack of the Inconel 718. The last state is the active state and it is the only stable one; here the passive film is completely broken and the acid solution can dissolve the metal [21]. The ir is obtained from the anodic branch which is in between the active and transient states, its value is 75 μA/cm2 [43]. The DOS for sample I1 is 15.7%, this sensitization is expected for the applied thermal treatment at 675 °C, which is within the range of sensitization temperature for Inconel 718. No intergranular corrosion was produced for Sample I2 after annealing at 1000 °C followed by water quenching (see Figure 3). The forward and backward potentiokinetic scans matched perfectly, meaning that the annealing treatment proved to be an effective way to overcome sensitization. The triple repetition of the annealing treatment at 1000 °C for 10 min followed by water quenching avoid precipitation of γ″ phase. Sample I3 went through three cycles of UNSM treatment drastically increasing the DOS to 59.6% (see Figure 4). This high value of sensitization is the consequence of the increased number of grain boundaries created by the surface plastic deformation produced by the UNSM process. The plastic deformation applied to the top surface of the material increases the intergranular corrosion suffered by the Inconel 718; the current density peaks increased three orders of magnitude from 0.51 mA/cm2 (ia Sample I1) to 126.9 mA/cm2 (ia Sample I3), proving the higher susceptibility to intergranular corrosion (see Table 4). This plastic deformation is also evidenced in the microstructural analysis where carbides are formed in the newly created twin boundaries. Finally, Sample I4, three cycles of UNSM plus the 1000 °C for 10 min and water quenching, was tested. The DL−EPR plot in Figure 5 suggests an increase of the DOS due to the effect of the UNSM treatment compared to Sample I1. This increase in the DOS up to 40.9% is higher than the 15.7% from Sample I1, however compared to Sample I3 the DOS is almost one-third less. The annealing at 1000 °C for 10 min after each UNSM treatment enables the release of plastic strain and hence reducing the twin boundaries density. In addition to the stress relaxation, due to the annealing at 1000 °C transformation of γ″ occurs, leading to the formation of a more stable and corrosion resistance δ phase. Although the DOS decreases, the current density values of both peaks remain in the same order of magnitude (mA/cm2). The anodic current density remains in the order of mA/cm2 for the repassivation of Samples I1, I3 and I4, which is high for a DL−EPR test for stainless steels. However, in the case of Inconel, these current densities are within the expected range (mA/cm2) as shown by previous authors [44,45].
3.3. Microstructure Characterization
After the DL−EPR tests were completed, the Inconel 718 samples were cut in half and epoxy mounted to perform the microstructural analysis. The Inconel 718 cross-section was revealed with the etchant containing HCl and H2O2, the time to reveal the microstructure was between 15–20 s immersed in the solution.
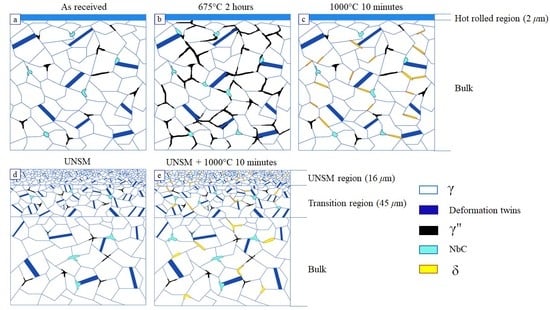
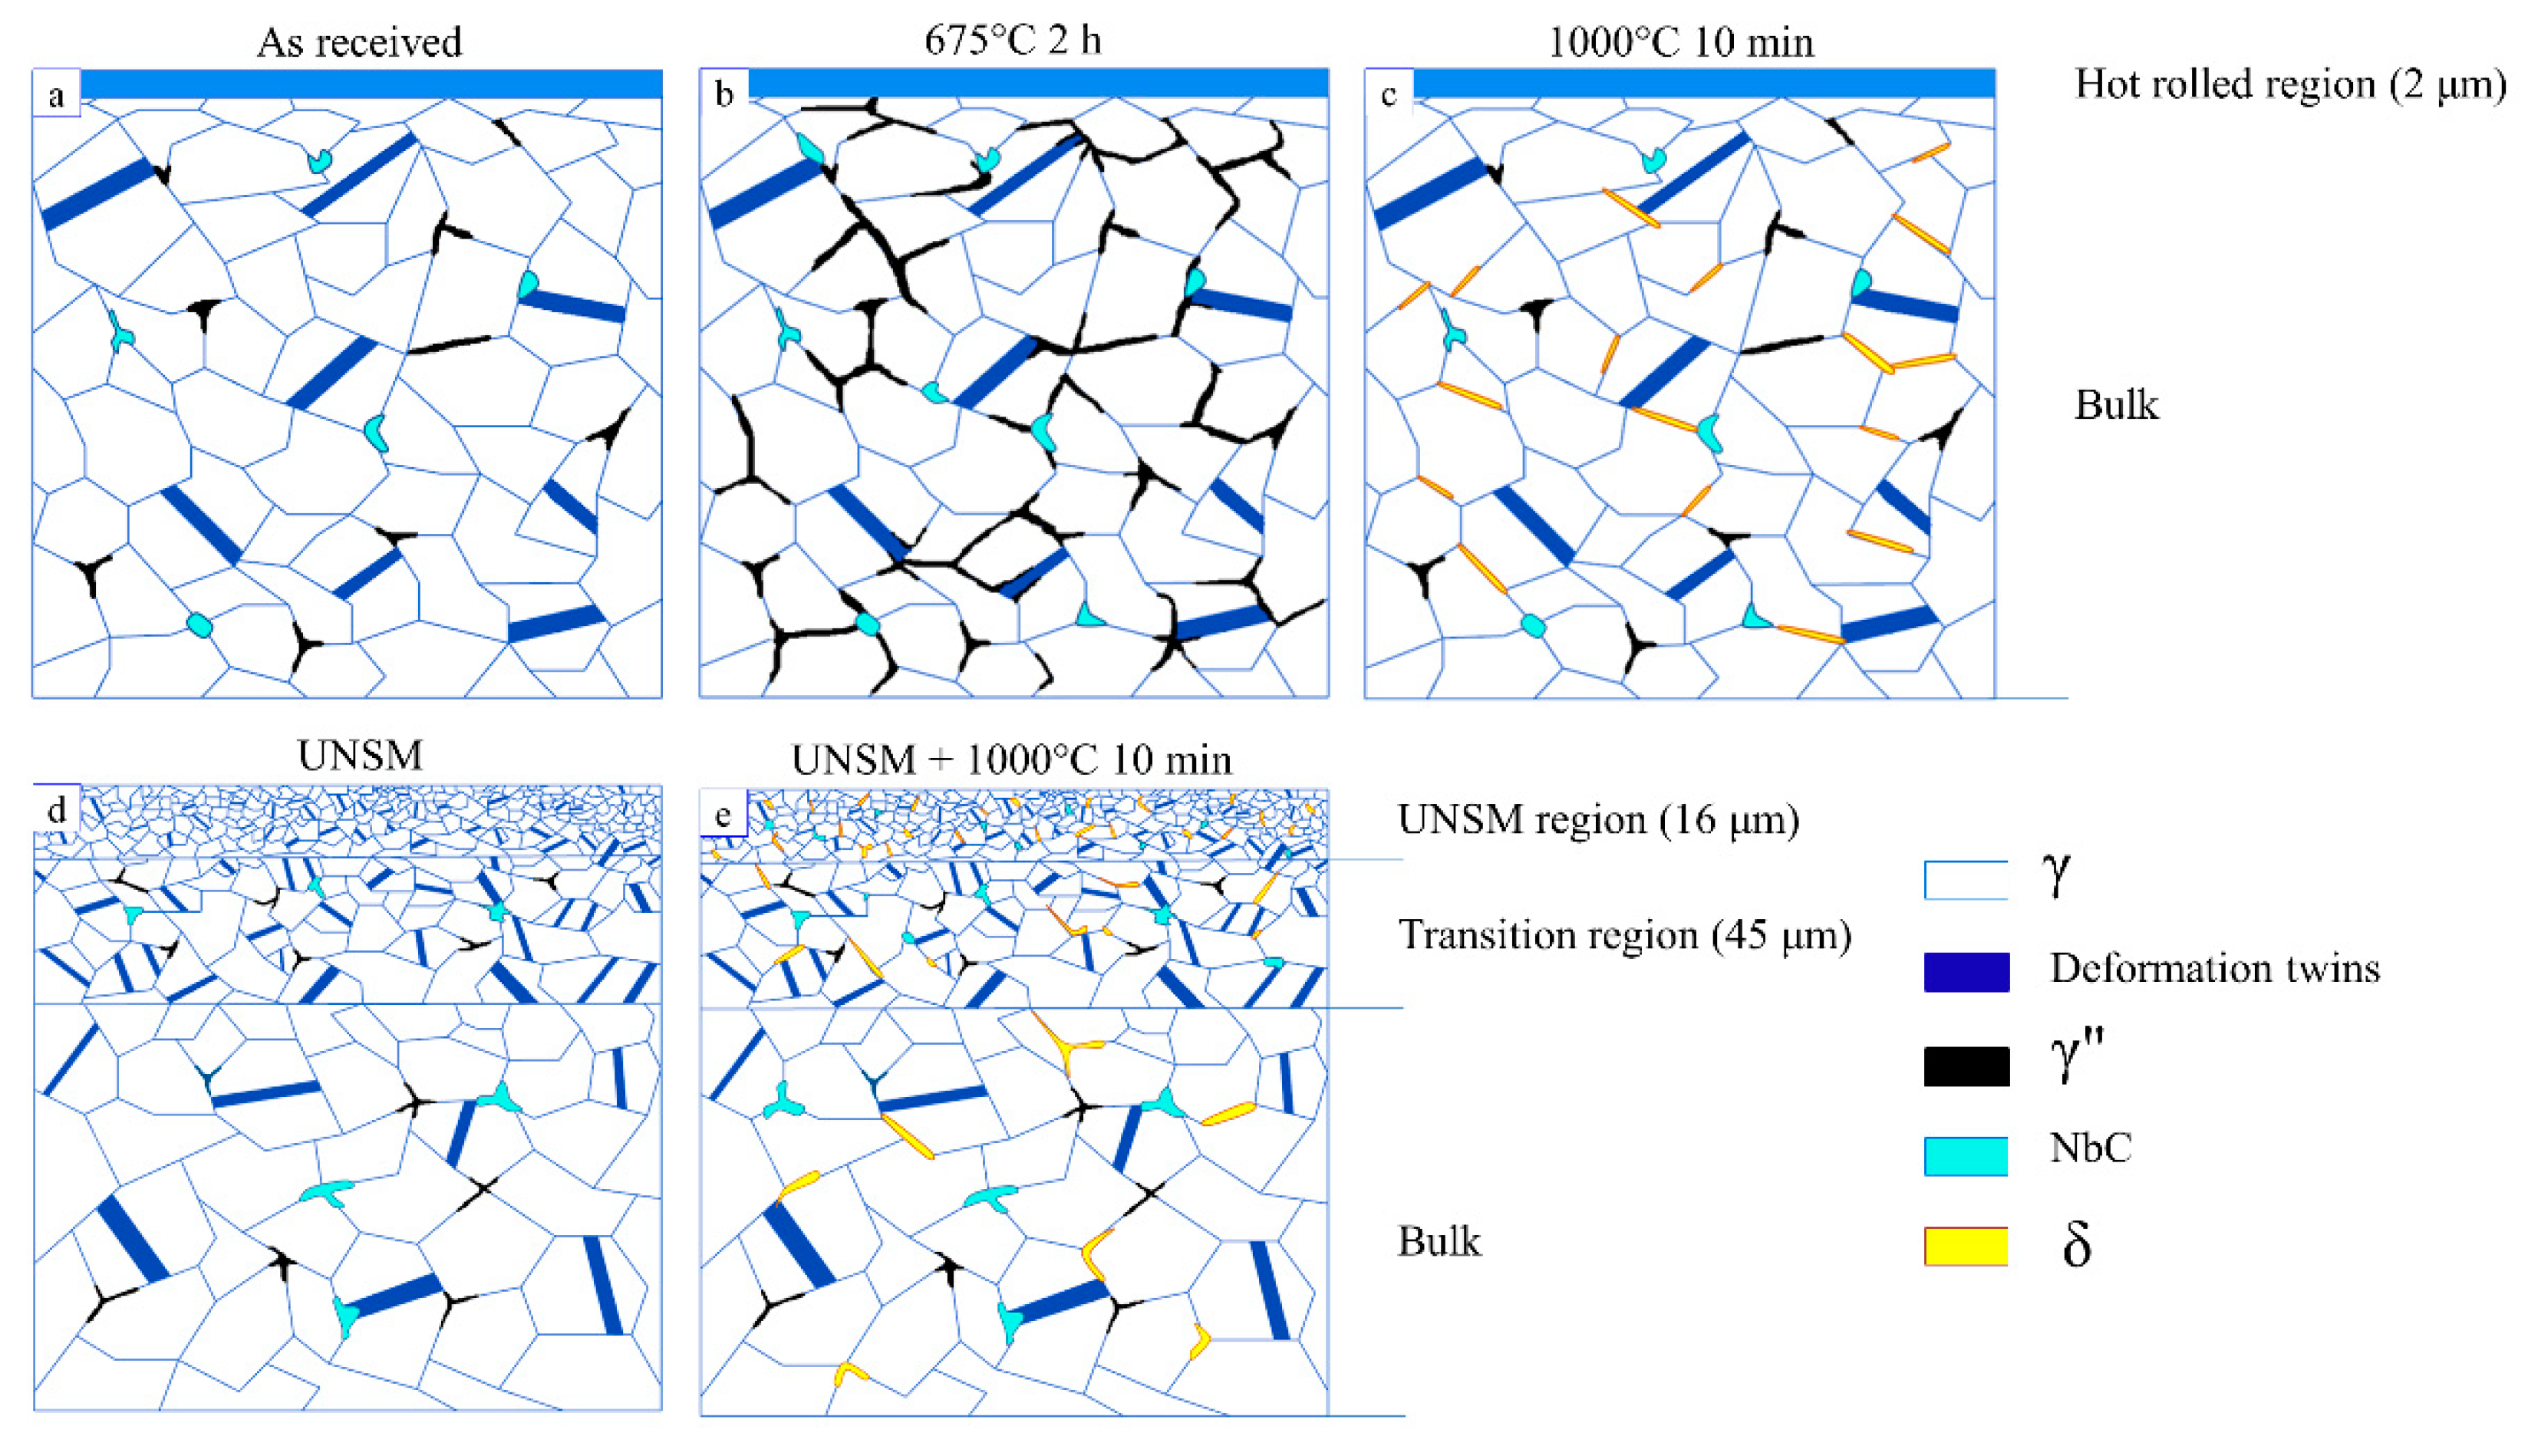
Figure 6 represents the Inconel 718 after each thermal and/or mechanical treatment. The as-received (AR) Inconel 718 has a microstructure mainly formed by γ phase, having deformation twins scattered throughout the entire microstructure as well as some minor carbide precipitates due to the manufacturing temperatures (see Figure 6a). The Inconel 718 sheets were hot rolled, leaving the top surface with some plastic deformation where the grains were much smaller compared to the bulk. Sample I1 developed more γ″ phase at the grain boundaries because of the thermal treatment at 675 °C for 2 h, as was expected from the TTT (time-temperature-transformation) diagram of Inconel 718 for these temperature and time conditions [46,47] (see Figure 6b). Sample I2 did not show as much γ″ phase on the grain boundaries as Sample I1, but it presented δ phase instead as well as slightly more carbides (see Figure 6c). The annealing treatment at 1000 °C for 10 min and water quenching repeated three times made the γ″ phase transform into its more stable δ phase. In these first three steps, the grain size and the density of deformation twins remained constant as no extra work had been added to the Inconel 718 samples. However, once the UNSM process was applied, the outermost surface layer became heavily deformed, considerably reducing its grain size as well as promoting more twin boundaries. In Sample I3, which suffered three UNSM treatments, three regions were differentiated in the microstructure (UNSM, transition and bulk regions) (see Figure 6d). The closer to the UNSM treated surface, the greater the plastic deformation, reducing the grain size more severely. The transition region between the UNSM treated region and the bulk experienced a higher concentration of twin boundaries; here the plastic deformation was gradually reduced, having a wide average grain size. Finally, Sample I4 was thermo-mechanically treated with the UNSM, annealed at 1000 °C for 10 min and water quenched, all repeated three times (see Figure 6e). This thermo-mechanical process promotes a higher amount of δ phase in the UNSM region as well as in the transition region. The UNSM thermo-mechanically treated sample now had a higher amount of grain boundaries and hence, a higher probability to promote δ phase and carbides.
The optical images in Figure 7 show the microstructure of the Inconel 718 samples, revealing a similar polygonal equiaxed γ phase matrix with scattered twins along the plane [9]. The morphology and deformation twins distribution of the Inconel 718 samples found in this study resemble the one found on the literature [17,48]. Samples AR, I1 and I2 did not experienced UNSM processing, therefore their grain size remained constant with an average size of 11.2 µm, 11.9 µm and 11.4 µm respectively [49] (see Figure 7a–c). While the microstructure of Samples I3 and I4 present three regions: bulk, transition and UNSM (see Figure 7d,e). The bulk region has an average grain size of 11.4 µm, similar to the one for Samples AR, I1 and I2, while in the UNSM region the grain size is reduced to average values of 7.75 µm. It has been found that the DOS value highly increases from Sample I1 to Sample I3 by almost four times, 15.7% and 59.6% respectively. In the transition zone between the bulk and the UNSM region the grain size gradually decreases, having a more dispersed average size, ranging from 9–10 µm. The UNSM processing produced a similar penetration depth of 16.3 µm for surface-modified Samples I3 and I4 (see Figure 7f). Among all the samples, I1 shows the greater amount of precipitates in the grain boundaries; this is due to its thermal treatment temperature being in the sensitization temperature range for Inconel 718, as well as being subjected to it for two hours. In the case of Samples I2 and I4—which were thermally treated at 1000 °C for 10 min and water quenched—the grain boundaries are not affected as much after the annealing treatment, mainly because the time of exposure is minimal compare to the one of Sample I1.
The SEM micrographs of the four treated samples (I1, I2, I3, I4) and the AR sample can be seen in Figure 8, where all the images are at ×600 magnification. The formation of the niobium carbides (NbC) and precipitates are found at the grain boundaries and inside the twins. The AR sample shows the typical microstructure of Inconel 718 that is found in the literature (Figure 8a). The γ matrix has some deformation twins scattered along the microstructure as well as minor niobium carbides, probably formed due to the manufacturing process, which are mainly located at the grain boundaries triple junctions and twins [50]. Sample I1 experiences the highest grain boundary change from among all the samples, drastically increasing the amount of γ″ in the grain boundaries (Figure 8b). This is due to the applied thermal treatment at 675 °C for two hours, which mainly promotes γ″, according to the TTT diagram [46]. In addition to the γ″ formation, higher niobium carbides are seen at the grain boundaries and even inside the grains. By means of EDX, these niobium carbides are characterized, having a 54.52 wt.% Nb, 22.72 wt.% C, 12.68 wt.% Ni, 5.58 wt.% Cr and 4.5 wt.% Fe content. The area analysis also shows the presence of elements that compose the base Inconel 718 alloy. Sample I2 shows δ phase with an equiaxed elongated shape on the grain boundaries due to the annealing treatment at 1000 °C (Figure 8c). However, the exposure time is not enough to promote them as much as Sample I1 did with the γ″ [4]. In the case of Sample I3, as is clearly seen in the three regions from Figure 8d, the bulk shows a similar microstructure to the AR sample, while the transition region becomes more deformed and the formation of twins increases. The high deformation present in the UNSM region produces a very fine grain that is almost undistinguishable at the magnification used (×600). Even if more deformation twins are formed on the transition and UNSM regions, the amount of precipitates does not increase as there is no post-thermal treatment to the UNSM process. Sample I4, annealed at 1000 °C for 10 min and water quenched after USNM process, forms δ phase on the grain boundaries (Figure 8e). The UNSM process produced a smaller grain size on the top layer of the sample, thus increasing grain boundaries surface and hence favoring the formation of precipitates.
In addition to the micrographs of the bulk of each sample, micrographs at ×2000 magnifications were also taken at the top surface. Figure 9a shows the outer most layer of sample AR, where the rolled region can be distinguished from the bulk by the smaller grain size. As seen in Figure 8a, deformation twins and Nb carbides are scattered throughout the microstructure. Sample I1 also shows the numerous formations of γ″ phase, which is increased in the rolled region and nearby due to the density increase of grain boundaries (see Figure 9b). The morphology of Sample I2 is similar to the one seen in Figure 9a with the exception of the increase amount of δ phase in the grain boundaries (see Figure 9c). The top surface of Sample I3, as previously seen in Figure 8d, is heavily deformed to the point at which it is no longer possible to distinguish the grains (see Figure 9d). In the case of Sample I4 (see Figure 9e), the δ phase is more concentrated in the UNSM region, which implies that the volume fraction covered by γ″ phase is lower, as shown by previous authors [12,46,51]. Besides the δ phase formation, the microstructure of Sample I4 resembles that previously seen of Sample I3, having higher twin boundaries in the transition region and scattered carbides in the grain boundary triple junctions. Due to the annealing temperature of 1000 °C after each UNSM an oxide scale is formed on top of the UNSM region.
In order to quantify the effect of the UNSM process plus the thermal treatment, the area fraction of the grain boundaries covered by δ phase was calculated by ImageJ analysis [49]. Ten different SEM micrographs were used to measure the grain boundaries covered by δ phase; ×1000 magnifications images were used for the bulk region while images at ×2000 magnifications were used for the UNSM region. The image analysis showed that in the bulk region, Sample I2 had a δ phase area fraction of 3.94% while Sample I4 had a δ phase area fraction of 4.09% (see Table 5), while for the UNSM region in Sample I4 the δ phase area fraction increases to 9.87%. In addition to the grain boundary covered by δ phase area fraction study, an analysis of the volume fraction was done using the systematic manual point count by the ASTM E562 [52]. The grid size was set to 100 point grid, and with a relative accuracy of 20% the number of images to measure for Samples I2 and I4 were 10 each. The volume fraction obtained for the bulk of I2 and I4 was 4.15 and 4.25, respectively. The difference between the area and volume fraction is not very significant. The volume fraction for the UNSM region was 10.15. The addition of the annealing treatment at 1000 °C for 10 min reduces the residual stress created by the UNSM process, as well as promoting the formation of δ phase, which also reduces the corrosion susceptibility. Both effects make the DOS decrease from 59.4% to 40.9%, as seen in Figure 4 and Figure 5 for the DL−EPR test.
The XRD patterns for the different samples are shown in Figure 10, where the main phases are labeled with their respective peaks in the stick pattern. The AR sample mainly shows γ phase diffraction peaks, as it has neither thermal nor mechanical treatment. These XRD results are in good agreement with the SEM analysis, which did not show precipitates. Sample I1, as previously found in the SEM, shows a higher volume of γ″ in its pattern. The presence of γ″ phase is not directly seen as a single sharp peak; however, it can be confirmed by the distribution of sideband profiles around the γ peak (111) at 2θ = 43° (marked with an arrow in Figure 10), which indicate the presence of an austenite microregion (γʹ−FCC) within the γ matrix [53,54]. The γ″ peaks are inside the γ phase peaks, which have a higher intensity. Sample I2 has more Nb precipitates as it was thermally treated at 1000 °C, showing peaks of δ phase. Sample I3 does not show high concentrations of δ phase or γ″ as individual peaks. However, as also seen in Sample I1, sideband profiles are found around 2θ = 43° showing the γ″ inside the γ matrix. Finally, Sample I4, shows the peaks of δ phase with higher intensity, due to the increased amount of δ phase grain boundary coverage because of the UNSM process. It also shows the formation of a new peak around 2θ = 63°, which corresponds to the NiFe2O4. This spinel phase is a protective oxide that is formed due to the high temperature, which is seen in Figure 9e [55].
The effect that the UNSM treatment has on the DOS of Inconel 718 has been studied by different techniques. In this study, it has been shown that the plastic deformation generated during the UNSM treatment reduces the grain size, as seen in both the optical and SEM microstructures images. The grain size reduction increments the concentration of grain boundaries close to the UNSM treated surface, making Inconel 718 more susceptible to intergranular corrosion. The DOS of the UNSM treated Sample I3 is 59.6% while Sample I1 treated at 675 °C for two hours only has a DOS of 15.7%. Nevertheless, the annealing treatment of 1000 °C promotes the formation of δ phase, stable form of the γ″ phase; which reduces the intergranular corrosion susceptibility. This annealing treatment after UNSM process reduces the DOS to 40.9% (Sample I4), compare with 59.6% DOS value obtained for UNSM treated Sample I3 with no post-thermal treatment. The δ phase obtained from the annealing treatment (γ″ → δ transformation) is seen in the diffractograms as a sharp peak at 2θ = 57°.
4. Conclusions
In this work the influence of the UNSM process and post-thermal treatments on the degree of sensitization of Inconel 718 was studied. The main conclusions can be drawn as follows:
The UNSM process depletes the corrosion properties of the Inconel 718 compared to the AR sample. Nevertheless, the application of the annealing treatment at 1000 °C releases stresses and lowers the DOS down to 40.9%, almost one-third the value of non-annealed UNSM sample (59.6%).
The decrease in the grain size due to the UNSM treatment—from 11.3 μm to 7.75 µm—increases the grain boundary density, consequently enhancing the formation of niobium carbides and δ phase due to thermal treatments.
The area fraction of grain boundary covered by δ phase increases from 4.09% in the bulk region to 9.87% in the UNSM region after the annealing treatment is applied to the Inconel 718.
The increased amount of δ phase in the grain boundaries reduces the intergranular corrosion susceptibility as the δ phase is more stable than the γ″ phase. The δ phase preferentially forms in the grain boundaries’ triple junctions and the twin boundaries.
Formation of the δ phase in the top surface after the UNSM processing and the annealing thermal treatment of 1000 °C was elucidated with XRD patterns. The thermo-mechanical treated Sample I4, developed a higher intensity δ phase diffraction peak, thus producing a lower DOS value compared to UNSM treated Sample I3, and conferring on Inconel 718 a better performance against intergranular corrosion.
This work enhances the current knowledge of UNSM treatment of Inconel 718 by assessing the resulting DOS and corrosion performance. Therefore, further research is necessary to evaluate the changes in mechanical properties such as wear, friction, and micro-hardness caused by sensitization.
Author Contributions
Conceptualization, D.M.B. and U.M.; methodology, D.M.B. and U.M.; formal analysis, U.M., J.R., J.B. and D.M.B.; investigation, U.M., J.R., J.B. and D.M.B.; resources, D.M.B.; writing—original draft preparation, U.M., J.R., J.B. and D.M.B.; writing—review and editing, U.M. and D.M.B.; supervision, D.M.B.; project administration, D.M.B.; funding acquisition, D.M.B. All authors have read and agreed to the published version of the manuscript.
Funding
This research was funded by The University of Akron, Fellowship Program FRC-207367.
Acknowledgments
The authors acknowledge funding support from The University of Akron, Fellowship Program FRC-207367.
Conflicts of Interest
The authors declare no conflict of interest.
References
- Hosseini, E.; Popovich, V.A. A review of mechanical properties of additively manufactured Inconel 718. Addit. Manuf. 2019, 30, 100877. [Google Scholar] [CrossRef]
- Kang, Y.J.; Yang, S.; Kim, Y.K.; AlMangour, B.; Lee, K.A. Effect of post-treatment on the microstructure and high-temperature oxidation behaviour of additively manufactured Inconel 718 alloy. Corros. Sci. 2019, 158, 108082. [Google Scholar] [CrossRef]
- Chamanfar, A.; Monajati, H.; Rosenbaum, A.; Jahazi, M.; Bonakdar, A.; Morin, E. Microstructure and mechanical properties of surface and subsurface layers in broached and shot-peened Inconel-718 gas turbine disc fir-trees. Mater. Charact. 2017, 132, 53–68. [Google Scholar] [CrossRef]
- Azadian, S.; Wei, L.Y.; Warren, R. Delta phase precipitation in Inconel 718. Mater. Charact. 2004, 53, 7–16. [Google Scholar] [CrossRef]
- Li, R.B.; Yao, M.; Liu, W.C.; He, X.C. Isolation and determination for δ, γ′ and γ″ phases in Inconel 718 alloy. Scr. Mater. 2002, 46, 635–638. [Google Scholar] [CrossRef]
- Zhang, H.; Li, C.; Guo, Q.; Ma, Z.; Huang, Y.; Li, H.; Liu, Y. Hot tensile behavior of cold-rolled Inconel 718 alloy at 650 °C: The role of δ phase. Mater. Sci. Eng. A 2018, 722, 136–146. [Google Scholar] [CrossRef]
- Amanov, A.; Pyun, Y.S.; Kim, J.H.; Suh, C.M.; Cho, I.S.; Kim, H.D.; Wang, Q.; Khan, M.K. Ultrasonic fatigue performance of high temperature structural material Inconel 718 alloys at high temperature after UNSM treatment. Fatigue Fract. Eng. Mater. Struct. 2015, 38, 1266–1273. [Google Scholar] [CrossRef]
- Campos-Silva, I.; Contla-Pacheco, A.D.; Figueroa-López, U.; Martínez-Trinidad, J.; Garduño-Alva, A.; Ortega-Avilés, M. Sliding wear resistance of nickel boride layers on an Inconel 718 superalloy. Surf. Coat. Technol. 2019, 124862. [Google Scholar] [CrossRef]
- Zhang, H.; Li, C.; Liu, Y.; Guo, Q.; Huang, Y.; Li, H.; Yu, J. Effect of hot deformation on γ″ and δ phase precipitation of Inconel 718 alloy during deformation&isothermal treatment. J. Alloys Compd. 2017, 716, 65–72. [Google Scholar]
- Jelvani, S.; Shoja Razavi, R.; Barekat, M.; Dehnavi, M.R.; Erfanmanesh, M. Evaluation of solidification and microstructure in laser cladding Inconel 718 superalloy. Opt. Laser Technol. 2019, 120, 105761. [Google Scholar] [CrossRef]
- Kulkarni, A.; Dwivedi, D.K.; Vasudevan, M. Dissimilar metal welding of P91 steel-AISI 316L SS with Incoloy 800 and Inconel 600 interlayers by using activated TIG welding process and its effect on the microstructure and mechanical properties. J. Mater. Process. Technol. 2019, 274, 116280. [Google Scholar] [CrossRef]
- Kañetas, P.J.P.; Osorio, L.A.R.; Mata, M.P.G.; La Garza, M.D.; López, V.P. Influence of the delta phase in the microstructure of the Inconel 718 subjected to “Delta-processing” heat treatment and hot deformed. Procedia Mater. Sci. 2015, 8, 1160–1165. [Google Scholar] [CrossRef] [Green Version]
- Rafiei, M.; Mirzadeh, H.; Malekan, M. Micro-mechanisms and precipitation kinetics of delta (δ) phase in Inconel 718 superalloy during aging. J. Alloys Compd. 2019, 795, 207–212. [Google Scholar] [CrossRef]
- Anderson, M.; Thielin, A.L.; Bridier, F.; Bocher, P.; Savoie, J. δ Phase precipitation in Inconel 718 and associated mechanical properties. Mater. Sci. Eng. A 2017, 679, 48–55. [Google Scholar] [CrossRef]
- Gao, Y.; Zhang, D.; Cao, M.; Chen, R.; Feng, Z.; Poprawe, R.; Schleifenbaum, J.H.; Ziegler, S. Effect of δ phase on high temperature mechanical performances of Inconel 718 fabricated with SLM process. Mater. Sci. Eng. A 2019, 767, 138327. [Google Scholar] [CrossRef]
- Luo, S.; Huang, W.; Yang, H.; Yang, J.; Wang, Z.; Zeng, X. Microstructural evolution and corrosion behaviors of Inconel 718 alloy produced by selective laser melting following different heat treatments. Addit. Manuf. 2019, 30, 100875. [Google Scholar] [CrossRef]
- Gill, A.; Telang, A.; Mannava, S.R.; Qian, D.; Pyoun, Y.S.; Soyama, H.; Vasudevan, V.K. Comparison of mechanisms of advanced mechanical surface treatments in nickel-based superalloy. Mater. Sci. Eng. A 2013, 576, 346–355. [Google Scholar] [CrossRef]
- Bazarbayev, Y.; Kattoura, M.; Mao, K.S.; Song, J.; Vasudevan, V.K.; Wharry, J.P. Effects of corrosion-inhibiting surface treatments on irradiated microstructure development in Ni-base alloy 718. J. Nucl. Mater. 2018, 512, 276–287. [Google Scholar] [CrossRef]
- Amanov, A.; Pyun, Y.S. Local heat treatment with and without ultrasonic nanocrystal surface modification of Ti-6Al-4V alloy: Mechanical and tribological properties. Surf. Coat. Technol. 2017, 326, 343–354. [Google Scholar] [CrossRef]
- Kondavalasa, S.R.; Prakash, A.; Jagtap, R.; Shanmugam, S.; Samajdar, I.; Vasudevan, V.K.; Wilde, G. On the comparison of graded microstructures developed through high reduction (per pass) cold rolling (HRCR) and ultrasonic nanocrystal surface modification (UNSM) in nickel-base alloy 602CA. Mater. Charact. 2019, 153, 328–338. [Google Scholar] [CrossRef]
- Momeni, M.; Moayed, M.H.; Davoodi, A. Tuning DOS measuring parameters based on double-loop EPR in H2SO4 containing KSCN by Taguchi method. Corros. Sci. 2010, 52, 2653–2660. [Google Scholar] [CrossRef]
- Maday, M.F.; Mignone, A.; Vittori, M. The application of the electrochemical potentiokinetic reactivation method for detecting sensitization in Inconel 600. The influence of some testing parameters. Corros. Sci. 1988, 28, 887–900. [Google Scholar] [CrossRef]
- Aydoǧdu, G.H.; Aydinol, M.K. Determination of susceptibility to intergranular corrosion and electrochemical reactivation behaviour of AISI 316L type stainless steel. Corros. Sci. 2006, 48, 3565–3583. [Google Scholar] [CrossRef]
- Borello, A.; Mignone, A. Intergranular corrosion in alloy 800: Intercomparison between the Strauss test, the EPR method and magnetic permeability measurements. Br. Corros. J. 1982, 17, 176–183. [Google Scholar] [CrossRef]
- Majidi, A.P.; Streicher, M.A. Potentiodynamic reactivation method for detecting sensitization in AISI 304 and 304L stainless steels. Corrosion 1984, 40, 393–408. [Google Scholar] [CrossRef]
- Roelandt, A.; Vereecken, J. A modified electrochemical technique (electrochemical potentiokinetic reactivation) for evaluating the susceptibility of Inconel 600 to intergranular corrosion. Corrosion 1986, 42, 289–298. [Google Scholar] [CrossRef]
- Abe, S.; Kojima, M.; Hosoi, Y. Stress corrosion cracking susceptibility index, ISCC, of austenitic stainless steels in constant strain-rate test. In Stress Corrosion Cracking; Slow Strain-Rate Technique; Ugiansky, G.M., Payer, J.H., Eds.; ASTM International: West Conshohocken, PA, USA, 1979; pp. 294–304. [Google Scholar]
- Lo, K.H.; Kwok, C.T.; Chan, W.K. Characterisation of duplex stainless steel subjected to long-term annealing in the sigma phase formation temperature range by the DLEPR test. Corros. Sci. 2011, 53, 3697–3703. [Google Scholar] [CrossRef]
- Taiwade, R.; Shukla, R.; Vashishtha, H.; Ingle, A.; Dayal, R. Effect of grain size on degree of sensitization of chrome-manganese stainless steel. ISIJ Int. 2013, 53, 2206–2212. [Google Scholar] [CrossRef] [Green Version]
- ASTM G108-94, Standard Test Method for Electrochemical Reactivation (Epr) for Detecting Sensitization of Aisi Type 304 and 304l Stainless Steels; ASTM International: West Conshohocken, PA, USA, 2015.
- Wu, T.F.; Cheng, T.P.; Tsai, W.T. Effect of electrolyte composition on the electrochemical potentiokinetic reactivation behavior of alloy 600. J. Nucl. Mater. 2001, 295, 233–243. [Google Scholar] [CrossRef]
- Lim, Y.S.; Kim, H.P.; Han, J.H.; Kim, J.S.; Kwon, H.S. Influence of laser surface melting on the susceptibility to intergranular corrosion of sensitized alloy 600. Corros. Sci. 2001, 43, 1321–1335. [Google Scholar] [CrossRef]
- Telang, A.; Gill, A.S.; Kumar, M.; Teysseyre, S.; Qian, D.; Mannava, S.R.; Vasudevan, V.K. Iterative thermomechanical processing of alloy 600 for improved resistance to corrosion and stress corrosion cracking. Acta Mater. 2016, 113, 180–193. [Google Scholar] [CrossRef] [Green Version]
- Telang, A.; Gill, A.S.; Zweiacker, K.; Liu, C.; Wiezorek, J.M.K.; Vasudevan, V.K. Effect of thermo-mechanical processing on sensitization and corrosion in alloy 600 studied by SEM- and TEM-Based diffraction and orientation imaging techniques. J. Nucl. Mater. 2018, 505, 276–288. [Google Scholar] [CrossRef]
- Fang, X.Y.; Li, H.Q.; Wang, M.; Li, C.; Guo, Y.B. Characterization of texture and grain boundary character distributions of selective laser melted Inconel 625 alloy. Mater. Charact. 2018, 143, 182–190. [Google Scholar] [CrossRef]
- Shukla, A.; Patil, A.P. Effect of strain induced martensite reversal on the degree of sensitization of metastable austenitic stainless steel. Procedia Struct. Integr. 2019, 14, 259–264. [Google Scholar] [CrossRef]
- Shukla, S.; Patil, A.P.; Bansod, A.V.; Tandon, V. Effect of cold work and thermal ageing on corrosion and mechanical behavior of Cr-Mn ASS. Mater. Today Proc. 2018, 5, 17769–17777. [Google Scholar] [CrossRef]
- Liu, T.; Xia, S.; Du, D.; Bai, Q.; Zhang, L.; Lu, Y. Grain boundary engineering of large-size 316 stainless steel via warm-rolling for improving resistance to intergranular attack. Mater. Lett. 2019, 234, 201–204. [Google Scholar] [CrossRef]
- Amanov, A.; Umarov, R. The effects of ultrasonic nanocrystal surface modification temperature on the mechanical properties and fretting wear resistance of Inconel 690 alloy. Appl. Surf. Sci. 2018, 441, 515–529. [Google Scholar] [CrossRef]
- Loto, R.T. Comparative study of the pitting corrosion resistance, passivation behavior and metastable pitting activity of NO7718, NO7208 and 439L super alloys in chloride/sulphate media. J. Mater. Res. Technol. 2019, 8, 623–629. [Google Scholar] [CrossRef]
- ASTM E112-13, Standard Test Methods for Determining Average Grain Size; ASTM International: West Conshohocken, PA, USA, 2013.
- Kurzynowski, T.; Smolina, I.; Kobiela, K.; Kuźnicka, B.; Chlebus, E. Wear and corrosion behaviour of Inconel 718 laser surface alloyed with rhenium. Mater. Des. 2017, 132, 349–359. [Google Scholar] [CrossRef]
- Stansbury, E.E.; Buchanan, R.A. Relationship of individual anodic and cathodic polarization curves to experimentally measured curves. In Fundamentals Electrochemical Corrosion, 1st ed.; Stansbury, E.E., Buchanan, R.A., Eds.; ASM international: Materials Park, OH, USA, 2000; pp. 199–201. [Google Scholar]
- Ahn, M.K.; Kwon, H.S.; Lee, J.H. Predicting susceptibility of alloy 600 to intergranular stress corrosion cracking using a modified electrochemical potentiokinetic reactivation test. Corros. Sci. 1995, 51, 441–449. [Google Scholar] [CrossRef]
- Yu, G.P.; Yao, H.C. The relation between the resistance of IGA and IGSCC and the chromium depletion of alloy 690. Corrosion 1990, 46, 391–402. [Google Scholar] [CrossRef]
- Jambor, M.; Bokuvka, O.; Novy, F.; Trško, L.; Belan, J. Phase transformations in nickel base superalloy Inconel 718 during cyclic loading at high temperature. Prod. Eng. Arch. 2017, 15, 15–18. [Google Scholar] [CrossRef]
- Chandler, H. Heat Treater’s Guide: Practices and Procedures for Nonferrous Alloys, 1st ed.; Chandler, H., Ed.; ASM international: Materials Park, OH, USA, 1996; p. 48. [Google Scholar]
- Kattoura, M.; Telang, A.; Mannava, S.R.; Qian, D.; Vasudevan, V.K. Effect of ultrasonic nanocrystal surface modification on residual stress, microstructure and fatigue behavior of ATI 718Plus alloy. Mater. Sci. Eng. A. 2018, 711, 364–377. [Google Scholar] [CrossRef]
- Vanderesse, N.; Anderson, M.; Bridier, F.; Bocher, P. Inter- and intragranular delta phase quantitative characterization in Inconel 718 by means of image analysis. J. Microsc. 2016, 261, 79–87. [Google Scholar] [CrossRef]
- Nabavi, B.; Goodarzi, M.; Khan, A.K. Metallurgical effects of nitrogen on the microstructure and hot corrosion behavior of alloy 718 weldment. Mater. Charact. 2019, 157, 109916. [Google Scholar] [CrossRef]
- Niang, A.; Viguier, B.; Lacaze, J. Some features of anisothermal solid-state transformations in alloy 718. Mater. Charact. 2010, 61, 525–534. [Google Scholar] [CrossRef] [Green Version]
- ASTM E562-19, Standard Test Method for Determining Volume Fraction by Systematic Manual Point Count; ASTM International: West Conshohocken, PA, USA, 2019.
- Liu, W.C.; Yao, M.; Chen, Z.L.; Wang, S.G. Niobium segregation in Inconel 718. J. Mater. Sci. 1999, 34, 2583–2586. [Google Scholar] [CrossRef]
- Anbarasan, N.; Gupta, B.K.; Prakash, S.; Muthukumar, P.; Oyyaravelu, R.; Kumar, R.J.F.; Jerome, S. Effect of heat treatment on the microstructure and mechanical properties of Inconel 718. Mater. Today Proc. 2018, 5, 7716–7724. [Google Scholar] [CrossRef]
- Ramkumar, K.D.; Abraham, W.S.; Viyash, V.; Arivazhagan, N.; Rabel, A.M. Investigations on the microstructure, tensile strength and high temperature corrosion behaviour of Inconel 625 and Inconel 718 dissimilar joints. J. Manuf. Process. 2017, 25, 306–322. [Google Scholar] [CrossRef]
Figure 1.
Cyclic potentiodynamic polarization (CPP) curves of each sample in 3.5 wt.% NaCl.

Figure 2.
DL−EPR (double loop electrochemical potentiokinetic reactivation) plot for Inconel 718 annealed at 675 °C for 2 h, sample I1.
Figure 2.
DL−EPR (double loop electrochemical potentiokinetic reactivation) plot for Inconel 718 annealed at 675 °C for 2 h, sample I1.

Figure 3.
DL−EPR plot for Inconel 718 annealed at 1000 °C for 10 min and water quenched, reapeated three times each, sample I2.
Figure 3.
DL−EPR plot for Inconel 718 annealed at 1000 °C for 10 min and water quenched, reapeated three times each, sample I2.

Figure 4.
DL−EPR plot for Inconel 718 treated with UNSM × 3, sample I3.

Figure 5.
DL−EPR plot of UNSM treated Inconel 718 annealed at 1000 °C for 10 min and water quenched, repeated three times each, Sample I4.
Figure 5.
DL−EPR plot of UNSM treated Inconel 718 annealed at 1000 °C for 10 min and water quenched, repeated three times each, Sample I4.

Figure 6.
Schematic of the different microstructure as a result of the thermal and UNSM processing of Inconel 718: (a) As-received sample, (b) I1 sample, (c) I2 sample, (d) I3 sample and, (e) I4 sample.
Figure 6.
Schematic of the different microstructure as a result of the thermal and UNSM processing of Inconel 718: (a) As-received sample, (b) I1 sample, (c) I2 sample, (d) I3 sample and, (e) I4 sample.

Figure 7.
Optical microscope images showing the cross-section microstructure of Inconel 718: (a) As-received sample (×10), (b) I1 sample (×10), (c) I2 sample (×10), (d) I3 sample (×10), (e) I4 sample (×10) and, (f) I4 UNSM region (×50).
Figure 7.
Optical microscope images showing the cross-section microstructure of Inconel 718: (a) As-received sample (×10), (b) I1 sample (×10), (c) I2 sample (×10), (d) I3 sample (×10), (e) I4 sample (×10) and, (f) I4 UNSM region (×50).

Figure 8.
SEM (scanning electron microscopy) images showing the cross-section microstructure of Inconel 718: (a) As-received sample (×600), (b) I1 sample (×600), (c) I2 sample (×600), (d) I3 sample (×600) and, (e) I4 sample (×600).
Figure 8.
SEM (scanning electron microscopy) images showing the cross-section microstructure of Inconel 718: (a) As-received sample (×600), (b) I1 sample (×600), (c) I2 sample (×600), (d) I3 sample (×600) and, (e) I4 sample (×600).

Figure 9.
SEM images showing the area close to the treated surface of Inconel 718: (a) As-received sample (×2000); (b) I1 sample (×2000); (c) I2 sample (×2000); (d) I3 sample (×2000); (e) I4 sample (×2000).
Figure 9.
SEM images showing the area close to the treated surface of Inconel 718: (a) As-received sample (×2000); (b) I1 sample (×2000); (c) I2 sample (×2000); (d) I3 sample (×2000); (e) I4 sample (×2000).

Figure 10.
XRD (X-ray diffraction) patterns for Inconel 718 samples with different thermal and/or UNSM treatments.
Figure 10.
XRD (X-ray diffraction) patterns for Inconel 718 samples with different thermal and/or UNSM treatments.


Table 1.
Chemical composition of Inconel 718 (wt.%).
| Element | Al | C | Cr | Fe | Mo | Nb | Ni | Ti |
|---|---|---|---|---|---|---|---|---|
| Content (wt.%). | 0.2−1 | 0.1 | 17−21 | Bal. | 2.8−3.3 | 4.6−5.75 | 50−55 | 0.3−1.3 |
Table 2.
UNSM (ultrasonic nanocrystal surface modification) and thermal processing details of Inconel 718.
Table 2.
UNSM (ultrasonic nanocrystal surface modification) and thermal processing details of Inconel 718.
| Sample | Treatment |
|---|---|
| I1 | Annealed at 675 °C for 2 h |
| I2 | Annealed at 1000 °C for 10 min, water quenched, repeated 3 times |
| I3 | UNSM treated, repeated 3 times |
| I4 | UNSM treated and annealed at 1000 °C for 10 min, water quenched, 3 times |
Table 3.
Ecorr and icorr values from the cyclic potentiodinamic polarization (CPP) curves of each sample.
Table 3.
Ecorr and icorr values from the cyclic potentiodinamic polarization (CPP) curves of each sample.
| Samples | Ecorr, mVSCE | icorr, μA/cm2 |
|---|---|---|
| I1 | −535 | 5.51 |
| I2 | −484 | 3.83 |
| I3 | −625 | 2.37 |
| I4 | −602 | 4.54 |
Table 4.
Degree of sensitization values for the different thermo-mechanically treated samples of Inconel 718, DOS = ().
Table 4.
Degree of sensitization values for the different thermo-mechanically treated samples of Inconel 718, DOS = ().
| Samples | ir, mA/cm2 | ia, mA/cm2 | DOS, % | Standard Deviation |
|---|---|---|---|---|
| I1 | 0.08 | 0.51 | 15.7 | 2.1 |
| I2 | - | - | - | - |
| I3 | 75.7 | 126.9 | 59.6 | 4.5 |
| I4 | 2.5 | 6.1 | 40.9 | 3.4 |
Table 5.
δ phase area and volume fraction coverage for Samples I2 and I4.
| Region | δ phase Area Fraction, % | Standard Deviation | δ phase Volume Fraction, % | Standard Deviation |
|---|---|---|---|---|
| Sample I2 | ||||
| Bulk | 3.94 | 0.55 | 4.15 | 0.23 |
| Sample I4 | ||||
| Bulk | 4.09 | 0.47 | 4.25 | 0.29 |
| UNSM | 9.87 | 1.53 | 10.15 | 1.18 |
© 2020 by the authors. Licensee MDPI, Basel, Switzerland. This article is an open access article distributed under the terms and conditions of the Creative Commons Attribution (CC BY) license (http://creativecommons.org/licenses/by/4.0/).
Share and Cite
MDPI and ACS Style
Martin, U.; Ress, J.; Bosch, J.; Bastidas, D.M. Evaluation of the DOS by DL−EPR of UNSM Processed Inconel 718. Metals 2020, 10, 204. https://doi.org/10.3390/met10020204
AMA Style
Martin U, Ress J, Bosch J, Bastidas DM. Evaluation of the DOS by DL−EPR of UNSM Processed Inconel 718. Metals. 2020; 10(2):204. https://doi.org/10.3390/met10020204
Chicago/Turabian StyleMartin, Ulises, Jacob Ress, Juan Bosch, and David M. Bastidas. 2020. "Evaluation of the DOS by DL−EPR of UNSM Processed Inconel 718" Metals 10, no. 2: 204. https://doi.org/10.3390/met10020204
Note that from the first issue of 2016, this journal uses article numbers instead of page numbers. See further details here.