Amorphous-Nanocrystalline Composites Prepared by High-Pressure Torsion


1
Scientific Center of Metal Science and Metal Physics, Bardin Central Research Institute of Ferrous Metallurgy, 105005 Moscow, Russia
2
Department of Physical Materials, National University of Science and Technology “MISIS”, 119049 Moscow, Russia
*
Author to whom correspondence should be addressed.
Metals 2020, 10(4), 511; https://doi.org/10.3390/met10040511
Submission received: 23 February 2020
/
Revised: 10 April 2020
/
Accepted: 14 April 2020
/
Published: 15 April 2020
(This article belongs to the Special Issue Recent Advancements in Metallic Glasses)
Abstract
:This article presents systematic studies of the preparation method and the specific features of the changes in the structure and properties of amorphous-nanocrystalline composites formed from melt-quenched ribbons of iron- and cobalt-based amorphous alloys and the Cu-Nb crystalline nanolaminates by severe plastic deformation by torsion in the Bridgeman chamber at high quasi-hydrostatic pressure.

1. Introduction
The development of the basic principles for creating new composite materials is undoubtedly an important task of modern materials science. The demand for such materials is due to the possibility of combining enhanced mechanical properties (strength, wear resistance, crack resistance, stiffness, heat resistance and fatigue limit) [1,2,3].
Along with natural composites (mollusk shells, bones, wood), there are man-made artificial composites based on polymer, metal and ceramic matrices reinforced with fibers or filled with disperse particles. Such variety allows one to permanently expand the application field for composite materials.
Comprehensive studies have shown that enhanced mechanical properties can be achieved in multilayer composite systems consisting of amorphous and crystalline materials [4,5,6,7,8,9]. In addition, metallic materials with discrete structure constituents of nanoscale range can combine increased ductility with sufficiently high strength characteristics. This differs amorphous-nanocrystalline composites and advanced nanocrystalline materials from conventional structural materials produced by conventional technologies. Moreover, the controlled transformation of amorphous into nanocrystalline state makes it possible to successfully manage the functional properties of amorphous-nanocrystalline composites [10,11,12,13]. There is a well-known Ulitovsky-Taylor method for manufacturing one-dimensional composite material consisting of a high-strength magnetically soft metal base with an amorphous and/or nanocrystalline structure and an outer glass shell [14,15]. Another way to obtain amorphous-nanocrystalline composites is to decrease the critical rate of melt cooling upon manufacture of amorphous alloys (AA) by melt spinning method [16]. Heat treatment of AA at controlled temperature and time parameters initiates the nucleation and growth of nanocrystals, i.e., the formation of a composite material with an amorphous matrix [17,18,19]. It is possible to modify the AA surface by laser for the manufacture of “sandwich” amorphous-nanocrystalline composites and gradient structures with amorphous-nanocrystalline components [20,21,22]. The composite consisting of an amorphous phase with a nanocrystalline filler can surpass fully amorphous or fully crystalline analogs in the combination of properties [23,24,25,26].
As is known, high-pressure torsion (HPT) allows one to create new structure states by the consolidation of small fractions, due to the occurrence of the “crystalline-amorphous” phase transitions in the material [27,28,29]. In the framework of the present work, the idea arose to use the possibilities of severe plastic deformation (SPD) in a Bridgman chamber for the preparation of layered amorphous-nanocrystalline composites. We used two fundamentally different methodological techniques (Figure 1):
(1) HPT consolidation of AA melt spun ribbons differing in chemical compositions and mechanical properties [30];
(2) the use of Bridgman chamber for deformation processing of nanocrystalline Cu-Nb laminates prepared by multiple pack rolling (MPR) [31].
AA, due to the presence of a homogeneous structure and the absence of defects (dislocations and grain boundaries), demonstrate a higher level of mechanical properties that exceeds the level of properties achieved in the crystalline alloys. However, these materials have a serious flaw—the absence of tensile plasticity and low plastic deformation under compressive loads—which makes them prone to brittle fracture, and, accordingly, greatly limits their possible application. Structure changing during crystallization is an important aspect of AA research, since one of the ways to increase the ductility of AA is the formation of composite structure “glass-crystal”.
Ternary AA of the Fe-Ni-B system (for example, Fe58Ni25B17, Fe53.3Ni26.5B20.2, Fe50Ni33B17) are model alloys. External actions on the Fe-Ni-B AA cause precipitation of a Fe-Ni nanocrystalline phase, which can vary in crystal lattice types (BCC, FCC) depending on the ratio between the iron and nickel concentrations. Thus, it possible to establish the effect of the type crystal lattice of nanocrystals on the mechanical behavior of materials with an amorphous-nanocrystalline structure. In addition, partial crystallization can favor changes in their soft magnetic characteristics.
The Co-Fe-Cr-Si-B AA is related to corrosion resistant materials and exhibits a high electrical resistivity, low magnetization-reversal loss over a wide frequency range, low coercive force and resistance to impacts and vibrations. The high-cobalt amorphous alloys are characterized by near-zero saturation magnetostriction (λs ≤ 10−7) and very high magnetic permeability. For this reason, such AA show promise as materials for magnetic shields [23].
Multilayer Cu-Nb laminates with nanoscale layer thicknesses are typical representatives of nanostructured composite materials with a unique combination of properties: good ductility, high electrical conductivity of copper and superconductivity of niobium. The combination of the copper-niobium system is demanded, and is actively used in the manufacture of microwires in resonant power transmission systems, inductors for magnetic pulse stamping and welding, foils in electronics for flexible printed circuits; in large magnetic systems at 50–100 T and in high-field cryogenic synchronizers of industrial frequency.
2. Materials and Methods
In the first case, the Fe53.3Ni26.5B20.2 and Co28.2Fe38.9Cr15.4Si0.3B17.2 (at. %) melt quenched AA ribbons 25 μm thick were taken as objects of the study and composite constituents (Figure 1b). The total thickness of the initial sample (before HPT), consisting of 4 alternating layers of ribbons of AA, was 100 μm, respectively.
In this case, SPD was performed by HPT (P = 6 GPa, ν = 1 rpm) in a Bridgman chamber to different degrees of deformation preset by varying the number of revolutions (N) of rotating anvil from 1/2 to 9. Before HPT, the AA ribbons were cut into fragments 1 cm × 1 cm in size, and then the fragments were piled in groups of four and deformed in the Bridgman chamber to a given number of revolutions. Ethanol was applied to the degreasing of the ribbons surface before the HPT. In such a way, the deformation-induced disk samples were formed from each alloy and similar composite samples were formed from alternating Fe53.3Ni26.5B20.2 and Co28.2Fe38.9Cr15.4Si0.3B17.2 AA layers. The amorphous and crystalline phases in the alloys and composites were identified by transmission electron microscopy (TEM) with a JEM 1400 microscope (Jeol Ltd., Tokyo, Japan) at an accelerating voltage of 120 kV and by X-ray diffraction (XRD) analysis with an Ultima IV multifunctional diffractometer (Rigaku Corp, Tokyo, Japan) with CoKα radiation. The microhardness of the disk samples was measured at 1/2 radius by indentation with a Vickers pyramid using a MHT-3M microhardness tester (Lomo, St. Petersburg, Russia) at a load of 0.40 N by a standard technique. K1c values were calculated by the formula:
where A = 0.016 is the calibration coefficient of proportionality for thin ribbons of amorphous alloys; E is Young’s modulus measured by dynamic indentation methods; HV is Vickers microhardness; P is the critical load for the appearance of radial cracks in the process of local loading of samples of amorphous alloys; C is the average length of cracks [32,33]. The indentation of amorphous alloys was carried out only in the plane of the sample.
The magnetic properties were measured at room temperature in fields of up to 20 kOe with a VSM 250 vibrating-sample magnetometer (Xiamen Dexing Magnet Tech. Co., Ltd., Xiamen, China). Measured hysteresis loops were used to determine the saturation magnetization (σs) and the coercive force (Hc).
In the second case, the initial Cu-Nb nanolaminates (Figure 1c) were produced by a series of the following sequential operations making up technological cycle of the MPR process [34,35]: assembling a pack with a given number of layers, rolling of the pack in vacuum at a temperature of 750–800 °C, and then cold rolling in air to a thickness equal to that of a single initial layer of the composite. This procedure is more efficient than that reported in [36,37]. In addition, the holding time of the compacted pack at high temperature within this technological scheme is much shorter than that is in the case of diffusion welding. The initial plates of 50 mm × 100 mm in area and 0.35 mm thick were assembled into a pack of 32 alternating copper and niobium layers. The total degrees of reduction were 40% upon vacuum rolling and 10% upon cold rolling.
The prepared nanolaminates were subjected to HPT in Bridgman anvils at P = 4 GPa to 1/2–4 revolutions. Before HPT, the samples were cut to fragments of 1 cm × 1 cm in area. The thickness of the Cu-Nb laminate samples (before HPT) was 200 μm (Figure 1c).
The structure changes in the samples were examined by the methods of transmission electron microscopy (TEM) and scanning electron microscopy (SEM) with a JEM 2100 microscope (Jeol Ltd., Tokyo, Japan) equipped with a BSE detector. The chemical composition of the elements and their distribution in the specimens subjected to SPD were determined by the methods of bright-field and dark-field scanning transmission electron microscopy (BF-STEM/DF-STEM) and energy dispersive X-ray spectroscopy (EDS) with a JEM ARM-200F cold-emission microscope (Jeol Ltd., Tokyo, Japan) equipped with a CENTURIO EDX E-Max EDS detector (Jeol Ltd., Tokyo, Japan). The foils for the high-resolution electron-microscopic examinations were prepared from cross-section samples by a standard procedure [38]. The XRD spectra were obtained with an Ultima IV multifunction diffractometer (Rigaku Corp, Tokyo, Japan), using copper emission and a Kβ filter (Ni). The Vickers hardness was measured in the half-radius region of consolidated disk-shaped specimens using a standard procedure with a microhardness tester in three dimensions (3D). For this purpose, the disk-shaped nanocomposite samples were cut in four equal segments, and their flat surfaces and two orthogonally related butt-ends after polishing were subjected to indentation.
3. Results and Discussion
3.1. Amorphous-Nanocrystalline Composites Prepared by Consolidation of Two Amorphous Alloys upon HPT
At the initial SPD stages, the consolidation of AA ribbon samples of the same composition, Fe53.3Ni26.5B20.2 or Co28.2Fe38.9Cr15.4Si0.3B17.2, is difficult because of weak adhesion between the layers. Monolithic samples without delamination into individual ribbon components were obtained only after HPT to N = 3 revolutions. By contrast, the composites consisting of alternating Fe53.3Ni26.5B20.2 and Co28.2Fe38.9Cr15.4Si0.3B17.2 AA ribbons exhibit adequate adhesiveness of the layers starting from N = 1.
According to the XRD data for the Fe53.3Ni26.5B20.2 AA, no clear changes (except for a decrease in the intensity of peak corresponding to the first halo) in the XRD patterns are observed as the number of revolution increases (Figure 2a). The Co28.2Fe38.9Cr15.4Si0.3B17.2 AA subjected to HPT to N = 2 exhibits the onset of crystallization (Figure 2b), where the volume fraction of crystalline phase is Vcr ≈ 10%. The crystallite peaks disappear at N = 3 and appear again at N = 5, at which Vcr ≈ 16%.
Figure 2c shows the XRD patterns for the composites subjected to HPT. At N = 2, the peak intensity corresponding to the first halo substantially decreases. With an increasing degree of deformation, the composites undergo a partial crystallization. The volume fraction of crystalline phase decreases at N = 4; Vcr ≈ 18%, 9% and 19% at N = 3, 4 and 5, respectively. Thus, up to N = 5, we failed to transfer the alloys and the composites into a completely nanocrystalline state. More intense crystallization was detected at higher degrees of deformation (N = 7–9) (Figure 2).
To refine the phase transformations, and to identify the formed crystal structures, we supplemented the XRD data by TEM examination results. The TEM data confirmed that the Fe53.3Ni26.5B20.2 and Co28.2Fe38.9Cr15.4Si0.3B17.2 AA remain completely amorphous at low degree of deformation.
First nanocrystals appear in the amorphous phase in the Fe53.3Ni26.5B20.2 AA at N = 3 at the edge of the disk samples (Figure 3a). Such crystals correspond to α-Fe (Im3m, a = b = c = 0.2857 nm). At the late stages of deformation, the volume fraction of the crystalline phase substantially increases (Figure 3b), and the Fe2B (I4/mcm, a = b = 0.5099 nm, c = 0.4240 nm) and FeB (Pnma, a = 0.4053 nm, b = 0.5495 nm, c = 0.2946 nm) boride precipitates are also observed. The nanocrystallite size is 10–40 nm.
The first evidences of crystallization in the Co28.2Fe38.9Cr15.4Si0.3B17.2 AA are observed at N = 2; local signs are also observed at the edge of the samples (Figure 4). The extended and coarse-grained phases precipitated from the amorphous matrix were identified as α-Fe with BCC crystal lattice (Figure 4a) and α-Co with HCP lattice (Figure 4b).
With increasing degree of deformation (N ≥ 3), Vcr of fine crystalline phase in Co28.2Fe38.9Cr15.4Si0.3B17.2 AA increases from the center of the sample to its periphery. Deformation to N ≥ 7 leads to the formation of homogeneous structure throughout the sample. The nanocrystal size (5–25 nm) in the Co28.2Fe38.9Cr15.4Si0.3B17.2 AA is unchanged upon deformation to N = 4–9. The crystalline particles correspond to α-Co (P64/mmc(A3), a = b = 0.2514 nm, c = 0.4105 nm) and the Fe2B and FeB borides. The deformation-induced composites prepared from the Fe-Ni-B and Co-Fe-Cr-Si-B AA layer-by-layer packets at N = 2 exhibit the following specific feature, which is similar to that of the Co28.2Fe38.9Cr15.4Si0.3B17.2 AA: coarse-grained crystalline areas are observed at 1/2 radius of the disk samples. Similar grains are formed in the case where the crystallization of the Co28.2Fe38.9Cr15.4Si0.3B17.2 AA occurs upon high-temperature annealing.
The shear bands (SB) observed in the composites formed by HPT up to N = 5 exhibit the occurrence of highly localized plastic deformation (Figure 5). The SB become thinner with increasing degree of deformation.
Because of the small size of the nanocrystals formed upon HPT, the priority mechanisms of their interaction with SB (in accordance with the classification proposed in earlier works [39,40]) are suggested to be the “absorption” mechanism, at which moving SB absorbs nanoparticles without changing the motion path in the amorphous matrix (Figure 5a), and the “accommodation” mechanism, at which meeting of SB with an elastically stressed nanocrystal initiates the exit of one or several secondary SB to the amorphous matrix (Figure 5b).
In composites, an increase in the degree of deformation increases the volume fraction of the nanocrystalline phase and decreases the nanocrystal size (Figure 6).
At N = 9, the composite passes into a completely nanocrystalline state (Figure 7). The precipitated phases were identified as BCC α-Fe, HCP α-Co and the Fe2B and Co2B borides.
After small deformation to N = 2, the microhardness HV of the composite decreases by 16% (Figure 8). The minimum HV of the Fe53.3Ni26.5B20.2 AA also corresponds to N = 2. The microhardness of the Co28.2Fe38.9Cr15.4Si0.3B17.2 AA decreases progressively over a wider strain range, and HVmin is reached at N = 5 (Figure 8). This effect can be related to the changes occurring upon HPT in the topological and chemical short-range orders before crystallization. Moreover, HPT initiates the formation of numerous SB in the amorphous matrix [41]. As is known, the presence of SB decreases the strength of AA and substantially facilitates plastic flow. We should also note an important role of migration processes and the redistribution of excess free volume regions near and inside SB.
Figure 8 shows a very interesting and important effect related to the fact that the average microhardness (strength) of the composite obtained by HPT to N > 4 (curve 3) exceeds microhardnesses of the individual components (curves 1 and 2), from which it is formed. If we follow the additivity rule, then microhardness of the composite should be between microhardnesses of its components. The observed synergic effect can be associated with the interdiffusion of the components of amorphous precursors upon HPT, and the formation of a new composition of amorphous or nanocrystalline state in the region of the interface between two amorphous layers. Such a new state can be anomalously hard in a fairly extended region of the contacting initial phases.
Preliminary studies demonstrated a plasticizing effect of heat treatment on the AA under consideration. The K1c parameter of the Fe53.3Ni26.5B20.2 and Co28.2Fe38.9Cr15.4Si0.3B17.2 AA increases at temperatures ranging from 425 °C to 445 °C and from 425 °C to 485 °C, respectively. With allowance for this result, the behavior of the K1c parameter after HPT was studied for both AA separately and for deformation-induced composites based on them (Figure 9). For plastic deformation values up to N = 2 revolutions, K1c may depend on the orientation of layers. At high degrees of plastic deformation by HPT, intensive mixing of the layers occurs and the K1c anisotropy will be leveled.
At low degrees of deformation, K1c of the Fe53.3Ni26.5B20.2 AA, Co28.2Fe38.9Cr15.4Si0.3B17.2 AA, and the composite increases by 5.6% with a maximum at N = 2, by 6% with a maximum at N = 3–4, and by 7.3% with a maximum at N = 4, respectively. Then, the crack resistance decreases for the composite and its individual components approximately by a factor of 1.3–1.4, relative to the initial levels. However, the comparison of K1c at N = 7–9 (Figure 9) and K1c at high temperatures corresponding to the complete crystallization of the initially amorphous alloys shows that the crack resistance of the nanocrystalline structure obtained by SPD is higher than that of the coarse-grained structure initiated by annealing. In addition, even at high degrees of deformation (N = 7–9), K1c of the samples remain comparable with those of zirconia “ceramic steel” or laminar (layered) alumina-zirconia laminar composites, characterized by K1c ranging between 9 and 15 MPa∙m1/2 [42].
The response of the magnetic characteristics of the materials after SPD has been studied. No significant effect of HPT on the specific saturation magnetization σs was noted for the Fe53.3Ni26.5B20.2 and Co28.2Fe38.9Cr15.4Si0.3B17.2 AA, and for the composite based on the AA. The change in σs does not exceed 2–3% in the entire strain range. Coercive force Hc as a more structure-sensitive characteristic nonmonotonically changes with increasing degree of deformation and exhibits a distinct maximum at N = 1 (Figure 10). For the Fe53.3Ni26.5B20.2 and Co28.2Fe38.9Cr15.4Si0.3B17.2 AA, the maximum Hc is higher than that of the initial state by a factor of 1.5–2. Further, Hc decreases to the levels slightly exceeding the initial ones and becomes stabilized with the retention of the soft magnetic state of the alloys (Figure 10).
The jumps of the coercive force at the initial stages of deformation can be associated with the processes of the delamination of the amorphous matrix, further clustering and, as a consequence, the accompanying changes in the exchange interaction between the ferromagnetic components. In addition, with increasing degree of deformation, the resulting SB can branch, due to the frontal formation of nanocrystals [23]. As a result, the additional local stresses generated in the structure of deformation-induced composites can affect the growth of the coercive force.
Thus, it is shown that SPD can be used as an effective method to create composites with improved properties by consolidating different AA ribbons.
3.2. Amorphous-Nanocrystalline Composites Prepared by HPT of Cu-Nb Nanolaminates
Multilayer nanolaminates consisting of non-miscible or partially mutually soluble metals with nanometer (about 10 nm) thickness of the layers of each component were first obtained by the method of magnetron deposition for the Cu-Nb system [43]. Currently, such composites are obtained by MPR of copper and niobium sheets [34,35,44,45]. The Cu-Nb nanolaminates are of interest for their special physical properties, such as high plasticity and electrical conductivity of copper combined with superconductivity of niobium.
The elasto-plastic properties (Young’s modulus, amplitude-independent decremen, and stress-strain diagram in the range of microplastic deformation) of the Cu-Nb nanolaminate were comprehensively studied in [46]. The analysis of the data on E, δ and σs before and after the action of high hydrostatic pressure (1 GPa) allowed us to assume that the nanolaminate samples contain discontinuities, which can be formed at the interfaces between the Cu and Nb layers upon MPR.
The Cu/Nb nanolaminates under the effect of severe deformation were studied in more detail in [47]. The steady-state solubility of Nb in Cu and Cu in Nb were found to reach ~1.5 at. % and ~10 at. %, respectively, in near-boundary areas, but no phase transformations, including amorphization, occur in the nanolaminate.
The energy anisotropy of the interface in a system of non-miscible elements was first studied in [48,49,50] by the example of molecular-dynamics simulation of Cu/Nb bicrystals. It was established that the mechanism of niobium dissolution in the copper matrix involves the formation of niobium clusters coherent with the matrix. Such coherent dissolution of non-miscible elements on the interface was noted in the literature for the Cu-Fe system upon mechanical alloying of components [51].
The observed [48,49,50] phenomenon of niobium cluster dissolution near the Cu/Nb interface of finite curvature is proposed as a physical explanation of the amorphization of such interface. Because of the lattice distortion by clusters, a sharp TEM image of the projection of close packed copper atom rows in the interface region disappears, and such regions are recognized as amorphous.
Our experiments have shown that the nanolaminates fabricated by MPR consist of about ten thousand Cu and Nb layers, which can vary in thickness from 100 to 300 nm. The electron microscopic data confirm the nanolayering of the Cu-Nb composite, as is illustrated in Figure 11. The layers have a wavy shape and sharp boundaries. In the image (Figure 11a) taken in backscattered electrons, the darker and lighter strips correspond to copper and niobium layers, respectively. Figure 11b shows the EDS data on multilayer mapping of elemental composition.
A noticeable thinning of nanolaminate layers is observed after SPD by HPT. After HPT to a degree of deformation of N = 2 turns, the layer thickness decreases approximately by a factor of two (Figure 12a), relative to the initial average layer thickness of ~200 nm (Figure 11). At higher degree of deformation (N = 4), the effect of layer thinning is amplified, and their integrity is destroyed (Figure 12b).
After HPT to N = 4, the areas are observed, in which the layers are mixed, and the structure is substantially refined, but the grains retain their initial preferred orientation. The average size of crystalline grains decreases to tens of nanometers. The ring reflections of the FCC copper structure and the BCC niobium structure are clearly observed in the SAED pattern.
Table 1 shows the calculations of the true deformation value upon the HPT of Cu-Nb-nanolaminates in the middle of the sample radius, corresponding to the number of revolutions according to the formula:
where r is the radius of the sample; h0 is the initial thickness of the sample; h is the final thickness of the sample; N is the number of full revolutions of the movable anvil.
If we conduct a comparative analysis of our Table 1 with data by Beyerlein I.J. et.al. [44], in our case, as a result of the HPT in the Bridgman anvils, to obtain nanolaminates with a layer thickness of 20 nm, the logarithmic true strain e = 6.83 is required, while accumulative roll bonding requires much large value: e = 11.51. However, it should be noted that such a comparison seems incorrect to us. The fact is that in our studies, we subjected to HPT the finished Cu-Nb composites obtained previously by the MPR method, which made it possible to reduce the layer thickness to 200 nm due to multi-stage accumulation of deformation. HPT is a subsequent and completely different SPD technology, which has a different loading MPR scheme, with a different stress condition of the sample, contributing to a further decrease in the layer thickness up to 20 nm. Thus, we are dealing with two stages of material processing. The true deformations of each of them are different from each other and are not subject to simple summation.
Typical high-resolution (HR) TEM images of the atomic structure of the samples after HPT are shown in Figure 13a–c. Also, the fast Fourier transform (FFT) of the HR TEM image was calculated (Figure 13d). In addition to the crystalline grains of 10–30 nm in size, areas with a characteristic contrast are observed in Figure 13a,b, which unambiguously indicates the appearance of amorphous phase of up to ~100 nm in size in the structure, after deformation by HPT to N = 4. The volume fraction of such areas does not exceed 5–10%. As a rule, they are elongated along the interface between Cu and Nb crystals. It can be seen that the crystalline regions 1,2,5,6 in Figure 13a,b according to the FFT analysis, have discrete point reflections from Cu or Nb, while the amorphous regions 3,4,7,8 are continuous rings—a diffuse halo in FFT diffractograms (Figure 13d). Figure 13c demonstrates a periodic banded contrast of the crystalline grain, which is in the reflecting position. This contrast represents the projections of the {110} planes onto the image plane. The direction of the incident electron beam coincides with the [111] direction. The BCC niobium and FCC copper structures have the same symmetry of atom projection onto the (111) plane. Therefore, it is difficult to determine what crystalline grain is in the observation field by the HR TEM image.
The X-ray mapping of element distributions (Cu, Nb) is carried out by the EDS method for the samples of Cu-Nb nanolaminate subjected to HPT (Figure 14). We note that the structure of the sample after HPT is formed by oriented alternating Cu and Nb grains, which are clearly seen in the BSE image and element distribution maps (Figure 14). The transverse thickness of the elongated grains varies from 4 to 40 nm. Thus, the mechanical treatment of the samples by HPT leads to the structure refinement almost by an order of magnitude. However, the general directionality (orientation) of the structure components is retained. Note that some niobium grains on the surface of the samples are enriched with oxygen.
In addition, substantial “mixing” is observed in copper and niobium layers. The boundaries of the layers lose their sharpness (Figure 15). As a consequence, regions with equal contents of the elements appear in the structure. The concept of “layer” is losing its original meaning. EDS mapping demonstrates the distribution of elements in the sample at a purely qualitative level.
The sequence of structural-phase transformations in the Cu-Nb nanolaminate after HPT was analyzed by XRD, along with TEM/STEM methods. The XRD spectra from the planes and the end faces of the samples before and after HPT in the Bridgman chamber are presented in Figure 16. The XDR intensities in Figure 16 are scaled linearly. With the aid of standard indexing procedures, we established that the experimental set of X-ray lines corresponds to copper (ICDD card No. 00-004-0836, Fm-3m, a = 0.3615 nm) and niobium (ICDD card No. 00-034-0370, Im-3m, a = 0.3303 nm).
Comparing the profiles of the spectra, we see that the intensity of the X-ray maxima after deformation decreases. This fact can be associated with the intense fragmentation of grains and the increase of the defect density. In addition, some maxima are “blurred”. This is a consequence of strain-induced amorphization processes beginning at N = 4, which are also revealed by the TEM studies (Figure 13a,b). Thus, the accumulation of deformation is accompanied by the degradation of the nanolaminite structure of the samples: the regularity of the layer alternation is disrupted, the layers become fragmented and curved, and the Cu/Nb system partially undergoes the transition from crystalline to amorphous state. As a prerequisite for the formation of a supersaturated solid solution during the HPT process, conditions can arise that are characterized by an inhomogeneous distribution of the components in the bulk of the material. Based on the fact that in the laminate there are areas with different concentrations of one of the components, this should partially change the lattice parameter and, accordingly, the position of the lines on the XRD spectra. The line will shift towards smaller angles if the volume is enriched in the second component. At the same time, the depletion of the remaining volume by this component causes a decrease in the parameter, and, therefore, should shift the diffraction line toward large angles. In a word, such heterogeneity is capable of causing some broadening of the lines of the XRD spectra. In Figure 16, the Cu (200) line shifts toward smaller angles by ~0.5 degrees 2θ with increasing strain during HPT. In the process of migration of the Cu/Nb interphase boundary is possible to incorporate of nanolamellas of one metal into another with the subsequent formation of isolated monatomic clusters. The crystal structure was distorted in cluster and lamella regions, which could be perceived as amorphization of the interphase boundary in studies by the methods of high-resolution microscopy [48].
The peaks at 35–38 and 63–69 degrees 2θ in Figure 16a may belong to tungsten carbide. Their appearance on the XRD spectra is due to the fact that Bridgman anvils heads are made of it. Accordingly, at large degrees of deformation, traces of WC can be observed on the surface of the deformed samples. When comparing the results, Figure 16b shows that when shooting at the end faces of the sample (at 35–38 and 63–69 degrees 2θ), no lines from the tungsten carbide phases are observed. A similar situation with the appearance of additional peaks in the Cu-Nb XDR spectra was observed in [52].
The appearance of an amorphous phase in the near-interface areas was first experimentally established in our investigation by the methods of direct-resolution TEM (Figure 13a,b) and XRD (Figure 16). This confirms the hypothesis [48,49,50] on the possibility of the clustered structure of the regions containing simultaneously copper and niobium atoms. In a rather detailed scientific work [47], no amorphous phases have been detected in the Cu-Nb nanolaminates after SPD, but nonequilibrium supersaturated solid solutions of Cu-Nb (up to 1.5 at. % Nb) and Nb-Cu (up to 10 at. % Cu) have been observed. The discrepancy between our results and the results of [47] could be caused by the fact that, because of somewhat different conditions of SPD in the Bridgman chamber, the supersaturated solid solutions in our case are less thermodynamically stable and undergo phase transition from crystalline (solid solution of Nb-Cu and/or Cu-Nb) to amorphous phase (Nb-Cu and/or Cu-Nb). It seems that, in our case, the following relation is satisfied:
where Uss and Uap are the free energies of nonequilibrium crystalline solid solutions and Cu-Nb and Nb-Cu amorphous phases, respectively. Relation (1) is fulfilled at concentrations of solid solutions above critical. Apparently, such supercritical concentrations of the dissolved component were achieved in our experiments, but were not achieved by the authors of [47].
Uss > Uap,
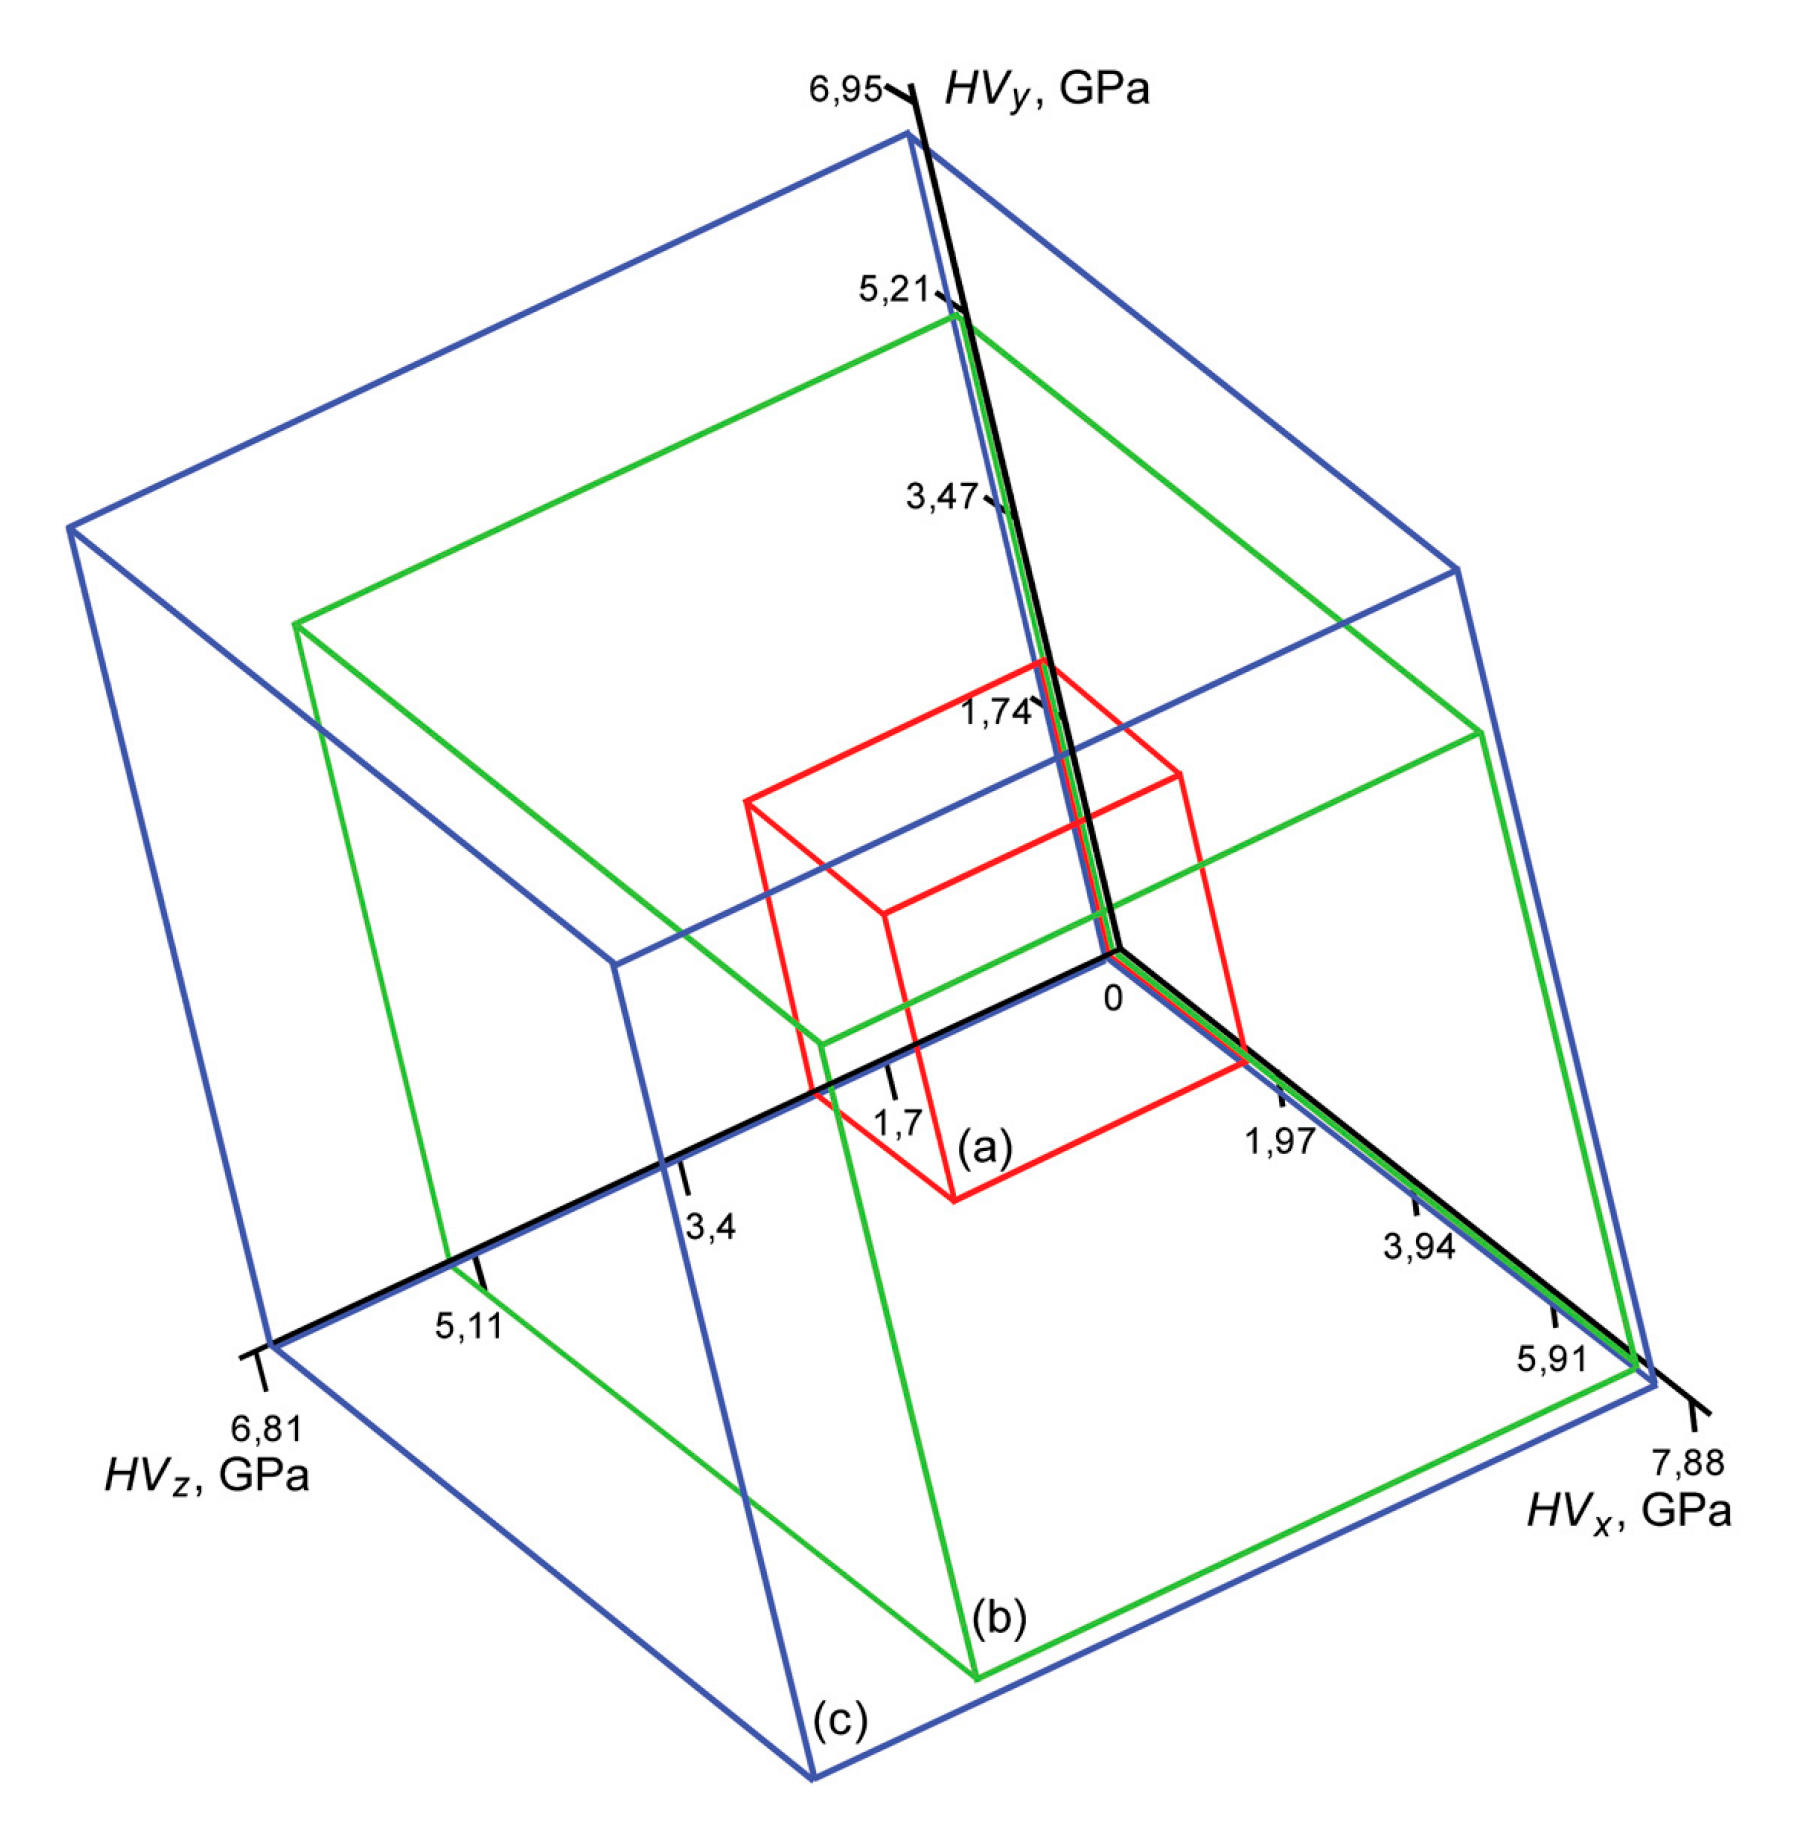
We established the pattern of the Vickers hardness variations in the Cu-Nb nanolaminate as a function of the degree of deformation (Figure 17).
The anisotropy of HV is observed in the initial samples before HPT. The indentation results show that the microhardness of two mutually perpendicular ends is somewhat higher (see the Y and Z axes in Figure 17) than HV of the planar surface of the disk samples (see the X axis). Figure 17a shows that the HV edges of red rectangular parallelepiped are unequal. As the degree of deformation increases, a significant growth in microhardness is observed in all directions (see green rectangular parallelepiped in Figure 17b). The maximum difference in the microhardness HV on the surface (along the X axis) and on the ends (along Y and Z axes) is observed at N = 2. In other words, a strengthening surface effect of the nanolaminates was found after HPT to N = 2. The transition from anisotropy to isotropy of microhardness (blue cube in Figure 17c with equal HV edges) is observed after HPT to N = 4.
Thus, we observe two stages of the strengthening of nanolaminates upon HPT. First, there is a noticeable increase in microhardness (strength) under conditions of remaining structural anisotropy caused by the initial plate-like shape of the structure constituents of the composite. Then, at the second stage, there is a transition to isotropic growth of HV, due to much more uniform volume distribution of Cu and Nb nanoparticles, which underwent significant transformations of size and shape (degradation of the nanolaminated structure) upon HPT. The jump-like increase in HV is caused by complex changes in the Cu-Nb nanolaminated structure as the degree of SPD increases, namely, the thinning of nanolayers, the appearance of regions of the amorphous phase and the amorphization-induced modification of the interphase interfaces of Cu and Nb nanocrystals.
4. Conclusions
- (1)
- For the first time, deformation-induced composites from alternating Fe-Ni-B and Co-Fe-Cr-Si-B AA layers were obtained by their consolidation upon HPT. It was found that the average microhardness of the composite obtained by HPT to N > 4 exceeds HV of its individual AA components, from which it is formed.
- (2)
- The degree of the structure refinement of the amorphous nanocrystalline composites obtained by SPD depends on the processing regime and on the nature of the starting materials. The HPT method allows one to obtain nanocrystals of up to 5–20 nm in size in amorphous matrix in the AA composites. In the Cu-Nb nanolaminates, the gradual refinement of the nanocrystalline structure can be accompanied by local amorphization and the retention of the general orientation of the structure constituents. The fact that an amorphous state is formed in Cu-Nb laminates during HPT requires further and more thorough investigation.
- (3)
- The phenomenon of increase in ductility (K1c increases by ~6%) of amorphous-nanocrystalline composites obtained by HPT of the Fe53.3Ni26.5B20.2 and Co28.2Fe38.9Cr15.4Si0.3B17.2 AA ribbons is established. SPD allows one to obtain strain-induced composites with satisfactory fracture toughness in combination with high hardness and high soft magnetic characteristics.
- (4)
- For the first time, the formation of regions with an amorphous structure directly related to interphase interfaces was experimentally found in Cu-Nb nanolaminates by TEM and XRD methods after a high degree of SPD (N = 4).
- (5)
- An increase in the degree of SPD by HPT increases strength of the Cu-Nb nanolaminates by a factor of three. A two-stage transition from the anisotropy of microhardness in the initial state to the isotropy of HV was detected at N = 4. Surface strengthening of the Cu-Nb nanolaminates is observed at N = 2; the difference between HV on the surface and in the volume is 29%.
Author Contributions
Conceptualization and Methodology, A.G. and I.P.; software, I.P.; validation, A.G. and I.P.; formal analysis, I.P.; investigation, A.G. and I.P.; resources, A.G.; data curation, I.P.; writing—original draft preparation, I.P.; writing—review and editing, A.G. and I.P.; visualization, I.P.; supervision and project administration, A.G.; funding acquisition, I.P. All authors have read and agreed to the published version of the manuscript.
Funding
The reported study was funded by RFBR, project numbers 17-02-00402 and 20-08-00341.
Acknowledgments
The authors are grateful to their colleagues, Michael Karpov, Victor Vnukov, Dmitry Shtansky, Igor Shchetinin, Michael Gorshenkov, Elena Savchenko and Elena Blinova for long-term fruitful cooperation.
Conflicts of Interest
The authors declare no conflict of interest.
References
- Matthews, F.L.; Rawlings, R.D. Composite Materials: Engineering and Science; CRS Press: Boca Raton, USA, 1999; ISBN 0-8493-0621-3. [Google Scholar]
- Gibson, R.F. Principles of Composite Material Mechanics, 4th ed.; CRC Press: Boca Raton, USA, 2016; ISBN 978-1-4987-2072-4. [Google Scholar]
- Strong, A.B. Fundamentals of Composites Manufacturing Materials, Methods and Applications, 2nd ed.; Society of Manufacturing Engineers: Dearborn, MI, USA, 2008; ISBN 978-0872638549. [Google Scholar]
- Barnett, S.A. Deposition and Mechanical Properties of Superlattice Thin Films. In Physics of Thin Films. Mechanic and Dielectric Properties. Advances in Research and Development; Francombe, M.H., Vossen, J.A., Eds.; Academic Press: New York, NY, USA, 1993; Volume 17, pp. 1–77. ISBN 978-0-1253-3017-6. [Google Scholar]
- Vepřek, S. The search for novel, superhard materials. J. Vac. Sci. Technol. A 1999, 17, 2401–2420. [Google Scholar] [CrossRef] [Green Version]
- Hovsepian, P.E.; Lewis, D.B.; Münz, W.-D. Recent progress in large scale manufacturing of multilayer/superlattice hard coatings. Surf. Coat. Technol. 2000, 133, 166–175. [Google Scholar] [CrossRef]
- Barnett, S.A.; Madan, A.; Kim, I.; Martin, K. Stability of nanometer-thick layers in hard coatings. MRS Bull. 2003, 28, 169–172. [Google Scholar] [CrossRef]
- Chung, Y.-W.; Sproul, W.D. Superhard coating materials. MRS Bull. 2003, 28, 164–168. [Google Scholar] [CrossRef] [Green Version]
- Münz, W.-D. Large-scale manufacturing of nanoscale multilayered hard coatings deposited by cathodic arc/unbalanced magnetron sputtering. MRS Bull. 2003, 28, 173–179. [Google Scholar] [CrossRef]
- Abrosimova, G.E. Evolution of the structure of amorphous alloys. Phys.-Usp. 2011, 54, 1227–1242. [Google Scholar] [CrossRef]
- Perrière, L.; Champion, Y. Phases distribution dependent strength in metallic glass-aluminium composites prepared by spark plasma sintering. Mater. Sci. Eng. A 2012, 548, 112–117. [Google Scholar] [CrossRef]
- Wang, Y.; Li, J.; Hamza, A.V.; Barbee, T.W. Ductile crystalline-amorphous nanolaminates. Proc. Natl. Acad. Sci. USA 2007, 104, 11155–11160. [Google Scholar] [CrossRef] [Green Version]
- Donohue, A.; Spaepen, F.; Hoagland, R.G.; Misra, A. Suppression of the shear band instability during plastic flow of nanometer-scale confined metallic glasses. Appl. Phys. Lett. 2007, 91, 241905. [Google Scholar] [CrossRef]
- Molokanov, V.V.; Chueva, T.R.; Umnov, P.P.; Simakov, S.V.; Shalygina, E.E. “Thick” amorphous wires in the Fe75Si10B15-Co75Si10B15-Ni75Si10B15 system: Fabrication, structure, properties. Inorg. Mater. Appl. Res. 2016, 7, 643–647. [Google Scholar] [CrossRef]
- Shalygina, E.E.; Umnova, N.V.; Umnov, P.P.; Molokanov, V.V.; Samsonova, V.V.; Shalygin, A.N.; Rozhnovskaya, A.A. Specific features of magnetic properties of “thick” microwires produced by the Ulitovsky-Taylor method. Phys. Solid State 2012, 54, 287–292. [Google Scholar] [CrossRef]
- Shelyakov, A.; Sitnikov, N.; Saakyan, S.; Menushenkov, A.; Korneev, A. Study of two-way shape memory behavior of amorphous-crystalline TiNiCu melt-spun ribbon. Mater. Sci. Forum 2013, 738–739, 352–356. [Google Scholar] [CrossRef]
- Glezer, A.M.; Manaenkov, S.E.; Permyakova, I.E.; Shurygina, N.A. Effect of nanocrystallization on the mechanical behavior of Fe-Ni-based amorphous alloys. Russ. Metal. 2011, 2011, 947–955. [Google Scholar] [CrossRef]
- Glezer, A.M.; Permyakova, I.E.; Shurygina, N.A.; Rassadina, T.V. Structural features of crystallization and hardening of amorphous alloy in the Fe-Cr-B system. Inorg. Mater. Appl. Res. 2012, 3, 23–27. [Google Scholar] [CrossRef]
- Shurygina, N.A.; Glezer, A.M.; Permyakova, I.E.; Blinova, E.N. Effect of nanocrystallization on the mechanical and magnetic properties of Finemet-type alloy (Fe78.5Si13.5B9Nb3Cu1). Bull. Russ. Acad. Sci. Phys. 2012, 76, 44–50. [Google Scholar] [CrossRef]
- Permyakova, I.E.; Glezer, A.M.; Ivanov, A.A.; Shelyakov, A.V. Application of laser design of amorphous FeCo-based alloys for the formation of amorphous-crystalline composites. Russ. Phys. J. 2016, 58, 1331–1338. [Google Scholar] [CrossRef]
- Mudry, S.I.; Nykyruy, Y.S.; Kulyk, Y.O.; Stotsko, Z.A. Influence of pulse laser irradiation on structure and mechanical properties of amorphous Fe73.1Nb3Cu1.0Si15.5B7.4 alloy. J. Achiev. Mater. Manufact. Eng. 2013, 61, 7–11. [Google Scholar]
- Sitnikov, N.N.; Shelyakov, A.V.; Khabibullina, I.A.; Borodako, K.A. Two-way shape memory effect in rapidly quenched highly doped alloys of TiNi-TiCu system upon laser treatment. Bull. Russ. Acad. Sci. Phys. 2018, 82, 1136–1142. [Google Scholar] [CrossRef]
- Glezer, A.M.; Permyakova, I.E. Melt-Quenched Nanocrystals; CRC Press: Boca Raton, FL, USA, 2013; ISBN 978-1-4665-9414-2. [Google Scholar]
- Glezer, A.M.; Shurygina, N.A. Amorphous-Nanocrystalline Alloys; CRC Press: Boca Raton, FL, USA, 2017; ISBN 978-1-1385-0237-6. [Google Scholar]
- Inoue, A.; Louzguine, D.V. Bulk Nanocrystalline and Nanocomposite Alloys Produced from Amorphous Phase. In Nanostructured Metals and Alloys. Processing, Microstructure, Mechanical Properties and Applications; Whang, S.H., Ed.; Woodhead Publishing Ltd.: Cambridge, UK, 2011; pp. 152–177. ISBN 978-1-84569-670-2. [Google Scholar]
- Wilde, G. Bulk Nanostructured Materials from Amorphous Solids. In Bulk Nanostructured Materials; Zehetbauer, M.J., Zhu, Y.T., Eds.; Wiley-VCH. Verlag GmbH & Co: Weinheim, Germany, 2009; pp. 293–310. ISBN 978-3-5273-1524-6. [Google Scholar]
- Glezer, A.M.; Kozlov, E.V.; Koneva, N.A.; Popova, N.A.; Kurzina, I.A. Plastic Deformation of Nanostructured Materials; CRC Press: Boca Raton, FL, USA, 2017; ISBN 978-1-1380-7789-8. [Google Scholar]
- Valiev, R.Z.; Zhilyaev, A.P.; Langdon, T.G. Bulk Nanostructured Materials: Fundamentals and Applications; John Wiley & Sons: Hoboken, NJ, USA, 2013; ISBN 978-1-118-09540-9. [Google Scholar]
- Glezer, A.M. Creation principles of new-generation multifunctional structural materials. Phys.-Usp. 2012, 55, 522–529. [Google Scholar] [CrossRef]
- Permyakova, I.E.; Blinova, E.N.; Shchetinin, I.V.; Savchenko, E.S. Amorphous-alloy-based composites prepared by high-pressure torsion. Russ. Metal. 2019, 2019, 994–1001. [Google Scholar] [CrossRef]
- Permyakova, I.E.; Glezer, A.M.; Karpov, M.I.; Vnukov, V.I.; Shtansky, D.V.; Gorshenkov, M.V.; Shchetinin, I.V. Structural amorphization and mechanical properties of nanolaminates of the cooper-niobium system during high-pressure torsion. Russ. Phys. J. 2018, 61, 428–438. [Google Scholar] [CrossRef]
- Glezer, A.M.; Permyakova, I.E.; Fedorov, V.A. Crack resistance and plasticity of amorphous alloys under microindentation. Bull. Russ. Acad. Sci. Phys. 2006, 70, 1599–1603. [Google Scholar]
- Glezer, A.M.; Permyakova, I.E.; Manaenkov, S.E. Plasticizing effect in the transition from an amorphous state to a nanocrystalline state. Dokl. Phys. 2008, 53, 8–10. [Google Scholar] [CrossRef]
- Karpov, M.I.; Gnessin, B.A.; Vnukov, V.I.; Medved, N.V.; Volkov, K.G. Texture and Mechanical Properties of the Bulk Multilayered Nb-Cu Composite. In Proceedings of the Intrernational Conference “Advanced Metallic Materials”, Smolenice Castle, Slovakia, 5–7 November 2003; Slovak Academy of Sciences: Bratislava, Slovakia, 2003; pp. 141–143. [Google Scholar]
- Karpov, M.I.; Vnukov, V.I.; Medved, N.V.; Volkov, K.G.; Khodos, I.I. Nanolaminate-Bulk Multilayered Nb-Cu Composite: Technology, Structure, Properties. In Proceedings of the 15-th International Plansee-Seminar, Reutte, Austria, 28 May–1 June 2001; Volume 4, pp. 97–107. [Google Scholar]
- Yasuna, K.; Tarauchi, M.; Otsuki, A.; Ishihara, K.N.; Shingu, P.H. Bulk metallic multilayers produced by repeated press-rolling and their perpendicular magnetoresistance. J. App. Phys. 1997, 82, 2435–2438. [Google Scholar] [CrossRef]
- Huang, B.; Ishihara, K.N.; Shingu, P.H. Bulk nano-scale Fe/Cu multilayers produced by repeated pressing-rolling and their magnetoresistance. J. Mater. Sci. Lett. 2000, 19, 1763–1765. [Google Scholar] [CrossRef]
- Shtansky, D.V.; Kaneko, K.; Ikuhara, Y.; Levashov, E.A. Characterization of nanostructured multiphase Ti-Al-B-N thin films with extremely small grain size. Surf. Coat. Technol. 2001, 148, 206–215. [Google Scholar] [CrossRef]
- Glezer, A.M.; Manaenkov, S.E.; Permyakova, I.E. Structural mechanisms of plastic deformation of amorphous alloys containing crystalline nanoparticles. Bull. Russ. Acad. Sci. Phys. 2007, 71, 1702–1707. [Google Scholar] [CrossRef]
- Glezer, A.M.; Shurygina, N.A.; Zaichenko, S.G.; Permyakova, I.E. Interaction of deformation shear bands with nanoparticles in amorphous-nanocrystalline alloys. Russ. Metall. 2013, 2013, 235–244. [Google Scholar] [CrossRef]
- Permyakova, I.E.; Glezer, A.M.; Grigorovich, K.V. Deformation behavior of amorphous Co-Fe-Cr-Si-B alloys in the initial stages of severe plastic deformation. Bull. Russ. Acad. Sci. Phys. 2014, 78, 996–1000. [Google Scholar] [CrossRef]
- Gogotsi, G.A. Fracture resistance of ceramics: Base diagram and R-line. Strength Mater. 2006, 38, 261–270. [Google Scholar] [CrossRef]
- Schuller, I.K. New class of layered materials. Phys. Rev. Lett. 1980, 44, 1597–1600. [Google Scholar] [CrossRef]
- Beyerlein, I.J.; Mara, N.A.; Carpenter, J.S.; Nizolek, T.; Mook, W.M.; Wynn, T.A.; McCabe, R.J.; Mayeur, J.R.; Kang, K.; Zheng, S.; et al. Interface-driven microstructure development and ultra-high strength of bulk nanostructured Cu-Nb multilayers fabricated by severe plastic deformation. J. Mater. Res. 2013, 28, 1799–1812. [Google Scholar] [CrossRef]
- Carpenter, J.S.; Vogel, S.C.; LeDonne, J.E.; Hammon, D.L.; Beyerlein, I.J.; Mara, N.A. Bulk texture evolution of Cu-Nb nanolamellar composites during accumulative roll bonding. Acta Mater. 2012, 60, 1576–1586. [Google Scholar] [CrossRef]
- Betekhtin, V.I.; Kolobov, Y.R.; Kardashev, B.K.; Golosov, E.V.; Narykova, M.V.; Kadomtsev, A.G.; Klimenko, D.N.; Karpov, M.I. Elasto-plastic properties of Cu-Nb nanolaminate. Tech. Phys. Lett. 2012, 38, 144–146. [Google Scholar] [CrossRef] [Green Version]
- Ekiz, E.H.; Lach, T.G.; Averback, R.S.; Mara, N.A.; Beyerlein, I.J.; Pouryazdan, M.; Hahn, H.; Bellon, P. Microstructural evolution of nanolayered Cu-Nb composites subjected to high-pressure torsion. Acta Mater. 2014, 72, 178–191. [Google Scholar] [CrossRef]
- Lipnitskii, A.G.; Nelasov, I.V.; Golosov, E.V.; Kolobov, Y.R.; Maradudin, D.N. A Molecular-dynamics simulation of grain-boundary diffusion of niobium and experimental investigation of its recrystallization in a niobium-copper system. Russ. Phys. J. 2013, 56, 330–337. [Google Scholar] [CrossRef]
- Lipnitskii, A.G.; Nelasov, I.V.; Klimenko, D.N.; Mapadudin, D.N.; Kolobov, Y.P. Moleculardynamical simulation of multilayered Cu/Nb composite. Materialovedenie 2009, 6, 7–10. [Google Scholar]
- Nelasov, I.V.; Lipnitskii, A.G.; Kolobov, Y.R. Study of the evolution of the Cu/Nb interphase boundary by the molecular dynamics method. Russ. Phys. J. 2009, 52, 1193–1198. [Google Scholar] [CrossRef]
- Wei, S.; Oyanagi, H.; Wen, C.; Yang, Y.; Liu, W. Metastable structures of immiscible FexCu100-x system induced by mechanical alloying. J. Phys. Condens. Matter. 1997, 9, 11077–11083. [Google Scholar] [CrossRef]
- Advani, A.H.; Thadhani, N.N. Shock-induced reaction synthesis of isomorphous (Cu-Ni) and immiscible (Cu-Nb) compounds. Metall. Mater. Trans. A 1999, 30, 1367–1379. [Google Scholar] [CrossRef]
Figure 1.
(a) Severe plastic deformation (SPD) scheme for the composite preparation: Bridgman chamber consisting of immobile 1 and movable 2 anvils, carbide inserts 3, sample 4 of alternating amorphous alloys (AA) ribbons (b) or the Cu-Nb nanolaminate (c).
Figure 1.
(a) Severe plastic deformation (SPD) scheme for the composite preparation: Bridgman chamber consisting of immobile 1 and movable 2 anvils, carbide inserts 3, sample 4 of alternating amorphous alloys (AA) ribbons (b) or the Cu-Nb nanolaminate (c).
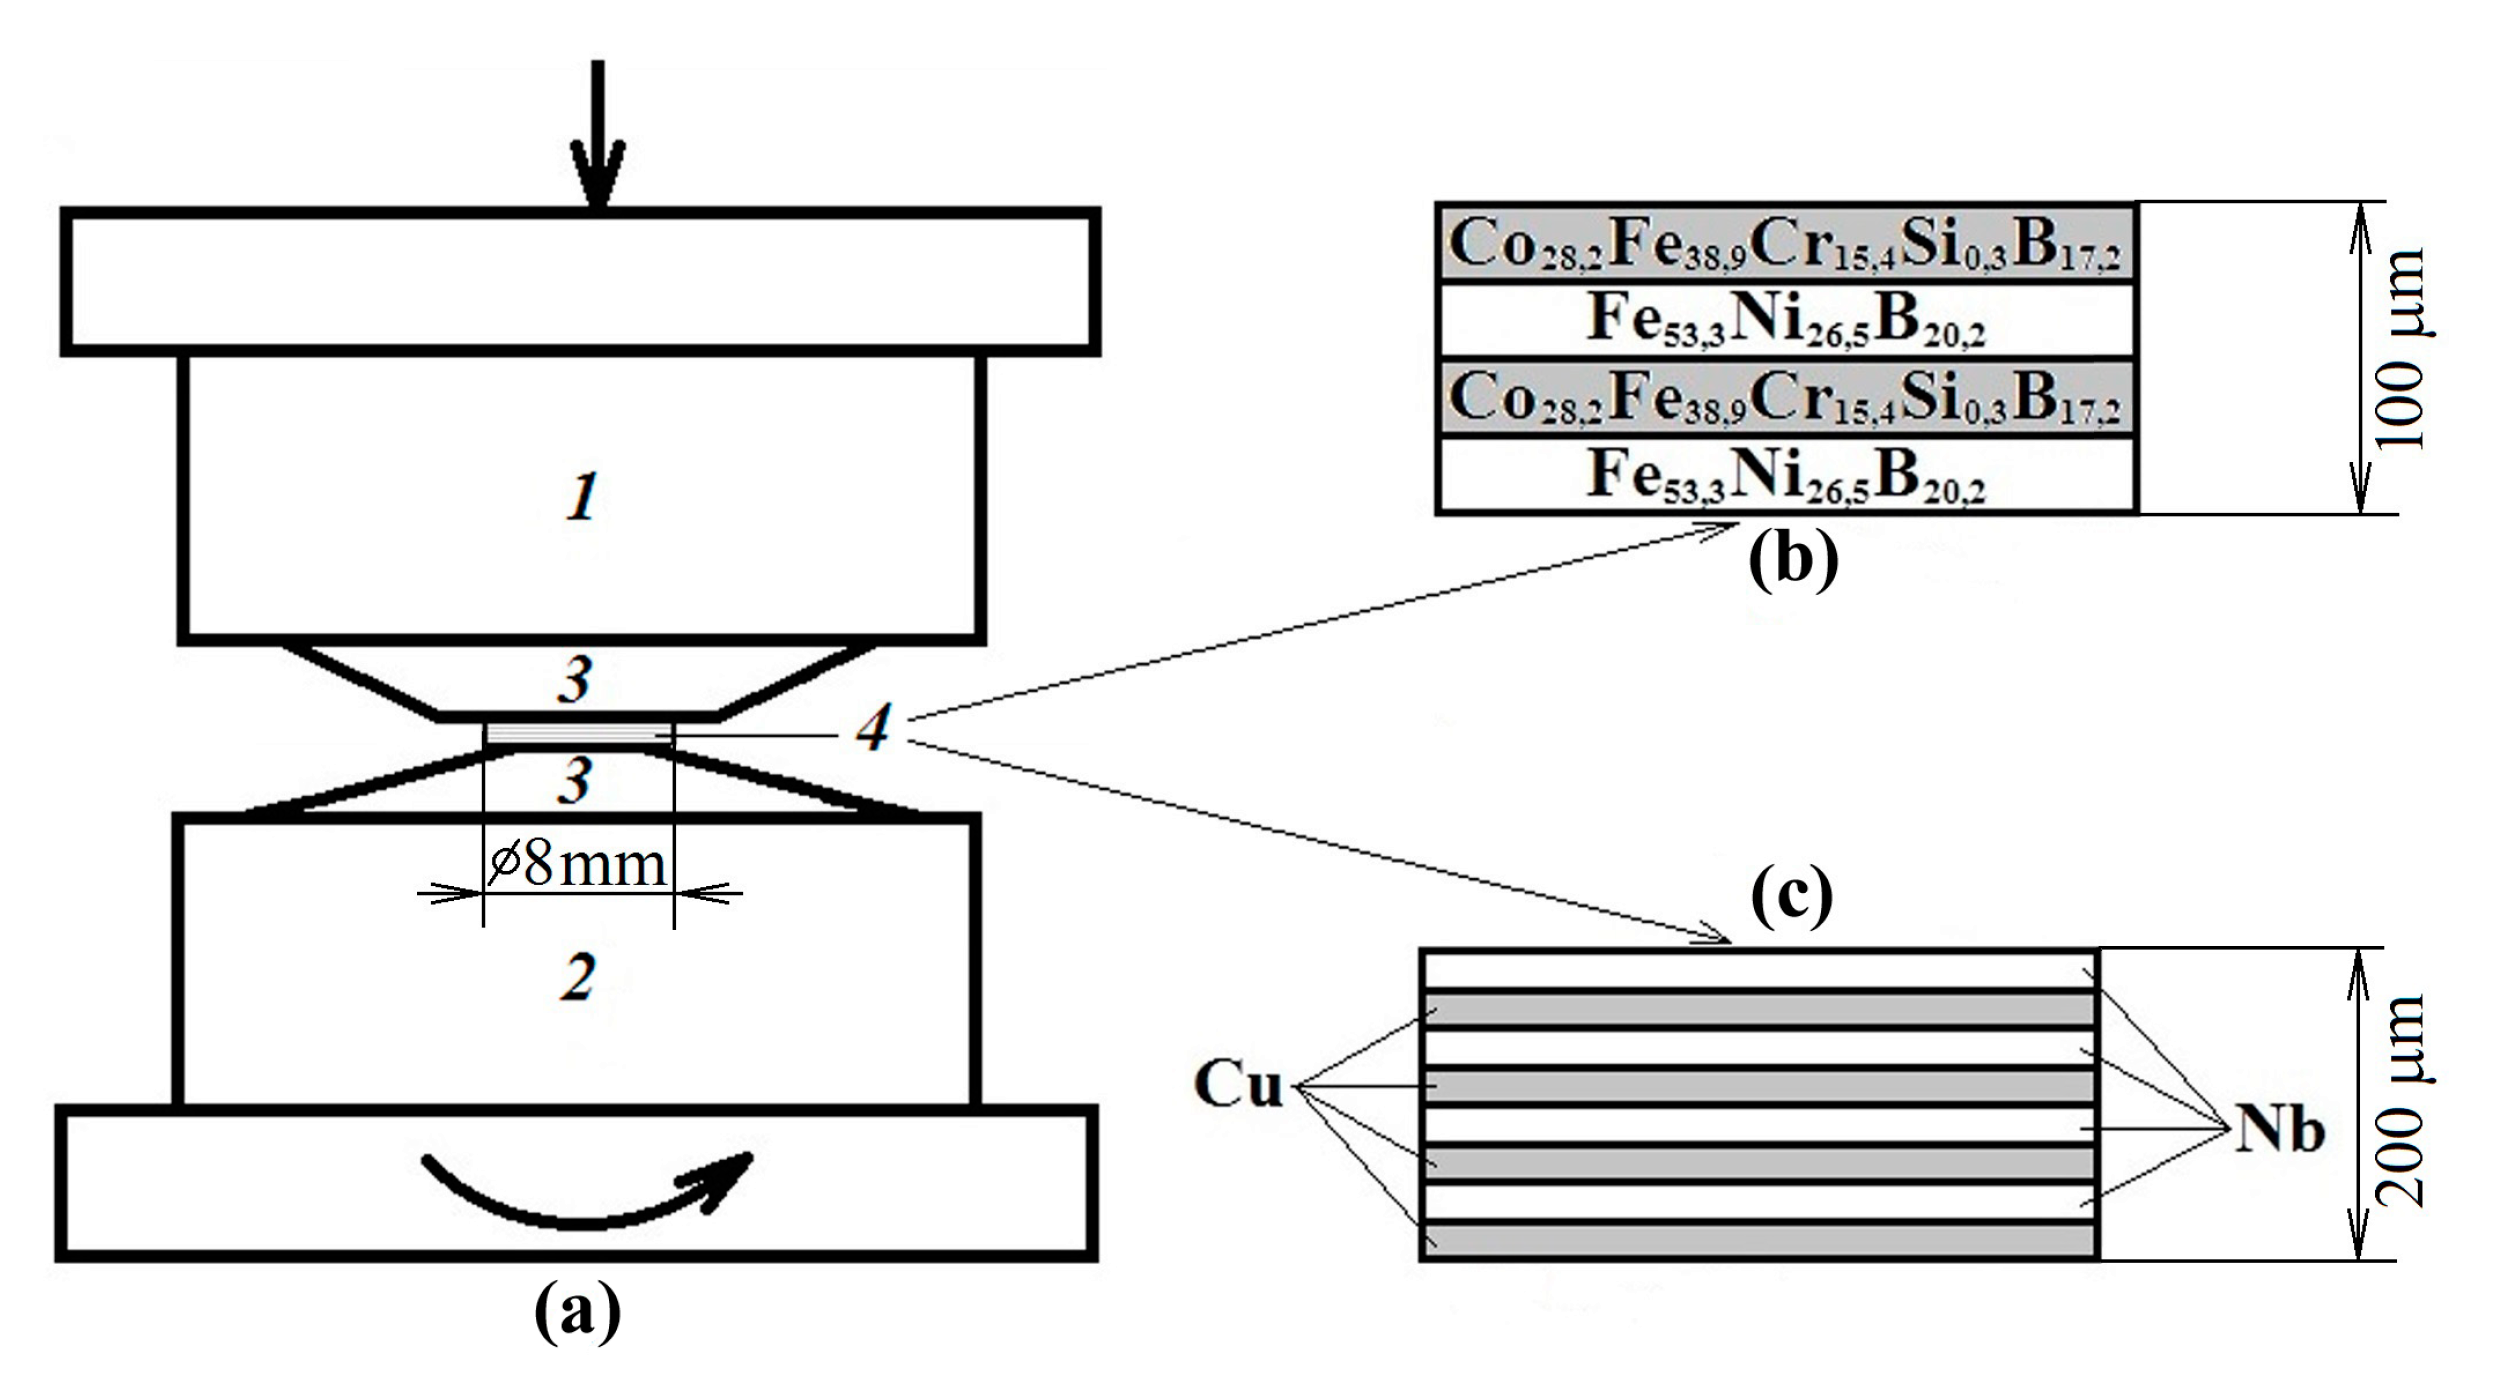
Figure 2.
X-ray diffraction (XRD) patterns of multilayer AA samples subjected to high-pressure torsion (HPT): (a) Fe53.3Ni26.5B20.2, (b) Co28.2Fe38.9Cr15.4Si0.3B17.2 and (c) composite material.
Figure 2.
X-ray diffraction (XRD) patterns of multilayer AA samples subjected to high-pressure torsion (HPT): (a) Fe53.3Ni26.5B20.2, (b) Co28.2Fe38.9Cr15.4Si0.3B17.2 and (c) composite material.
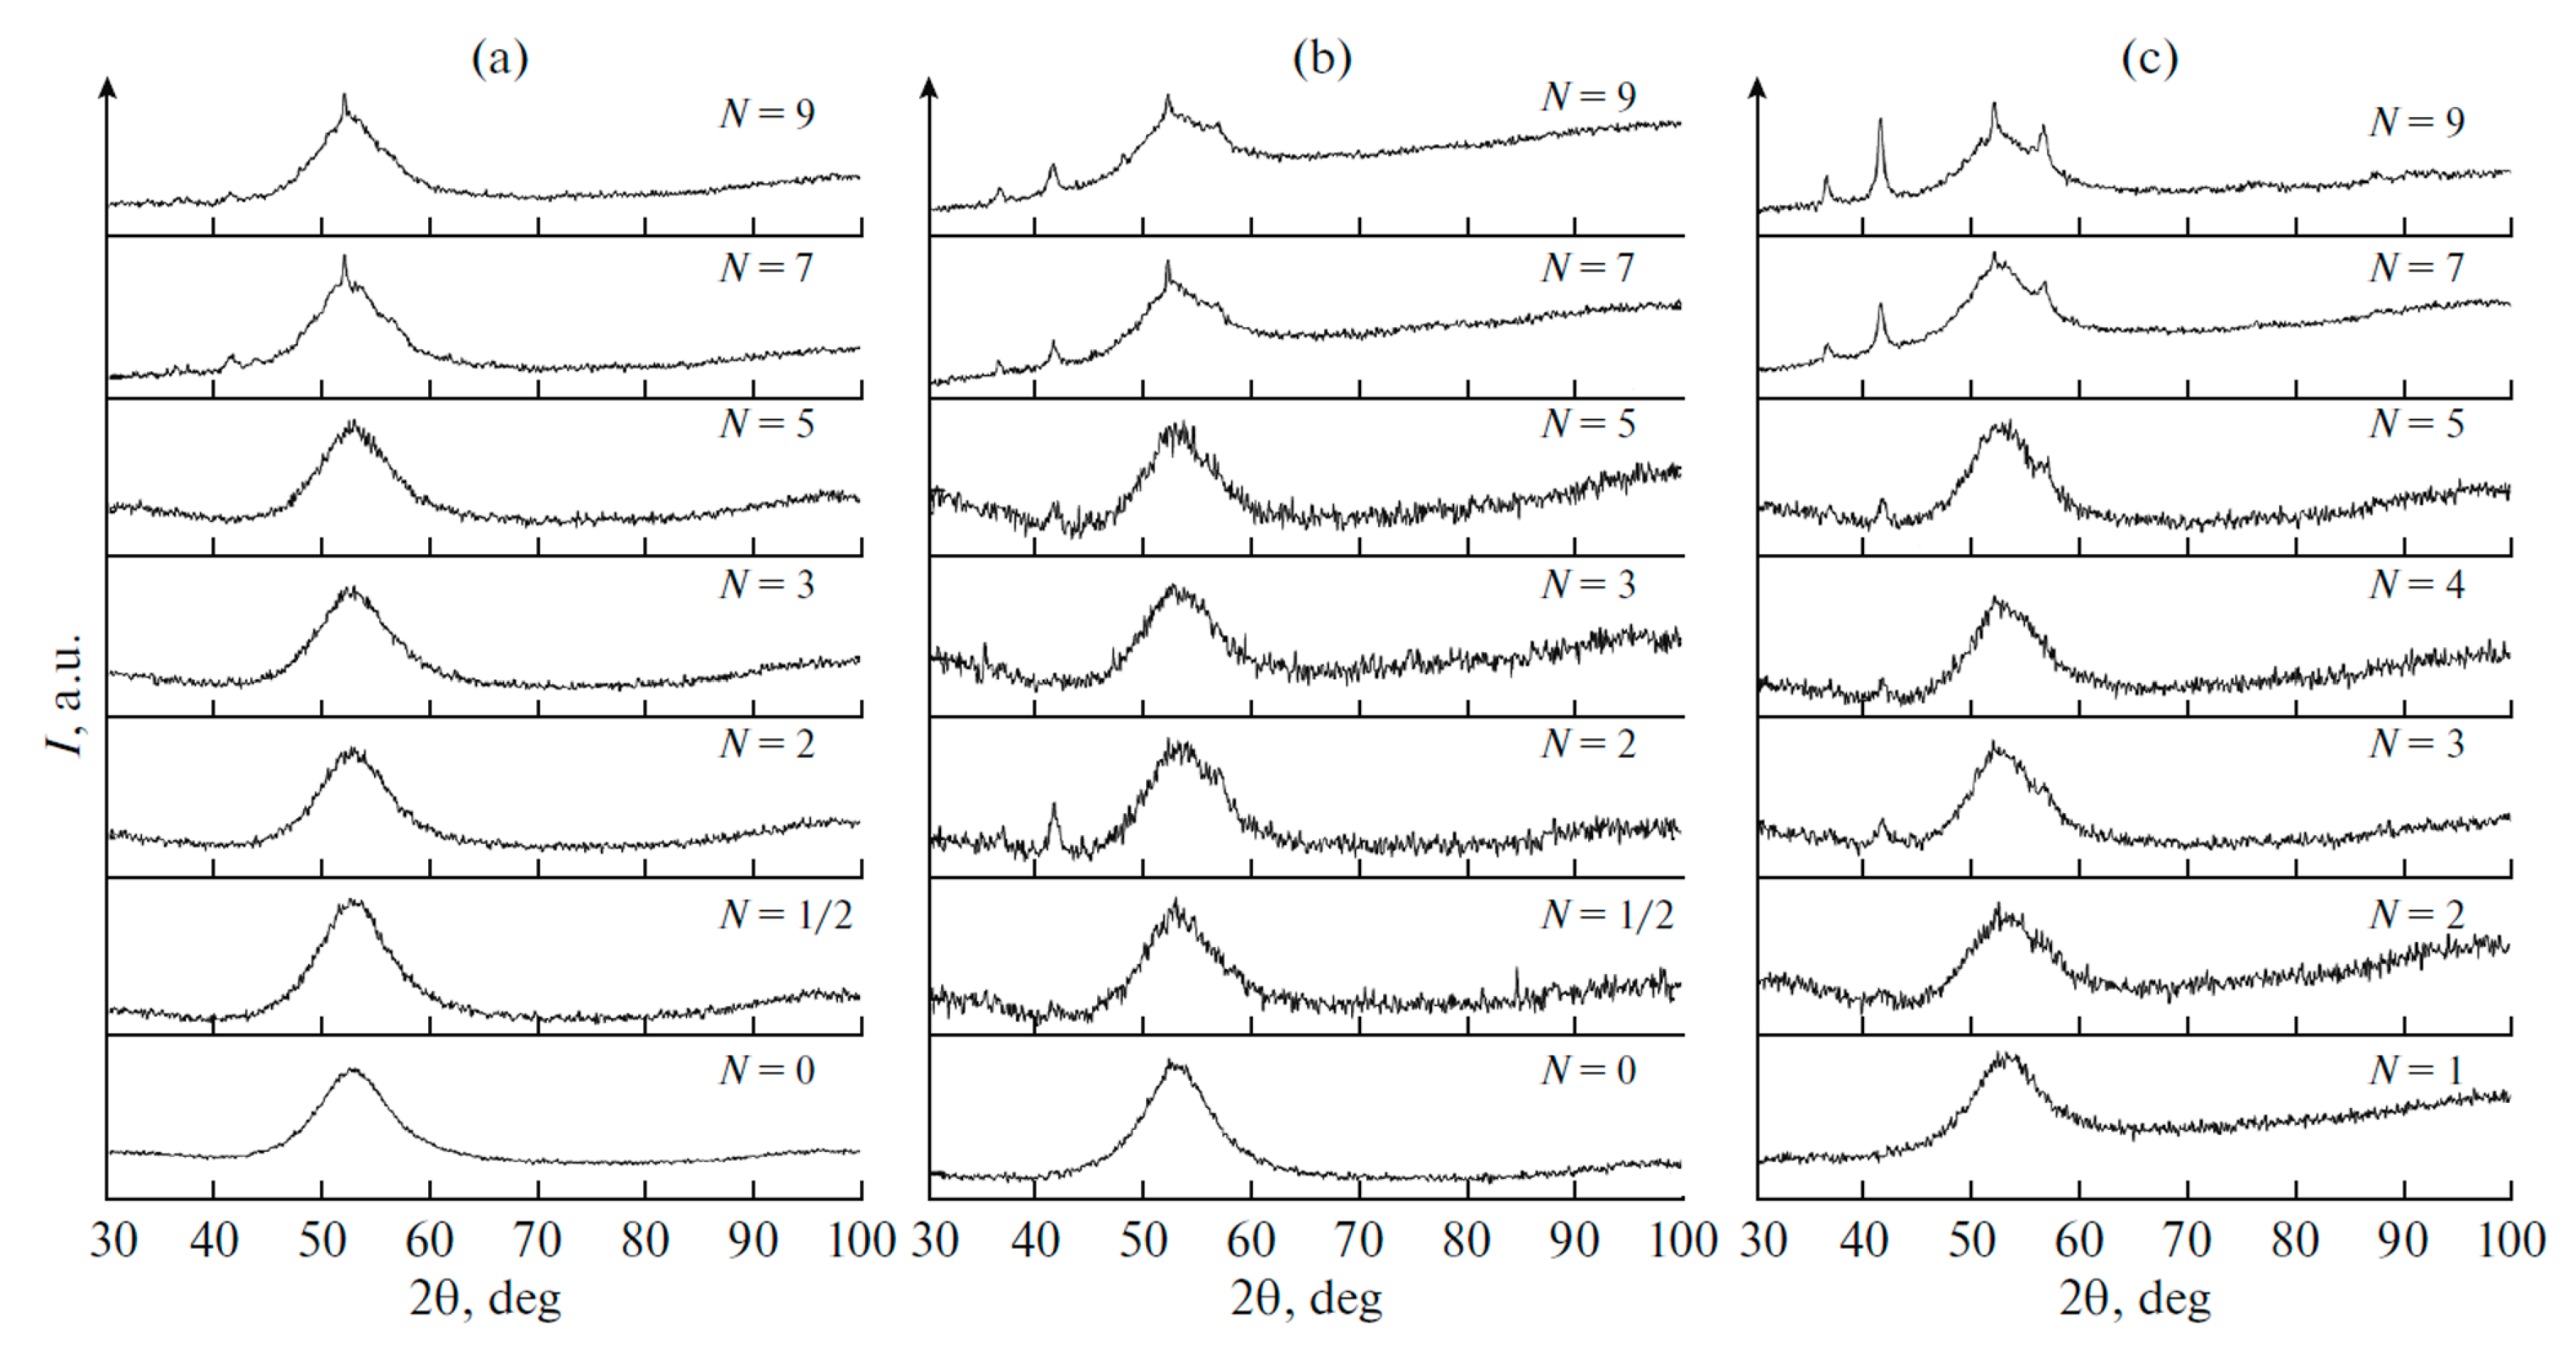
Figure 3.
Dark-field images of the of Fe53.3Ni26.5B20.2 AA structure subjected to HPT to N = 3 (a) and N = 9 (b) and the corresponding selected area electron diffraction (SAED) patterns.
Figure 3.
Dark-field images of the of Fe53.3Ni26.5B20.2 AA structure subjected to HPT to N = 3 (a) and N = 9 (b) and the corresponding selected area electron diffraction (SAED) patterns.
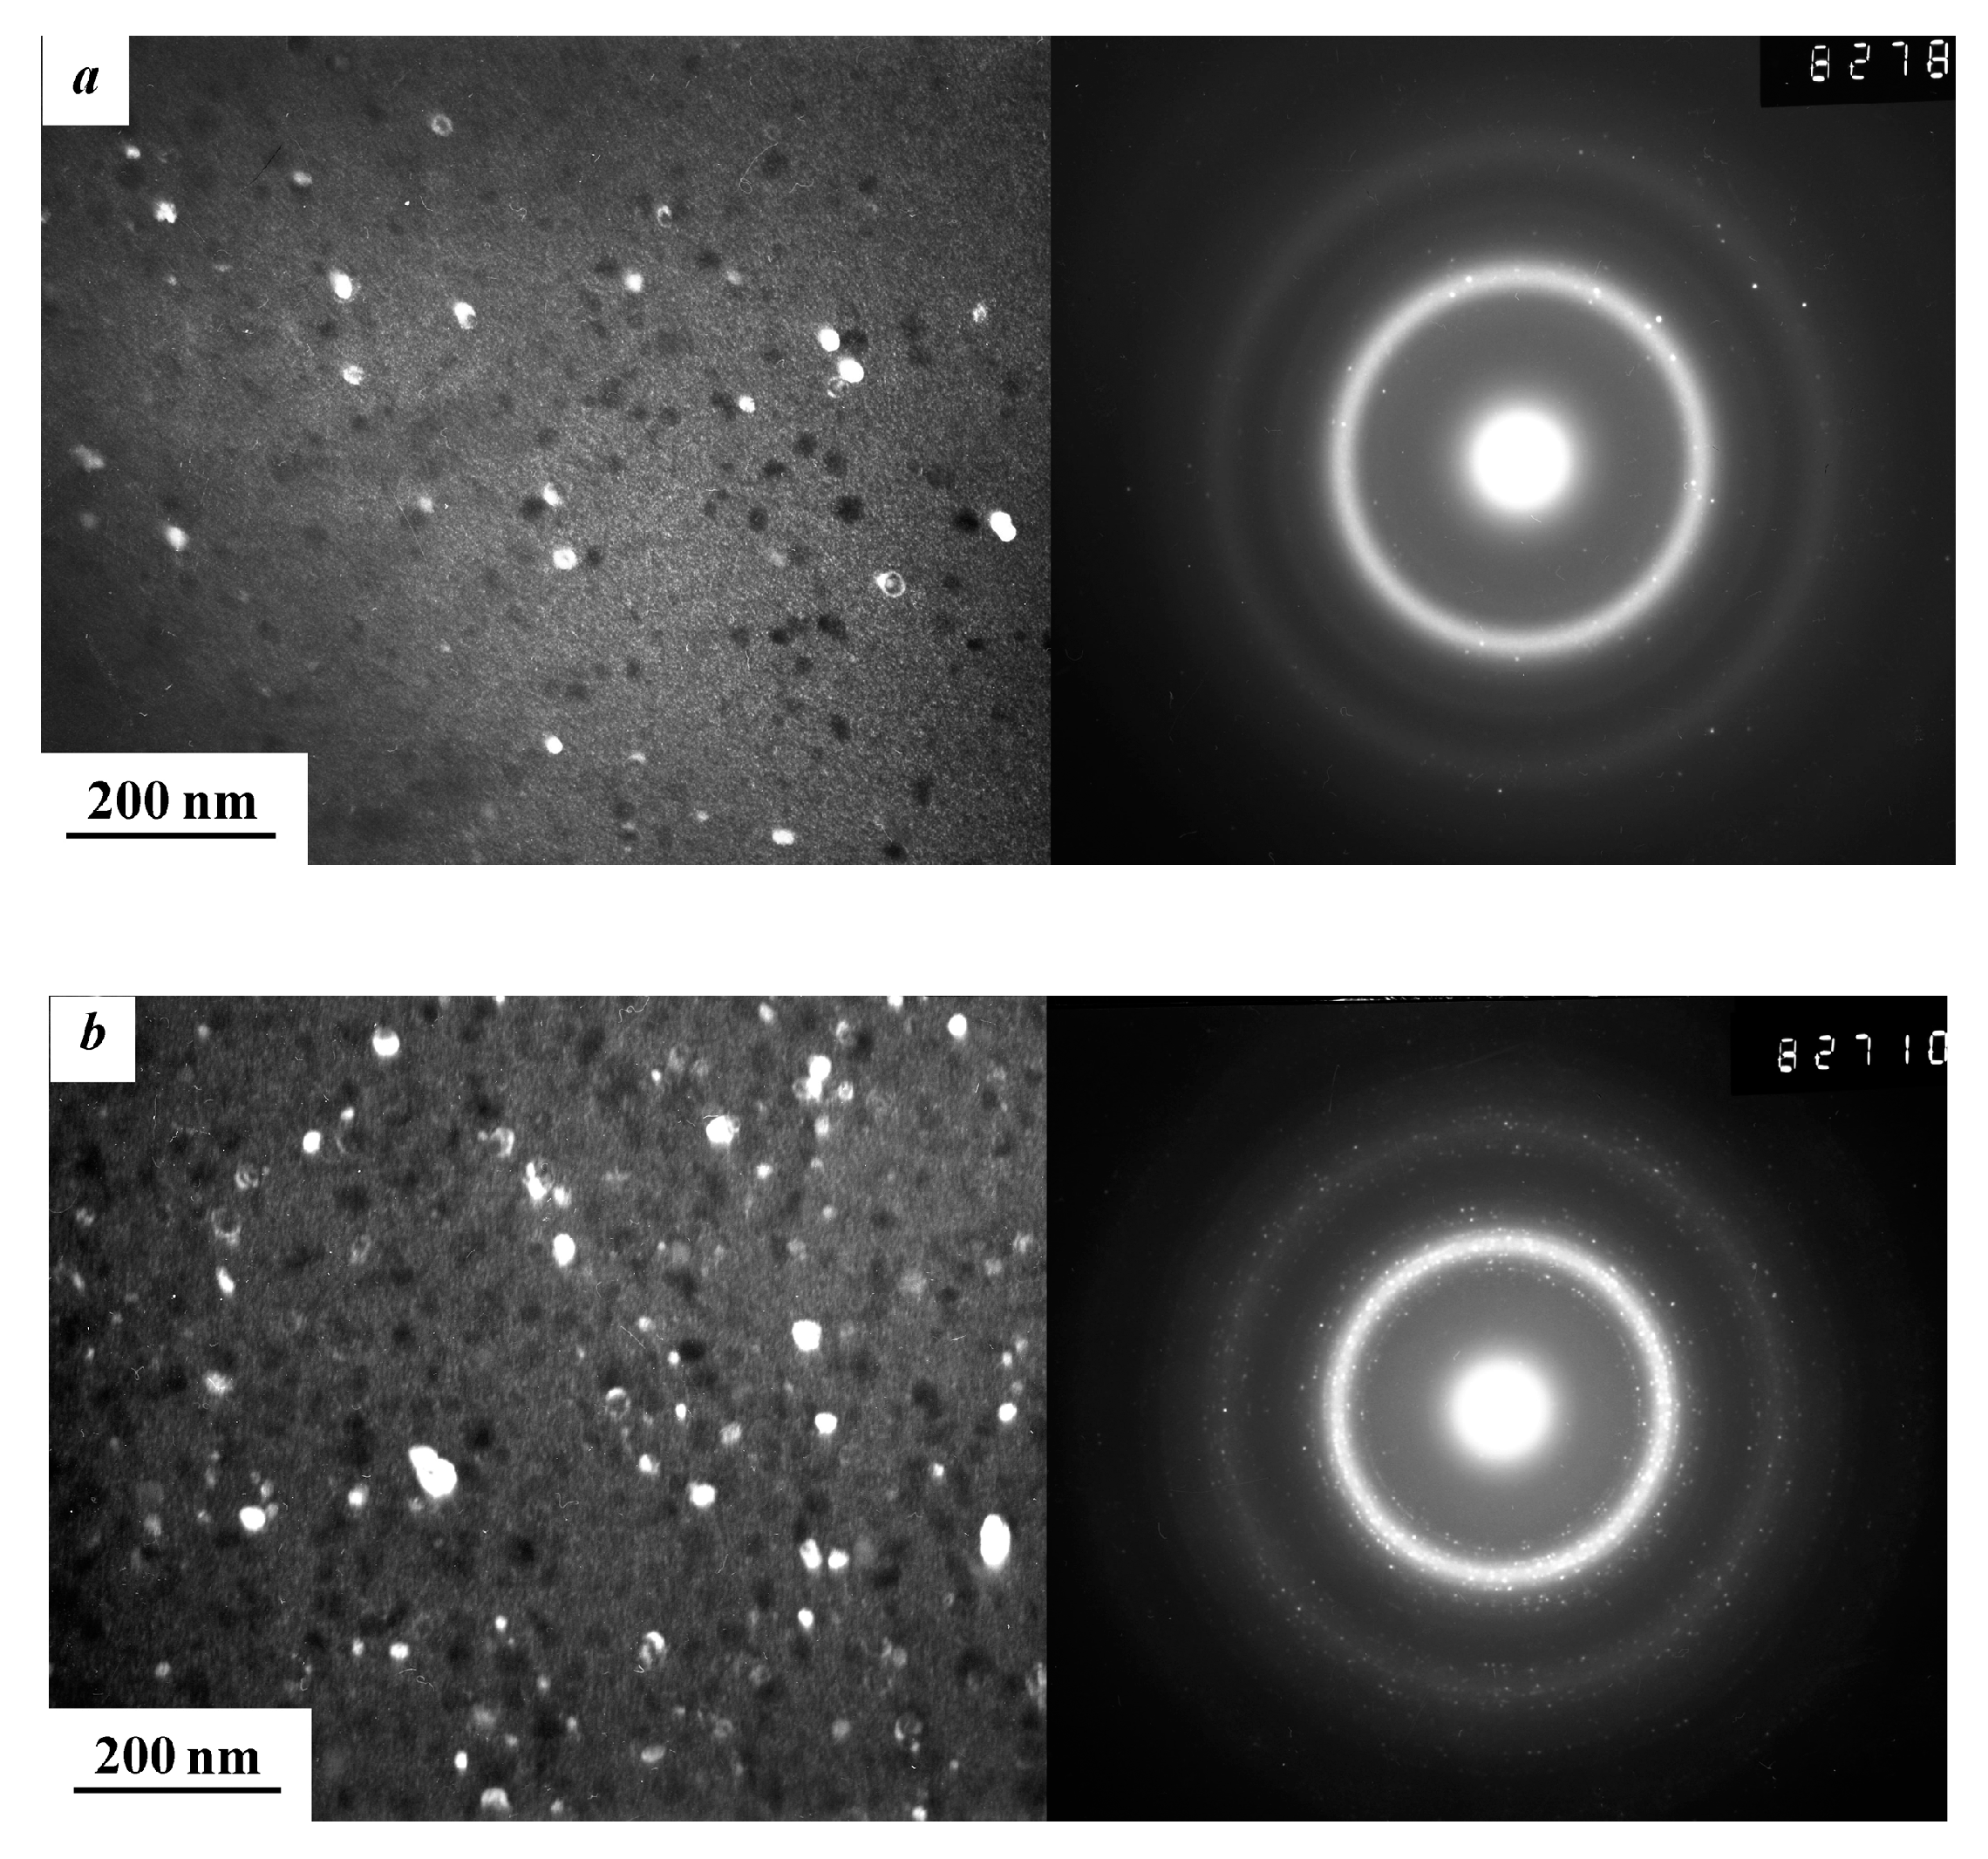
Figure 4.
Dark-field images (TEM) and SAED patterns of α-Fe (a) and α-Co (b) in the Co28.2Fe38.9Cr15.4Si0.3B17.2 AA subjected to HPT to N = 2.
Figure 4.
Dark-field images (TEM) and SAED patterns of α-Fe (a) and α-Co (b) in the Co28.2Fe38.9Cr15.4Si0.3B17.2 AA subjected to HPT to N = 2.
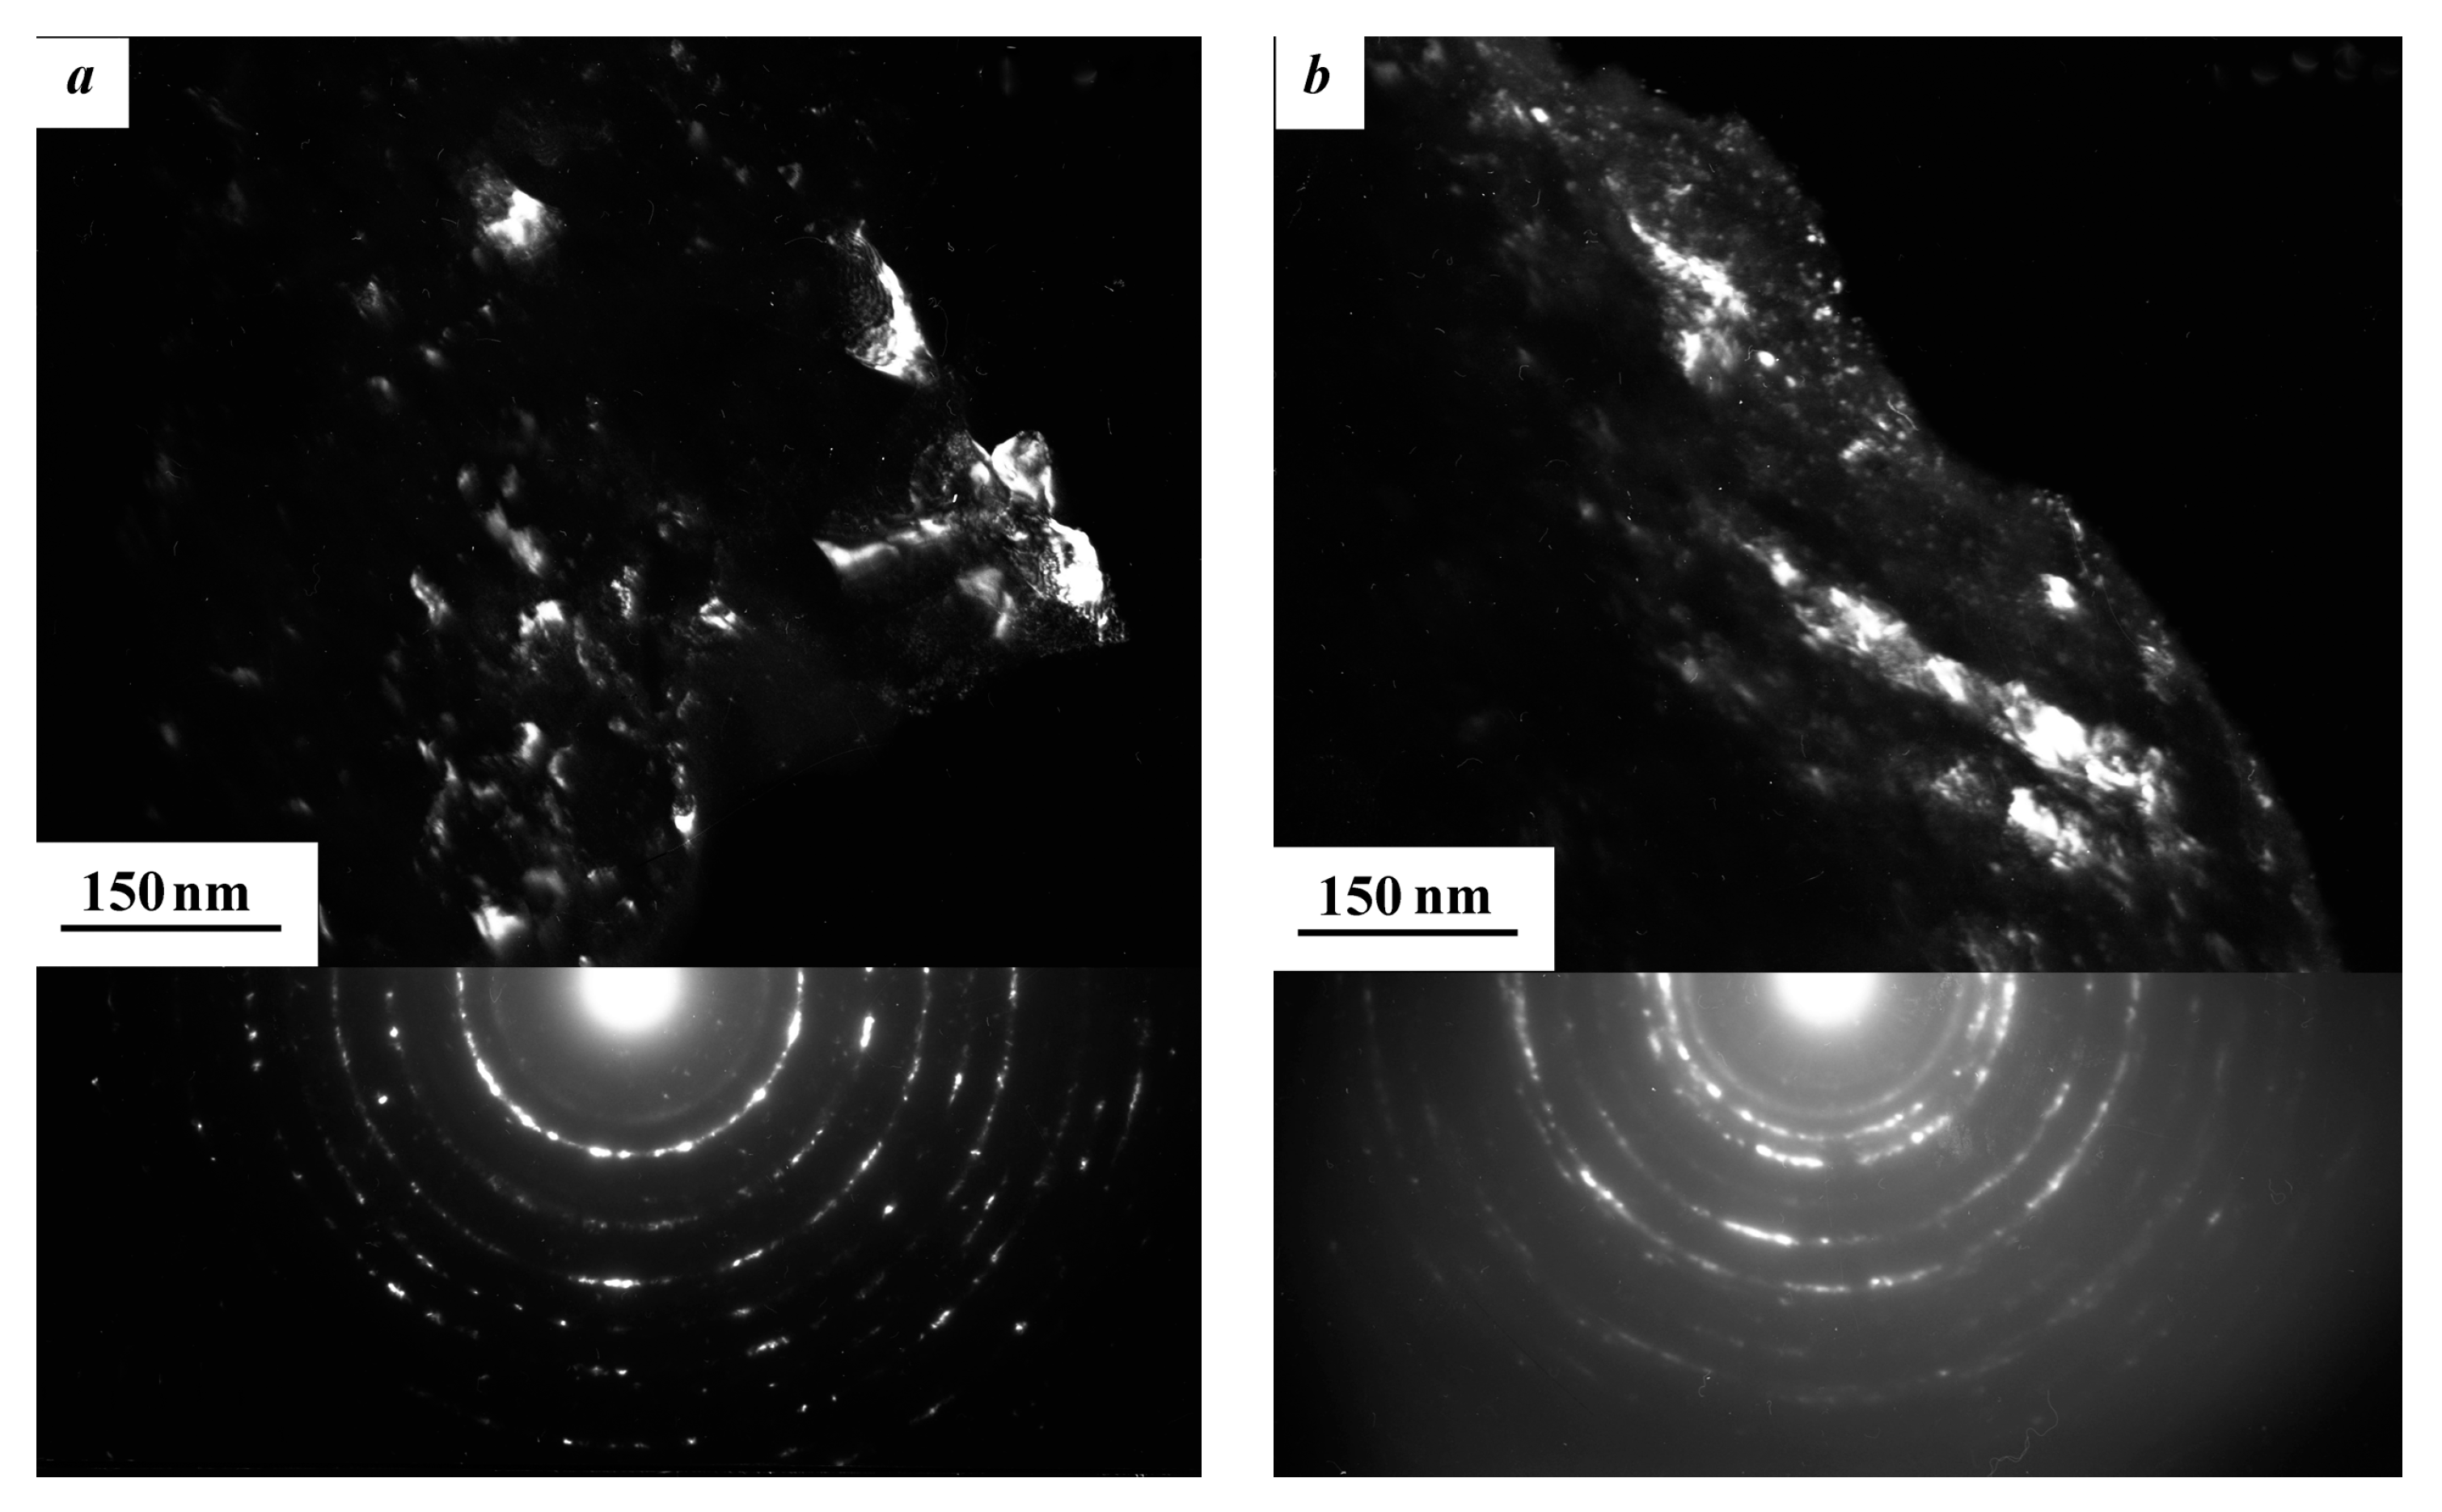
Figure 5.
Shear bands in the composites formed from AA and subjected to HPT at N = 3 (a) and N = 5 (b).
Figure 5.
Shear bands in the composites formed from AA and subjected to HPT at N = 3 (a) and N = 5 (b).
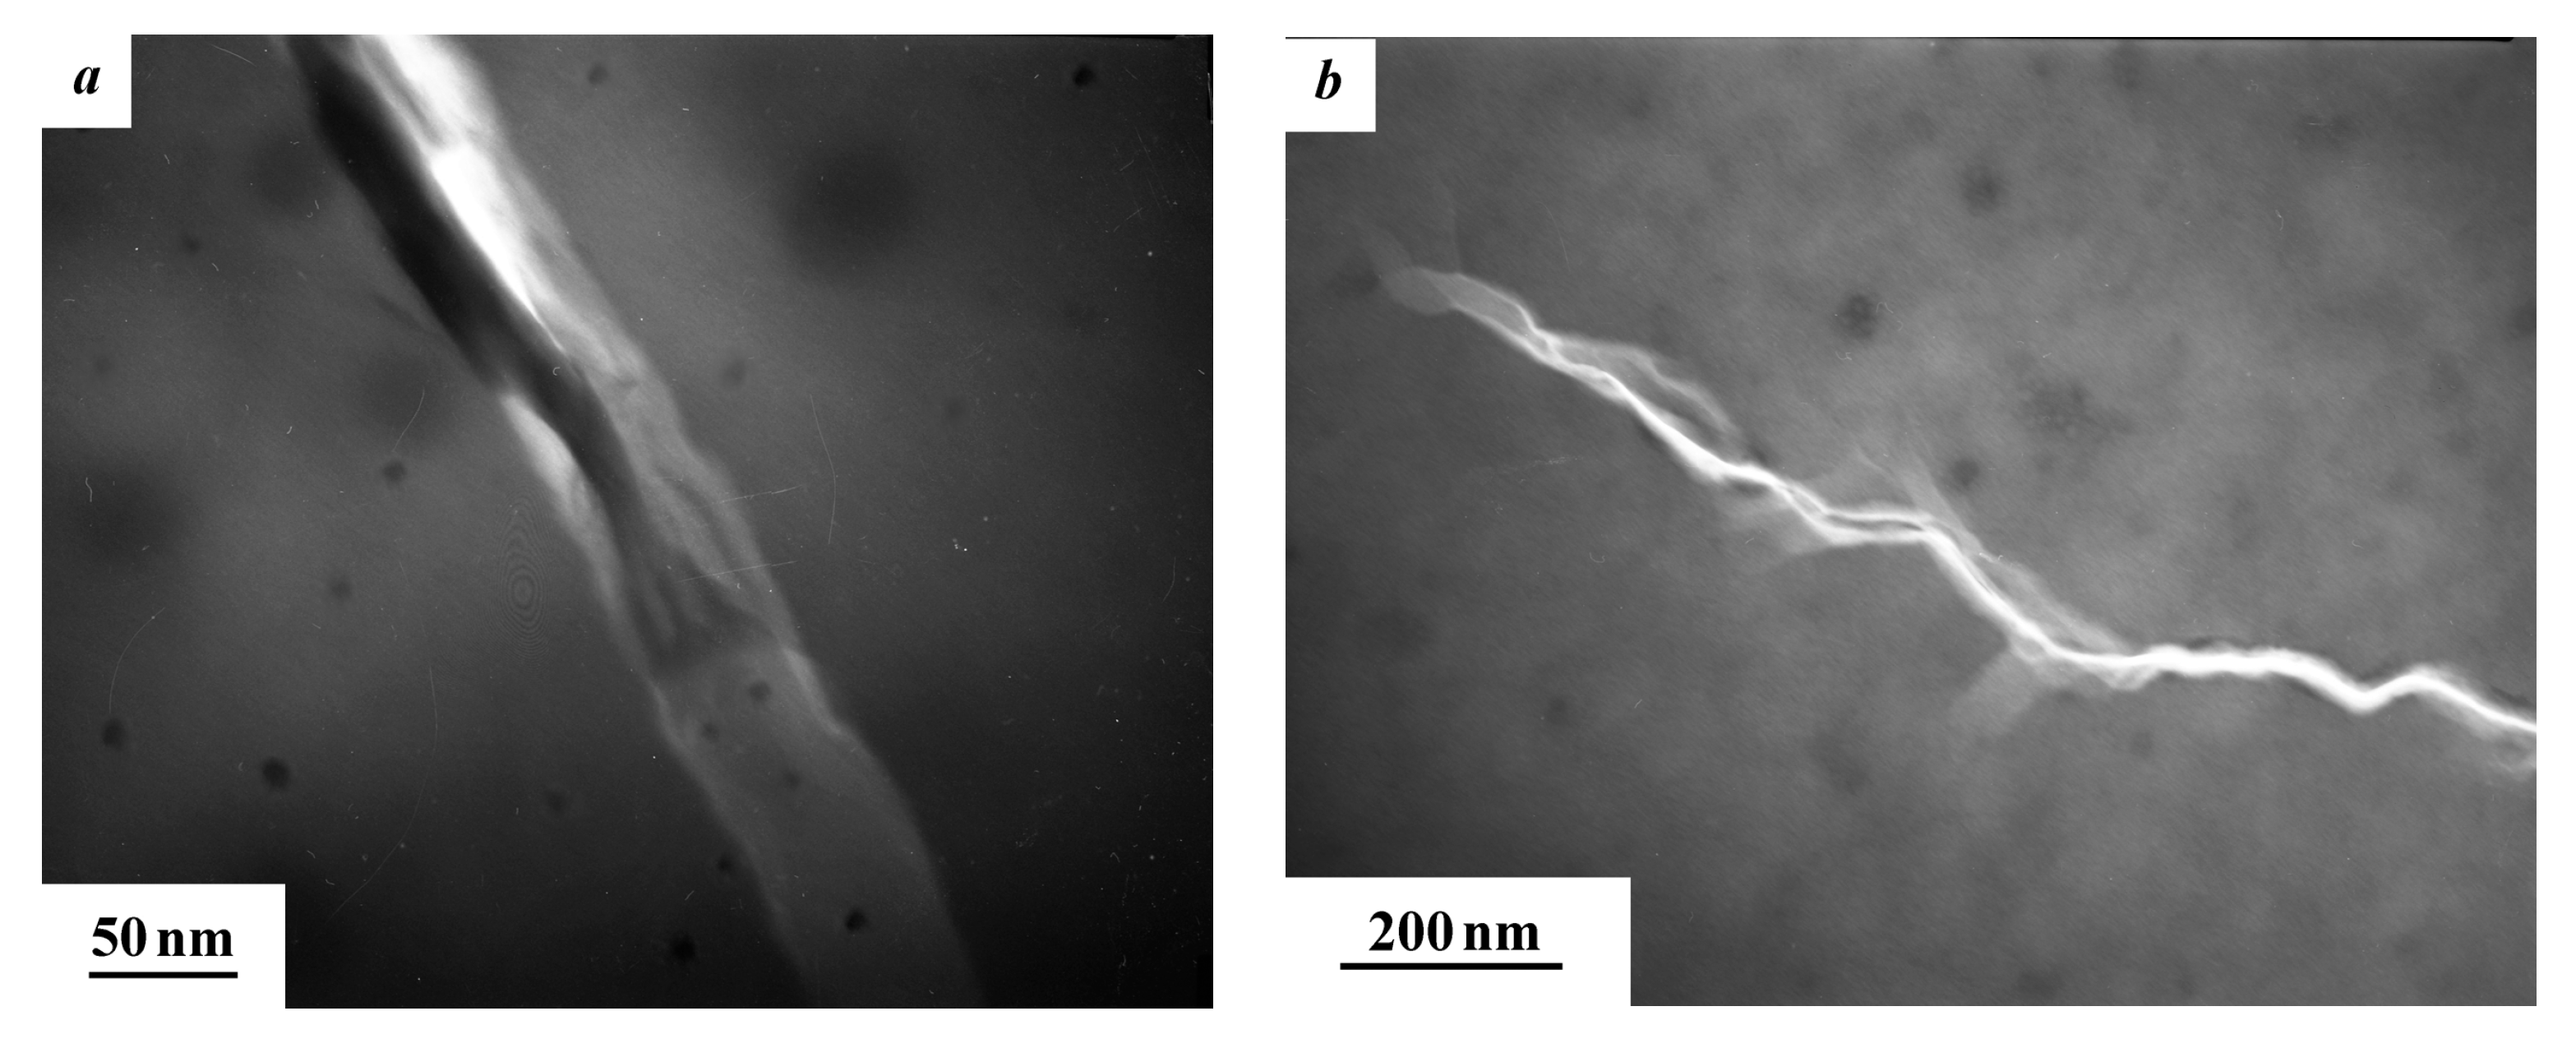
Figure 6.
Bright-field images (TEM) of the composite structure after HPT to N = 3 (a) and N = 7 (b) and the corresponding SAED patterns.
Figure 6.
Bright-field images (TEM) of the composite structure after HPT to N = 3 (a) and N = 7 (b) and the corresponding SAED patterns.
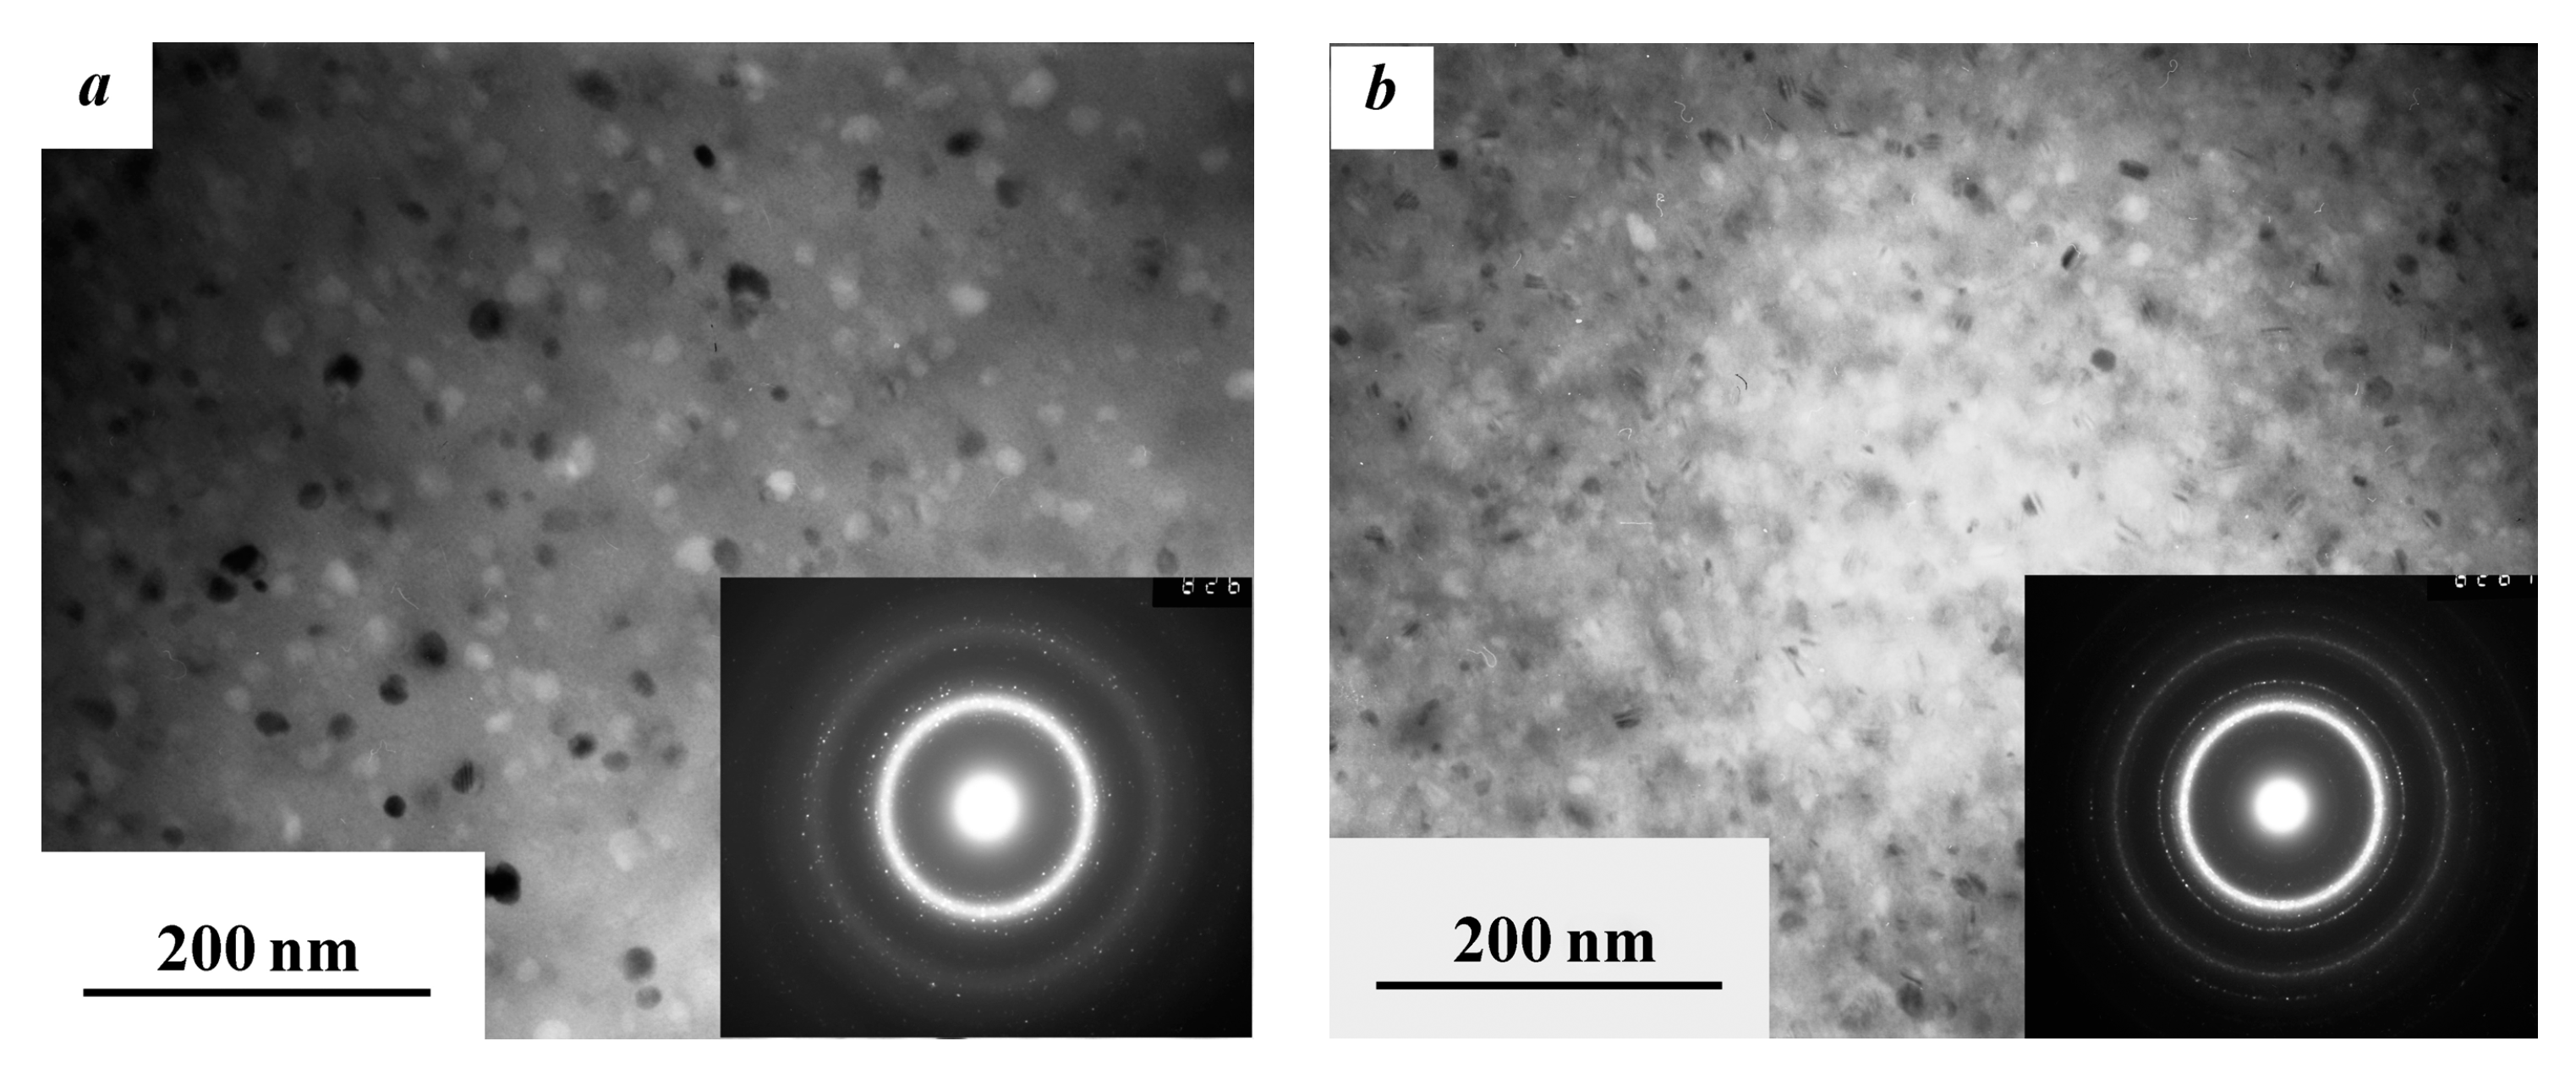
Figure 7.
Bright-field image (TEM) of the composite after HPT to N = 9 and the corresponding SAED pattern (a); and dark-field images (TEM) from the 1st (b) and 4th circles (c) of SAED pattern.
Figure 7.
Bright-field image (TEM) of the composite after HPT to N = 9 and the corresponding SAED pattern (a); and dark-field images (TEM) from the 1st (b) and 4th circles (c) of SAED pattern.

Figure 8.
Microhardness of the materials as a function of number of revolutions upon HPT: 1–Fe53.3Ni26.5B20.2 AA; 2–Co28.2Fe38.9Cr15.4Si0.3B17.2 AA; 3–composite formed from different AA.
Figure 8.
Microhardness of the materials as a function of number of revolutions upon HPT: 1–Fe53.3Ni26.5B20.2 AA; 2–Co28.2Fe38.9Cr15.4Si0.3B17.2 AA; 3–composite formed from different AA.

Figure 9.
Crack resistance behavior of the materials subjected to HPT: 1–Fe53.3Ni26.5B20.2 AA; 2–Co28.2Fe38.9Cr15.4Si0.3B17.2 AA; 3–composite.
Figure 9.
Crack resistance behavior of the materials subjected to HPT: 1–Fe53.3Ni26.5B20.2 AA; 2–Co28.2Fe38.9Cr15.4Si0.3B17.2 AA; 3–composite.
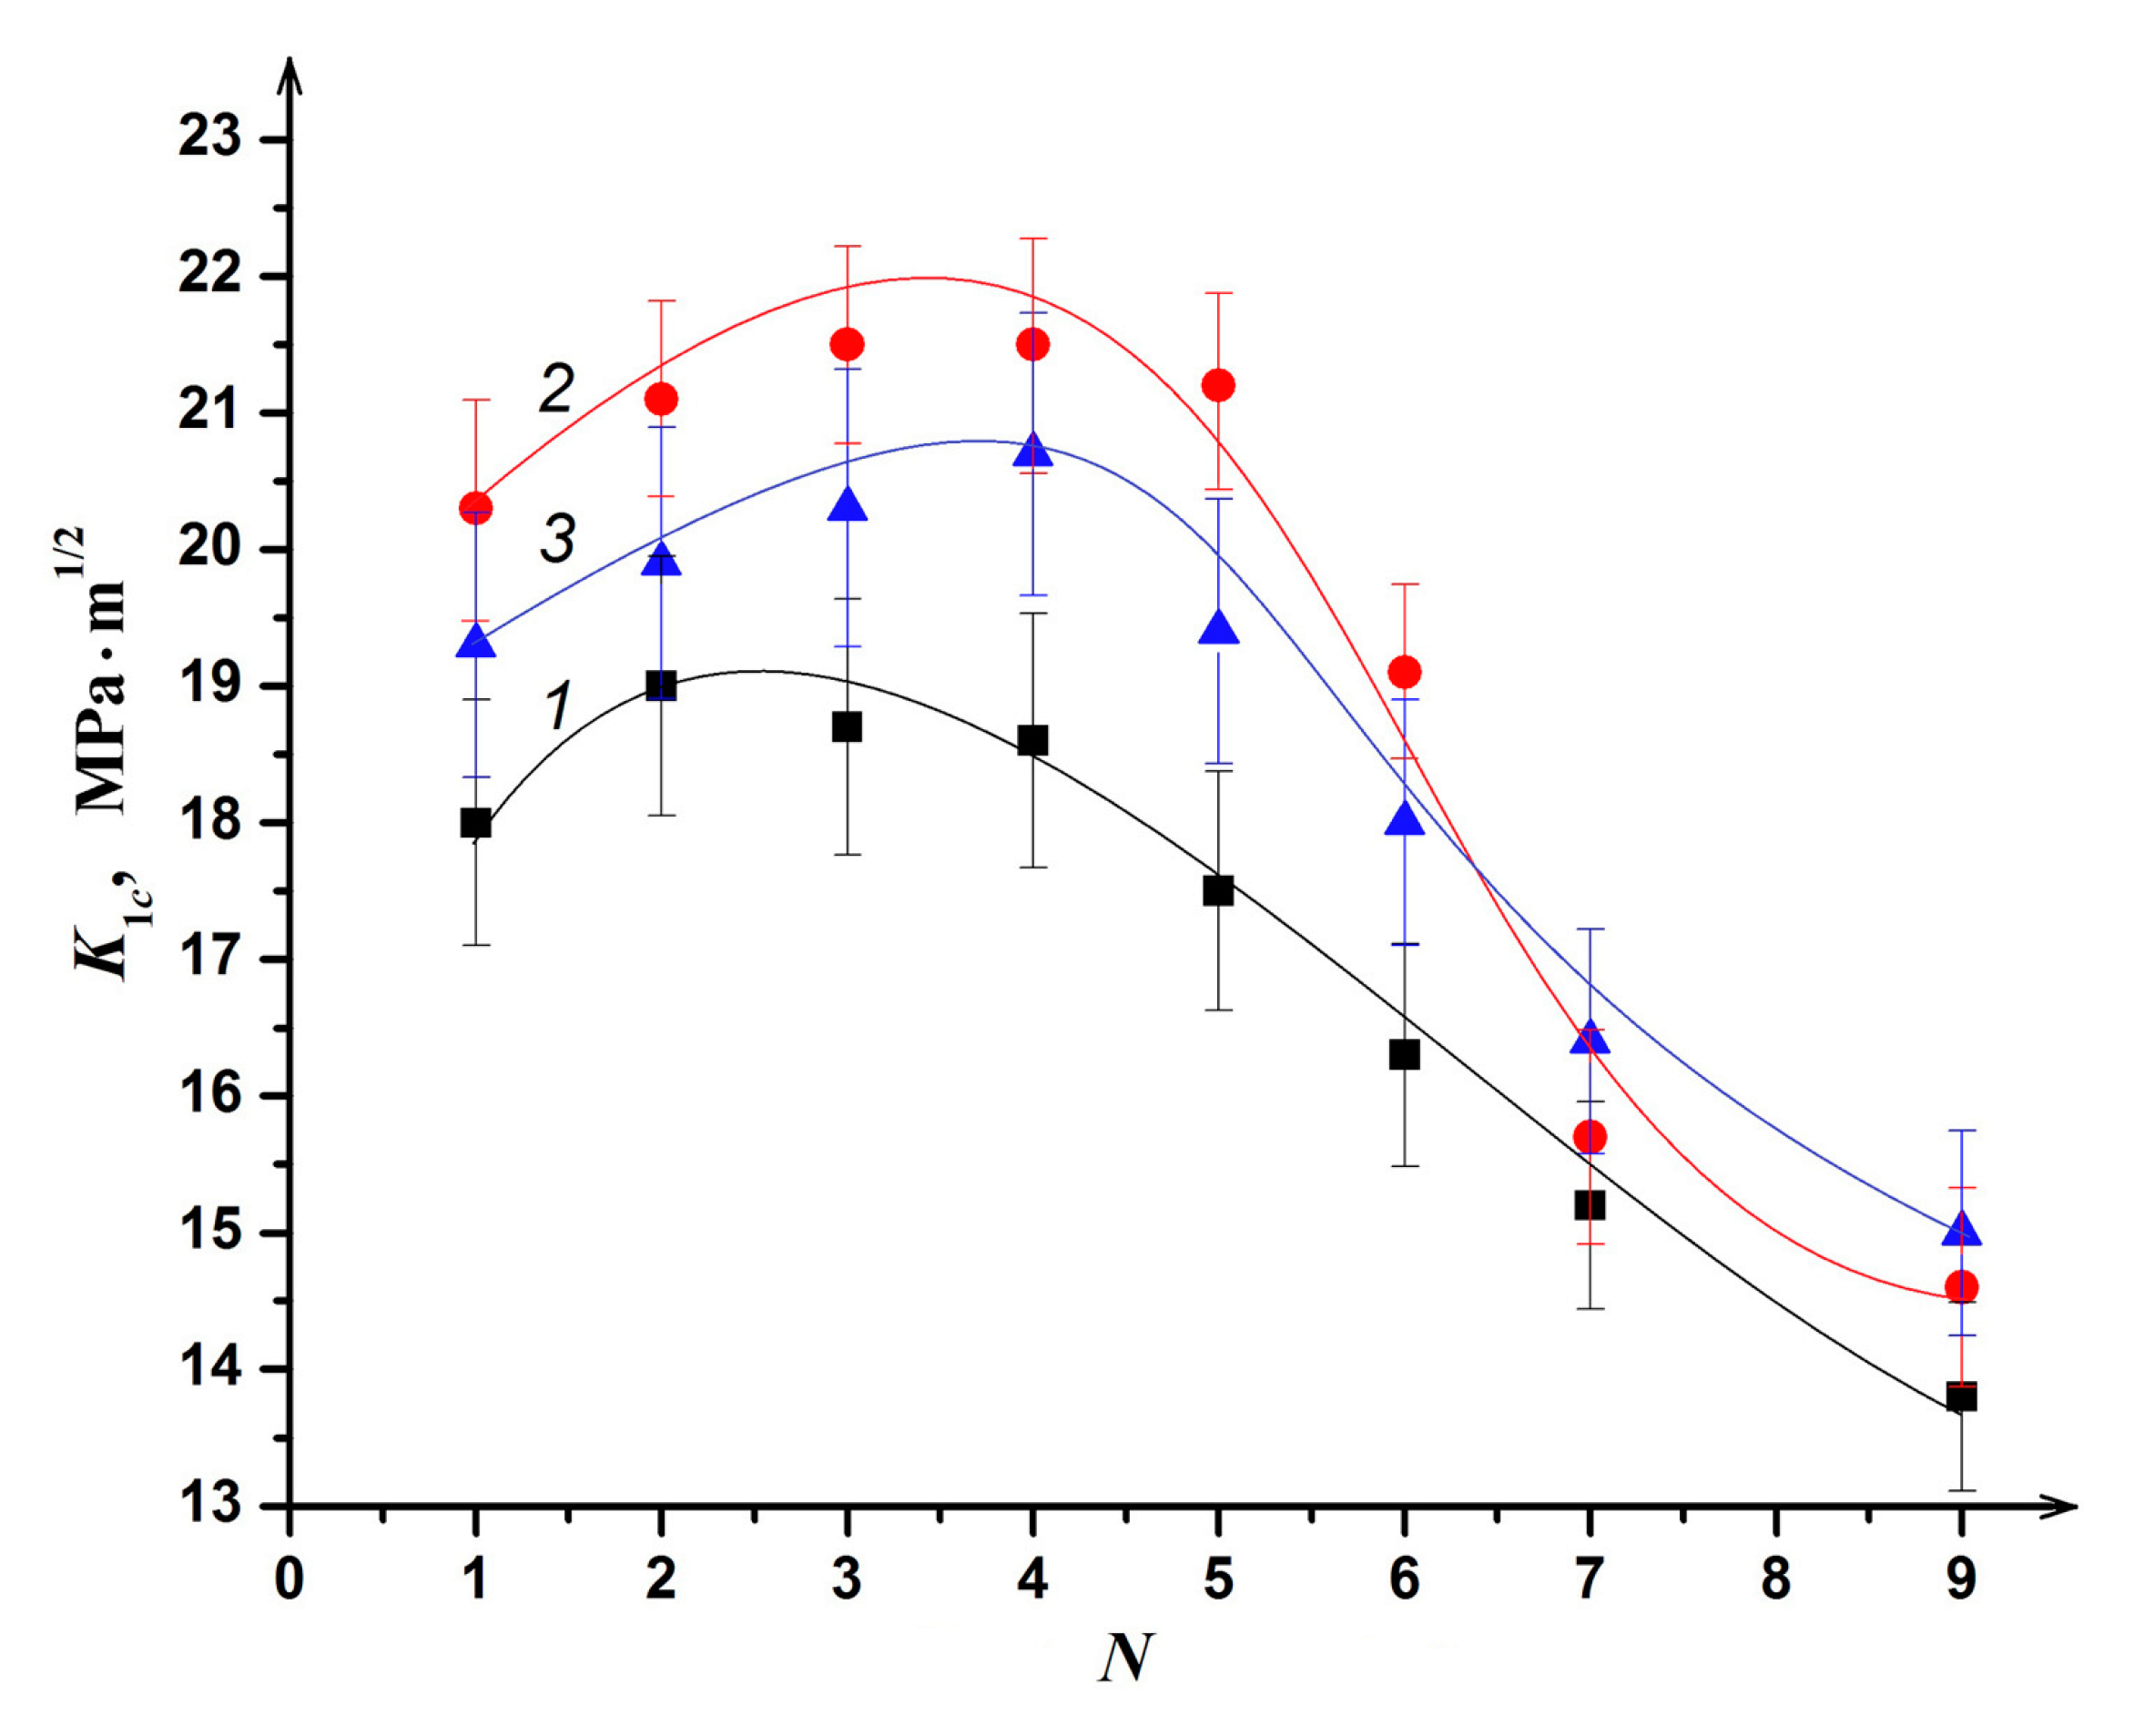
Figure 10.
Coercive force as a function of the degree of deformation upon HPT: 1–Fe53.3Ni26.5B20.2 AA; 2–Co28.2Fe38.9Cr15.4Si0.3B17.2 AA; 3–composite.
Figure 10.
Coercive force as a function of the degree of deformation upon HPT: 1–Fe53.3Ni26.5B20.2 AA; 2–Co28.2Fe38.9Cr15.4Si0.3B17.2 AA; 3–composite.
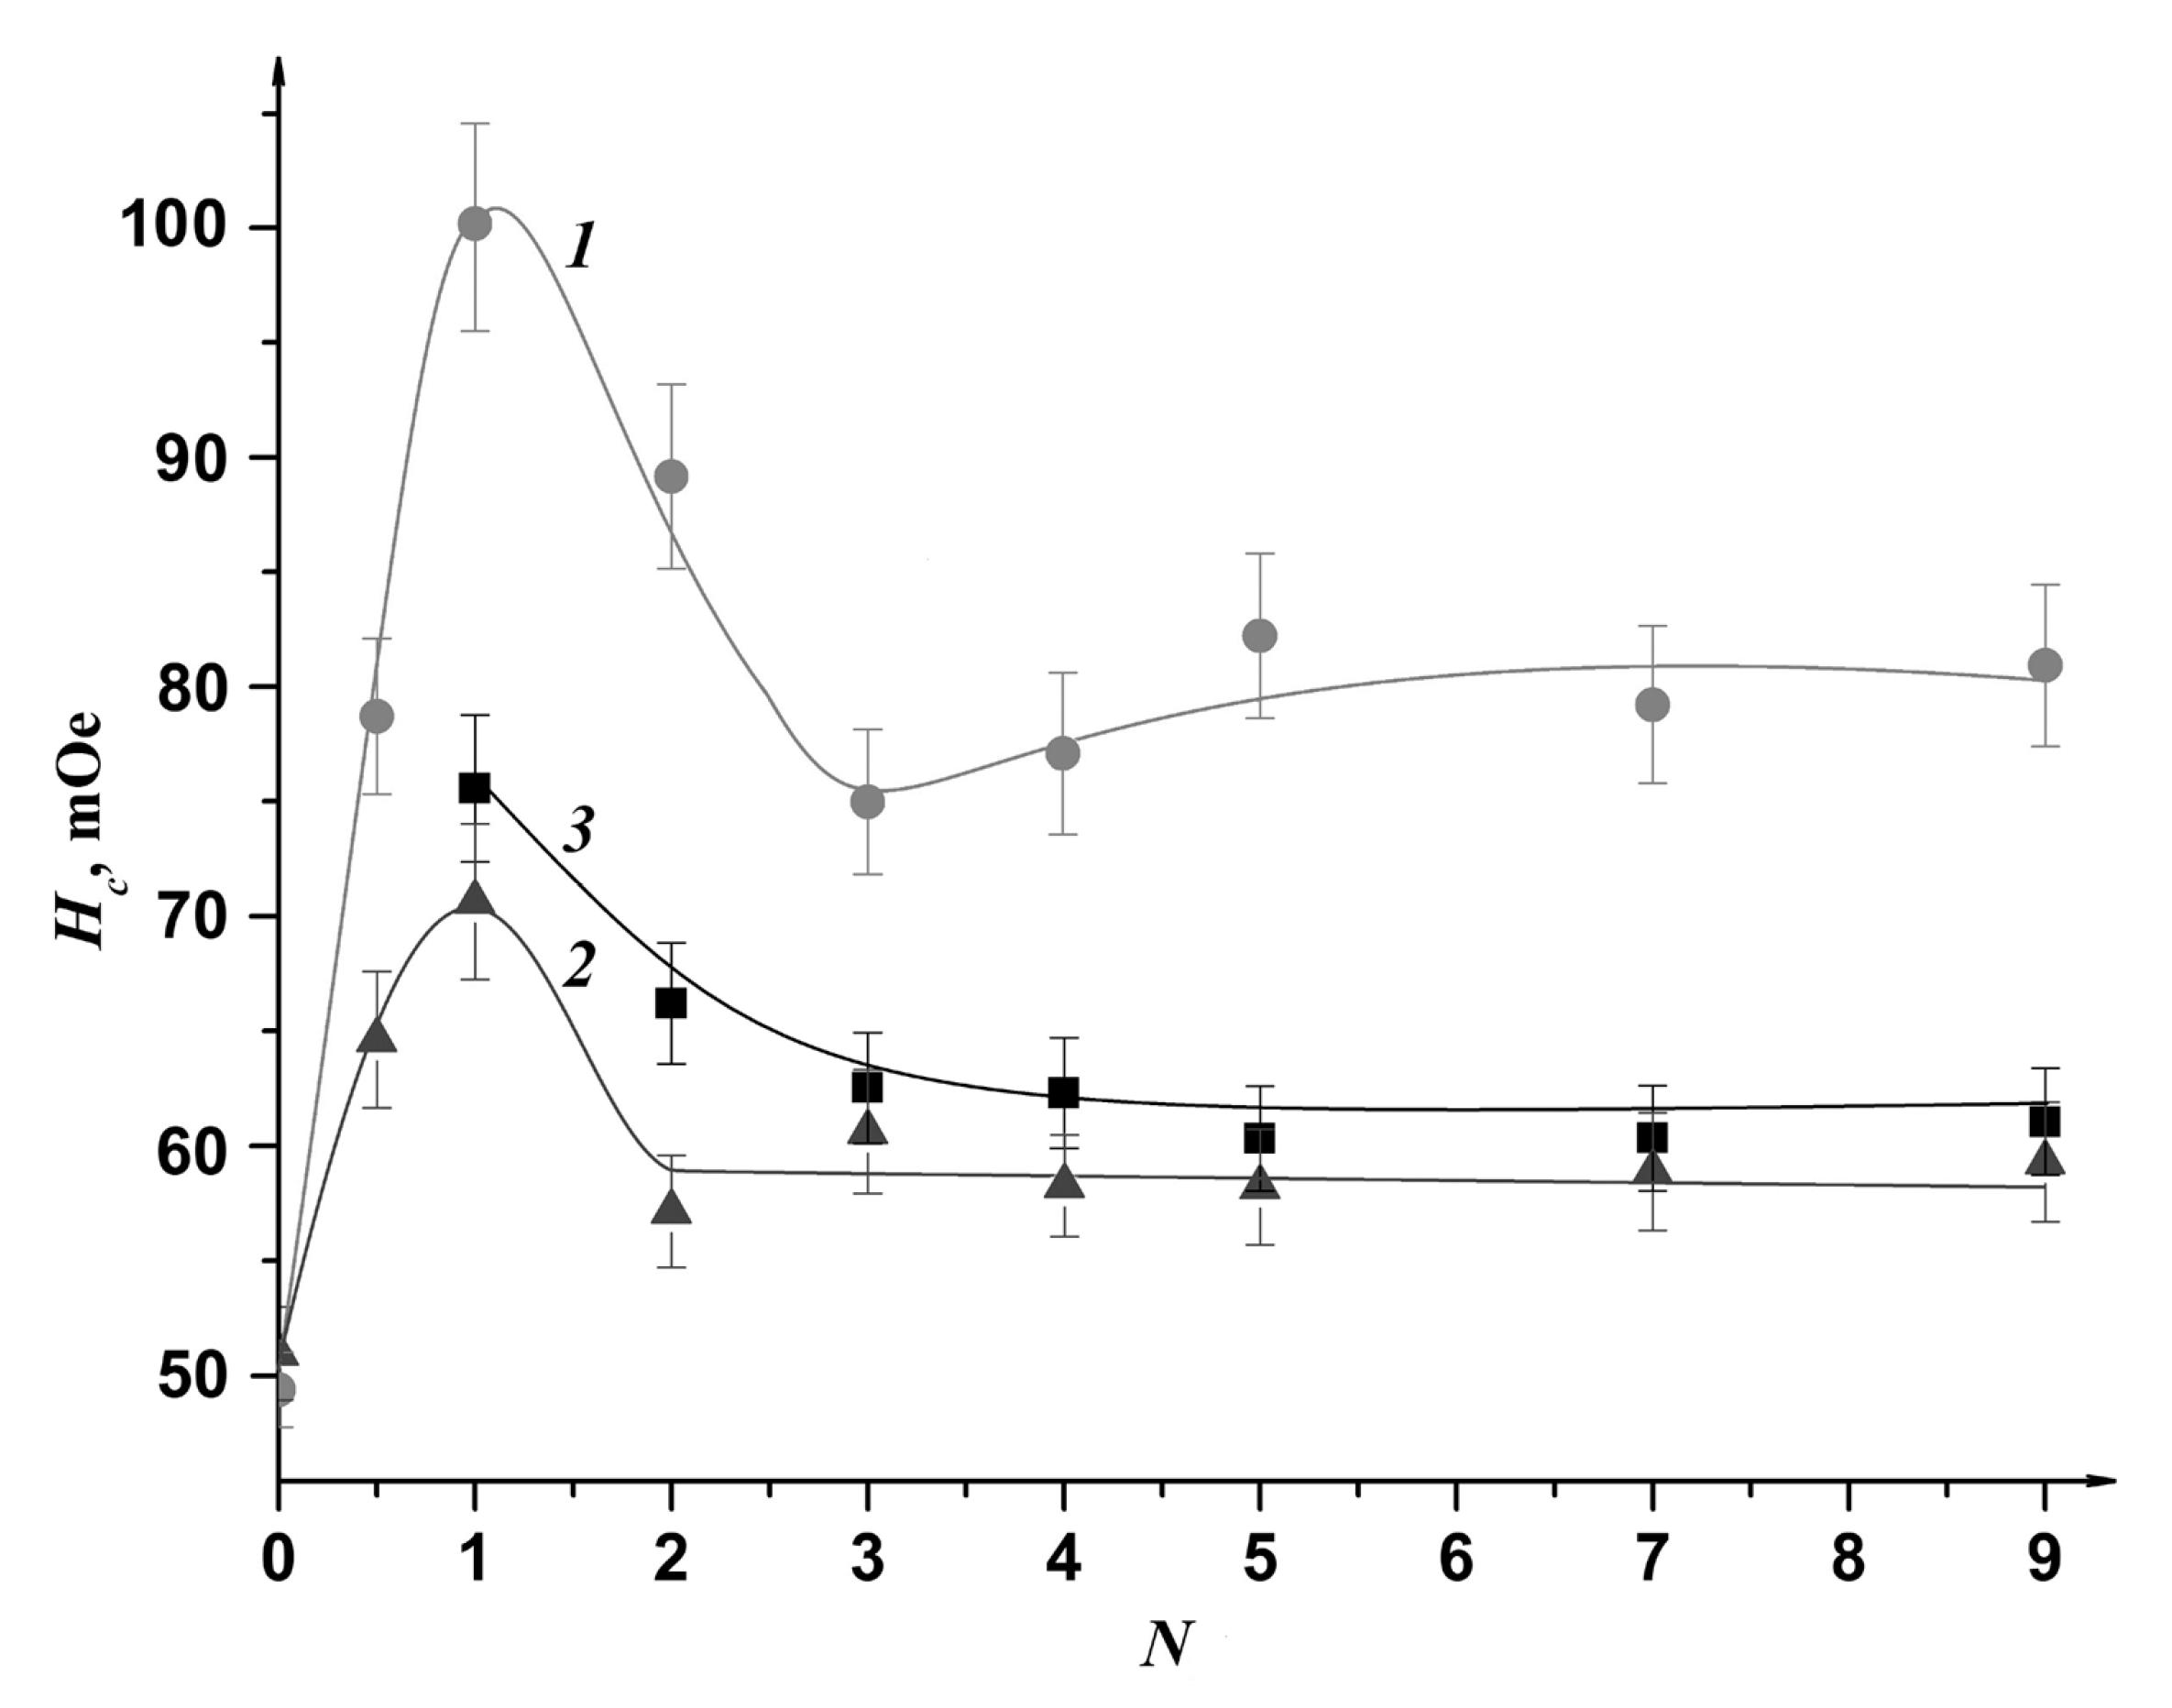
Figure 11.
Structure of the cross section of Cu-Nb composite as-fabricated by multiple pack rolling (MPR) (N = 0): bright-field scanning transmission electron microscopy (BF-STEM) image (a), energy dispersive X-ray spectroscopy (EDS) mapping (b).
Figure 11.
Structure of the cross section of Cu-Nb composite as-fabricated by multiple pack rolling (MPR) (N = 0): bright-field scanning transmission electron microscopy (BF-STEM) image (a), energy dispersive X-ray spectroscopy (EDS) mapping (b).
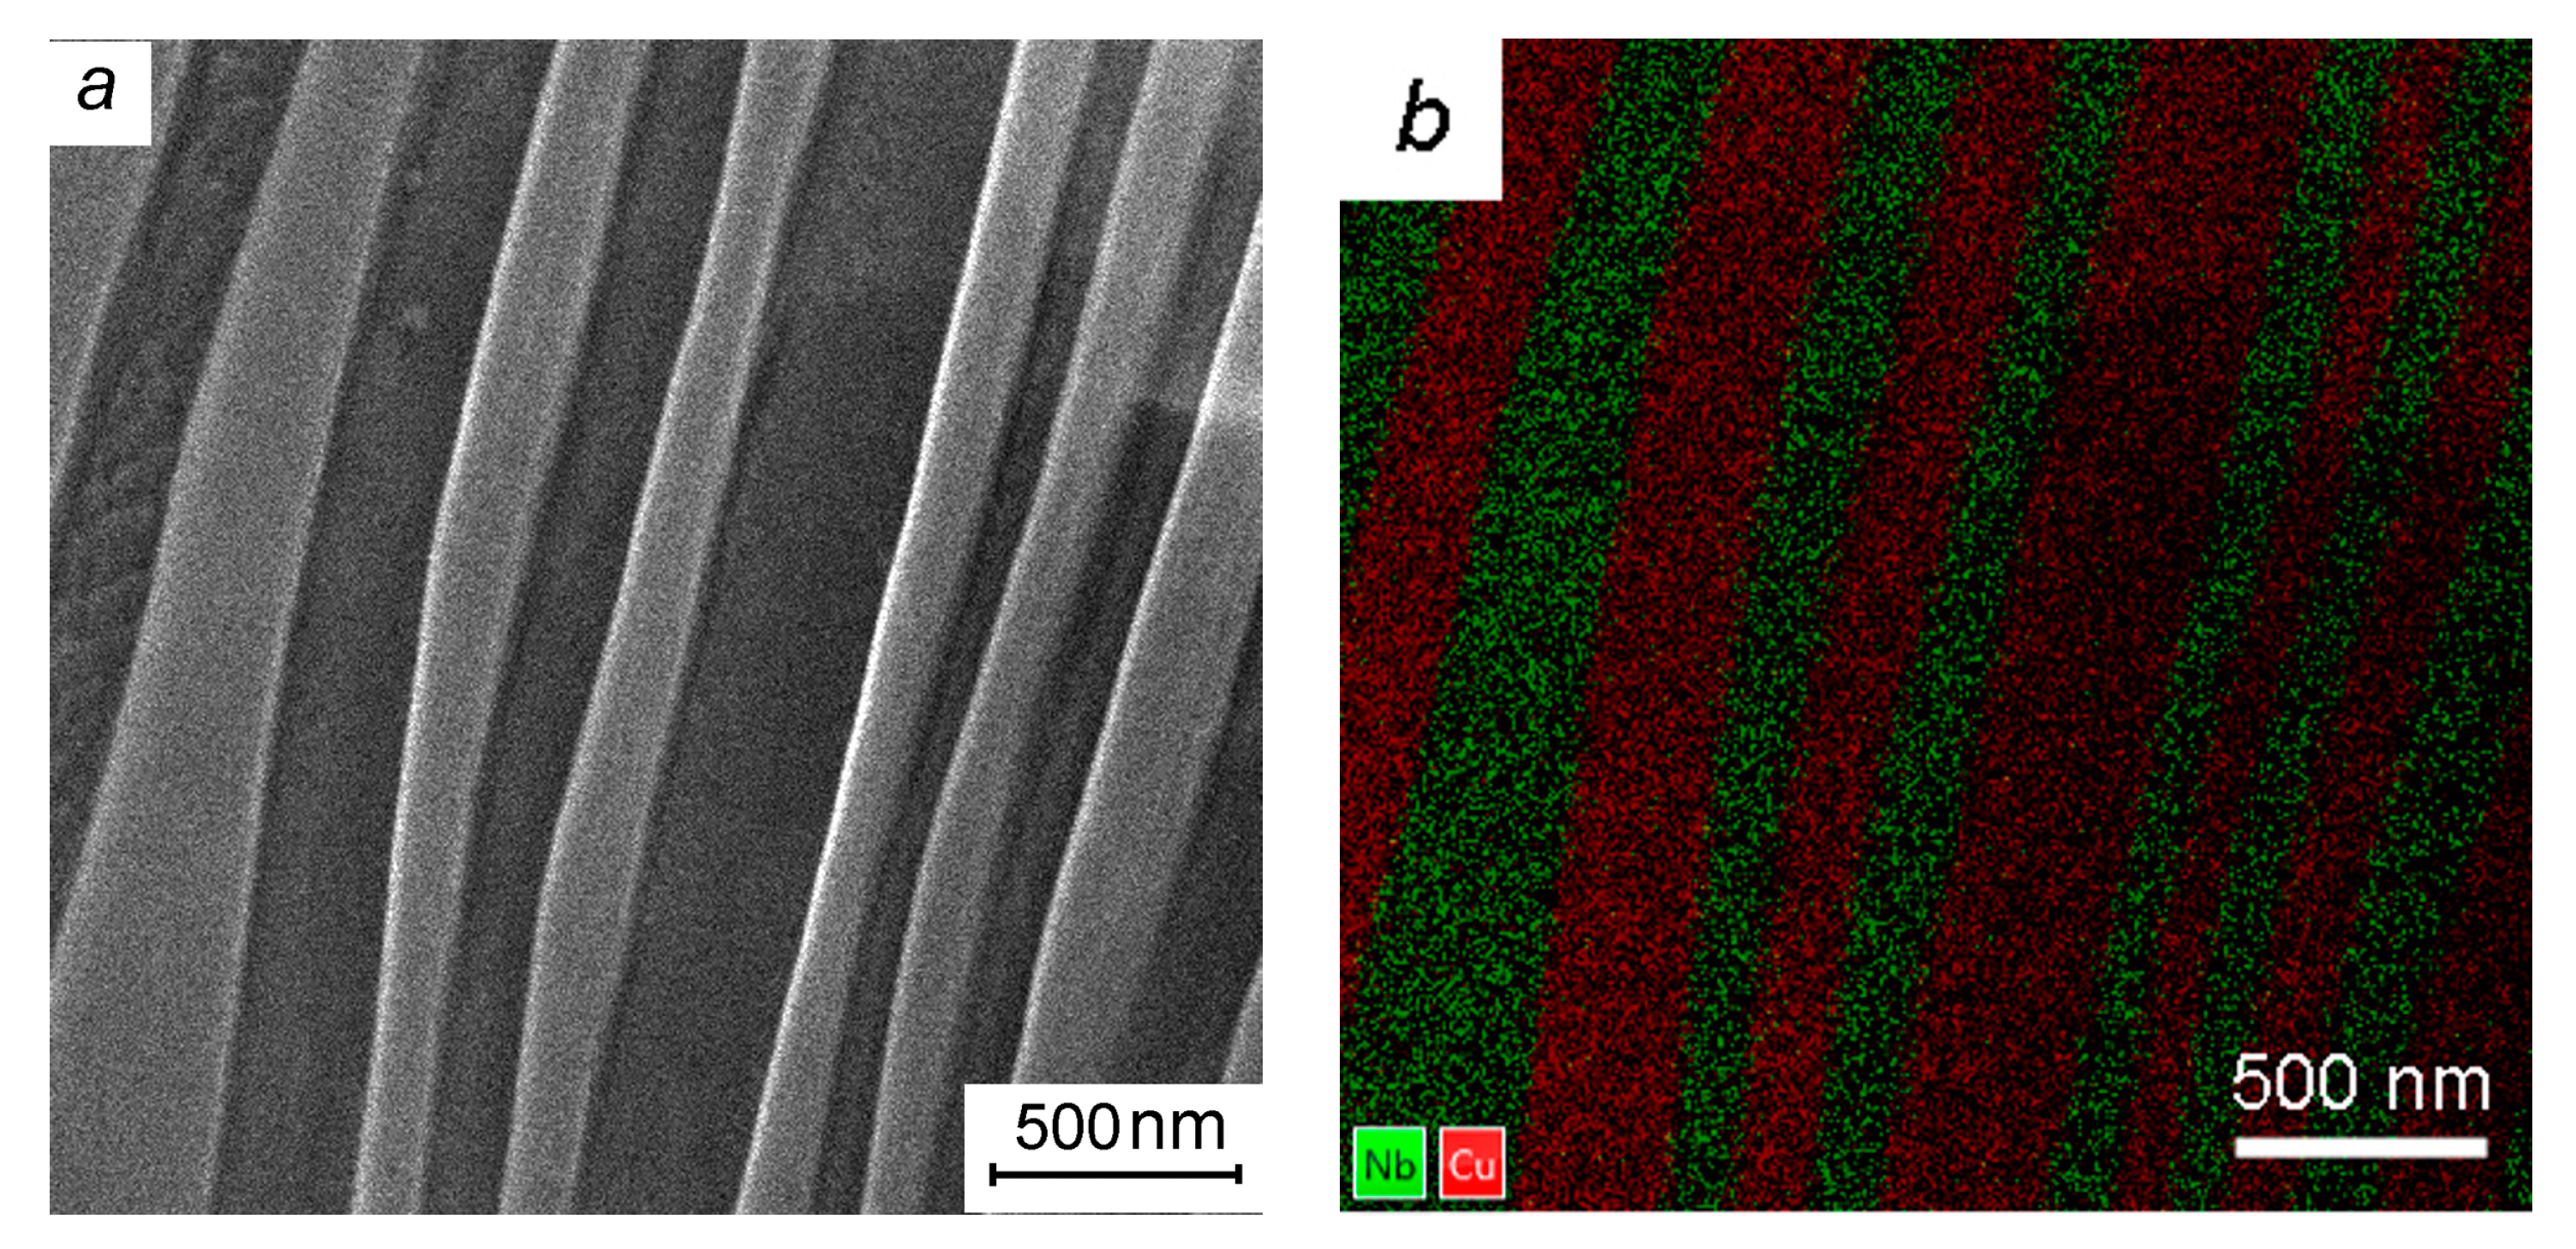
Figure 12.
Planar microstructure of Cu-Nb nanolaminate subjected to HPT: N = 2, bright-field TEM image (a); N = 4, dark-field TEM image (b).
Figure 12.
Planar microstructure of Cu-Nb nanolaminate subjected to HPT: N = 2, bright-field TEM image (a); N = 4, dark-field TEM image (b).

Figure 13.
HR TEM images of the structure of Cu-Nb nanolaminate after HPT to N = 4 (a,b,c) and fast Fourier transform (FFT) diffractograms (d) of the outlined areas 1–8 of (a),(b), respectively.
Figure 13.
HR TEM images of the structure of Cu-Nb nanolaminate after HPT to N = 4 (a,b,c) and fast Fourier transform (FFT) diffractograms (d) of the outlined areas 1–8 of (a),(b), respectively.
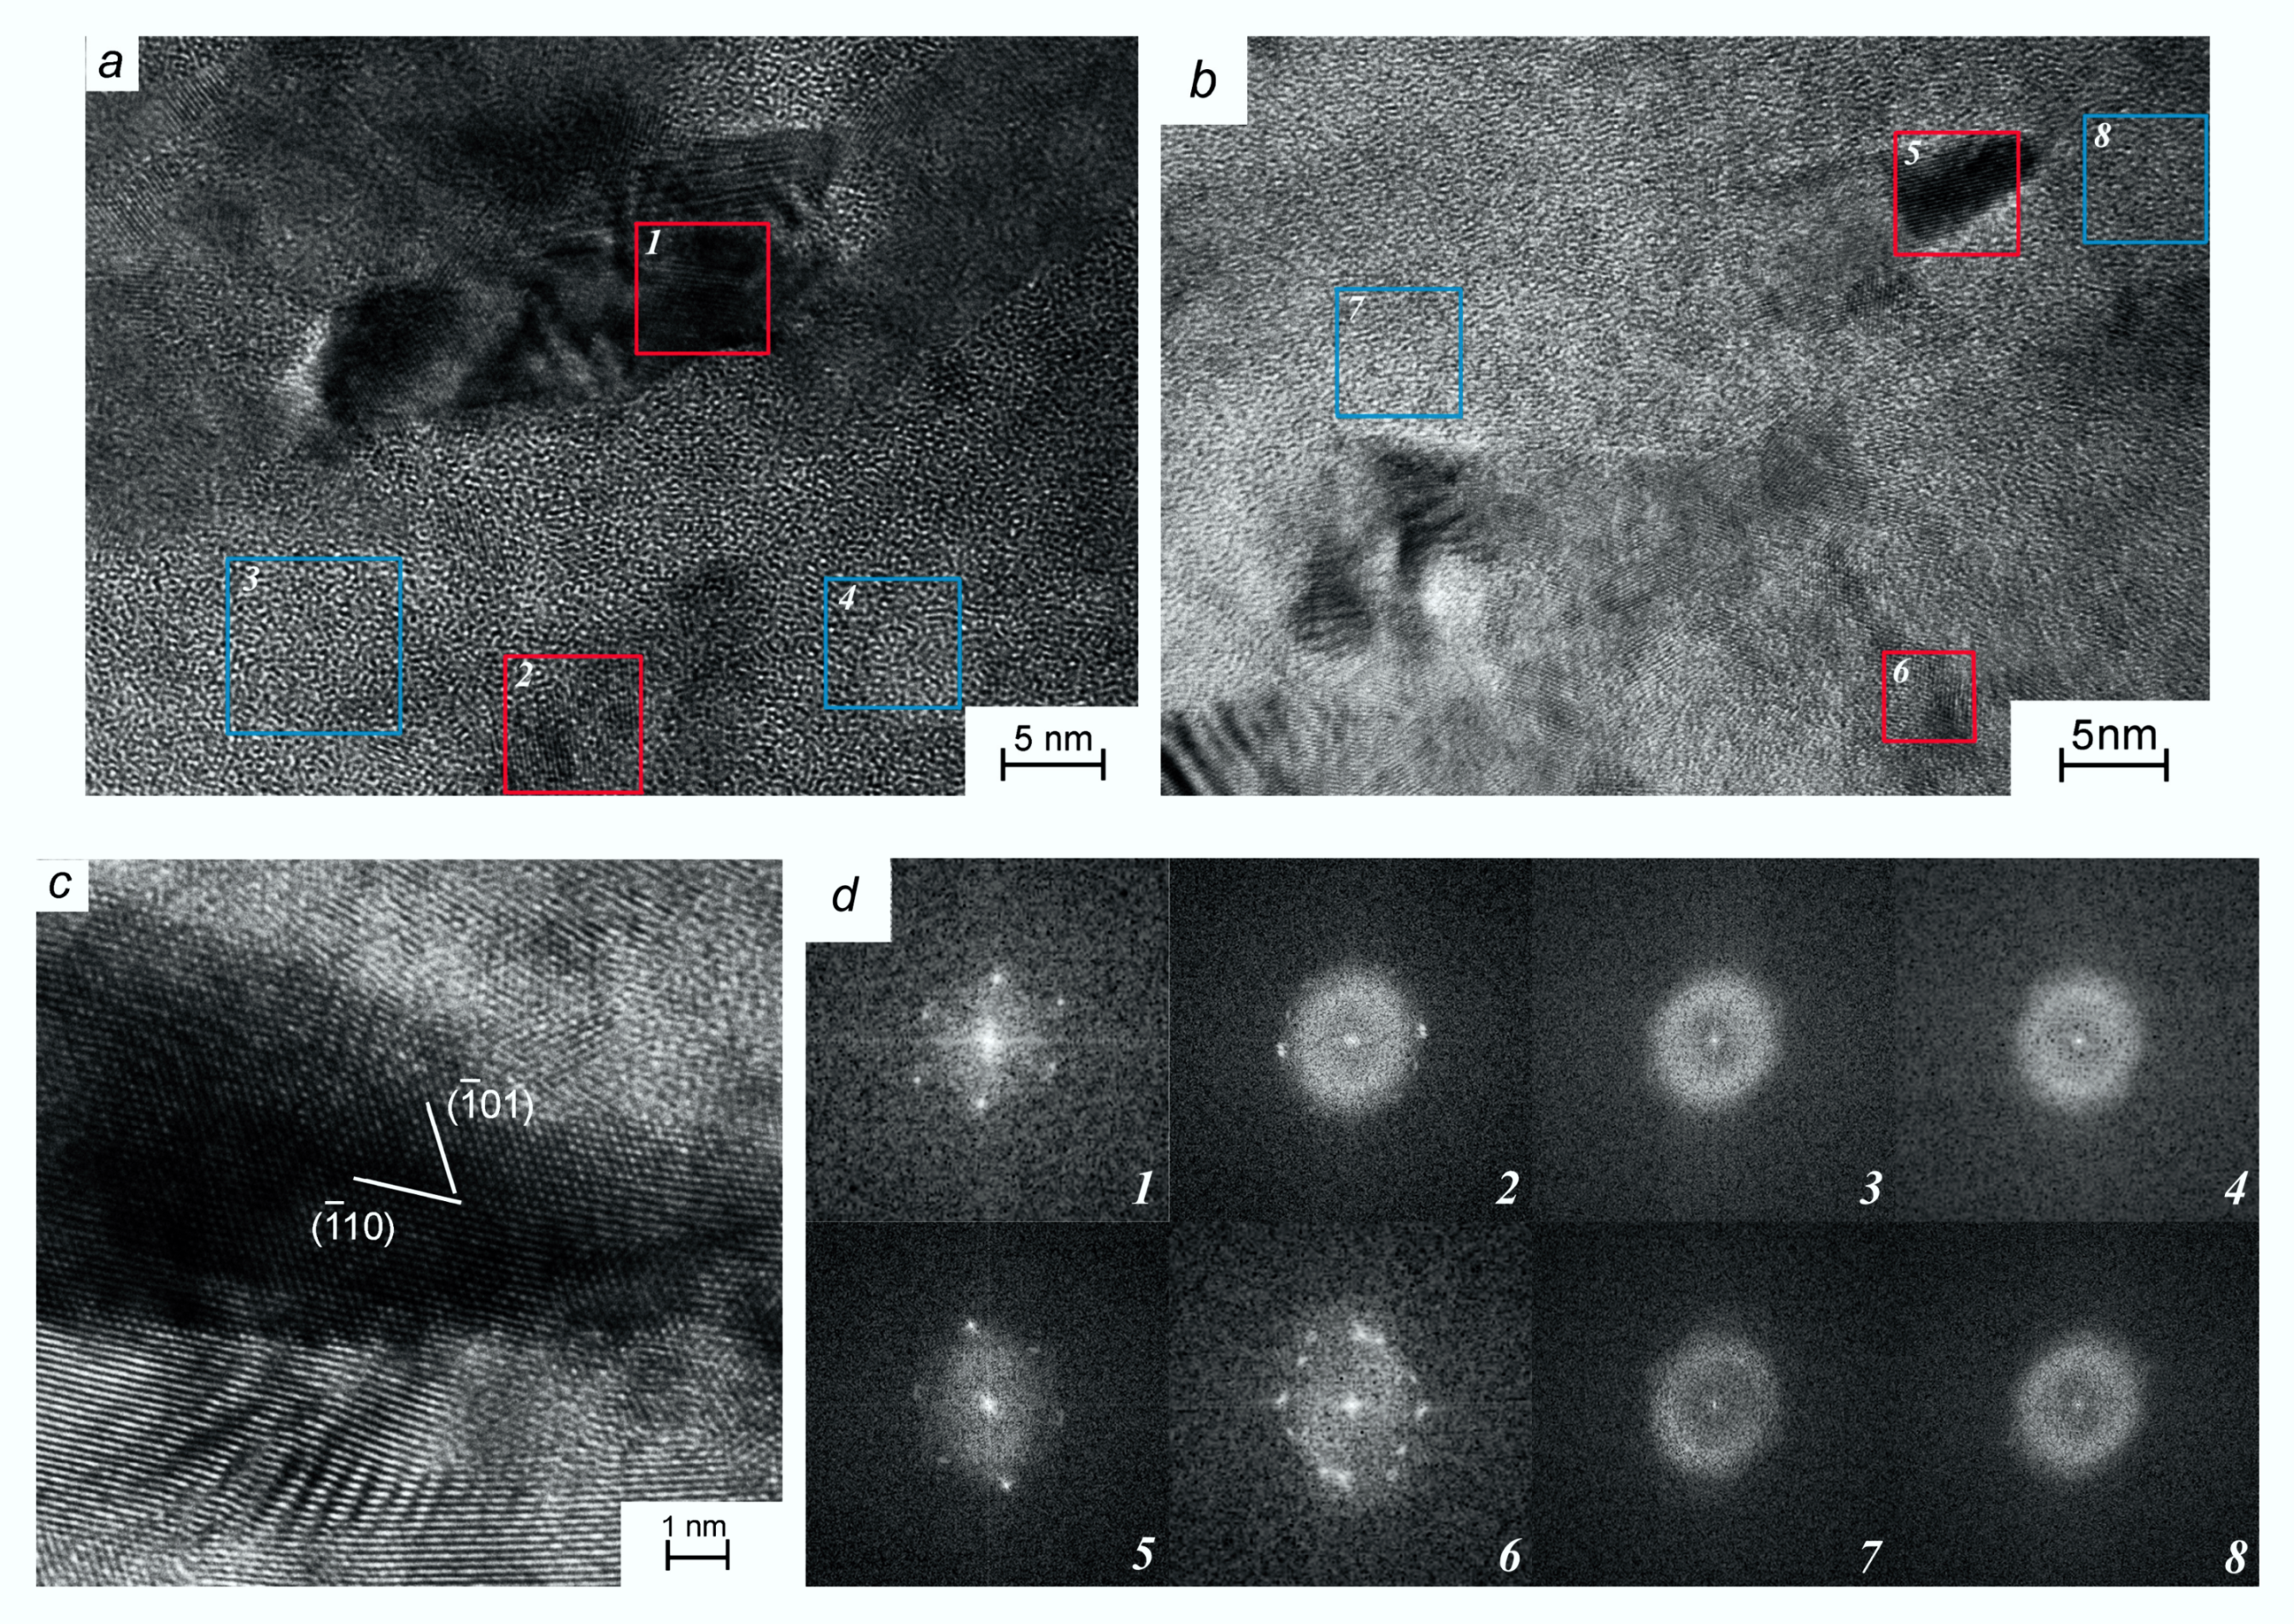
Figure 14.
BF-STEM image (a) of the sample deformed by HPT to N = 4 and X-ray element distribution maps: copper (b), niobium (c), superposition of Cu and Nb (d).
Figure 14.
BF-STEM image (a) of the sample deformed by HPT to N = 4 and X-ray element distribution maps: copper (b), niobium (c), superposition of Cu and Nb (d).
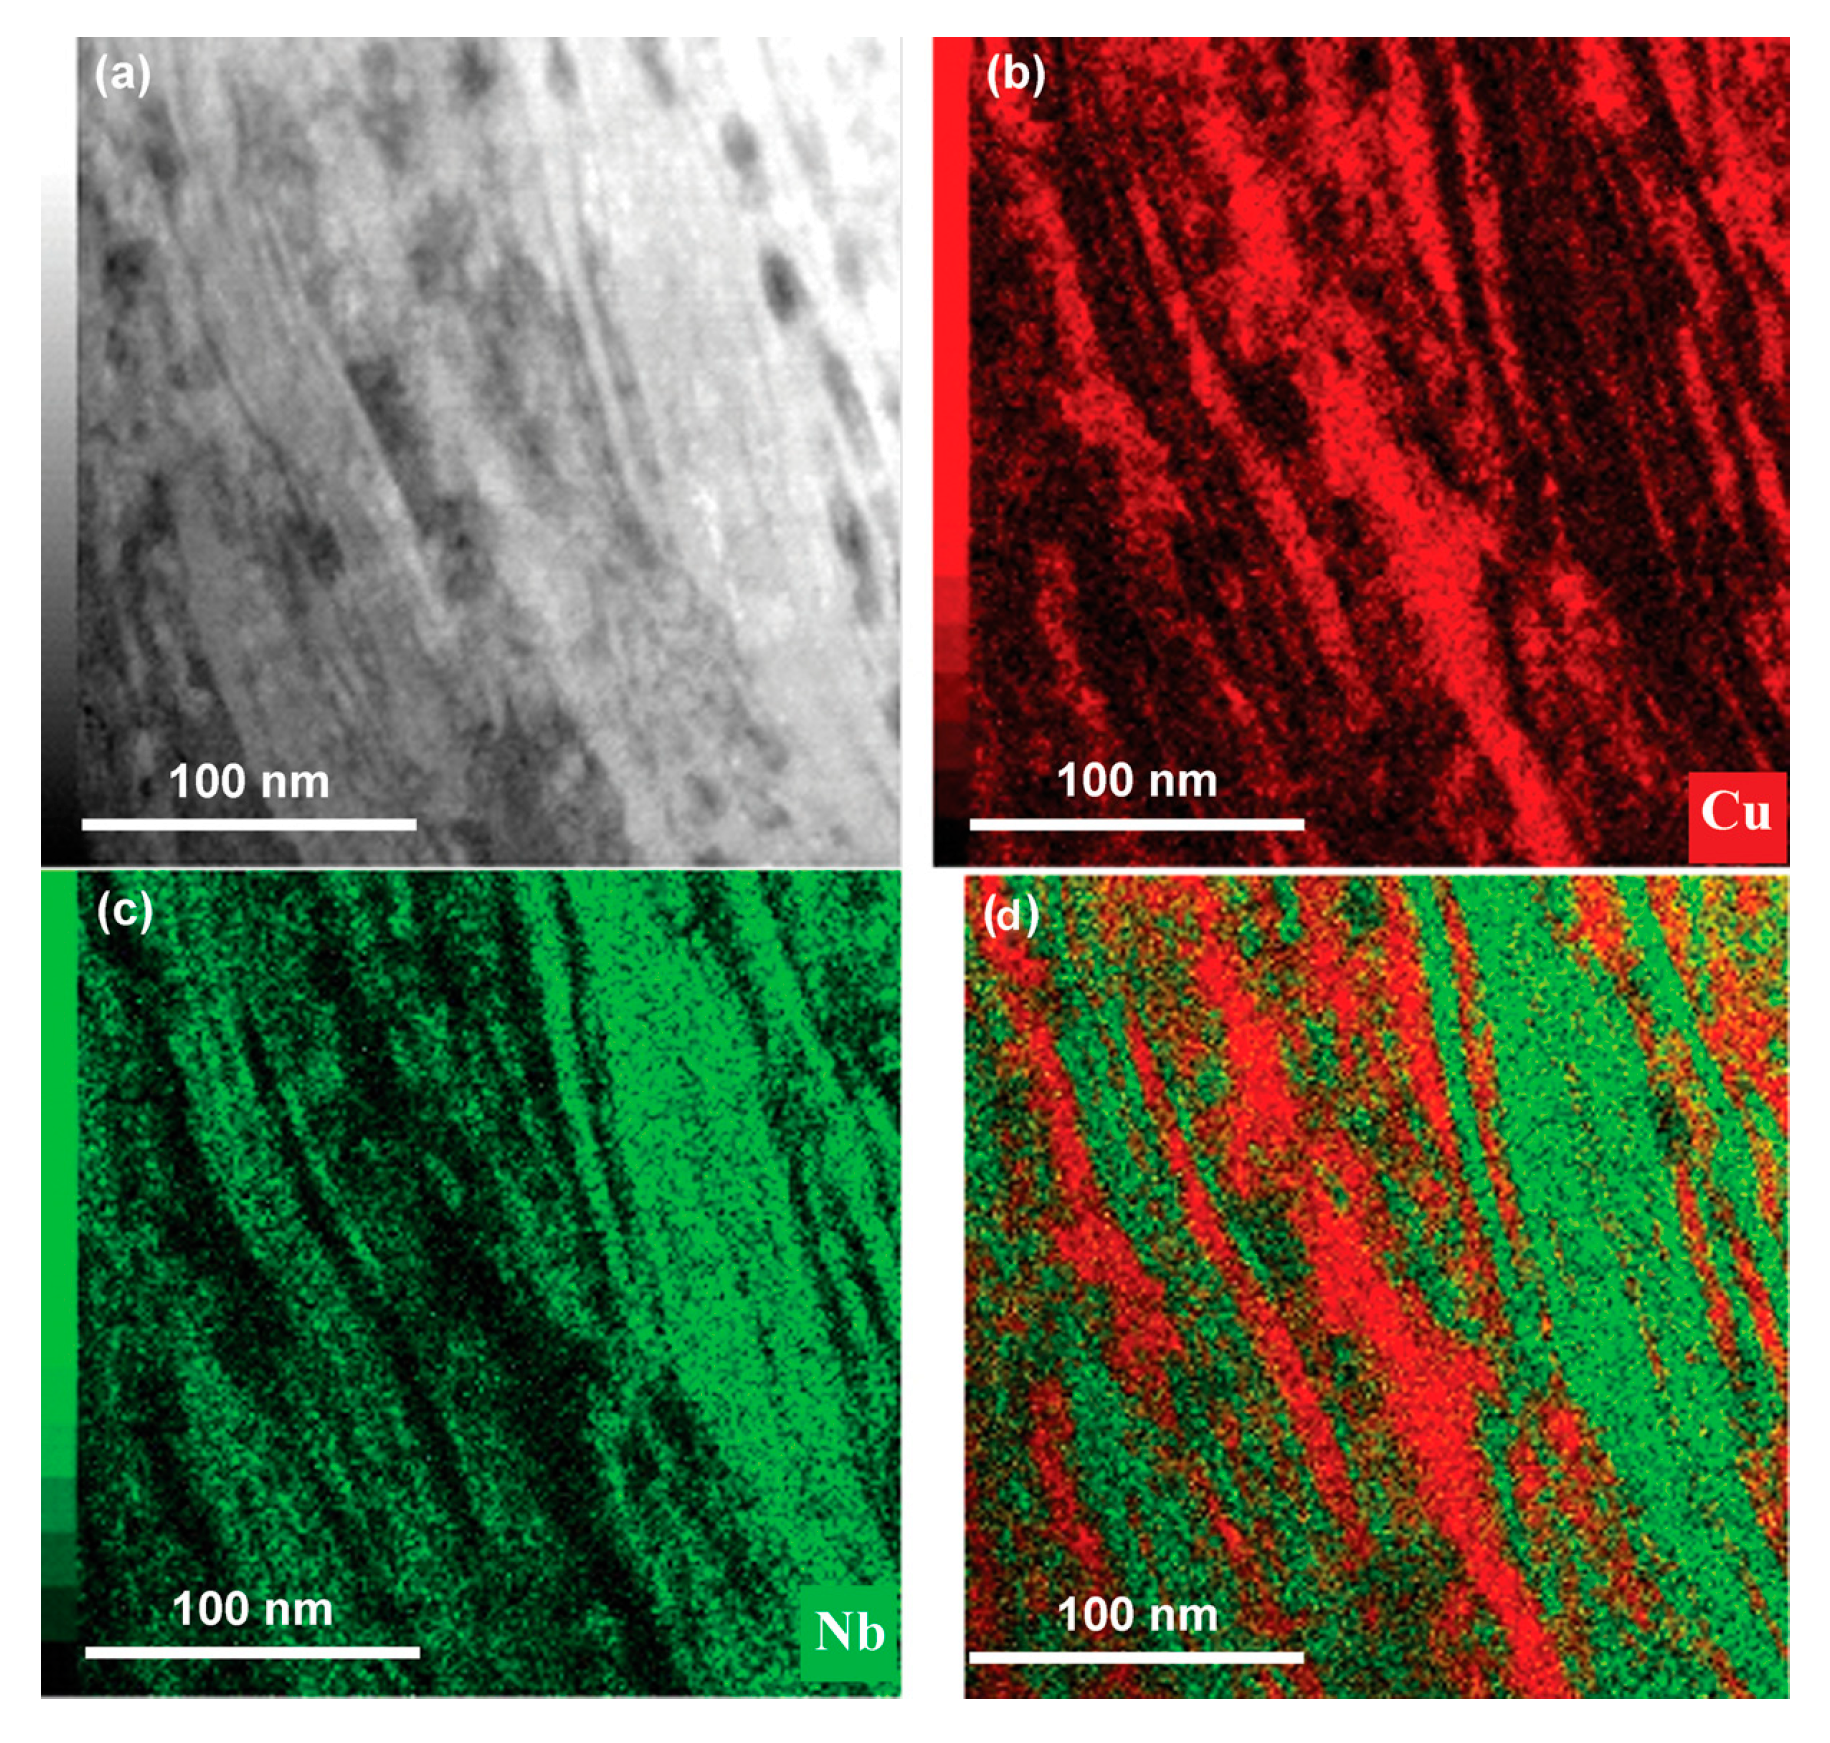
Figure 15.
Fragment of the map of element distribution in the sample after HPT to N = 6: Cu and Nb are displayed in red and green colors, respectively.
Figure 15.
Fragment of the map of element distribution in the sample after HPT to N = 6: Cu and Nb are displayed in red and green colors, respectively.
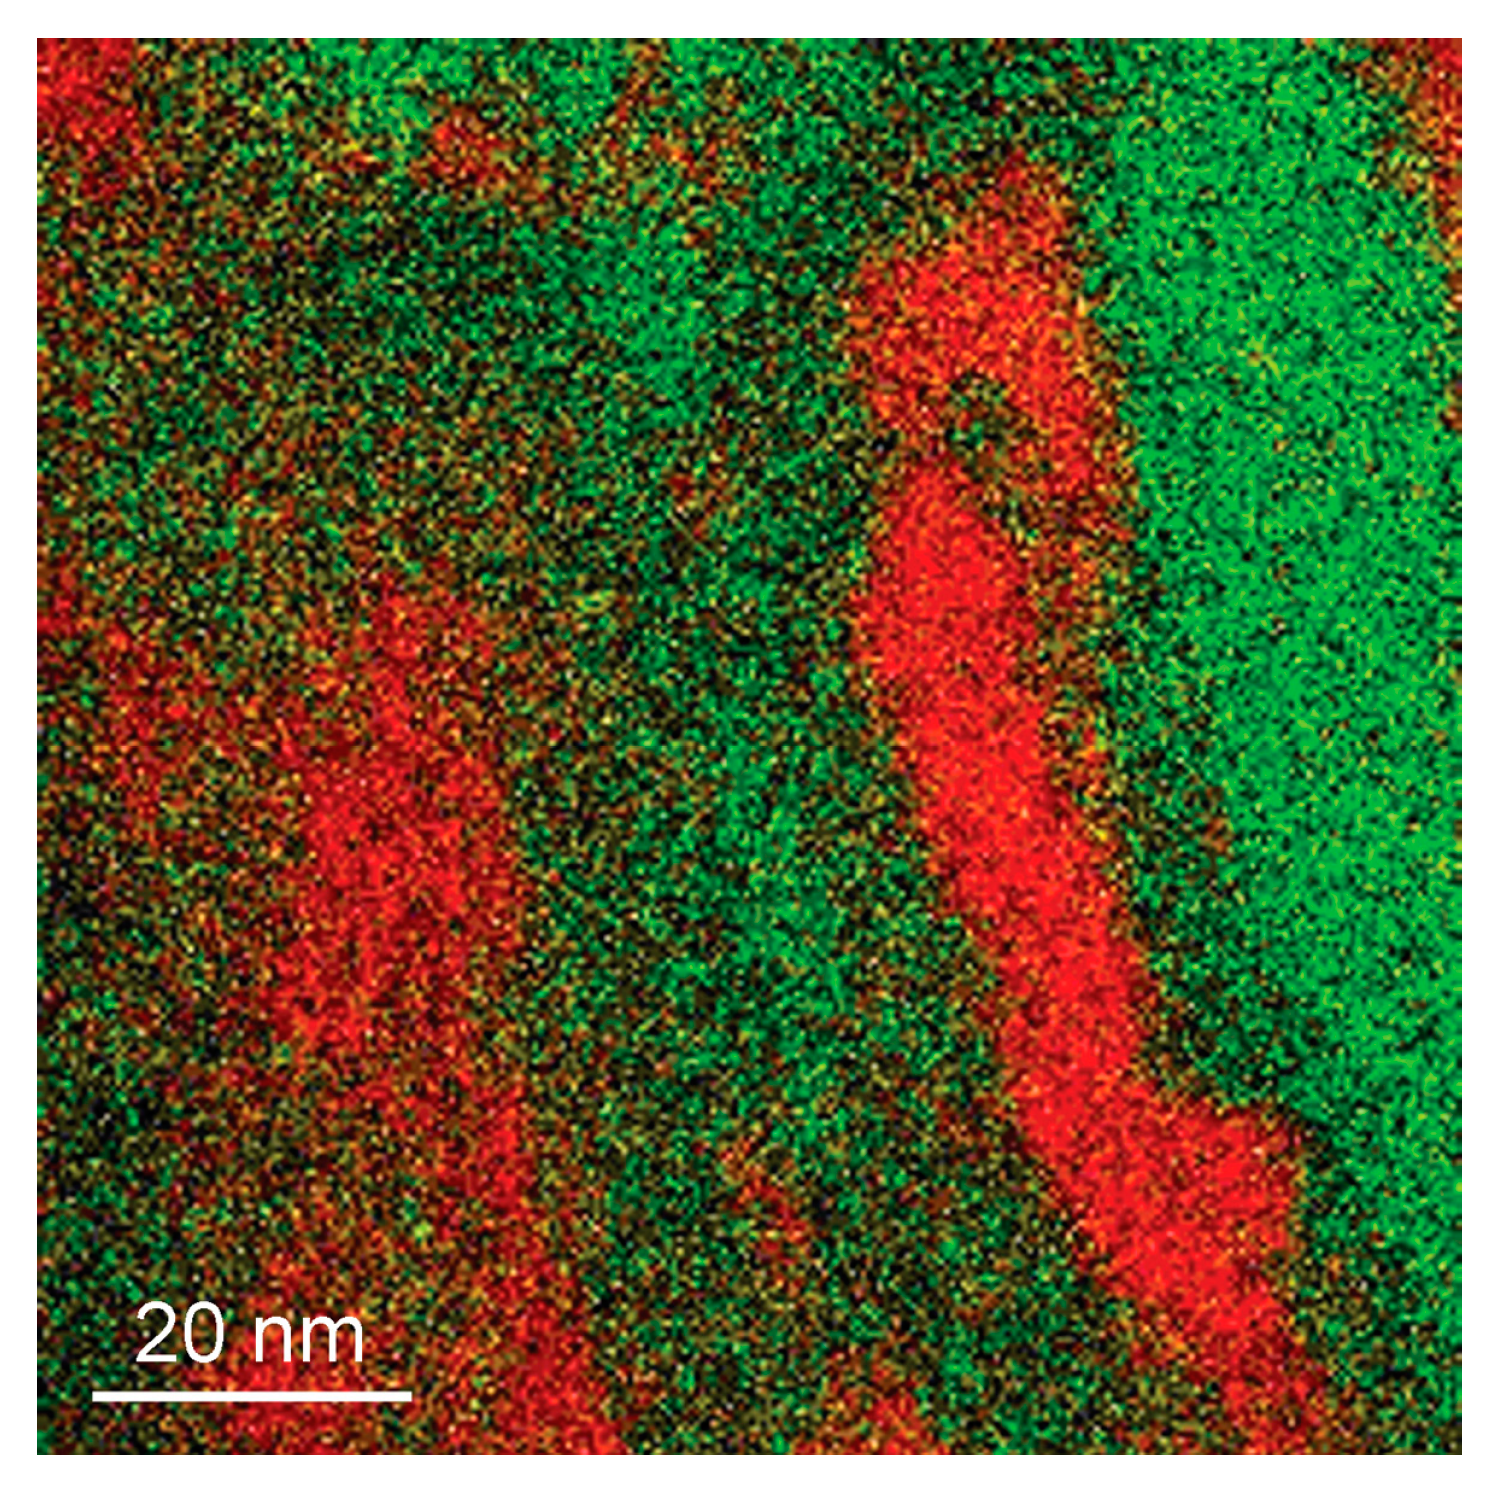
Figure 16.
XRD spectra of the initial Cu-Nb nanolaminate 1–N = 0 and after HPT to 2–N = 2 and 3–N = 4: (a) plane of sample, (b) end face of sample.
Figure 16.
XRD spectra of the initial Cu-Nb nanolaminate 1–N = 0 and after HPT to 2–N = 2 and 3–N = 4: (a) plane of sample, (b) end face of sample.
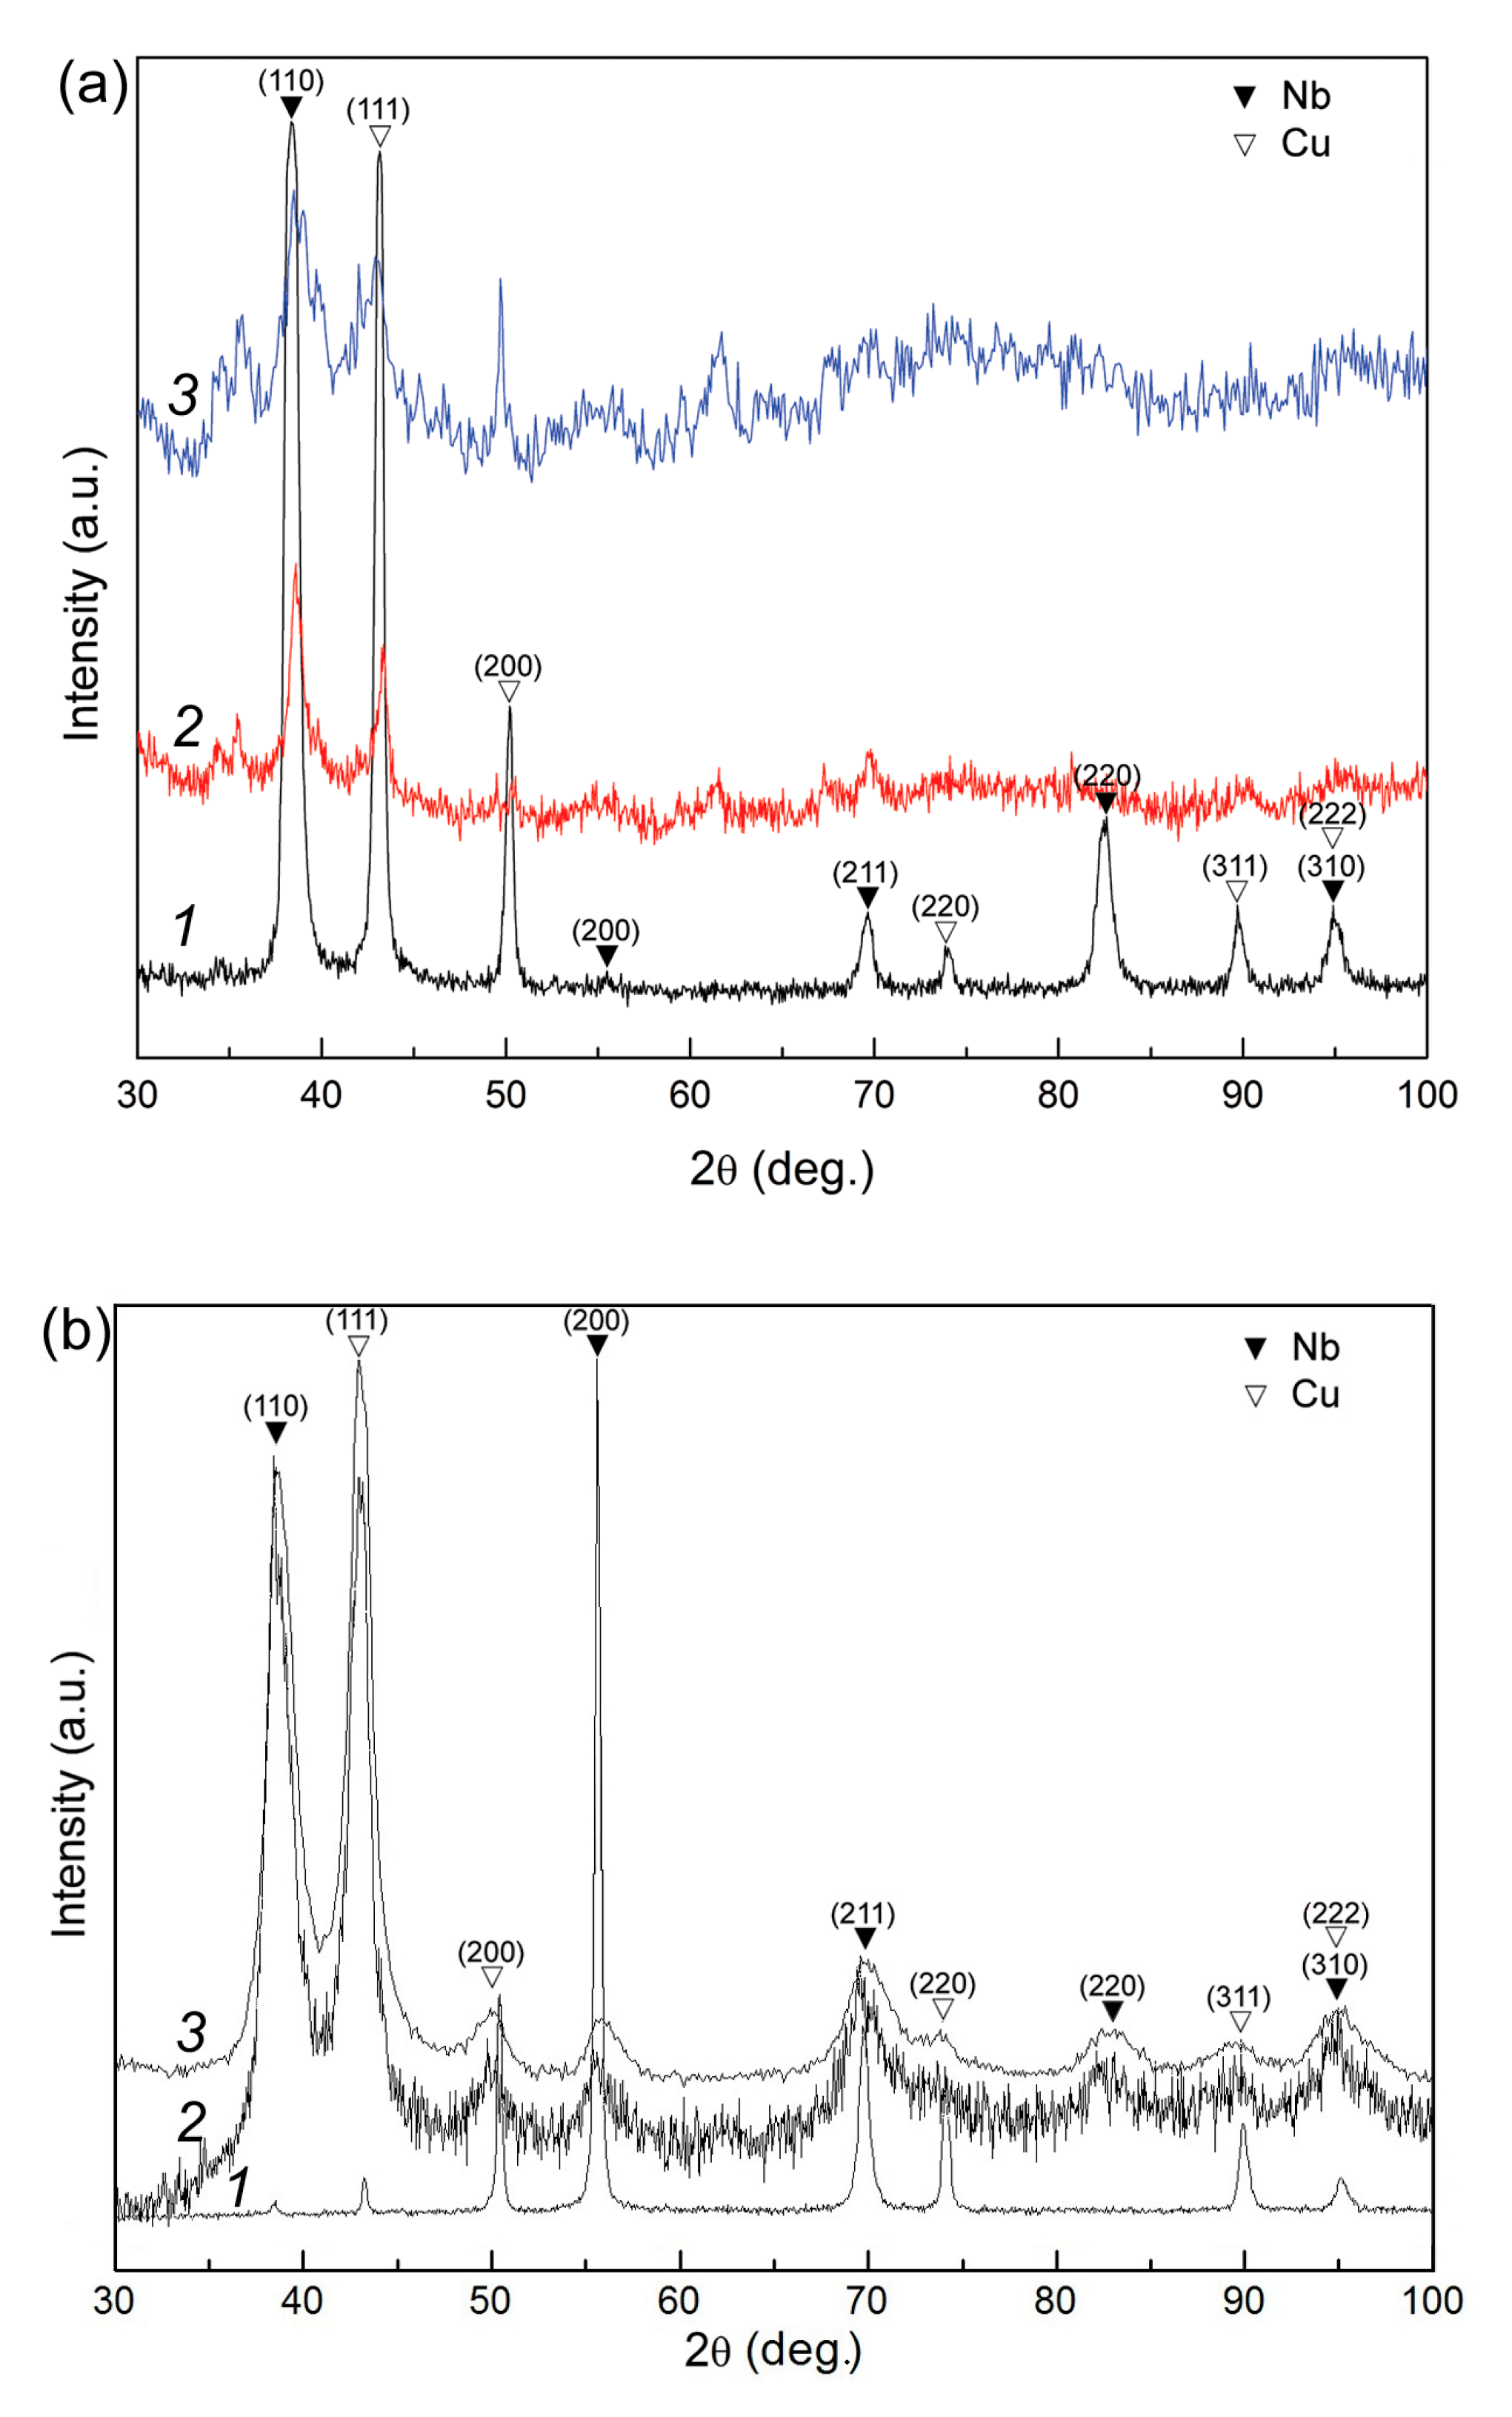
Figure 17.
Behavior of microhardness HV of the Cu-Nb nanocomposites in three mutually orthogonal directions as a function of the degree of deformation: before HPT at N = 0 (a); after HPT to N = 2 (b) and N = 4 (c), respectively.
Figure 17.
Behavior of microhardness HV of the Cu-Nb nanocomposites in three mutually orthogonal directions as a function of the degree of deformation: before HPT at N = 0 (a); after HPT to N = 2 (b) and N = 4 (c), respectively.

Table 1.
Geometric parameters of Cu-Nb nanolaminates befor and after HPT, calculated logarithmic true strain.
Table 1.
Geometric parameters of Cu-Nb nanolaminates befor and after HPT, calculated logarithmic true strain.
| Layer Thickness, nm | Number of Full Revolutions | Logarithmic True Strain, e |
|---|---|---|
| 200 | 0 | - |
| 180 | 1/2 | 4.61 |
| 130 | 1 | 5.42 |
| 100 | 2 | 6.33 |
| 50 | 3 | 6.54 |
| 20 | 4 | 6.83 |
© 2020 by the authors. Licensee MDPI, Basel, Switzerland. This article is an open access article distributed under the terms and conditions of the Creative Commons Attribution (CC BY) license (http://creativecommons.org/licenses/by/4.0/).
Share and Cite
MDPI and ACS Style
Permyakova, I.; Glezer, A. Amorphous-Nanocrystalline Composites Prepared by High-Pressure Torsion. Metals 2020, 10, 511. https://doi.org/10.3390/met10040511
AMA Style
Permyakova I, Glezer A. Amorphous-Nanocrystalline Composites Prepared by High-Pressure Torsion. Metals. 2020; 10(4):511. https://doi.org/10.3390/met10040511
Chicago/Turabian StylePermyakova, Inga, and Alex Glezer. 2020. "Amorphous-Nanocrystalline Composites Prepared by High-Pressure Torsion" Metals 10, no. 4: 511. https://doi.org/10.3390/met10040511
Note that from the first issue of 2016, this journal uses article numbers instead of page numbers. See further details here.